Lutein and Zeaxanthin Are Positively Associated with Visual–Spatial Functioning in Older Adults: An fMRI Study

 and
and
Abstract
:1. Introduction
2. Materials and Methods
2.1. Subjects
2.2. Ethics
2.3. Methods
2.3.1. Visual Acuity
2.3.2. Judgment of Line Orientation (JLO) Task
2.3.3. Macular Pigment Optical Density (MPOD)
2.3.4. Serum Lutein and Zeaxanthin (Serum L & Z)
2.3.5. Neuroimaging Acquisition
2.3.6. Data Analysis
3. Results
3.1. JLO Behavioral Performance
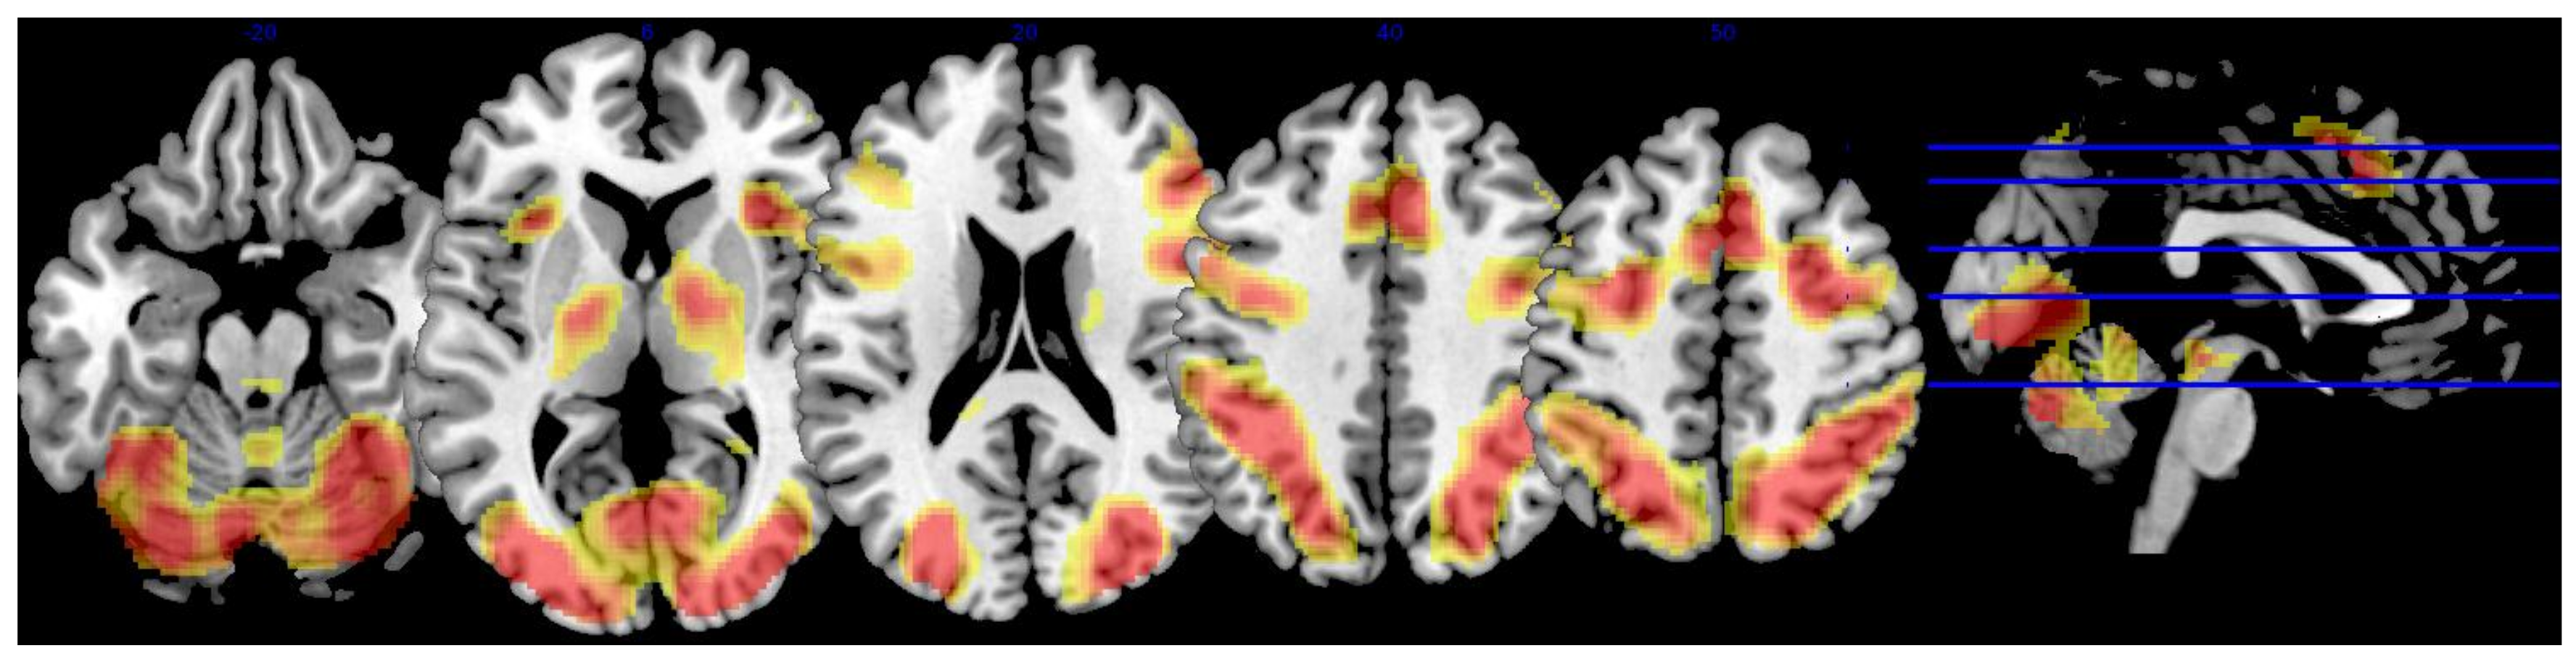
3.2. Whole-Brain Analysis
3.3. Lutein and Zeaxanthin Analysis
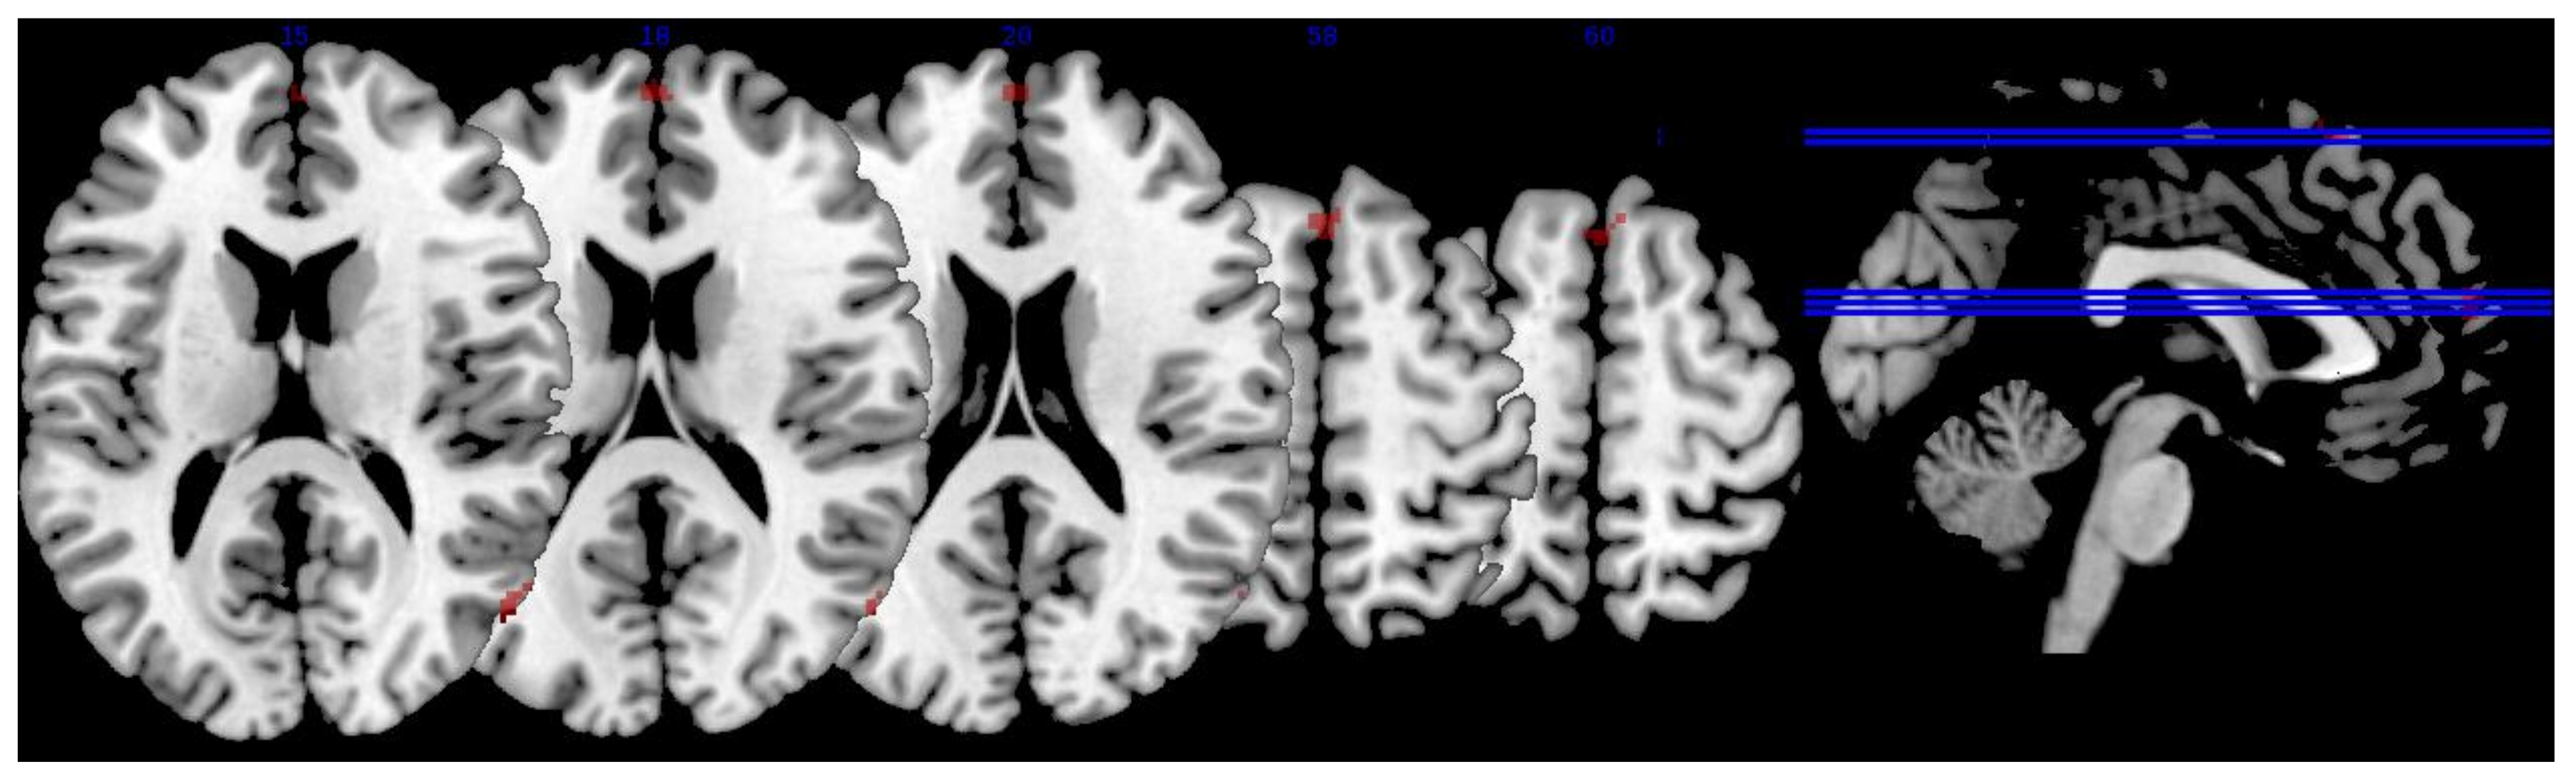
3.3.1. MPOD
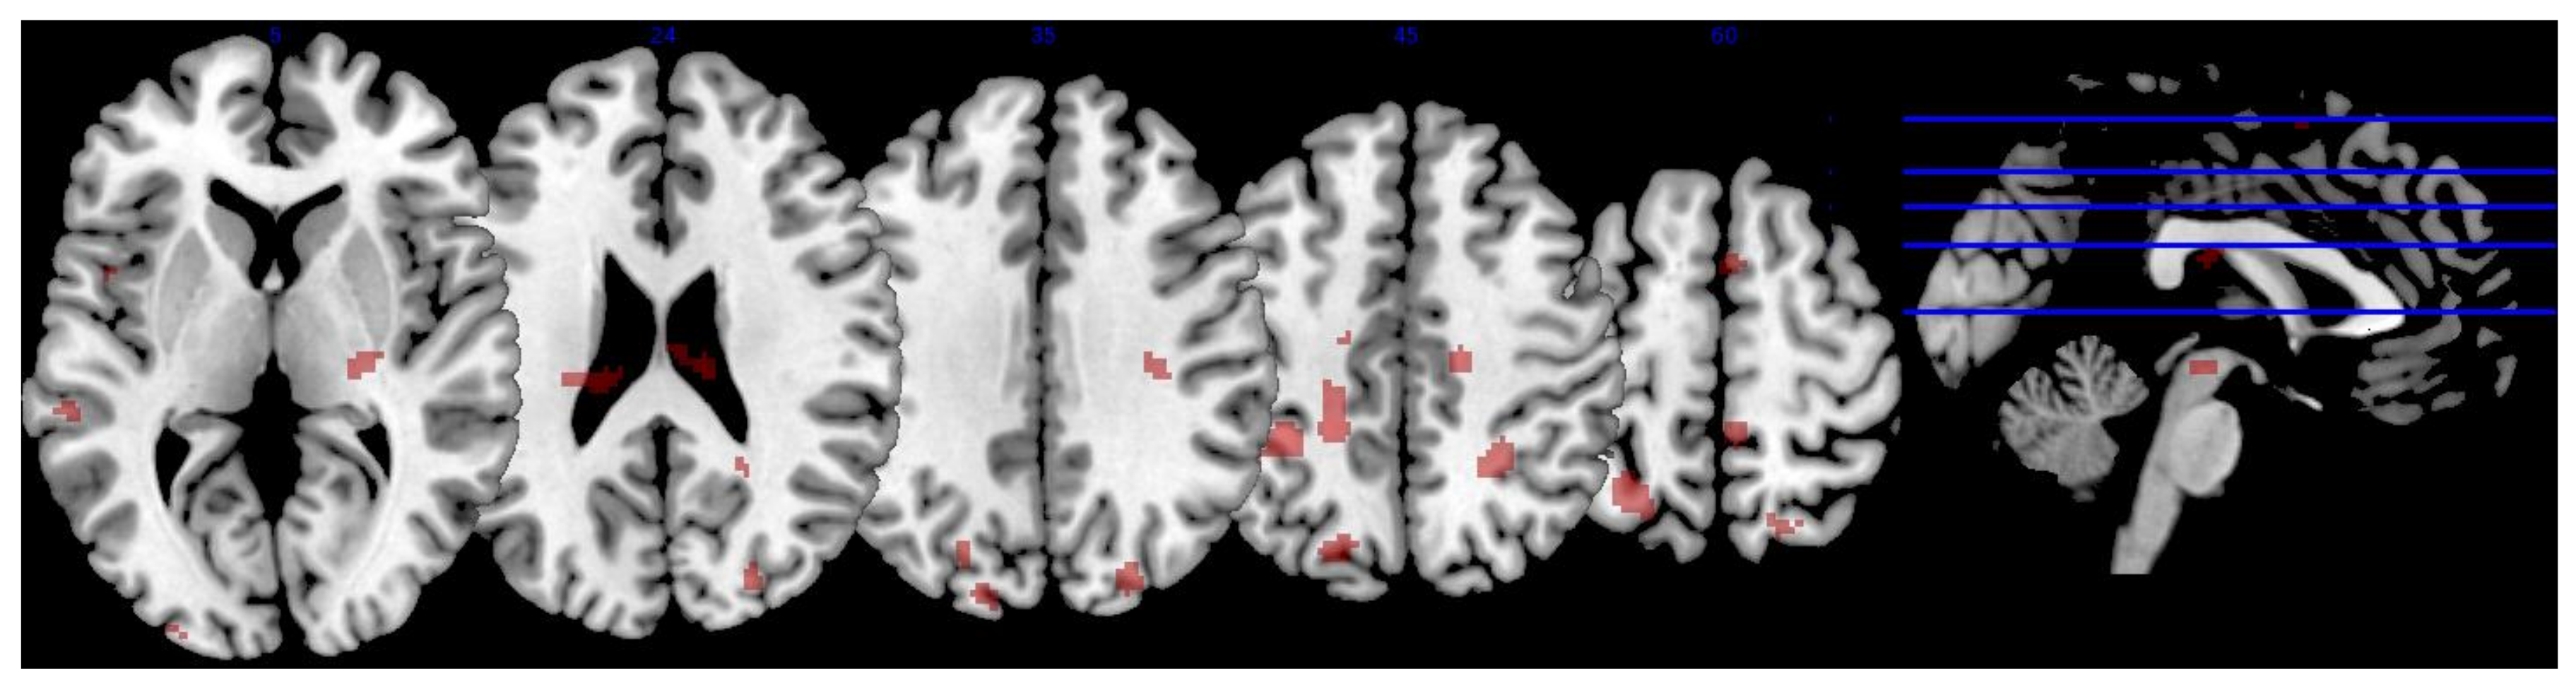
3.3.2. Serum L & Z
4. Discussion
Acknowledgments
Author Contributions
Conflicts of Interest
Registry Information
References
- Caracciolo, B.; Xu, W.; Collins, S.; Fratiglioni, L. Cognitive decline, dietary factors and gut–brain interactions. Mech. Ageing Dev. 2014, 136, 59–69. [Google Scholar] [CrossRef] [PubMed]
- Johnson, E.J. Role of lutein and zeaxanthin in visual and cognitive function throughout the lifespan. Nutr. Rev. 2014, 72, 605–612. [Google Scholar] [CrossRef] [PubMed]
- Craft, N.E.; Haitema, T.B.; Garnett, K.M.; Fitch, K.A.; Dorey, C.K. Carotenoid, tocopherol, and retinol concentrations in elderly human brain. Exp. Anim. 2004, 21, 22. [Google Scholar]
- Johnson, E.J.; Vishwanathan, R.; Johnson, M.A.; Hausman, D.B.; Davey, A.; Scott, T.M.; Green, R.C.; Miller, L.S.; Gearing, M.; Woodard, J.; et al. Relationship between serum and brain carotenoids,-tocopherol, and retinol concentrations and cognitive performance in the oldest old from the Georgia Centenarian Study. J. Aging Res. 2013, 2013. [Google Scholar] [CrossRef] [PubMed]
- Vishwanathan, R.; Neuringer, M.; Snodderly, D.M.; Schalch, W.; Johnson, E.J. Macular lutein and zeaxanthin are related to brain lutein and zeaxanthin in primates. Nutr. Neurosci. 2013, 16, 21–29. [Google Scholar] [CrossRef] [PubMed]
- Ma, L.; Lin, X.-M. Effects of lutein and zeaxanthin on aspects of eye health. J. Sci. Food Agric. 2010, 90, 2–12. [Google Scholar] [CrossRef] [PubMed]
- SanGiovanni, J.P.; Neuringer, M. The putative role of lutein and zeaxanthin as protective agents against age-related macular degeneration: Promise of molecular genetics for guiding mechanistic and translational research in the field. Am. J. Clin. Nutr. 2012, 96, 1223S–1233S. [Google Scholar] [CrossRef] [PubMed]
- Feeney, J.; Finucane, C.; Savva, G.M.; Cronin, H.; Beatty, S.; Nolan, J.M.; Kenny, R.A. Low macular pigment optical density is associated with lower cognitive performance in a large, population-based sample of older adults. Neurobiol. Aging 2013, 34, 2449–2456. [Google Scholar] [CrossRef] [PubMed]
- Renzi, L.M.; Dengler, M.J.; Puente, A.; Miller, L.S.; Hammond, B.R. Relationships between macular pigment optical density and cognitive function in unimpaired and mildly cognitively impaired older adults. Neurobiol. Aging 2014, 35, 1695–1699. [Google Scholar] [CrossRef] [PubMed]
- Renzi, L.M.; Iannaccone, A.; Johnson, E.; Kritchevsky, S. The relation between serum xanthophylls, fatty acids, macular pigment and cognitive function in the Health ABC Study. FASEB J. 2008, 22. [Google Scholar] [CrossRef]
- Vishwanathan, R.; Iannaccone, A.; Scott, T.M.; Kritchevsky, S.B.; Jennings, B.J.; Carboni, G.; Johnson, E.J. Macular pigment optical density is related to cognitive function in older people. Age Ageing 2014, 43, 271–275. [Google Scholar] [CrossRef] [PubMed]
- Power, R.; Coen, R.F.; Beatty, S.; Mulcahy, R.; Moran, R.; Stack, J.; Howard, A.N.; Nolan, J.M. Supplemental Retinal Carotenoids Enhance Memory in Healthy Individuals with Low Levels of Macular Pigment in A Randomized, Double-Blind, Placebo-Controlled Clinical Trial. J. Alzheimer’s Dis. 2018, 61, 947–961. [Google Scholar] [CrossRef] [PubMed]
- Beatty, S.; Nolan, J.; Kavanagh, H.; O’Donovan, O. Macular pigment optical density and its relationship with serum and dietary levels of lutein and zeaxanthin. Arch. Biochem. Biophys. 2004, 430, 70–76. [Google Scholar] [CrossRef] [PubMed]
- Hammond, B.R., Jr.; Wooten, B.R.; Smollon, B. Assessment of the validity of in vivo methods of measuring human macular pigment optical density. Optom. Vis. Sci. 2005, 82, 387–404. [Google Scholar] [CrossRef] [PubMed]
- Burke, J.D.; Curran-Celentano, J.; Wenzel, A.J. Diet and serum carotenoid concentrations affect macular pigment optical density in adults 45 years and older. J. Nutr. 2005, 135, 1208–1214. [Google Scholar] [CrossRef] [PubMed]
- Renzi, L.M.; Hammond, B.R.; Dengler, M.; Roberts, R. The relation between serum lipids and lutein and zeaxanthin in the serum and retina: Results from cross-sectional, case-control and case study designs. Lipids Health Dis. 2012, 11, 33. [Google Scholar] [CrossRef] [PubMed]
- Nolan, J.M.; Stack, J.; Mellerio, J.; Godhinio, M.; O’Donovan, O.; Neelam, K.; Beatty, S. Monthly consistency of macular pigment optical density and serum concentrations of lutein and zeaxanthin. Curr. Eye Res. 2006, 31, 199–213. [Google Scholar] [CrossRef] [PubMed]
- Akbaraly, N.T.; Faure, H.; Gourlet, V.; Favier, A.; Berr, C. Plasma carotenoid levels and cognitive performance in an elderly population: Results of the EVA Study. J. Gerontol. Ser. A Biol. Sci. Med. Sci. 2007, 62, 308–316. [Google Scholar] [CrossRef]
- Lindbergh, C.A.; Mewborn, C.M.; Hammond, B.R.; Renzi-Hammond, L.M.; Curran-Celentano, J.M.; Miller, L.S. Relationship of lutein and zeaxanthin levels to neurocognitive functioning: An fMRI study of older adults. J. Int. Neuropsychol. Soc. 2017, 23, 11–22. [Google Scholar] [CrossRef] [PubMed]
- Mewborn, C.M.; Terry, D.P.; Renzi-Hammond, L.M.; Hammond, B.R.; Miller, L.S. Relation of Retinal and Serum Lutein and Zeaxanthin to White Matter Integrity in Older Adults: A Diffusion Tensor Imaging Study. Arch. Clin. Neuropsychol. 2017, 1–14. [Google Scholar] [CrossRef] [PubMed]
- Lindbergh, C.A.; Renzi-Hammond, L.M.; Hammond, B.R.; Terry, D.P.; Mewborn, C.M.; Puente, A.N.; Miller, L.S. Lutein and Zeaxanthin Influence Brain Function in Older Adults: A Randomized Controlled Trial. J. Int. Neuropsychol. Soc. 2018, 24, 77–90. [Google Scholar] [CrossRef] [PubMed]
- Zamroziewicz, M.K.; Paul, E.J.; Zwilling, C.E.; Johnson, E.J.; Kuchan, M.J.; Cohen, N.J.; Barbey, A.K. Parahippocampal Cortex Mediates the Relationship between Lutein and Crystallized Intelligence in Healthy, Older Adults. Front. Aging Neurosci. 2016, 8, 297. [Google Scholar] [CrossRef] [PubMed]
- Walk, A.M.; Edwards, C.G.; Baumgartner, N.W.; Chojnacki, M.R.; Covello, A.R.; Reeser, G.E.; Hammond, B.R.; Renzi-Hammond, L.M.; Khan, N.A. The Role of Retinal Carotenoids and Age on Neuroelectric Indices of Attentional Control among Early to Middle-Aged Adults. Front. Aging Neurosci. 2017, 9, 183. [Google Scholar] [CrossRef] [PubMed]
- Lezak, M.D. Neuropsychological Assessment, 3rd ed.; Oxford University Press: Oxford, UK, 1995; ISBN 978-0-19-509031-4. [Google Scholar]
- North, A.J.; Ulatowska, H.K. Competence in independently living older adults: Assessment and correlates. J. Gerontol. 1981, 36, 576–582. [Google Scholar] [CrossRef] [PubMed]
- Salthouse, T.A. Reasoning and spatial abilities. In The Handbook of Aging and Cognition; Craik, F.I.M., Salthouse, T.A., Eds.; Lawrence Erlbaum Associates: Hillsdale, NJ, USA, 1992; pp. 167–211. [Google Scholar]
- Possin, K.L. Visual spatial cognition in neurodegenerative disease. Neurocase 2010, 16, 466–487. [Google Scholar] [CrossRef] [PubMed]
- Hovestadt, A.; De Jong, G.J.; Meerwaldt, J.D. Spatial disorientation as an early symptom of Parkinson’s disease. Neurology 1987, 37, 485–487. [Google Scholar] [CrossRef] [PubMed]
- Raskin, S.A.; Borod, J.C.; Wasserstein, J.; Bodis-Wollner, I.; Coscia, L.; Yahr, M.D. Visuospatial Orientation in Parkinson’s Disease. Int. J. Neurosci. 1990, 51, 9–18. [Google Scholar] [CrossRef] [PubMed]
- Henderson, V.W.; Mack, W.; Williams, B.W. Spatial Disorientation in Alzheimer’s Disease. Arch. Neurol. 1989, 46, 391–394. [Google Scholar] [CrossRef] [PubMed]
- Ska, B.; Poissant, A.; Joanette, Y. Line orientation judgment in normal elderly and subjects with dementia of Alzheimer’s type. J. Clin. Exp. Neuropsychol. 1990, 12, 695–702. [Google Scholar] [CrossRef] [PubMed]
- Wahlin, T.-B.R.; Bäckman, L.; Wahlin, Å.; Winblad, B. Visuospatial functioning and spatial orientation in a community-based sample of healthy very old persons. Arch. Gerontol. Geriatr. 1993, 17, 165–177. [Google Scholar] [CrossRef]
- Martin, A.D.; Stirling, W.J.; Thorne, R.S.; Watt, G. Parton distributions for the LHC. Eur. Phys. J. C 2009, 63, 189–285. [Google Scholar] [CrossRef]
- Benton, A.L.; Varney, N.R.; Hamsher, K.D.S. Visuospatial judgment: A clinical test. Arch. Neurol. 1978, 35, 364–367. [Google Scholar] [CrossRef] [PubMed]
- Benton, A.L. Constructional apraxia and the minor hemisphere. Confin. Neurol. 1967, 29, 1–16. [Google Scholar] [PubMed]
- Benton, A.; Hannay, H.J.; Varney, N.R. Visual perception of line direction in patients with unilateral brain disease. Neurology 1975, 25, 907. [Google Scholar] [CrossRef] [PubMed]
- Collins, D.W.; Kimura, D. A large sex difference on a two-dimensional mental rotation task. Behav. Neurosci. 1997, 111, 845. [Google Scholar] [CrossRef] [PubMed]
- Paterson, A.; Zangwill, O.L. Disorders of visual space perception associated with lesions of the right cerebral hemisphere. Brain 1944, 67, 331–358. [Google Scholar] [CrossRef]
- Gur, R.C.; Gur, R.E.; Obrist, W.D.; Skolnick, B.E.; Reivich, M. Age and regional cerebral blood flow at rest and during cognitive activity. Arch. Gen. Psychiatr. 1987, 44, 617–621. [Google Scholar] [CrossRef] [PubMed]
- Fink, G.R.; Marshall, J.C.; Shah, N.J.; Weiss, P.H.; Halligan, P.W.; Grosse-Ruyken, M.; Ziemons, K.; Zilles, K.; Freund, H.-J. Line bisection judgments implicate right parietal cortex and cerebellum as assessed by fMRI. Neurology 2000, 54, 1324–1331. [Google Scholar] [CrossRef] [PubMed]
- Kesler, S.R.; Haberecht, M.F.; Menon, V.; Warsofsky, I.S.; Dyer-Friedman, J.; Neely, E.K.; Reiss, A.L. Functional neuroanatomy of spatial orientation processing in Turner syndrome. Cereb. Cortex 2004, 14, 174–180. [Google Scholar] [CrossRef] [PubMed]
- Tranel, D.; Vianna, E.; Manzel, K.; Damasio, H.; Grabowski, T. Neuroanatomical correlates of the Benton facial recognition test and judgment of line orientation test. J. Clin. Exp. Neuropsychol. 2009, 31, 219–233. [Google Scholar] [CrossRef] [PubMed]
- Cabeza, R.; Grady, C.L.; Nyberg, L.; McIntosh, A.R.; Tulving, E.; Kapur, S.; Jennings, J.M.; Houle, S.; Craik, F.I. Age-related differences in neural activity during memory encoding and retrieval: A positron emission tomography study. J. Neurosci. 1997, 17, 391–400. [Google Scholar] [CrossRef] [PubMed]
- Reuter-Lorenz, P.A.; Jonides, J.; Smith, E.E.; Hartley, A.; Miller, A.; Marshuetz, C.; Koeppe, R.A. Age differences in the frontal lateralization of verbal and spatial working memory revealed by PET. J. Cogn. Neurosci. 2000, 12, 174–187. [Google Scholar] [CrossRef] [PubMed]
- Grady, C.L.; McIntosh, A.R.; Rajah, M.N.; Beig, S.; Craik, F.I. The effects of age on the neural correlates of episodic encoding. Cereb. Cortex 1999, 9, 805–814. [Google Scholar] [CrossRef] [PubMed]
- Park, D.C.; Polk, T.A.; Park, R.; Minear, M.; Savage, A.; Smith, M.R. Aging reduces neural specialization in ventral visual cortex. Proc. Natl. Acad. Sci. USA 2004, 101, 13091–13095. [Google Scholar] [CrossRef] [PubMed]
- Chee, M.W.; Goh, J.O.; Venkatraman, V.; Tan, J.C.; Gutchess, A.; Sutton, B.; Hebrank, A.; Leshikar, E.; Park, D. Age-related changes in object processing and contextual binding revealed using fMR adaptation. J. Cogn. Neurosci. 2006, 18, 495–507. [Google Scholar] [CrossRef] [PubMed]
- Payer, D.; Marshuetz, C.; Sutton, B.; Hebrank, A.; Welsh, R.C.; Park, D.C. Decreased neural specialization in old adults on a working memory task. Neuroreport 2006, 17, 487–491. [Google Scholar] [CrossRef] [PubMed]
- Morris, J.C. The Clinical Dementia Rating (CDR): Current version and scoring rules. Neurology 1993. [Google Scholar] [CrossRef]
- Levenson, J.H.; Kozarsky, A. Visual acuity change. In Clinical Methods: The History, Physical, and Laboratory Examinations, 3rd ed.; Walker, H.K., Hall, W.D., Hurst, J.W., Eds.; Butterworths: Boston, MA, USA, 1990. [Google Scholar]
- Stringham, J.M.; Hammond, B.R.; Nolan, J.M.; Wooten, B.R.; Mammen, A.; Smollon, W.; Snodderly, D.M. The utility of using customized heterochromatic flicker photometry (cHFP) to measure macular pigment in patients with age-related macular degeneration. Exp. Eye Res. 2008, 87, 445–453. [Google Scholar] [CrossRef] [PubMed]
- Wooten, B.R.; Hammond, B.R., Jr. Spectral absorbance and spatial distribution of macular pigment using heterochromatic flicker photometry. Optom. Vis. Sci. 2005, 82, 378–386. [Google Scholar] [CrossRef] [PubMed]
- Ashburner, J.; Barnes, G.; Chen, C.; Daunizeau, J.; Flandin, G.; Friston, K.; Kiebel, S.; Kilner, J.; Litvak, V.; Moran, R.; et al. SPM12 Manual; Wellcome Trust: London, UK, 2014. [Google Scholar]
- Rorden, C. DCM2NII (Version 7 October). 2007. Available online: http://www.cabiatl.com/mricro/mricron/dcm2nii.html (accessed on 14 October 2016).
- Lazar, N. The Statistical Analysis of Functional MRI Data; Springer Science & Business Media: New York, NY, USA, 2008; ISBN 978-0-387-78190-7. [Google Scholar]
- MRIcron Index Page. Available online: http://people.cas.sc.edu/rorden/mricron/index.html (accessed on 12 January 2016).
- De Schotten, M.T.; Urbanski, M.; Duffau, H.; Volle, E.; Lévy, R.; Dubois, B.; Bartolomeo, P. Direct evidence for a parietal-frontal pathway subserving spatial awareness in humans. Science 2005, 309, 2226–2228. [Google Scholar] [CrossRef] [PubMed]
- Ganis, G.; Thompson, W.L.; Kosslyn, S.M. Brain areas underlying visual mental imagery and visual perception: An fMRI study. Cogn. Brain Res. 2004, 20, 226–241. [Google Scholar] [CrossRef] [PubMed]
- Biesbroek, J.M.; van Zandvoort, M.J.; Kuijf, H.J.; Weaver, N.A.; Kappelle, L.J.; Vos, P.C.; Velthuis, B.K.; Biessels, G.J.; Postma, A.; Utrecht VCI Study Group. The anatomy of visuospatial construction revealed by lesion-symptom mapping. Neuropsychologia 2014, 62, 68–76. [Google Scholar] [CrossRef] [PubMed]
- Davis, S.W.; Dennis, N.A.; Daselaar, S.M.; Fleck, M.S.; Cabeza, R. Que PASA? The posterior–anterior shift in aging. Cereb. Cortex 2007, 18, 1201–1209. [Google Scholar] [CrossRef] [PubMed]
- Grady, C.L.; Maisog, J.M.; Horwitz, B.; Ungerleider, L.G.; Mentis, M.J.; Salerno, J.A.; Pietrini, P.; Wagner, E.; Haxby, J.V. Age-related changes in cortical blood flow activation during visual processing of faces and location. J. Neurosci. 1994, 14, 1450–1462. [Google Scholar] [CrossRef] [PubMed]
- Nyberg, L.; Sandblom, J.; Jones, S.; Neely, A.S.; Petersson, K.M.; Ingvar, M.; Bäckman, L. Neural correlates of training-related memory improvement in adulthood and aging. Proc. Natl. Acad. Sci. USA 2003, 100, 13728–13733. [Google Scholar] [CrossRef] [PubMed]
- Düzel, E.; Schütze, H.; Yonelinas, A.P.; Heinze, H.-J. Functional phenotyping of successful aging in long-term memory: Preserved performance in the absence of neural compensation. Hippocampus 2011, 21, 803–814. [Google Scholar] [CrossRef] [PubMed]
- Duverne, S.; Habibi, A.; Rugg, M.D. Regional specificity of age effects on the neural correlates of episodic retrieval. Neurobiol. Aging 2008, 29, 1902–1916. [Google Scholar] [CrossRef] [PubMed]
- Sasaki, M.; Ozawa, Y.; Kurihara, T.; Noda, K.; Imamura, Y.; Kobayashi, S.; Ishida, S.; Tsubota, K. Neuroprotective effect of an antioxidant, lutein, during retinal inflammation. Investig. Ophthalmol. Vis. Sci. 2009, 50, 1433–1439. [Google Scholar] [CrossRef] [PubMed]
- Kosslyn, S.M. Image and Brain: The Resolution of the Imagery Debate; MIT Press: Cambridge, MA, USA, 1996; ISBN 978-0-262-61124-4. [Google Scholar]
- Miller, E.K.; Cohen, J.D. An integrative theory of prefrontal cortex function. Annu. Rev. Neurosci. 2001, 24, 167–202. [Google Scholar] [CrossRef] [PubMed]
- Mewborn, C.; Renzi, L.M.; Hammond, B.R.; Miller, L.S. Critical flicker fusion predicts executive function in younger and older adults. Arch. Clin. Neuropsychol. 2015, 30, 605–610. [Google Scholar] [CrossRef] [PubMed]
- Park, D.C.; Reuter-Lorenz, P. The adaptive brain: Aging and neurocognitive scaffolding. Annu. Rev. Psychol. 2009, 60, 173–196. [Google Scholar] [CrossRef] [PubMed]
- Reuter-Lorenz, P.A.; Park, D.C. How does it STAC up? Revisiting the Scaffolding Theory of Aging and Cognition. Neuropsychol. Rev. 2014, 24, 355–370. [Google Scholar] [CrossRef] [PubMed]
- Min, J.; Min, K. Serum lycopene, lutein and zeaxanthin, and the risk of Alzheimer’s disease mortality in older adults. Dement. Geriatr. Cogn. Disord. 2014, 37, 246–256. [Google Scholar] [CrossRef] [PubMed]
- Johnson, E.J.; McDonald, K.; Caldarella, S.M.; Chung, H.; Troen, A.M.; Snodderly, D.M. Cognitive findings of an exploratory trial of docosahexaenoic acid and lutein supplementation in older women. Nutr. Neurosci. 2008, 11, 75–83. [Google Scholar] [CrossRef] [PubMed]
- Erdman, J.W.; Smith, J.W.; Kuchan, M.J.; Mohn, E.S.; Johnson, E.J.; Rubakhin, S.S.; Wang, L.; Sweedler, J.V.; Neuringer, M. Lutein and brain function. Foods 2015, 4, 547–564. [Google Scholar] [CrossRef] [PubMed]


| Age (Years) | Sex (% Female) | Race (% Caucasian) | Education (Years) | JLO Task Accuracy (Max = 60) 1 | MPOD (o.d.) | Serum L & Z (μmol/L) 2 |
|---|---|---|---|---|---|---|
| 71.75 ± 6.16 | 58.8 | 100.0 | 16.1 ± 3.15 | 52.53 ± 4.49 | 0.495 ± 0.177 | 0.321 ± 0.170 |
| Region | x | y | z | Extent | T-Score |
|---|---|---|---|---|---|
| L superior lateral occipital cortex | −32 | −88 | 12 | 35,624 | 23.75 |
| L inferior lateral occipital cortex | −34 | −88 | 2 | * | 21.38 |
| −38 | −86 | 0 | * | 21.21 | |
| −42 | −64 | 12 | * | 20.35 | |
| R superior lateral occipital cortex | 34 | −80 | 22 | * | 21.63 |
| 22 | −64 | 52 | * | 21.58 | |
| 38 | −78 | 12 | * | 20.03 | |
| 26 | −72 | 36 | * | 18.76 | |
| 28 | −74 | 30 | * | 18.40 | |
| R inferior lateral occipital cortex | 34 | −88 | 0 | * | 19.59 |
| 38 | −84 | 4 | * | 19.18 | |
| 40 | −84 | −4 | * | 18.52 | |
| R occipital pole | 18 | −96 | 6 | * | 18.81 |
| R superior parietal lobule | 32 | −52 | 46 | * | 18.38 |
| L cerebellum, vermis VI | −4 | −72 | −26 | * | 18.31 |
| R occipital fusiform gyrus | 38 | −70 | −10 | * | 18.06 |
| R paracingulate gyrus | 6 | 20 | 44 | 13,072 | 18.85 |
| L paracingulate gyrus | −6 | 14 | 46 | * | 14.77 |
| −8 | 24 | 38 | * | 12.37 | |
| R middle frontal gyrus | 28 | 0 | 52 | * | 17.54 |
| 46 | 24 | 24 | * | 14.25 | |
| 50 | 30 | 28 | * | 13.01 | |
| L middle frontal gyrus | −26 | −2 | 52 | * | 13.90 |
| −38 | 28 | 22 | * | 9.60 | |
| R insular cortex | 32 | 20 | −2 | * | 17.48 |
| L insular cortex | −34 | 20 | 0 | * | 15.28 |
| R precentral gyrus | 42 | 6 | 28 | * | 17.15 |
| L precentral gyrus | −32 | −4 | 48 | * | 14.83 |
| −46 | 4 | 30 | * | 13.30 | |
| R frontal pole | 44 | 44 | −14 | * | 13.23 |
| 38 | 58 | 0 | * | 11.16 | |
| 46 | 50 | −8 | * | 10.16 | |
| L cingulate gyrus | −6 | 0 | 26 | 75 | 8.24 |
| L frontal pole | −46 | 48 | −4 | 30 | 8.05 |
| −48 | 44 | −8 | * | 7.63 | |
| −42 | 52 | 6 | * | 7.06 |
| Region | x | y | z | Extent | T-Score | Effect Size (r) |
|---|---|---|---|---|---|---|
| R superior lateral occipital cortex | 54 | −70 | 16 | 19 | 3.08 | 0.403 |
| 56 | −66 | 16 | * | 2.90 | 0.383 | |
| R inferior lateral occipital cortex | 56 | −68 | 12 | * | 2.94 | 0.387 |
| R middle frontal gyrus | 48 | 18 | 30 | 59 | 3.03 | 0.397 |
| R frontal pole | 0 | 60 | 16 | 31 | 2.93 | 0.386 |
| L cingulate gyrus | −2 | 4 | 24 | 30 | 2.85 | 0.377 |
| R cingulate gyrus | 4 | 2 | 30 | * | 2.56 | 0.343 |
| R angular gyrus | 60 | −50 | 38 | 15 | 2.84 | 0.376 |
| 62 | −50 | 34 | * | 2.81 | 0.373 | |
| R precentral gyrus | 62 | 12 | 8 | 9 | 2.82 | 0.374 |
| R superior frontal gyrus | 6 | 56 | 25 | 10 | 2.62 | 0.351 |
| Region | x | y | z | Extent | T-Score | Effect Size (r) |
|---|---|---|---|---|---|---|
| R precentral gyrus | 16 | −18 | 48 | 62 | 3.75 | 0.492 |
| L middle temporal gyrus | −56 | −8 | −12 | 51 | 3.55 | 0.472 |
| L superior parietal lobule | −36 | −42 | 50 | 199 | 3.46 | 0.462 |
| −28 | −56 | 58 | * | 3.29 | 0.444 | |
| L superior lateral occipital cortex | −20 | −74 | 40 | 61 | 3.42 | 0.458 |
| −16 | −88 | 36 | 12 | 2.73 | 0.381 | |
| R temporal fusiform cortex | 36 | −30 | −16 | 33 | 3.36 | 0.452 |
| L precentral gyrus | −20 | −40 | 44 | 68 | 3.32 | 0.448 |
| R superior lateral occipital cortex | 26 | −84 | 30 | 67 | 3.21 | 0.436 |
| 24 | −62 | 56 | 51 | 3.04 | 0.417 | |
| L superior frontal gyrus | −22 | 30 | 54 | 28 | 3.16 | 0.430 |
| L posterior superior temporal gyrus | −60 | −32 | 4 | 49 | 2.92 | 0.403 |
| L planum temporale | −62 | −22 | 6 | * | 2.70 | 0.377 |
| L superior temporal gyrus | −52 | −38 | 2 | * | 2.56 | 0.360 |
| L occipital pole | −28 | −96 | 6 | 9 | 2.99 | 0.411 |
| L temporal fusiform cortex | 44 | −16 | −16 | 9 | 2.95 | 0.406 |
| R thalamus | 24 | −22 | 4 | 36 | 2.93 | 0.404 |
| L planum polare | −36 | −8 | −10 | 19 | 2.87 | 0.397 |
| R posterior supramarginal gyrus | 46 | −38 | 10 | 21 | 2.58 | 0.362 |
| R posterior superior temporal gyrus | 54 | −36 | 8 | * | 2.87 | 0.397 |
| L Heschl’s gyrus | −46 | −22 | 2 | 12 | 2.83 | 0.392 |
| L parahippocampal gyrus | −32 | −36 | −18 | 22 | 2.83 | 0.392 |
| R postcentral gyrus | 6 | −40 | 62 | 22 | 2.66 | 0.372 |
| L central opercular cortex | −48 | 6 | 2 | 11 | 2.75 | 0.383 |
| R anterior middle temporal gyrus | 58 | −2 | −22 | 19 | 2.70 | 0.377 |
| R anterior superior temporal gyrus | 50 | −2 | −16 | * | 2.62 | 0.367 |
| L temporal pole | −52 | 6 | −18 | 10 | 2.67 | 0.373 |
| R lingual gyrus | 18 | −60 | −16 | 8 | 2.61 | 0.366 |
© 2018 by the authors. Licensee MDPI, Basel, Switzerland. This article is an open access article distributed under the terms and conditions of the Creative Commons Attribution (CC BY) license (http://creativecommons.org/licenses/by/4.0/).
Share and Cite
Mewborn, C.M.; Lindbergh, C.A.; Robinson, T.L.; Gogniat, M.A.; Terry, D.P.; Jean, K.R.; Hammond, B.R.; Renzi-Hammond, L.M.; Miller, L.S. Lutein and Zeaxanthin Are Positively Associated with Visual–Spatial Functioning in Older Adults: An fMRI Study. Nutrients 2018, 10, 458. https://0-doi-org.brum.beds.ac.uk/10.3390/nu10040458
Mewborn CM, Lindbergh CA, Robinson TL, Gogniat MA, Terry DP, Jean KR, Hammond BR, Renzi-Hammond LM, Miller LS. Lutein and Zeaxanthin Are Positively Associated with Visual–Spatial Functioning in Older Adults: An fMRI Study. Nutrients. 2018; 10(4):458. https://0-doi-org.brum.beds.ac.uk/10.3390/nu10040458
Chicago/Turabian StyleMewborn, Catherine M., Cutter A. Lindbergh, Talia L. Robinson, Marissa A. Gogniat, Douglas P. Terry, Kharine R. Jean, Billy Randy Hammond, Lisa M. Renzi-Hammond, and Lloyd Stephen Miller. 2018. "Lutein and Zeaxanthin Are Positively Associated with Visual–Spatial Functioning in Older Adults: An fMRI Study" Nutrients 10, no. 4: 458. https://0-doi-org.brum.beds.ac.uk/10.3390/nu10040458