Relationship between 1,25-Dihydroxyvitamin D and Body Composition in Middle-Aged Sedentary Adults: The FIT-AGEING Study

 , , , ,
Abstract
:
1. Introduction
2. Materials and Methods
2.1. Study Design and Participants
2.2. Anthropometric Parameters and Body Composition Assessment
2.3. Dietary Intake Assessment
2.4. Physical Activity Assessment
2.5. Blood Samples Assessment
2.6. Statistical Analysis
3. Results
4. Discussion
5. Conclusions
Author Contributions
Funding
Acknowledgments
Conflicts of Interest
References
- Jin, K.; Simpkins, J.W.; Ji, X.; Leis, M.; Stambler, I. The Critical Need to Promote Research of Aging and Aging-related Diseases to Improve Health and Longevity of the Elderly Population. Aging Dis. 2015, 6, 1–5. [Google Scholar] [CrossRef] [PubMed]
- Fulop, T.; Larbi, A.; Witkowski, J.M.; McElhaney, J.; Loeb, M.; Mitnitski, A.; Pawelec, G. Aging, frailty and age-related diseases. Biogerontology 2010, 11, 547–563. [Google Scholar] [CrossRef] [PubMed]
- Hamer, M.; O’Donovan, G. Sarcopenic obesity, weight loss, and mortality: The English Longitudinal Study of Ageing. Am. J. Clin. Nutr. 2017, 106, 125–129. [Google Scholar] [CrossRef] [PubMed]
- Kohara, K. Sarcopenic obesity in aging population: Current status and future directions for research. Endocrine 2014, 45, 15–25. [Google Scholar] [CrossRef] [PubMed]
- Hirschfeld, H.P.; Kinsella, R.; Duque, G. Osteosarcopenia: Where bone, muscle, and fat collide. Osteoporos. Int. 2017, 28, 2781–2790. [Google Scholar] [CrossRef]
- Prado, C.M.; Purcell, S.A.; Alish, C.; Pereira, S.L.; Deutz, N.E.; Heyland, D.K.; Goodpaster, B.H.; Tappenden, K.A.; Heymsfield, S.B. Implications of low muscle mass across the continuum of care: A narrative review. Ann. Med. 2018, 50, 675–693. [Google Scholar] [CrossRef]
- Harvey, N.; Dennison, E.; Cooper, C. Osteoporosis: Impact on health and economics. Nat. Rev. Rheumatol. 2010, 6, 99. [Google Scholar] [CrossRef]
- Withrow, D.; Alter, D.A. The economic burden of obesity worldwide: A systematic review of the direct costs of obesity. Obes. Rev. 2011, 12, 131–141. [Google Scholar] [CrossRef]
- Bruyère, O.; Beaudart, C.; Ethgen, O.; Reginster, J.-Y.; Locquet, M. The health economics burden of sarcopenia: A systematic review. Maturitas 2018, 119, 61–69. [Google Scholar] [CrossRef]
- Holick, M.F.; Chen, T.C. Vitamin D deficiency: A worldwide problem with health consequences. Am. J. Clin. Nutr. 2008, 87, 1080S–1086S. [Google Scholar] [CrossRef]
- Bischoff-Ferrari, H.A.; Dawson-Hughes, B.; Staehelin, H.B.; Orav, J.E.; Stuck, A.E.; Theiler, R.; Wong, J.B.; Egli, A.; Kiel, D.P.; Henschkowski, J. Fall prevention with supplemental and active forms of vitamin D: A meta-analysis of randomised controlled trials. BMJ 2009, 339, b3692. [Google Scholar] [CrossRef] [PubMed]
- Looker, A.C. Serum 25-hydroxyvitamin D and risk of major osteoporotic fractures in older U.S. adults. J. Bone Miner. Res. 2013, 28, 997–1006. [Google Scholar] [CrossRef] [PubMed]
- Zittermann, A.; Gummert, J.F. Nonclassical vitamin D action. Nutrients 2010, 2, 408–425. [Google Scholar] [CrossRef] [PubMed]
- Autier, P.; Boniol, M.; Pizot, C.; Mullie, P. Vitamin D status and ill health: A systematic review. Lancet Diabetes Endocrinol. 2014, 2, 76–89. [Google Scholar] [CrossRef]
- Cranney, A.; Horsley, T.; O’Donnell, S.; Weiler, H.; Puil, L.; Ooi, D.; Atkinson, S.; Ward, L.; Moher, D.; Hanley, D.; et al. Effectiveness and safety of vitamin D in relation to bone health. Evid. Rep. Technol. Assess. (Full. Rep.) 2007, 1–235. [Google Scholar]
- Visser, M.; Deeg, D.J.H.; Lips, P. Low vitamin D and high parathyroid hormone levels as determinants of loss of muscle strength and muscle mass (sarcopenia): The Longitudinal Aging Study Amsterdam. J. Clin. Endocrinol. Metab. 2003, 88, 5766–5772. [Google Scholar] [CrossRef]
- Afzal, S.; Brondum-Jacobsen, P.; Bojesen, S.E.; Nordestgaard, B.G. Vitamin D concentration, obesity, and risk of diabetes: A mendelian randomisation study. lancet. Diabetes Endocrinol. 2014, 2, 298–306. [Google Scholar] [CrossRef]
- Holick, M.F. Vitamin D deficiency. N. Engl. J. Med. 2007, 357, 266–281. [Google Scholar] [CrossRef]
- Norman, A.W. From vitamin D to hormone D: Fundamentals of the vitamin D endocrine system essential for good health. Am. J. Clin. Nutr. 2008, 88, 491S–499S. [Google Scholar] [CrossRef]
- Jenkinson, C.; Taylor, A.E.; Hassan-Smith, Z.K.; Adams, J.S.; Stewart, P.M.; Hewison, M.; Keevil, B.G. High throughput LC-MS/MS method for the simultaneous analysis of multiple vitamin D analytes in serum. J. Chromatogr. B Anal. Technol. Biomed. Life Sci. 2016, 1014, 56–63. [Google Scholar] [CrossRef]
- Casetta, B.; Jans, I.; Billen, J.; Vanderschueren, D.; Bouillon, R. Development of a method for the quantification of 1alpha,25(OH)2-vitamin D3 in serum by liquid chromatography tandem mass spectrometry without derivatization. Eur. J. Mass Spectrom. (Chichester Eng.) 2010, 16, 81–89. [Google Scholar] [CrossRef] [PubMed]
- Lips, P. Relative value of 25(OH)D and 1,25(OH)2D measurements. J. Bone Miner. Res. 2007, 22, 1668–1671. [Google Scholar] [CrossRef] [PubMed]
- Konradsen, S.; Ag, H.; Lindberg, F.; Hexeberg, S.; Jorde, R. Serum 1,25-dihydroxy vitamin D is inversely associated with body mass index. Eur. J. Nutr. 2008, 47, 87–91. [Google Scholar] [CrossRef] [PubMed]
- Parikh, S.J.; Edelman, M.; Uwaifo, G.I.; Freedman, R.J.; Semega-Janneh, M.; Reynolds, J.; Yanovski, J.A. The relationship between obesity and serum 1,25-dihydroxy vitamin D concentrations in healthy adults. J. Clin. Endocrinol. Metab. 2004, 89, 1196–1199. [Google Scholar] [CrossRef]
- Bell, N.H.; Epstein, S.; Greene, A.; Shary, J.; Oexmann, M.J.; Shaw, S. Evidence for alteration of the vitamin D-endocrine system in obese subjects. J. Clin. Investig. 1985, 76, 370–373. [Google Scholar] [CrossRef]
- Hey, H.; Stokholm, K.H.; Lund, B.; Lund, B.; Sorensen, O.H. Vitamin D deficiency in obese patients and changes in circulating vitamin D metabolites following jejunoileal bypass. Int. J. Obes. 1982, 6, 473–479. [Google Scholar]
- Liel, Y.; Ulmer, E.; Shary, J.; Hollis, B.W.; Bell, N.H. Low circulating vitamin D in obesity. Calcif. Tissue Int. 1988, 43, 199–201. [Google Scholar] [CrossRef]
- Kerstetter, J.; Caballero, B.; O’Brien, K.; Wurtman, R.; Allen, L. Mineral homeostasis in obesity: Effects of euglycemic hyperinsulinemia. Metabolism 1991, 40, 707–713. [Google Scholar] [CrossRef]
- Hassan-Smith, Z.K.; Jenkinson, C.; Smith, D.J.; Hernandez, I.; Morgan, S.A.; Crabtree, N.J.; Gittoes, N.J.; Keevil, B.G.; Stewart, P.M.; Hewison, M. 25-hydroxyvitamin D3 and 1,25-dihydroxyvitamin D3 exert distinct effects on human skeletal muscle function and gene expression. PLoS ONE 2017, 12, e0170665. [Google Scholar] [CrossRef]
- Marantes, I.; Achenbach, S.J.; Atkinson, E.J.; Khosla, S.; Melton III, L.J.; Amin, S. Is vitamin D a determinant of muscle mass and strength? J. Bone Miner. Res. 2011, 26, 2860–2871. [Google Scholar] [CrossRef]
- Fujiyoshi, A.; Polgreen, L.E.; Hurley, D.L.; Gross, M.D.; Sidney, S.; Jacobs, D.R.J. A cross-sectional association between bone mineral density and parathyroid hormone and other biomarkers in community-dwelling young adults: The CARDIA study. J. Clin. Endocrinol. Metab. 2013, 98, 4038–4046. [Google Scholar] [CrossRef] [PubMed]
- Vanderschueren, D.; Pye, S.R.; O’Neill, T.W.; Lee, D.M.; Jans, I.; Billen, J.; Gielen, E.; Laurent, M.; Claessens, F.; Adams, J.E.; et al. Active vitamin D (1,25-dihydroxyvitamin D) and bone health in middle-aged and elderly men: The European Male Aging Study (EMAS). J. Clin. Endocrinol. Metab. 2013, 98, 995–1005. [Google Scholar] [CrossRef] [PubMed]
- Swanson, C.M.; Srikanth, P.; Lee, C.G.; Cummings, S.R.; Jans, I.; Cauley, J.A.; Bouillon, R.; Vanderschueren, D.; Orwoll, E.S.; Nielson, C.M. Associations of 25-Hydroxyvitamin D and 1,25-Dihydroxyvitamin D with Bone Mineral Density, Bone Mineral Density Change, and Incident Nonvertebral Fracture. J. Bone Miner. Res. 2015, 30, 1403–1413. [Google Scholar] [CrossRef] [PubMed]
- Orwoll, E.; Kane-Johnson, N.; Cook, J.; Roberts, L.; Strasik, L.; McClung, M. Acute parathyroid hormone secretory dynamics: Hormone secretion from normal primate and adenomatous human tissue in response to changes in extracellular calcium concentration. J. Clin. Endocrinol. Metab. 1986, 62, 950–955. [Google Scholar] [CrossRef] [PubMed]
- Stone, K.; Bauer, D.C.; Black, D.M.; Sklarin, P.; Ensrud, K.E.; Cummings, S.R. Hormonal predictors of bone loss in elderly women: A prospective study. The Study of Osteoporotic Fractures Research Group. J. Bone Miner. Res. 1998, 13, 1167–1174. [Google Scholar] [CrossRef]
- Cummings, S.R.; Browner, W.S.; Bauer, D.; Stone, K.; Ensrud, K.; Jamal, S.; Ettinger, B. Endogenous hormones and the risk of hip and vertebral fractures among older women. Study of Osteoporotic Fractures Research Group. N. Engl. J. Med. 1998, 339, 733–738. [Google Scholar] [CrossRef]
- Lips, P.; Netelenbos, J.C.; Jongen, M.J.; van Ginkel, F.C.; Althuis, A.L.; van Schaik, C.L.; van der Vijgh, W.J.; Vermeiden, J.P.; van der Meer, C. Histomorphometric profile and vitamin D status in patients with femoral neck fracture. Metab. Bone Dis. Relat. Res. 1982, 4, 85–93. [Google Scholar] [CrossRef]
- Fontana, L.; Kennedy, B.K.; Longo, V.D.; Seals, D.; Melov, S. Medical research: Treat ageing. Nature 2014, 511, 405–407. [Google Scholar] [CrossRef]
- Belsky, D.W.; Caspi, A.; Houts, R.; Cohen, H.J.; Corcoran, D.L.; Danese, A.; Harrington, H.; Israel, S.; Levine, M.E.; Schaefer, J.D.; et al. Quantification of biological aging in young adults. Proc. Natl. Acad. Sci. USA 2015, 112, E4104–E4110. [Google Scholar] [CrossRef] [Green Version]
- Amaro-Gahete, F.J.; De-la-O, A.; Jurado-Fasoli, L.; Espuch-Oliver, A.; Robles-Gonzalez, L.; Navarro-Lomas, G.; de Haro, T.; Femia, P.; Castillo, M.J.; Gutierrez, A. Exercise training as S-Klotho protein stimulator in sedentary healthy adults: Rationale, design, and methodology. Contemp. Clin. Trials Commun. 2018, 11, 10–19. [Google Scholar] [CrossRef]
- Halliday, T.M.; Davy, B.M.; Clark, A.G.; Baugh, M.E.; Hedrick, V.E.; Marinik, E.L.; Flack, K.D.; Savla, J.; Winett, S.; Winett, R.A. Dietary intake modification in response to a participation in a resistance training program for sedentary older adults with prediabetes: Findings from the Resist Diabetes study. Eat. Behav. 2014, 15, 379–382. [Google Scholar] [CrossRef] [PubMed] [Green Version]
- López, M.D.R.; Martín-Lagos, R.A.; Martin-Lagos, R.A. Guía para Estudios Dietéticos: Álbum Fotográfico de Alimentos; Editorial Universidad de Granada: Granada, Spain, 2010; ISBN 9788433851673. [Google Scholar]
- Migueles, J.H.; Cadenas-Sanchez, C.; Ekelund, U.; Delisle Nystrom, C.; Mora-Gonzalez, J.; Lof, M.; Labayen, I.; Ruiz, J.R.; Ortega, F.B. Accelerometer Data Collection and Processing Criteria to Assess Physical Activity and Other Outcomes: A Systematic Review and Practical Considerations. Sports Med. 2017, 47, 1821–1845. [Google Scholar] [CrossRef] [PubMed]
- Hildebrand, M.; Hansen, B.H.; van Hees, V.T.; Ekelund, U. Evaluation of raw acceleration sedentary thresholds in children and adults. Scand. J. Med. Sci. Sports 2017, 27, 1814–1823. [Google Scholar] [CrossRef] [PubMed]
- Hildebrand, M.; VAN Hees, V.T.; Hansen, B.H.; Ekelund, U. Age group comparability of raw accelerometer output from wrist- and hip-worn monitors. Med. Sci. Sports Exerc. 2014, 46, 1816–1824. [Google Scholar] [CrossRef]
- Zamboni, G.; Soffiati, M.; Giavarina, D.; Tato, L. Mineral metabolism in obese children. Acta Paediatr. Scand. 1988, 77, 741–746. [Google Scholar] [CrossRef]
- Zittermann, A. Vitamin D in preventive medicine: Are we ignoring the evidence? Br. J. Nutr. 2003, 89, 552–572. [Google Scholar] [CrossRef]
- Clarke, A.D.; Rowbury, C.S. Removal of lipids before liquid chromatography of vitamin D in serum. Clin. Chem. 1985, 31, 657–658. [Google Scholar]
- Zittermann, A. Vitamin D and disease prevention with special reference to cardiovascular disease. Prog. Biophys. Mol. Biol. 2006, 92, 39–48. [Google Scholar] [CrossRef]
- Mozaffarian, D. Foods, obesity, and diabetes-are all calories created equal? Nutr. Rev. 2017, 75, 19–31. [Google Scholar] [CrossRef]
- Vimaleswaran, K.S.; Berry, D.J.; Lu, C.; Tikkanen, E.; Pilz, S.; Hiraki, L.T.; Cooper, J.D.; Dastani, Z.; Li, R.; Houston, D.K.; et al. Causal relationship between obesity and vitamin D status: Bi-directional Mendelian randomization analysis of multiple cohorts. PLoS Med. 2013, 10, e1001383. [Google Scholar] [CrossRef]
- Skaaby, T.; Husemoen, L.L.N.; Thuesen, B.H.; Pisinger, C.; Hannemann, A.; Jorgensen, T.; Linneberg, A. Longitudinal associations between lifestyle and vitamin D: A general population study with repeated vitamin D measurements. Endocrine 2016, 51, 342–350. [Google Scholar] [CrossRef] [PubMed]
- Need, A.G.; Morris, H.A.; Horowitz, M.; Nordin, C. Effects of skin thickness, age, body fat, and sunlight on serum 25-hydroxyvitamin D. Am. J. Clin. Nutr. 1993, 58, 882–885. [Google Scholar] [CrossRef] [PubMed]
- Ryan, Z.C.; Craig, T.A.; Folmes, C.D.; Wang, X.; Lanza, I.R.; Schaible, N.S.; Salisbury, J.L.; Nair, K.S.; Terzic, A.; Sieck, G.C. 1α, 25-dihydroxyvitamin D3 regulates mitochondrial oxygen consumption and dynamics in human skeletal muscle cells. J. Biol. Chem. 2016, 291, 1514–1528. [Google Scholar] [CrossRef] [PubMed]
- Lieben, L.; Carmeliet, G.; Masuyama, R. Calcemic actions of vitamin D: Effects on the intestine, kidney and bone. Best Pract. Res. Clin. Endocrinol. Metab. 2011, 25, 561–572. [Google Scholar] [CrossRef]
- Lips, P. Vitamin D physiology. Prog. Biophys. Mol. Biol. 2006, 92, 4–8. [Google Scholar] [CrossRef]


| N | All | N | Men | N | Women | ||||
|---|---|---|---|---|---|---|---|---|---|
| Age (years) | 73 | 53.7 | (5.1) | 34 | 54.6 | (5.2) | 39 | 53 | (5.0) |
| Body composition parameters | |||||||||
| Body mass index (kg/m2) | 73 | 26.7 | (3.8) | 34 | 28.3 | (3.6) | 39 | 25.3 | (3.3) * |
| Lean mass (kg) | 73 | 43.2 | (11.7) | 34 | 53.9 | (6.5) | 39 | 34.1 | (5.8) * |
| Lean mass index (kg/m2) | 73 | 15.2 | (2.9) | 34 | 17.5 | (2.0) | 39 | 13.2 | (1.8) * |
| Fat mass (%) | 73 | 40.1 | (8.9) | 34 | 34.7 | (8.0) | 39 | 44.5 | (7.4) * |
| Fat mass (kg) | 73 | 30.1 | (8.5) | 34 | 30.9 | (9.8) | 39 | 29.2 | (7.1) |
| Fat mass index (kg/m2) | 73 | 10.8 | (3.1) | 34 | 10.0 | (3.2) | 39 | 11.4 | (2.9) |
| Bone mineral density (g/cm2) | 73 | 1.1 | (0.1) | 34 | 1.2 | (0.1) | 39 | 1.0 | (0.1) * |
| Dietary intake | |||||||||
| Total Energy intake (kcal/day) | 72 | 2071.7 | (455.4) | 34 | 2312.1 | (402.9) | 38 | 1854.6 | (390.3) * |
| Vitamin D intake (µg/day) | 72 | 5.0 | (6.0) | 34 | 3.8 | (3.3) | 38 | 6.1 | (7.6) |
| Calcium intake (mg/day) | 72 | 763.4 | (340.5) | 34 | 867.3 | (396.9) | 38 | 670.5 | (251.4) * |
| Phosphorus intake (mg/day) | 72 | 1324.7 | (558.9) | 34 | 1507.6 | (689.6) | 38 | 1161.0 | (342.2) * |
| Physical activity parameters | |||||||||
| LPA (min/day) | 70 | 173.7 | (45.4) | 33 | 169.9 | (52.7) | 37 | 178.0 | (40.7) |
| MVPA (min/day) | 70 | 95.8 | (35.6) | 33 | 96.4 | (37.1) | 37 | 96.6 | (35.7) |
| Total PA (min/day) | 70 | 269.5 | (75.1) | 33 | 265.2 | (79.3) | 37 | 273.3 | (72.0) |
| Blood parameters | |||||||||
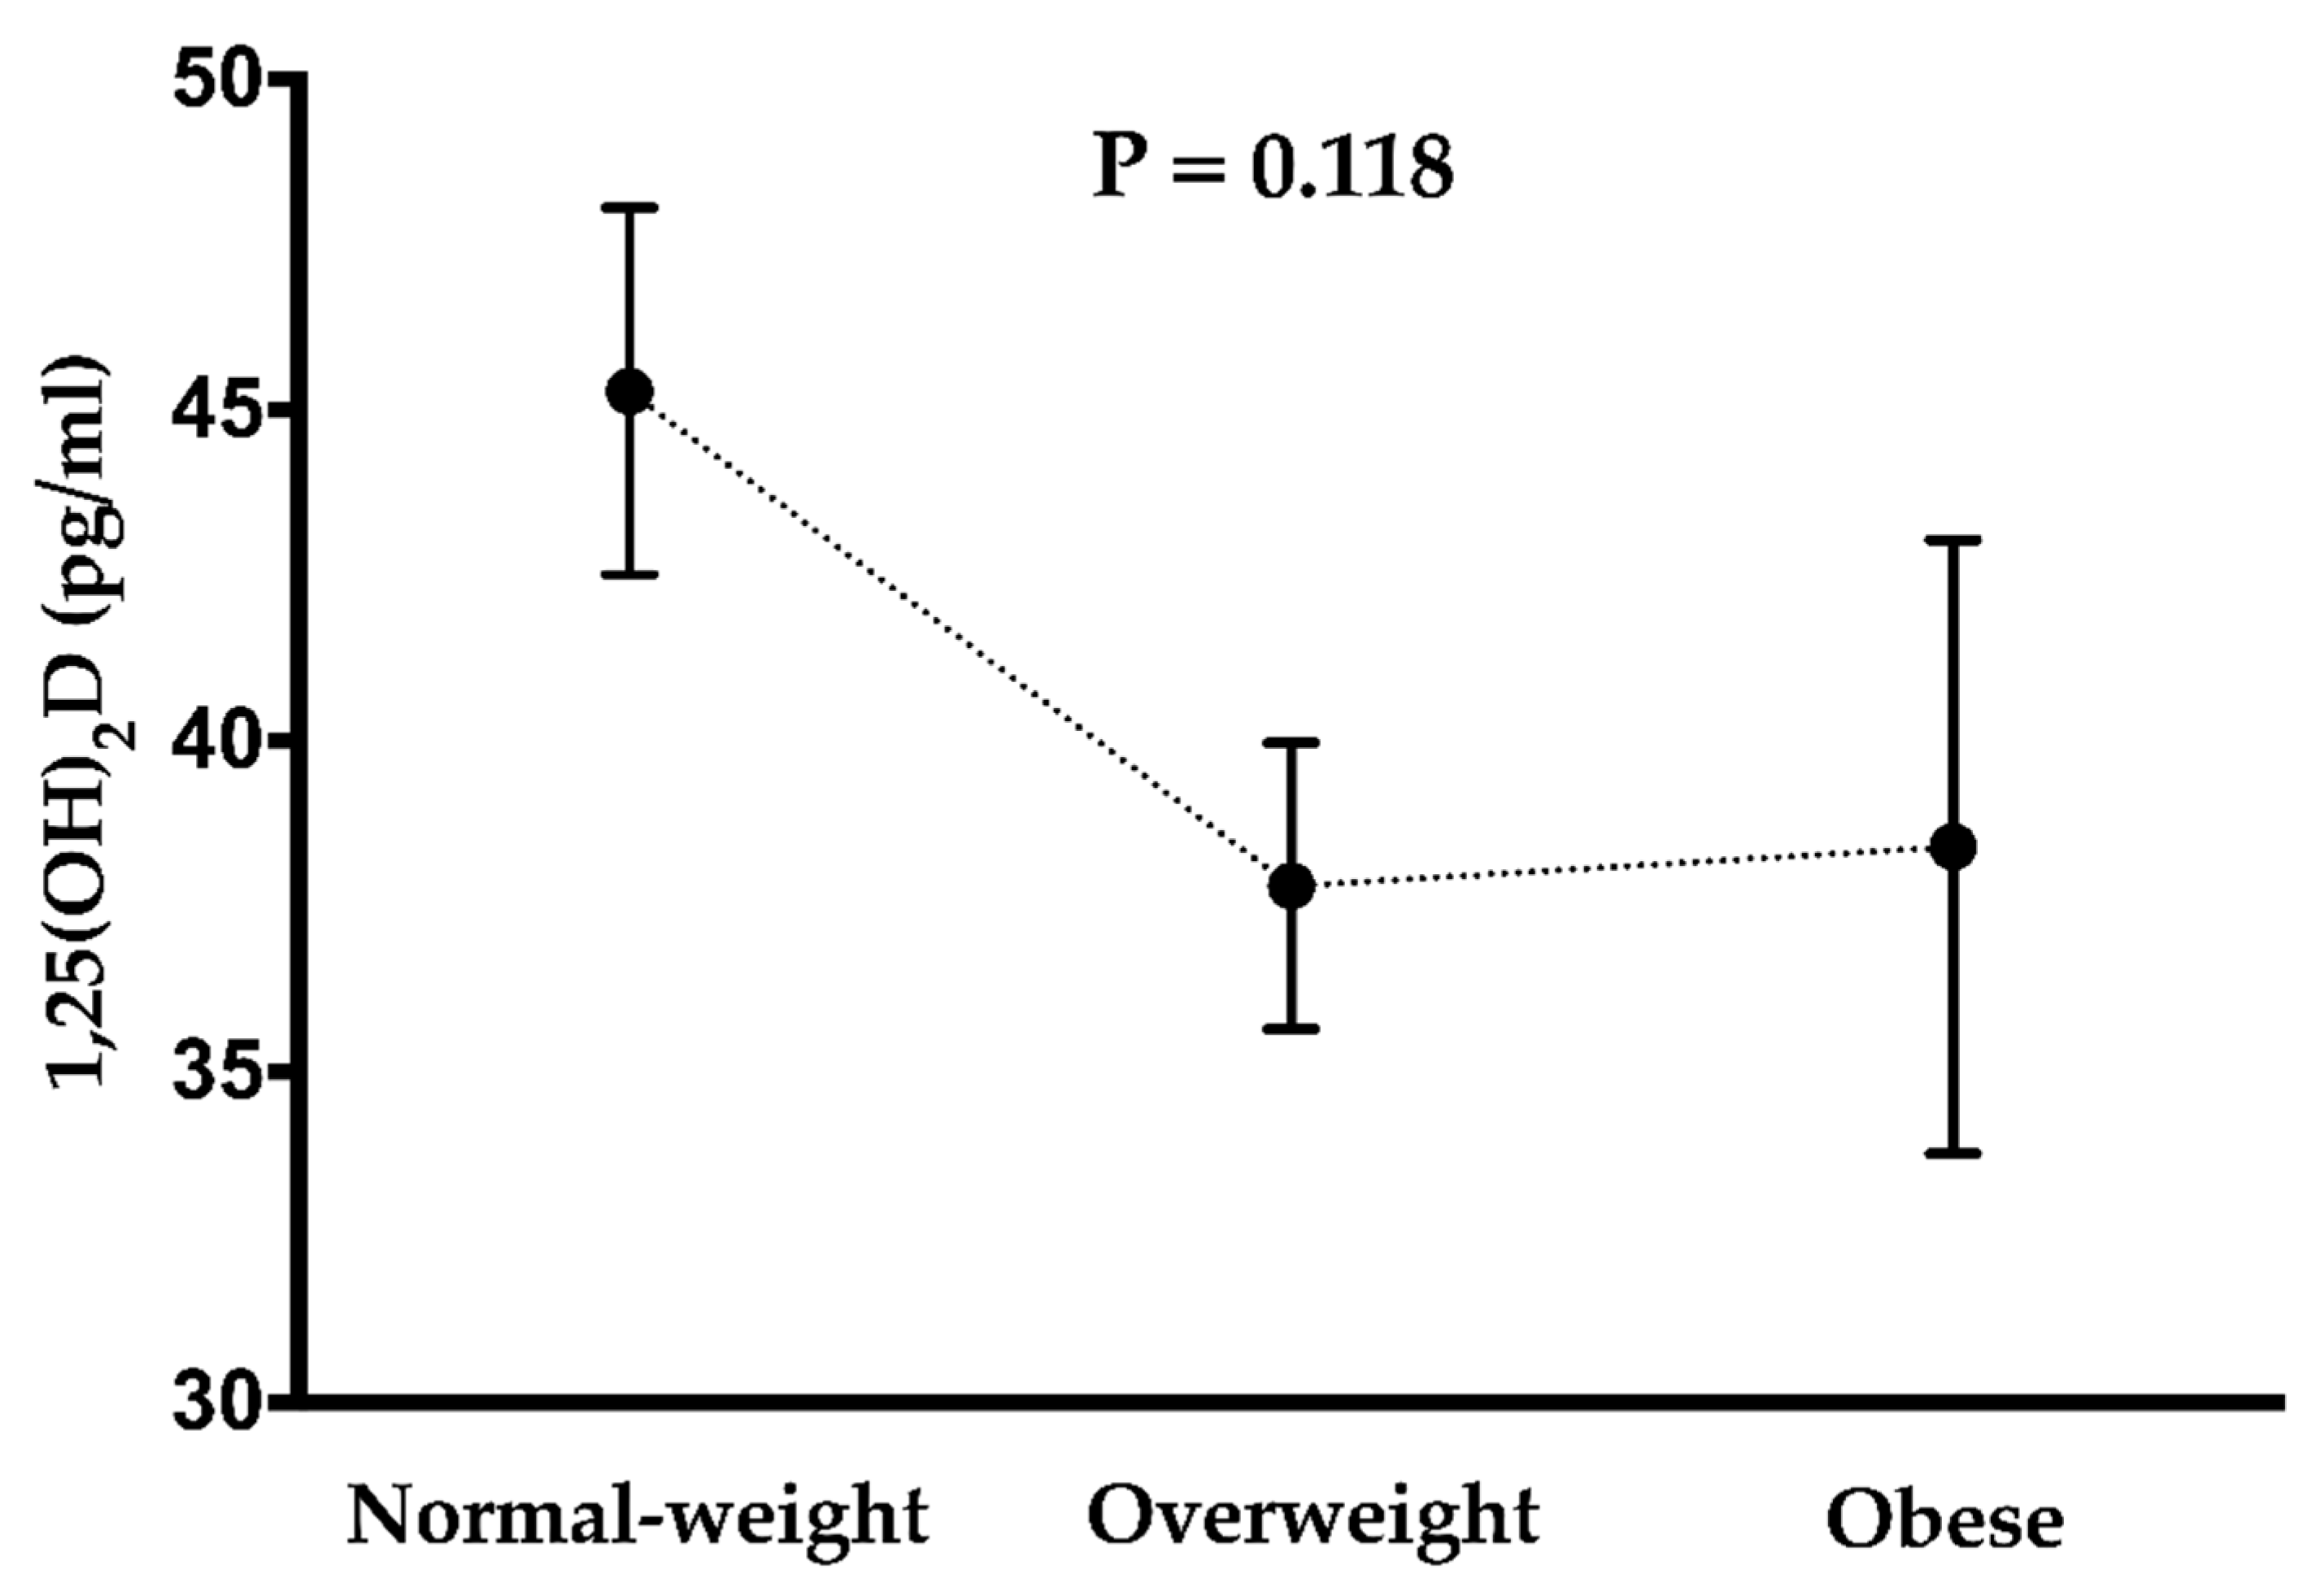
| 1,25 Dihydroxyvitamin D (pg/ml) | 73 | 40.3 | (14.1) | 34 | 38.3 | (13.4) | 39 | 42.0 | (14.6) |
| 1,25-Dihydroxyvitamin D | ||||||
|---|---|---|---|---|---|---|
| Model 1 | Model 2 | Model 3 | ||||
| p value | β | p value | β | p value | β | |
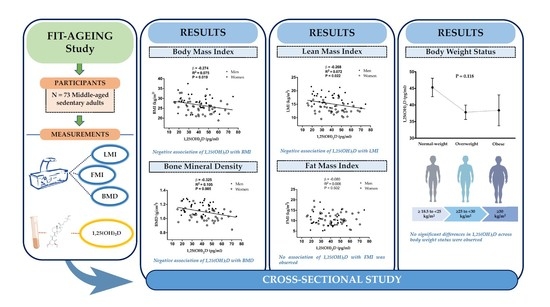
| Body mass index (kg/m2) | 0.020 | −0.274 | 0.040 | −0.263 | 0.042 | −0.262 |
| Lean mass index (kg/m2) | 0.023 | −0.269 | 0.030 | −0.383 | 0.032 | −0.383 |
| Fat mass index (kg/m2) | 0.505 | −0.080 | 0.354 | −0.112 | 0.356 | −0.113 |
| Bone mineral density (g/cm2) | 0.005 | −0.325 | 0.009 | −0.370 | 0.009 | −0.377 |
© 2019 by the authors. Licensee MDPI, Basel, Switzerland. This article is an open access article distributed under the terms and conditions of the Creative Commons Attribution (CC BY) license (http://creativecommons.org/licenses/by/4.0/).
Share and Cite
De-la-O, A.; Jurado-Fasoli, L.; Castillo, M.J.; Gracia-Marco, L.; Gutierrez, Á.; Amaro-Gahete, F.J. Relationship between 1,25-Dihydroxyvitamin D and Body Composition in Middle-Aged Sedentary Adults: The FIT-AGEING Study. Nutrients 2019, 11, 2567. https://0-doi-org.brum.beds.ac.uk/10.3390/nu11112567
De-la-O A, Jurado-Fasoli L, Castillo MJ, Gracia-Marco L, Gutierrez Á, Amaro-Gahete FJ. Relationship between 1,25-Dihydroxyvitamin D and Body Composition in Middle-Aged Sedentary Adults: The FIT-AGEING Study. Nutrients. 2019; 11(11):2567. https://0-doi-org.brum.beds.ac.uk/10.3390/nu11112567
Chicago/Turabian StyleDe-la-O, Alejandro, Lucas Jurado-Fasoli, Manuel J. Castillo, Luis Gracia-Marco, Ángel Gutierrez, and Francisco J. Amaro-Gahete. 2019. "Relationship between 1,25-Dihydroxyvitamin D and Body Composition in Middle-Aged Sedentary Adults: The FIT-AGEING Study" Nutrients 11, no. 11: 2567. https://0-doi-org.brum.beds.ac.uk/10.3390/nu11112567