UP1306: A Composition Containing Standardized Extracts of Acacia catechu and Morus alba for Arthritis Management

 ,
,
Abstract
:
1. Introduction
2. Materials and Methods
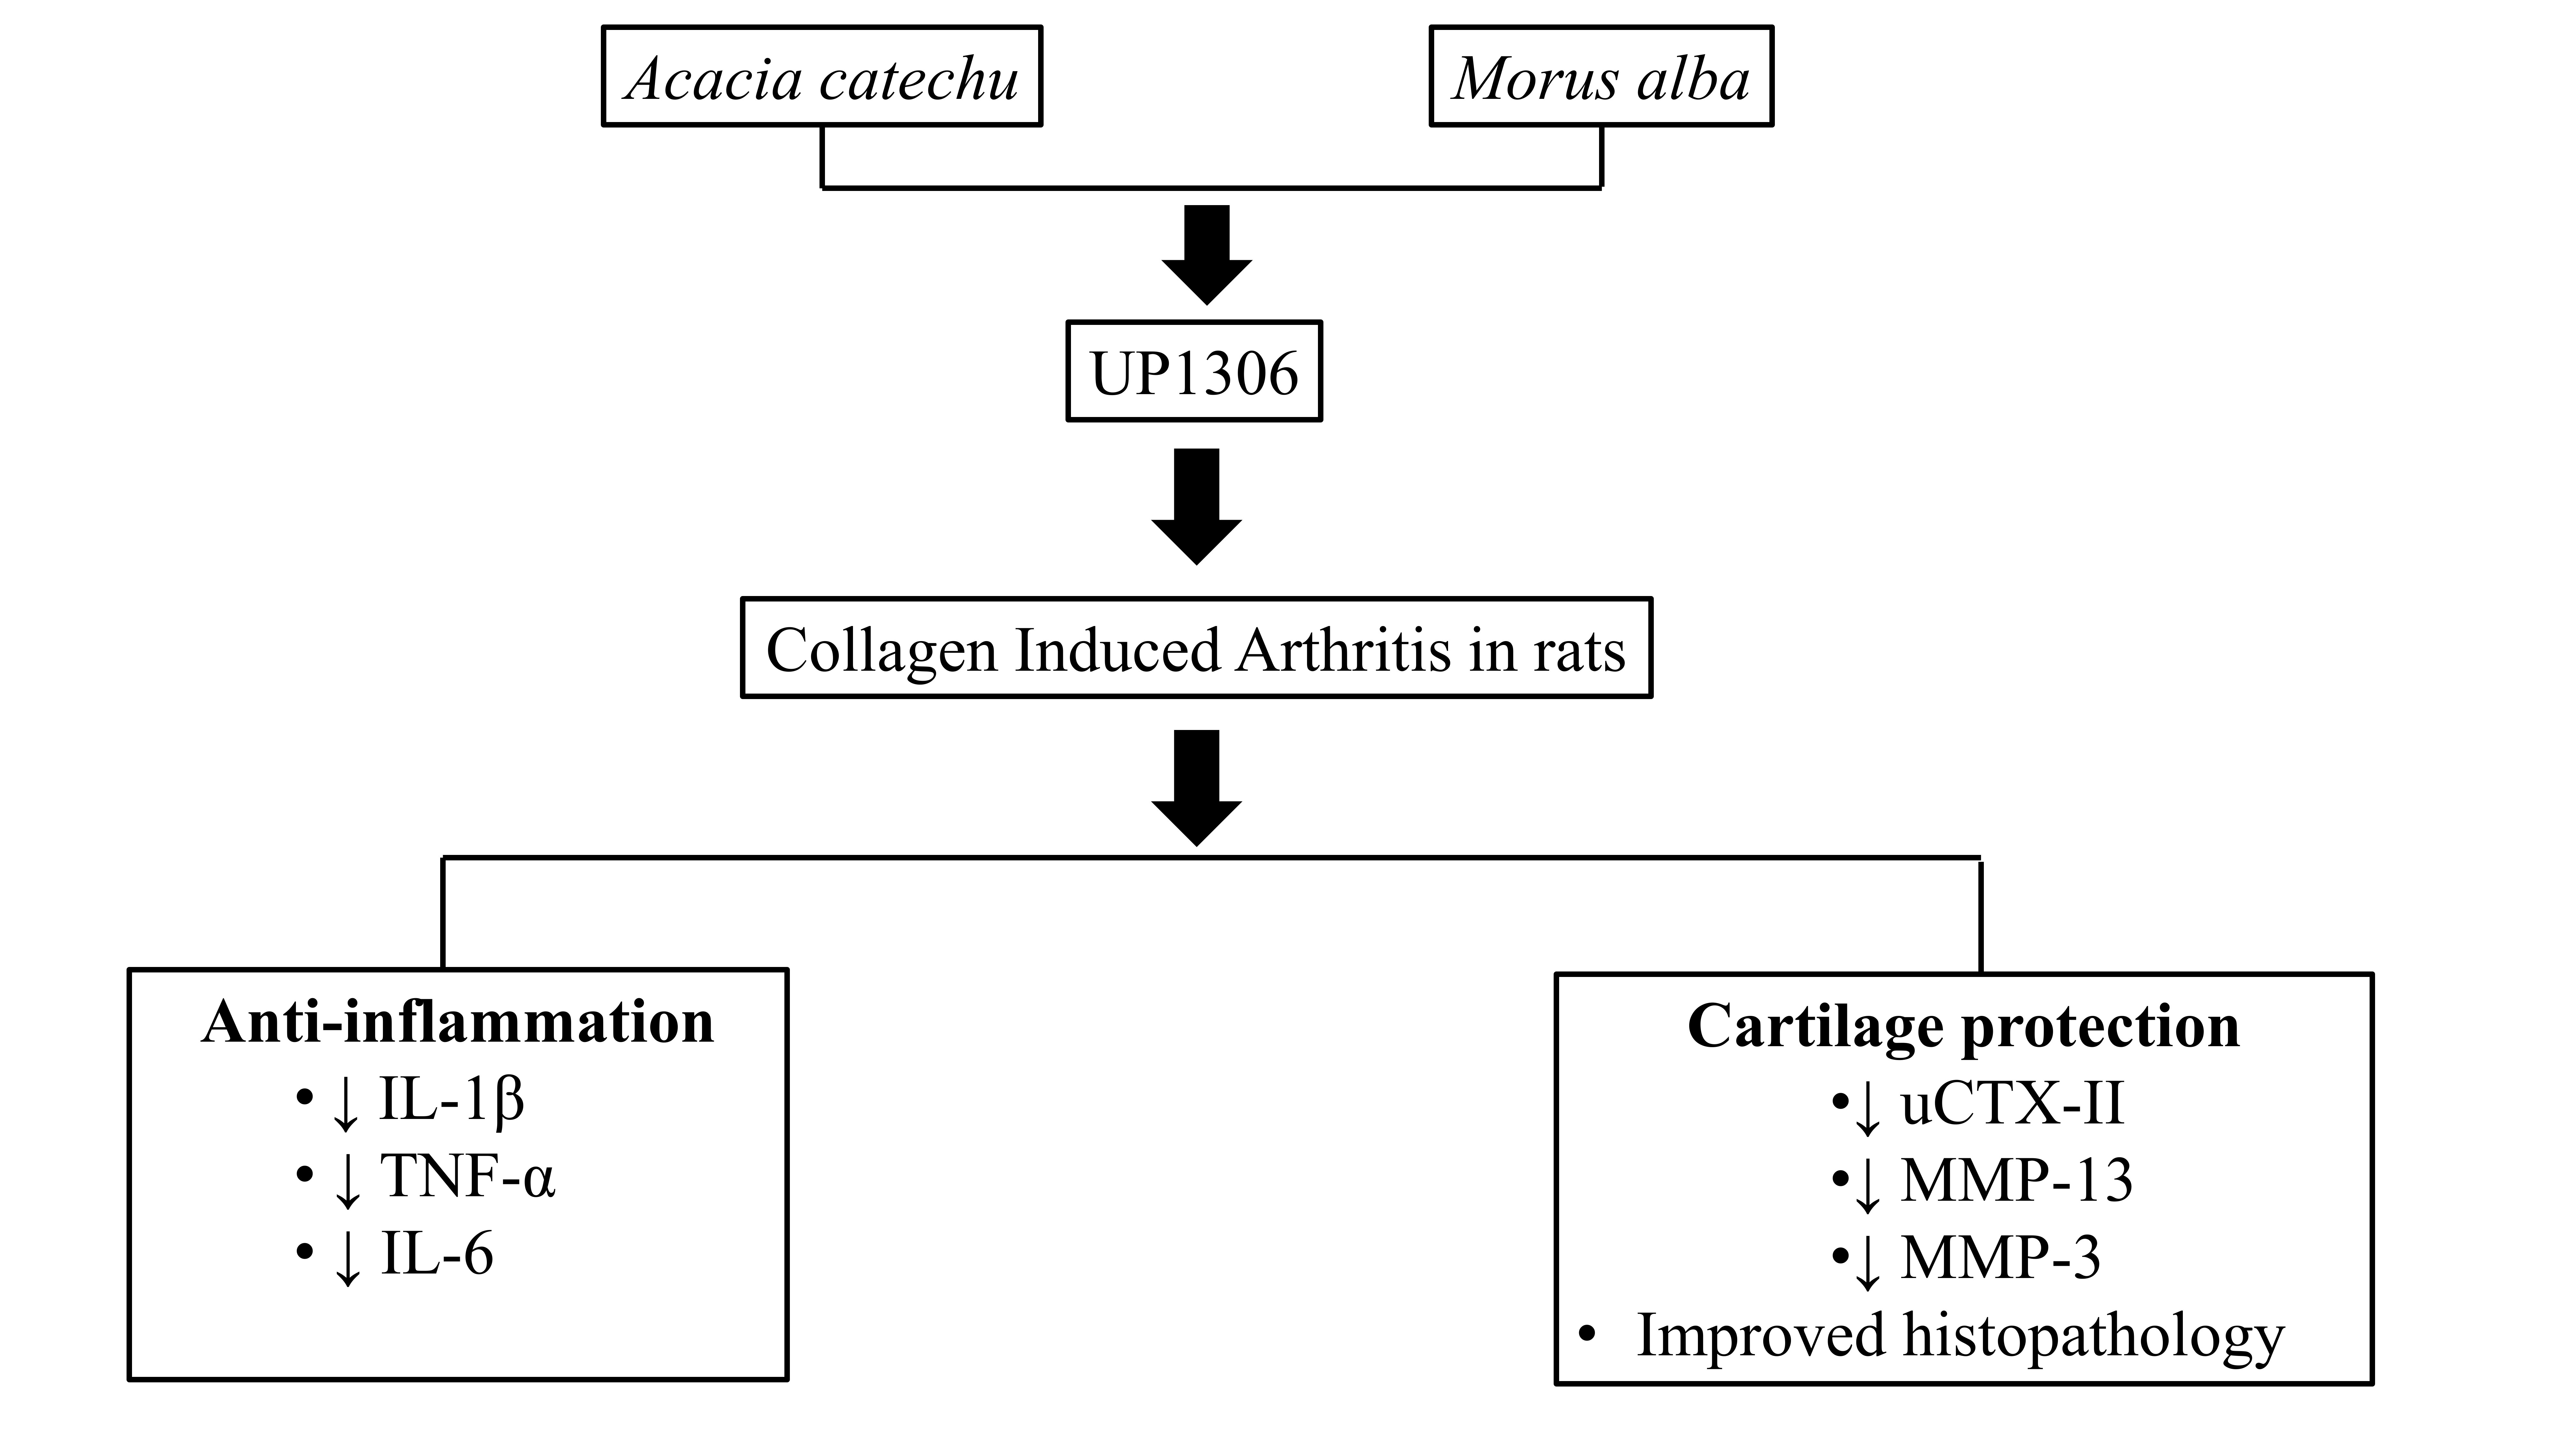
2.1. Composition
2.2. Model Induction and Treatment
2.3. Clinical Observation
2.4. Histopathology
2.5. Assays
2.5.1. Urine CTX-II-
2.5.2. Serum IL-1β, TNF-α and IL-6 ELISA
2.5.3. Synovial MMP-13 and Serum MMP-3 ELISA
2.6. Statistical Analysis
3. Results
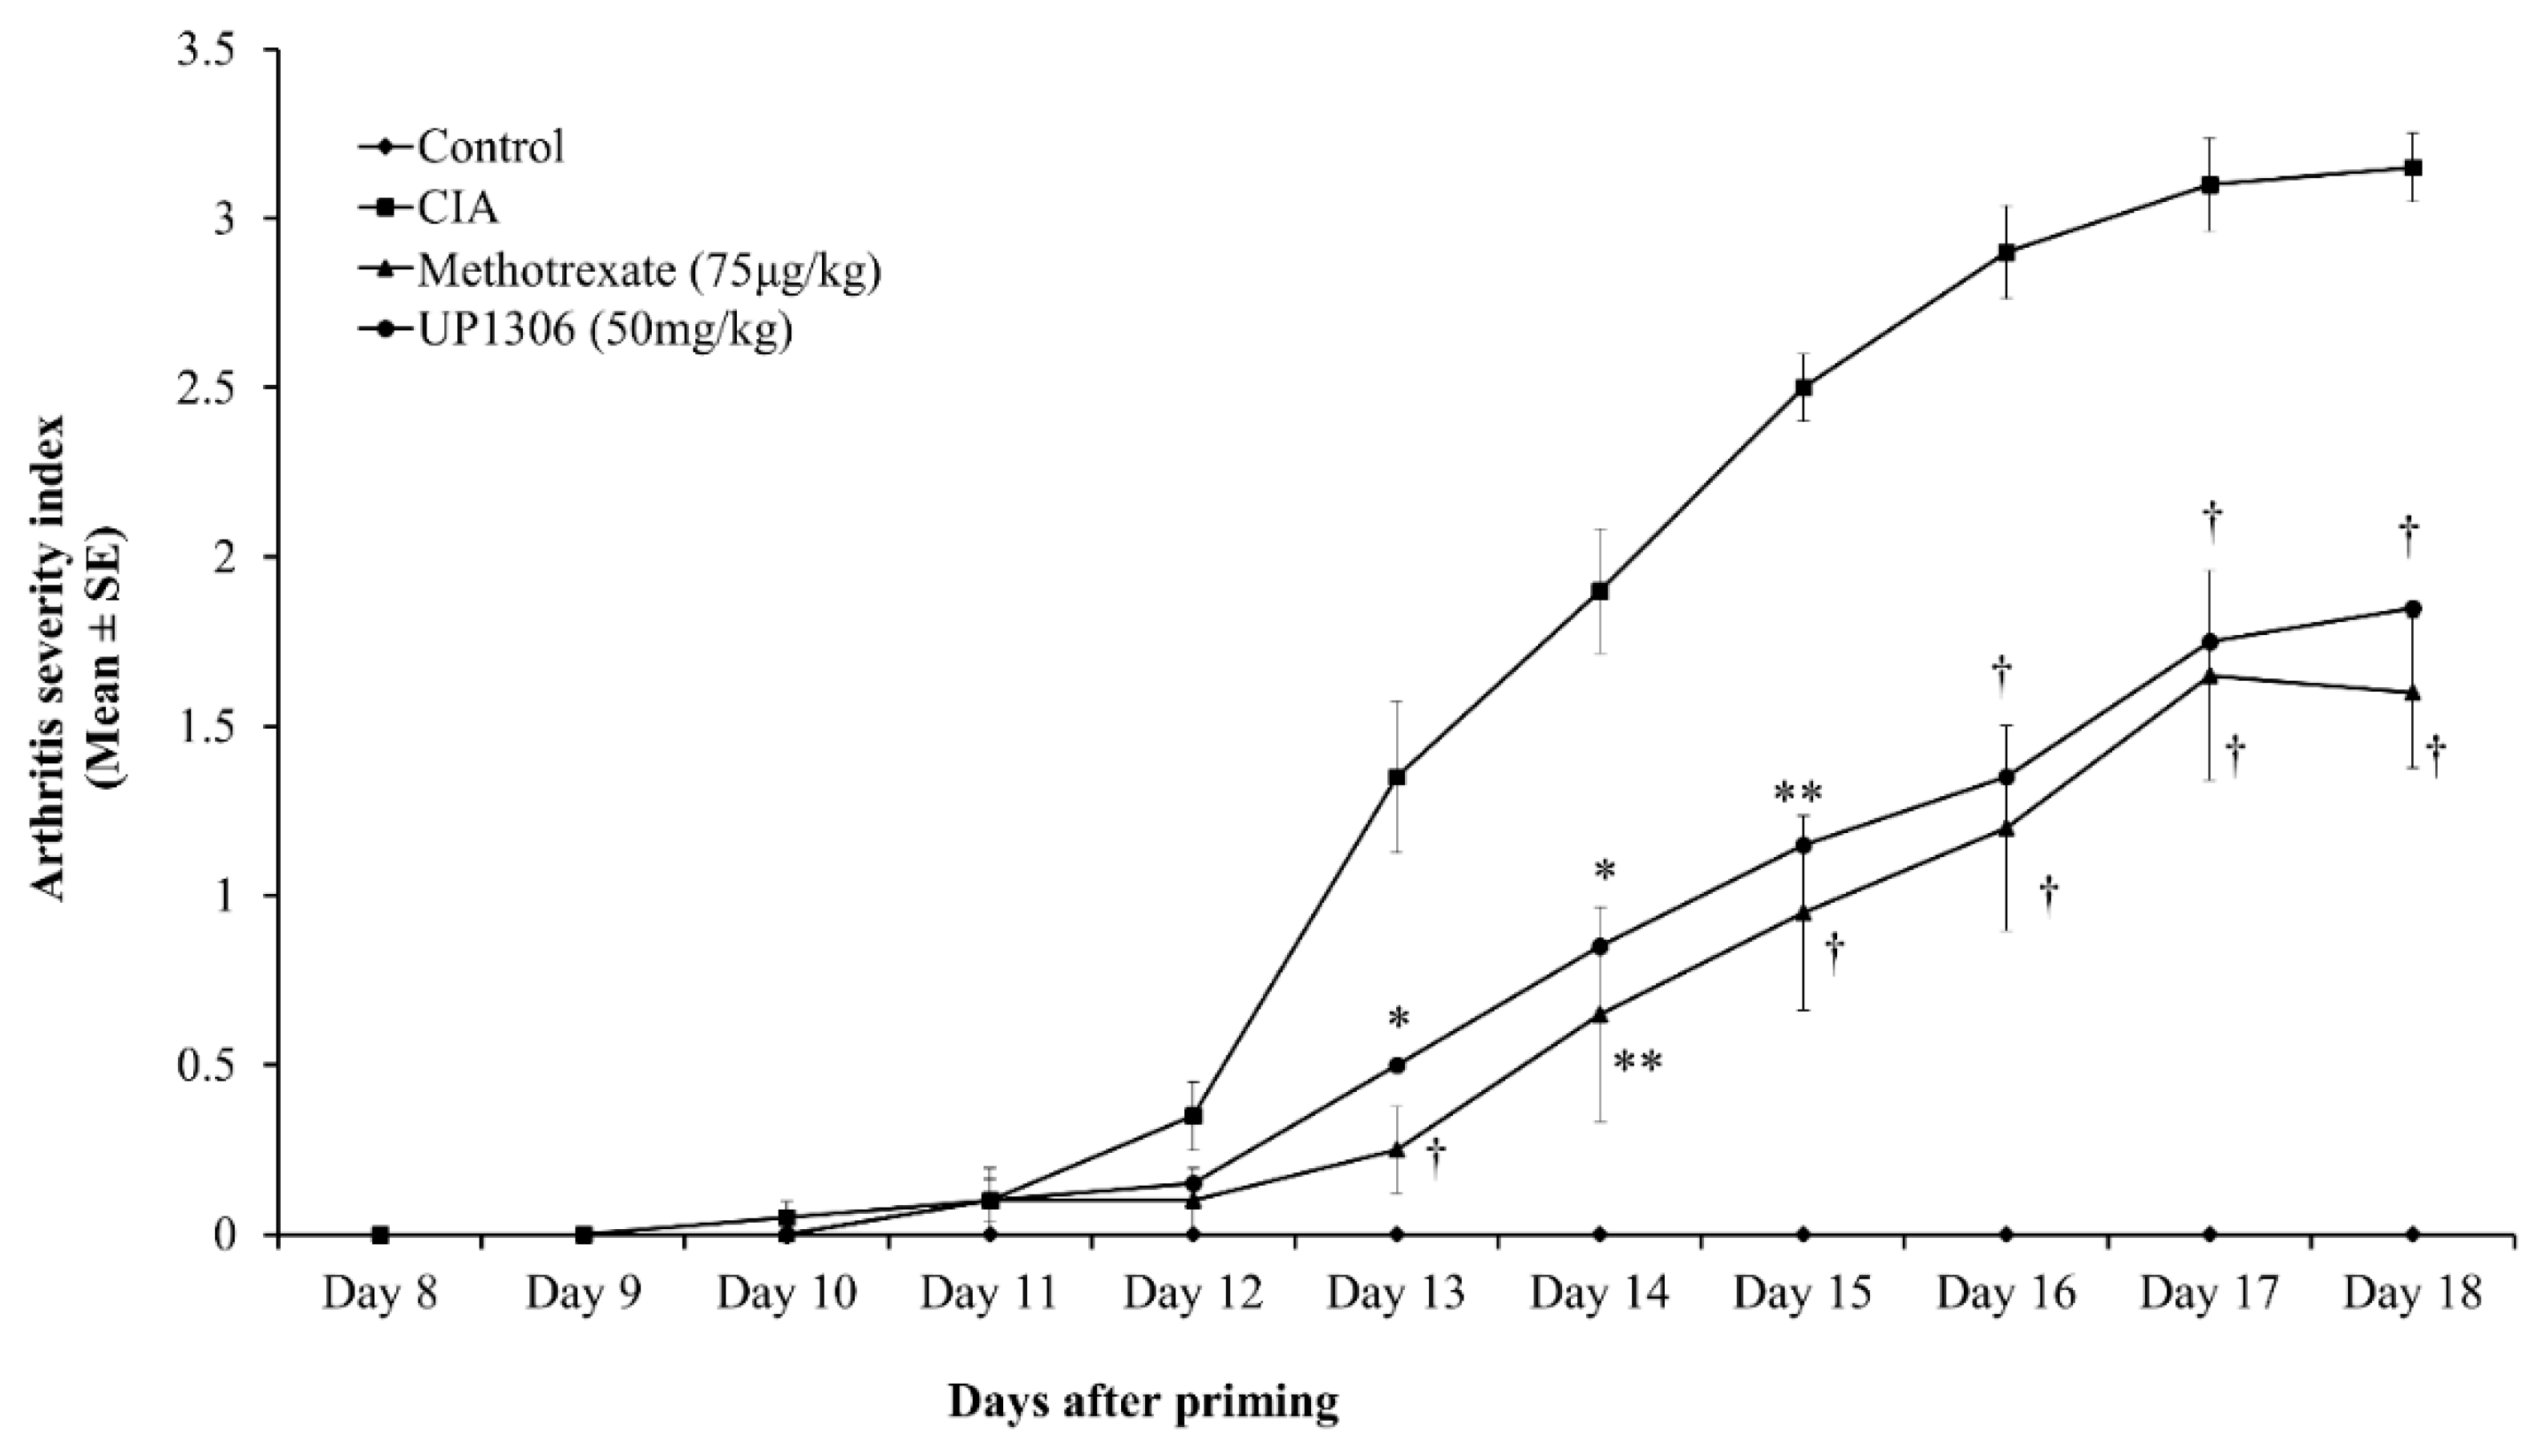
3.1. Arthritis Severity Index
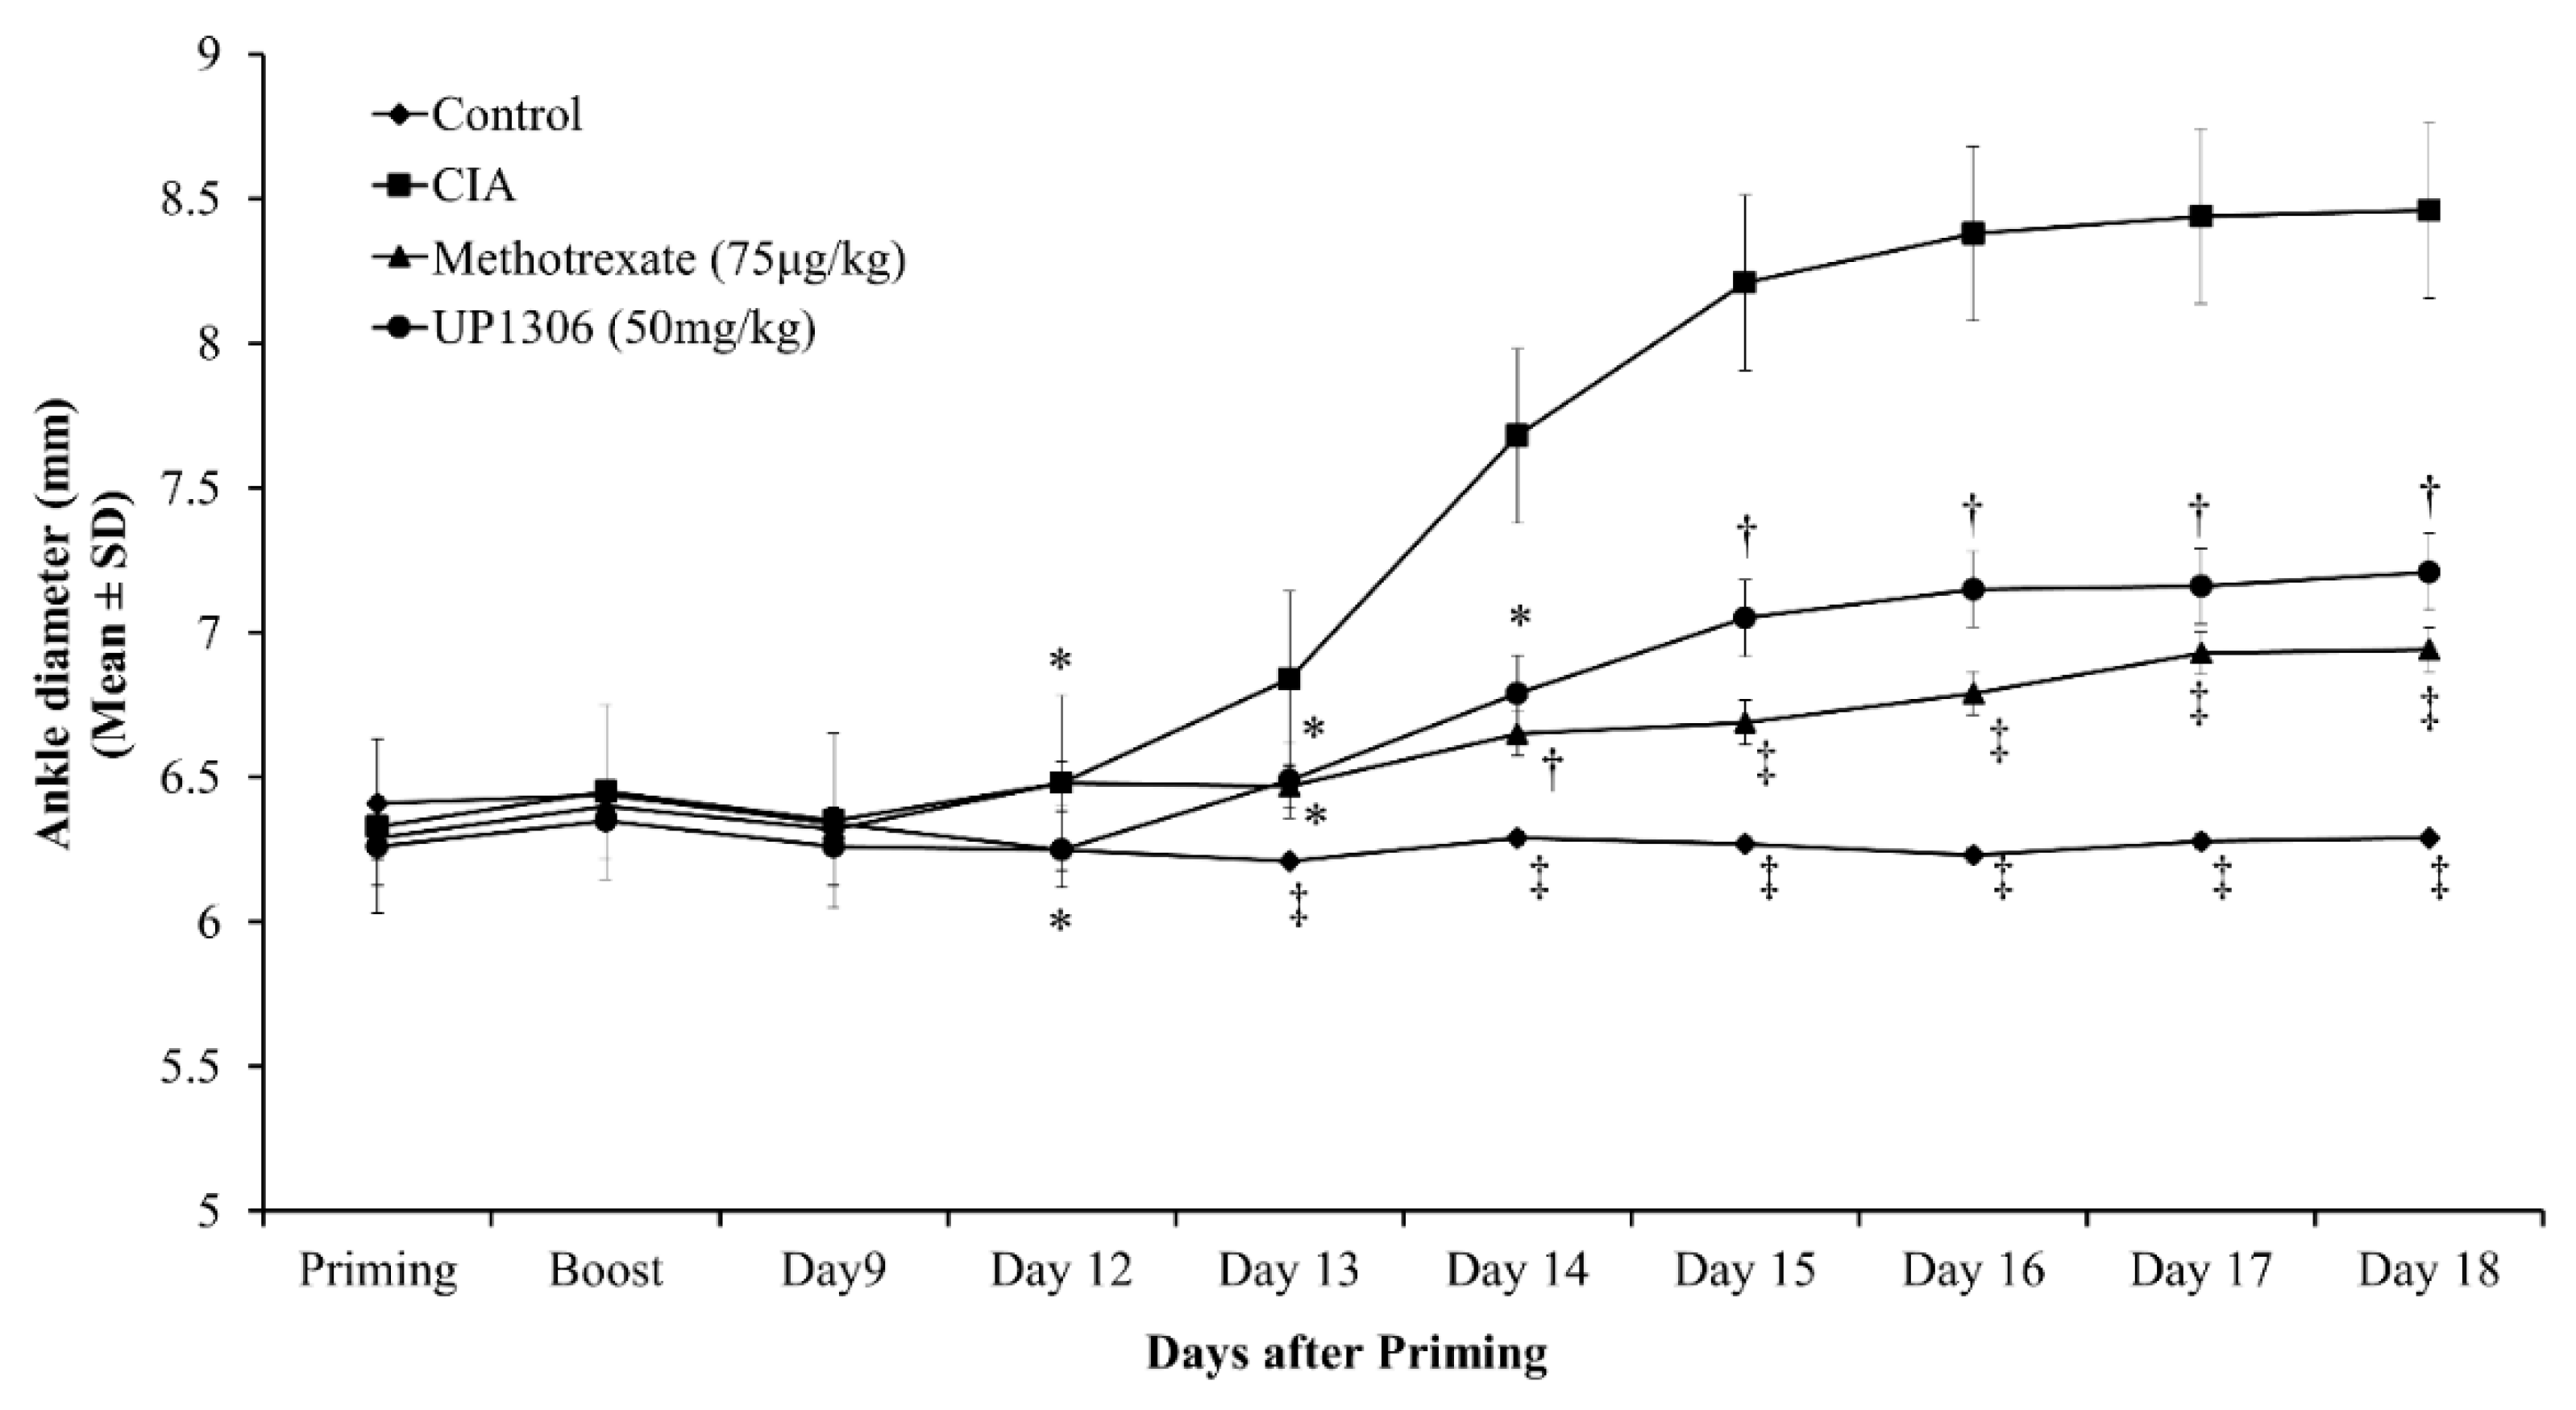
3.2. Ankle Diameter
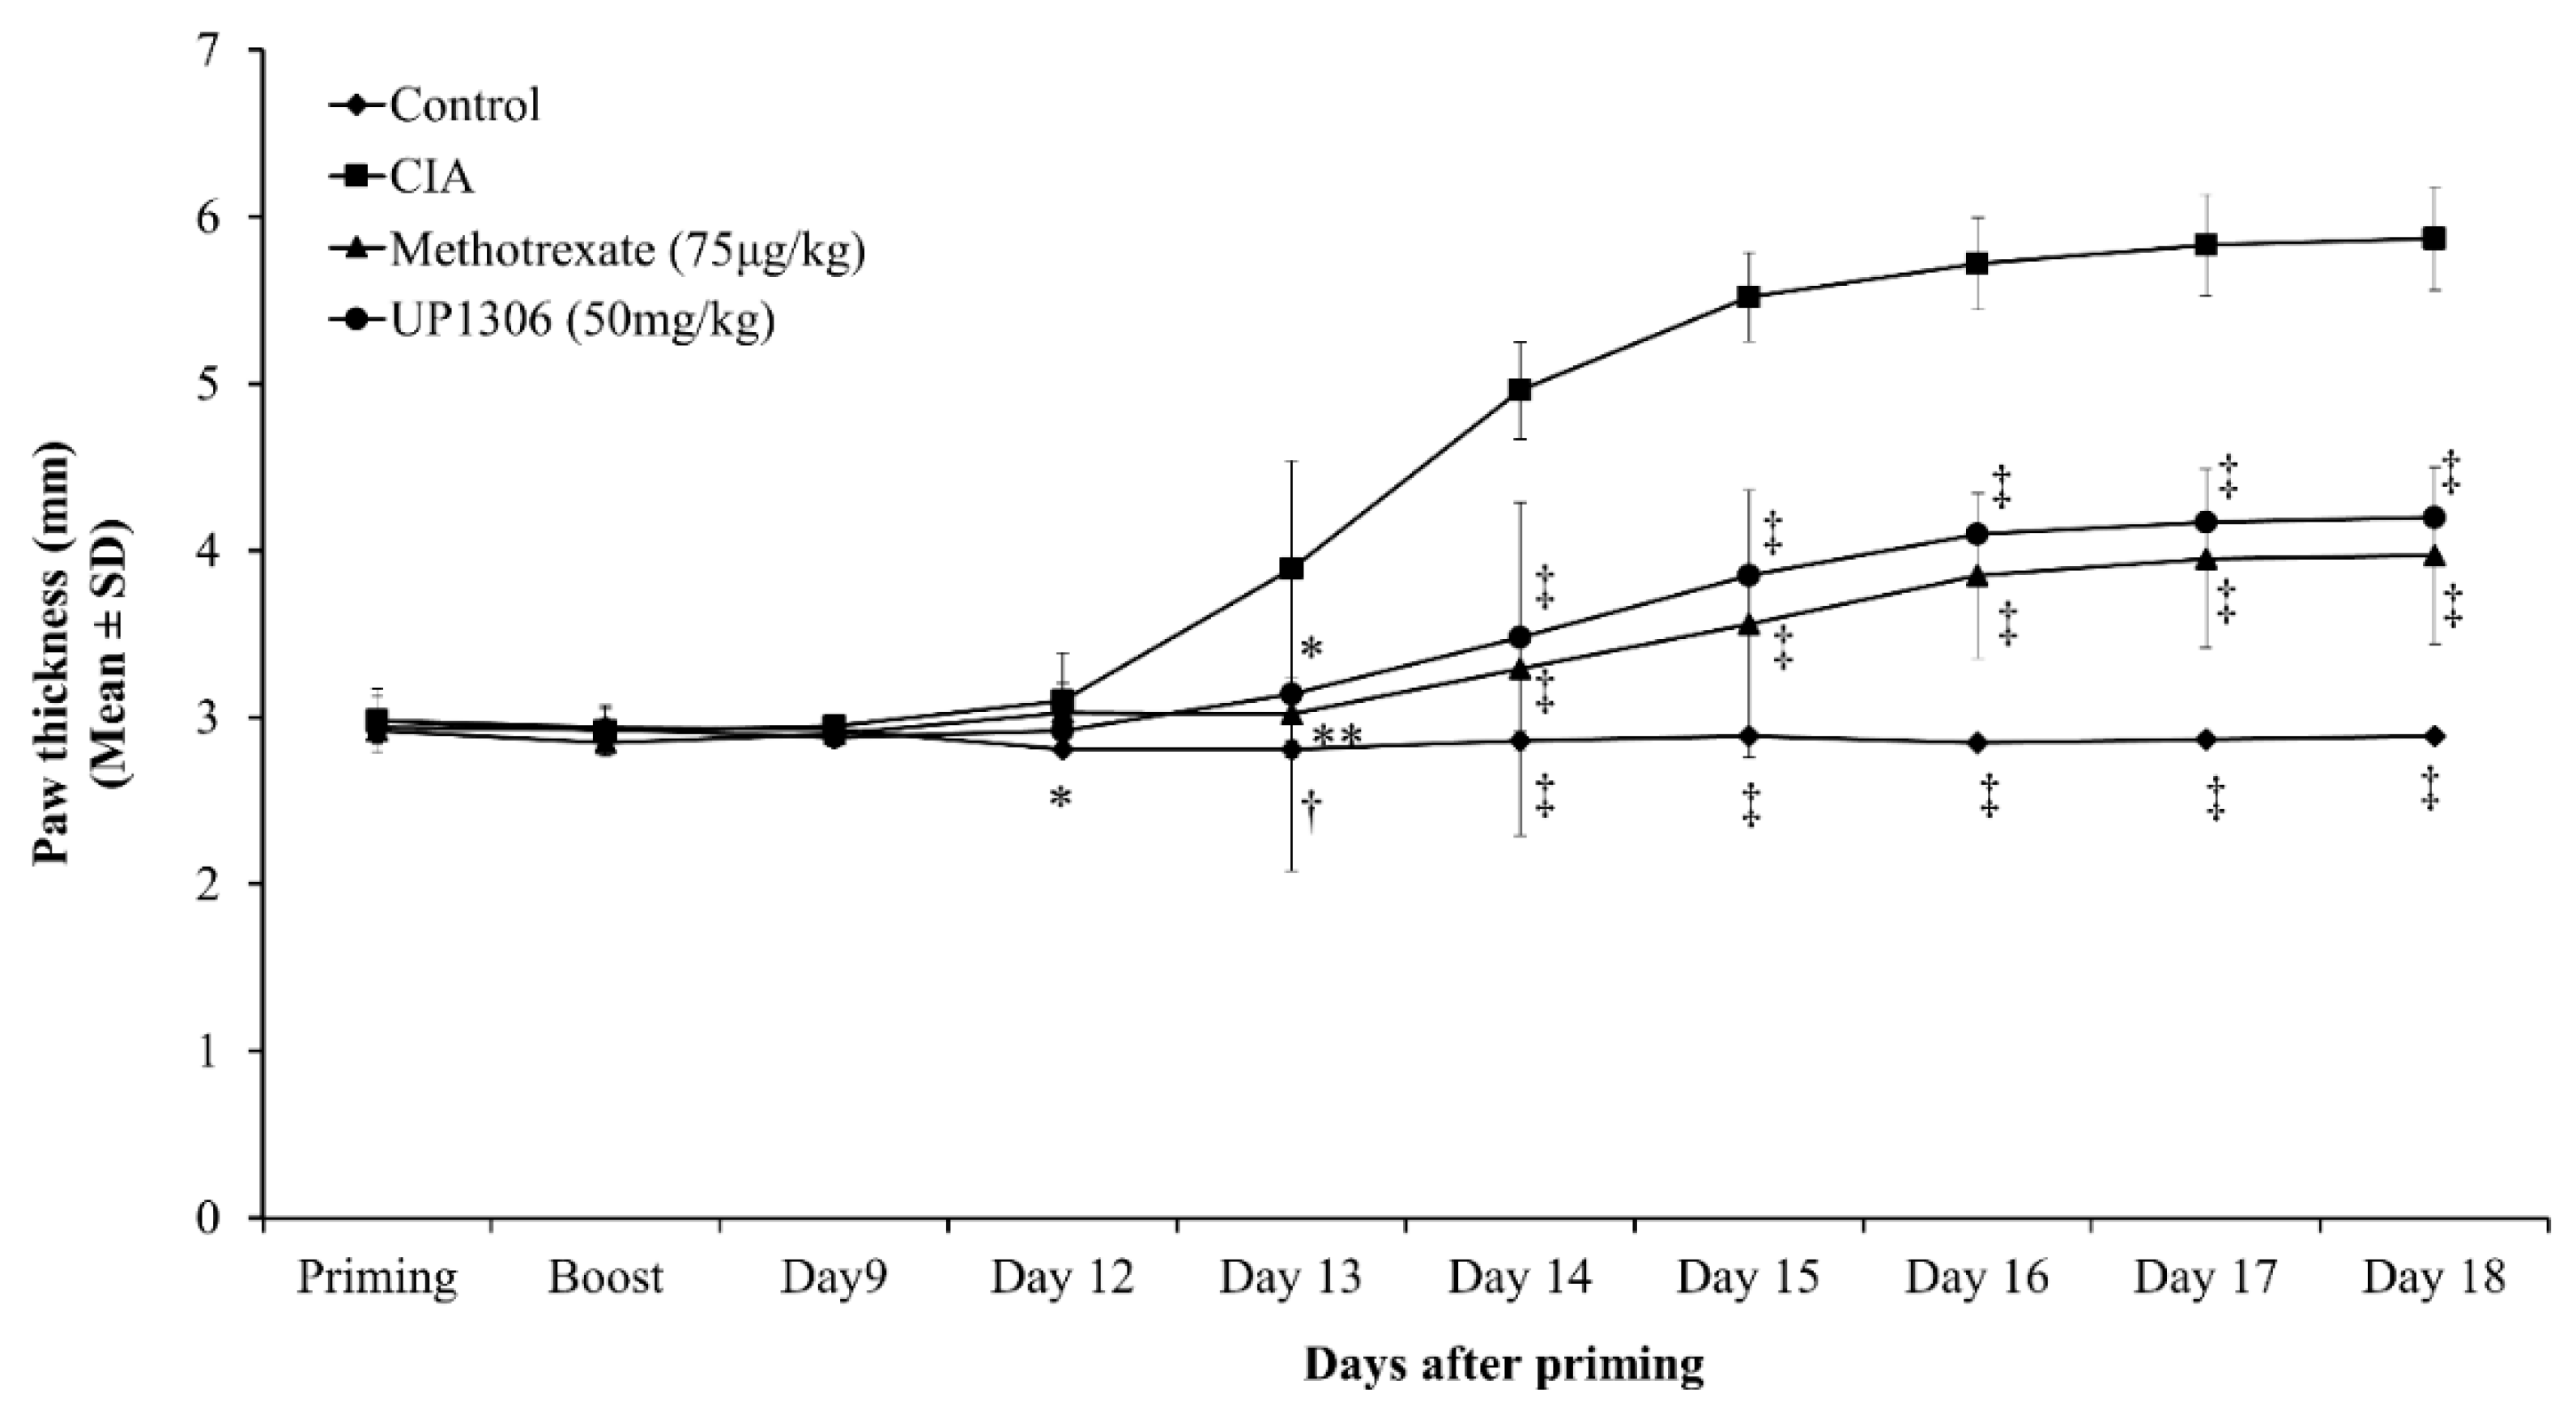
3.3. Paw Thickness
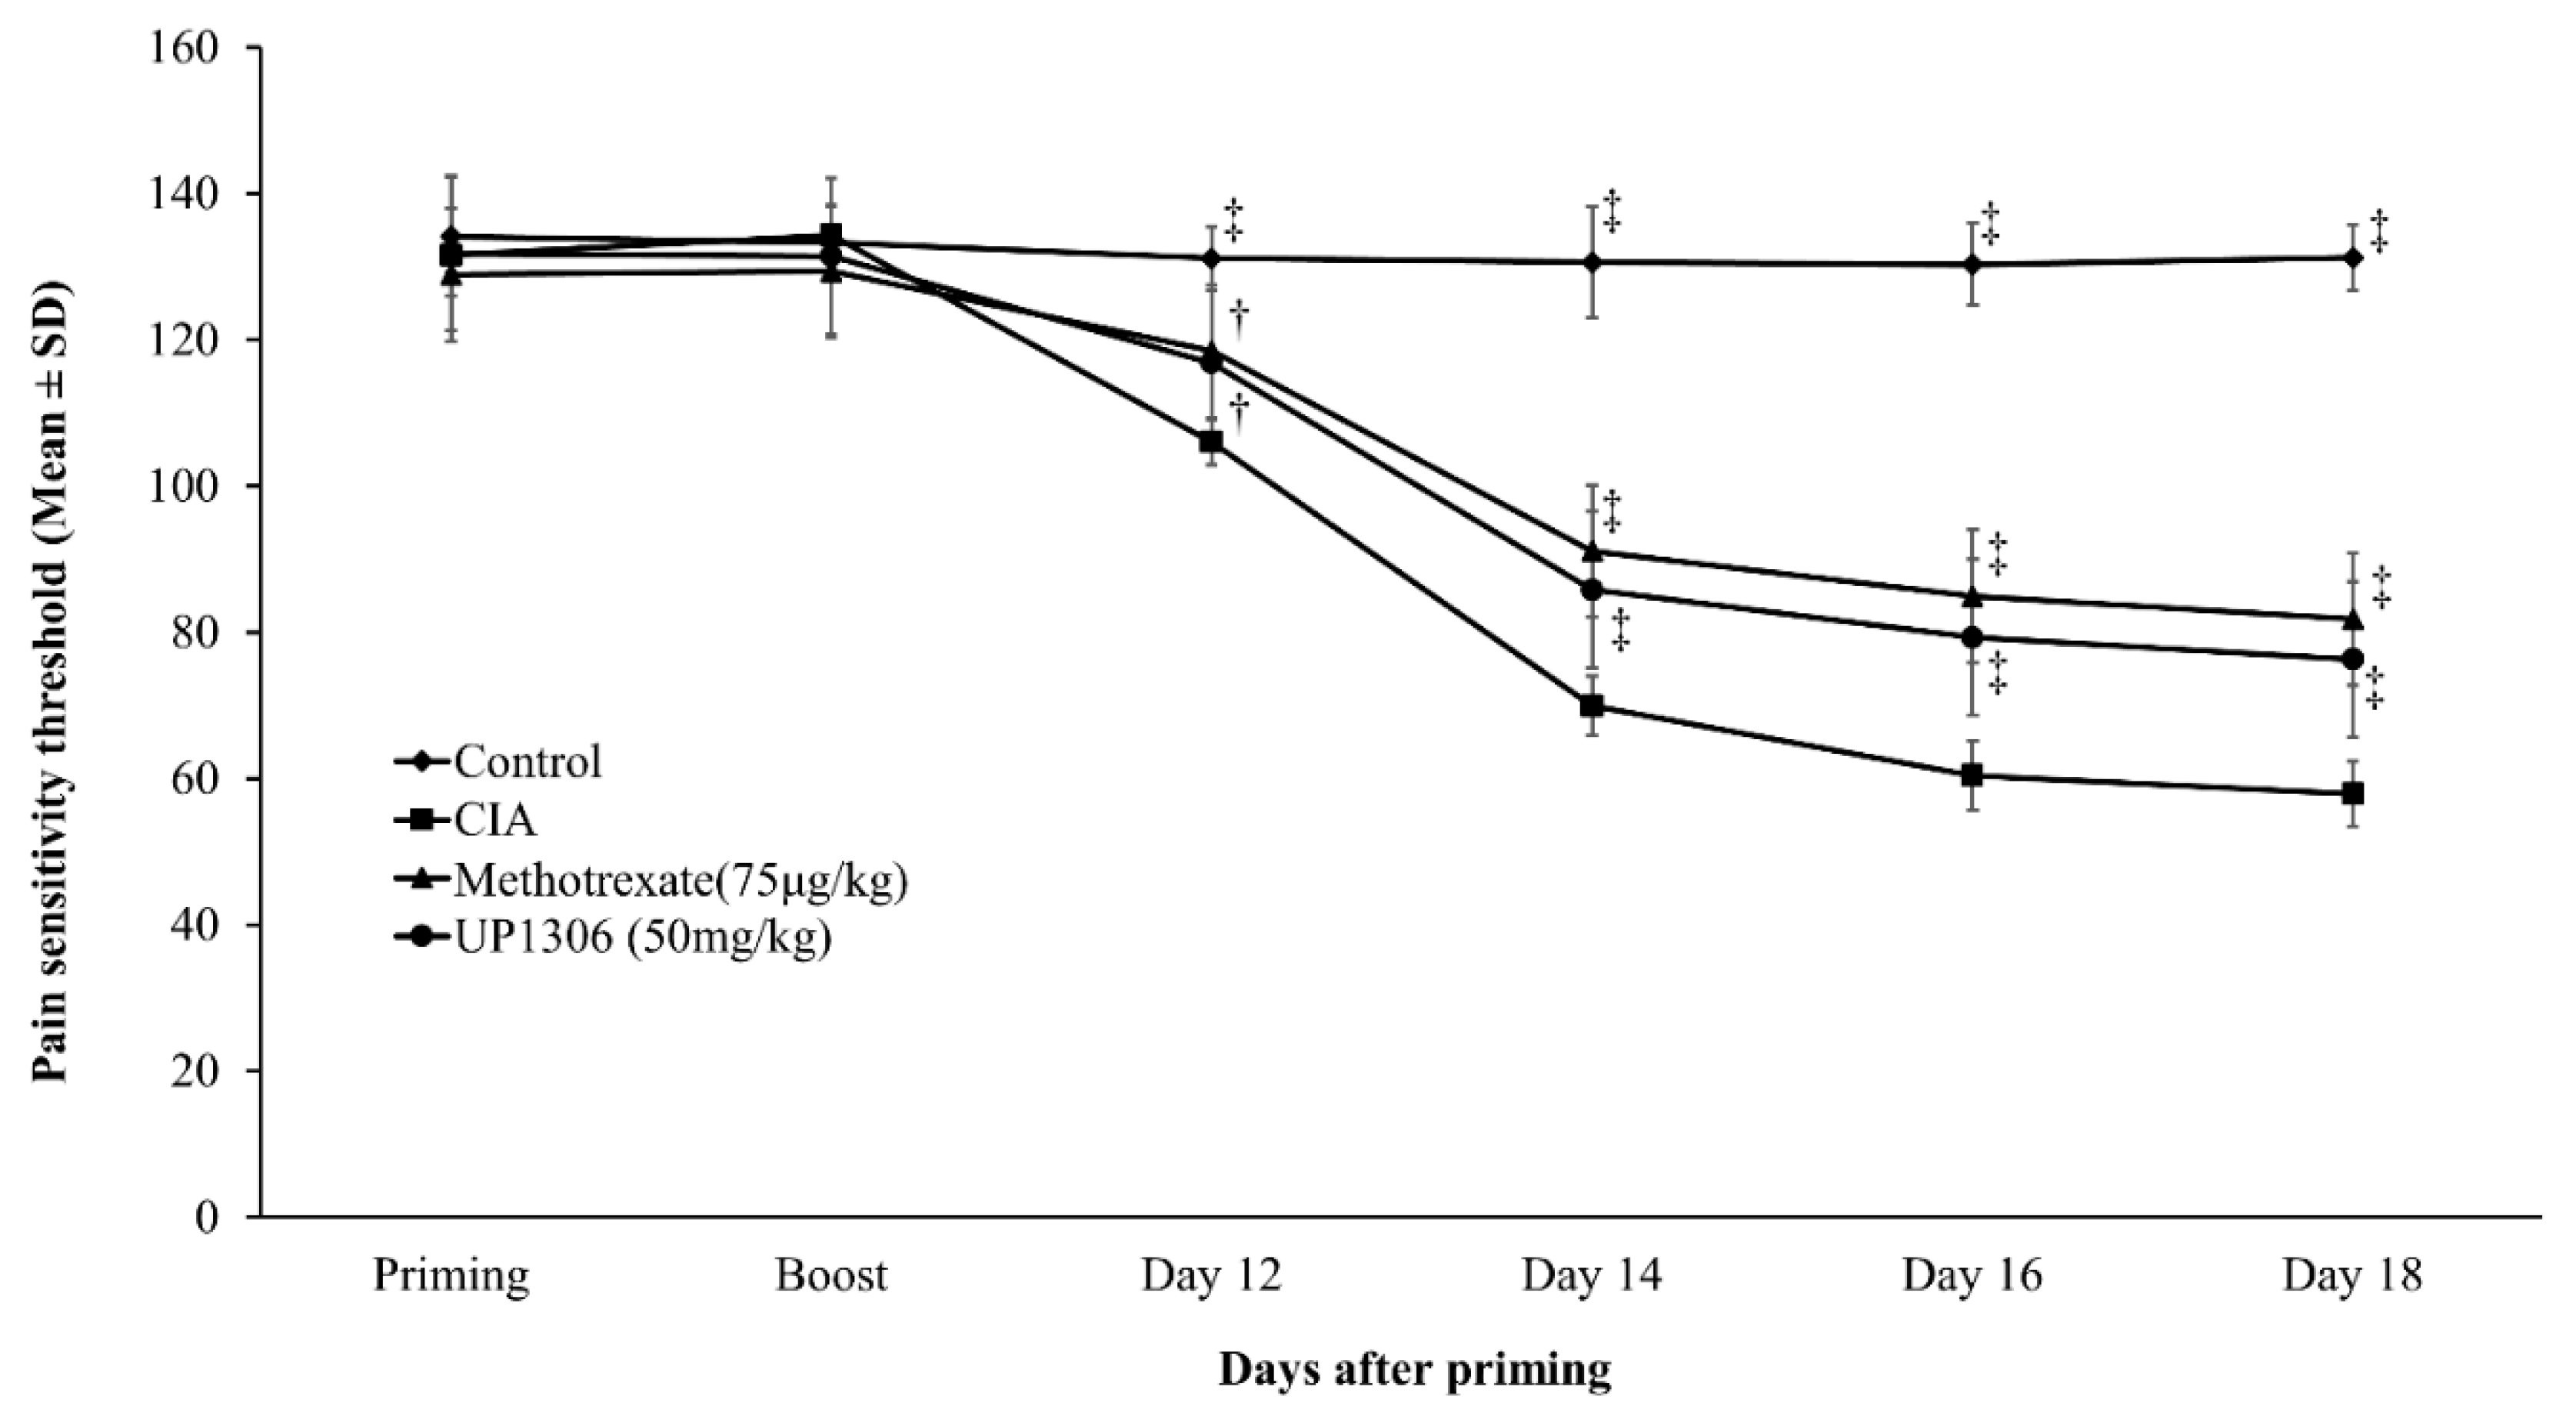
3.4. Pain Sensitivity
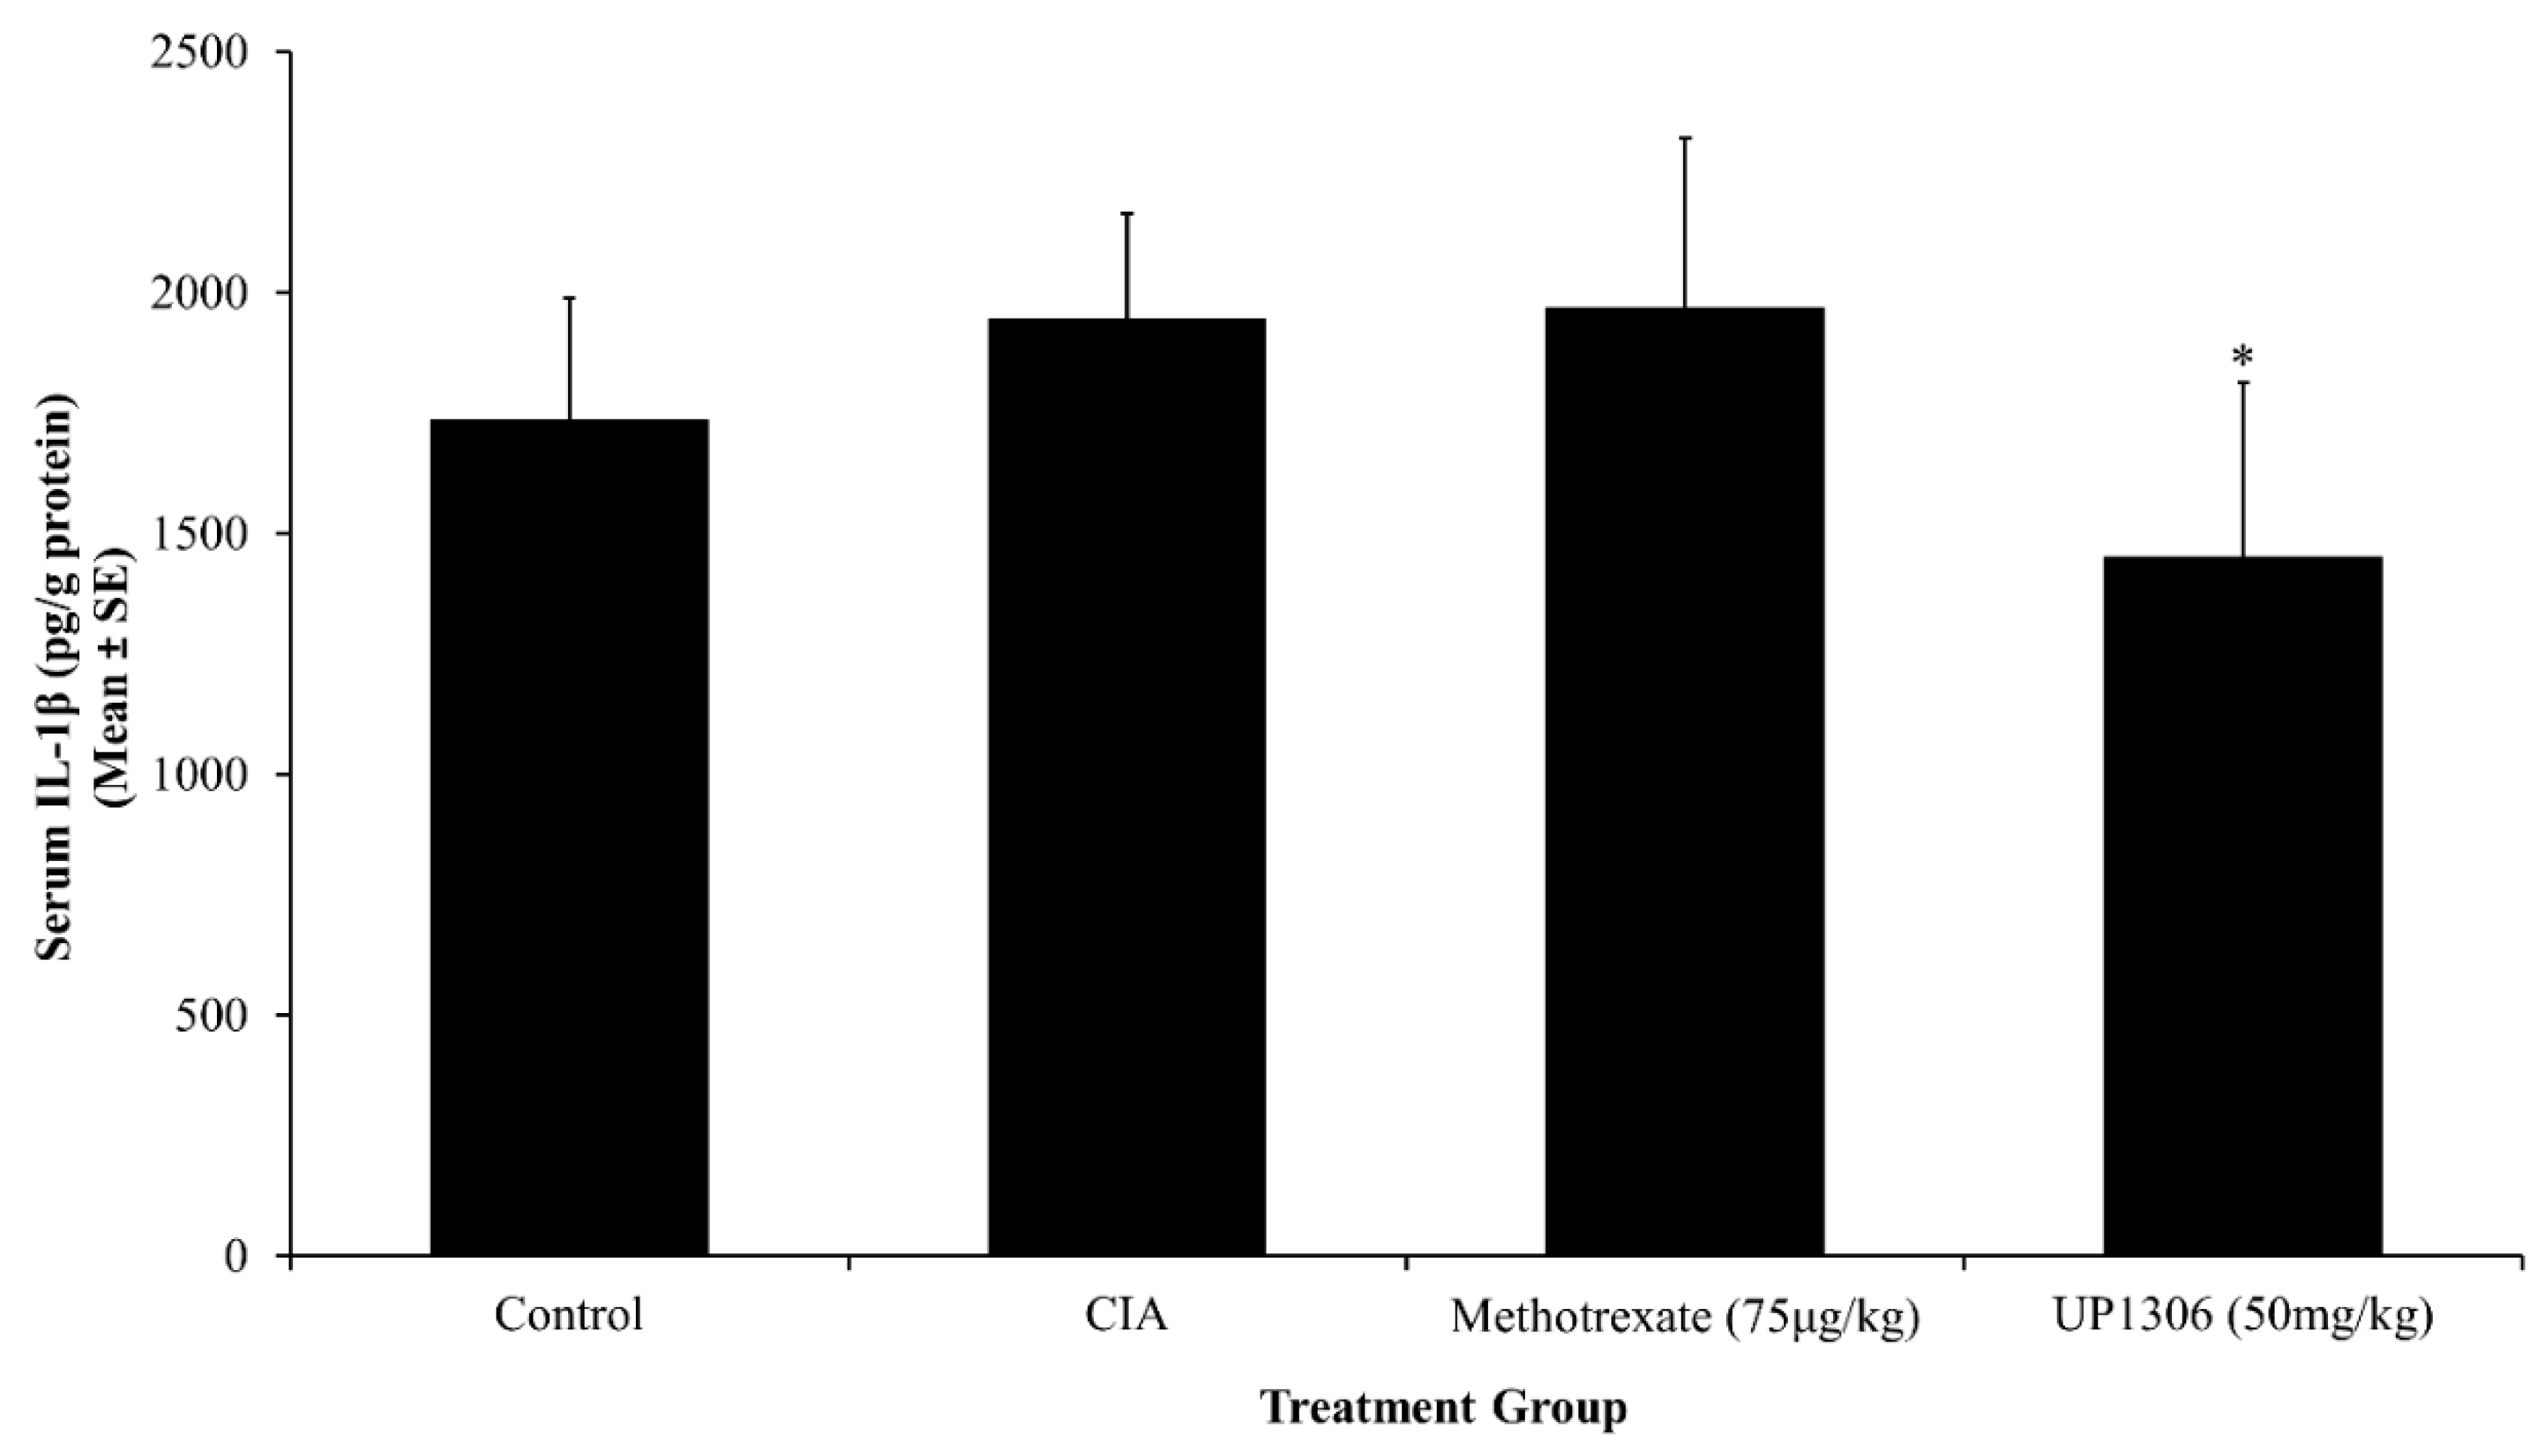
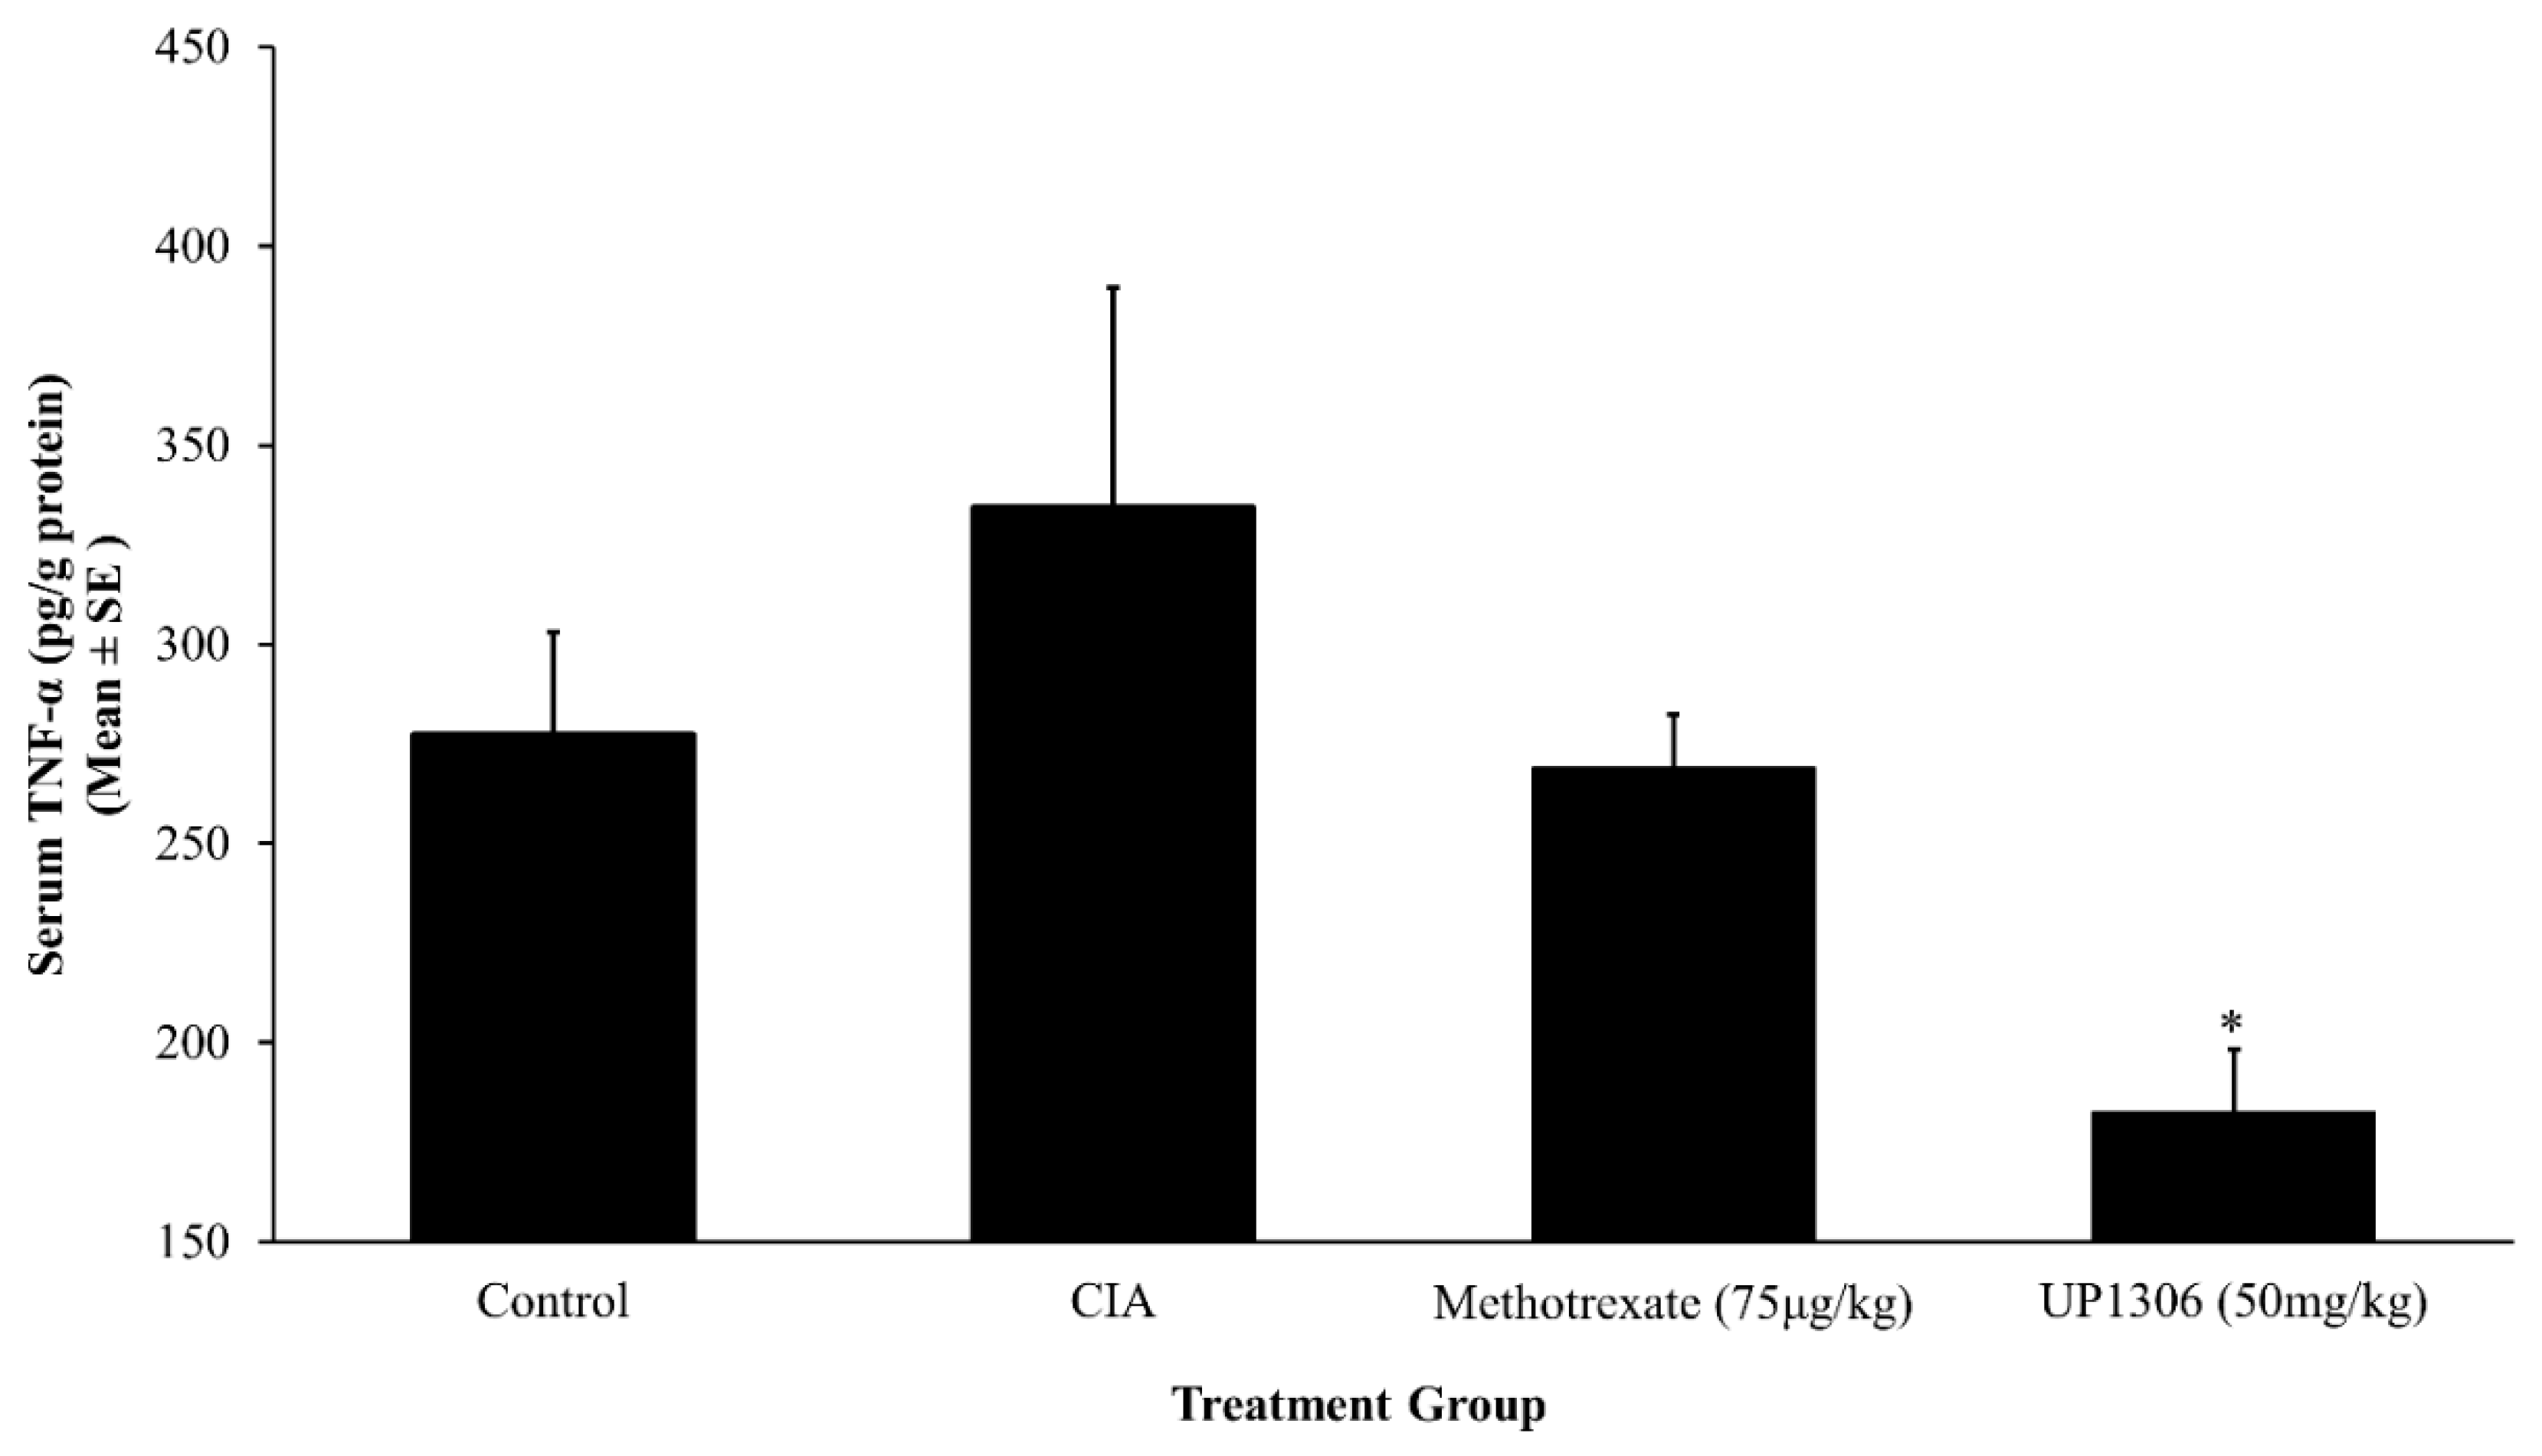
3.5. Serum Pro-Inflammatory Cytokines
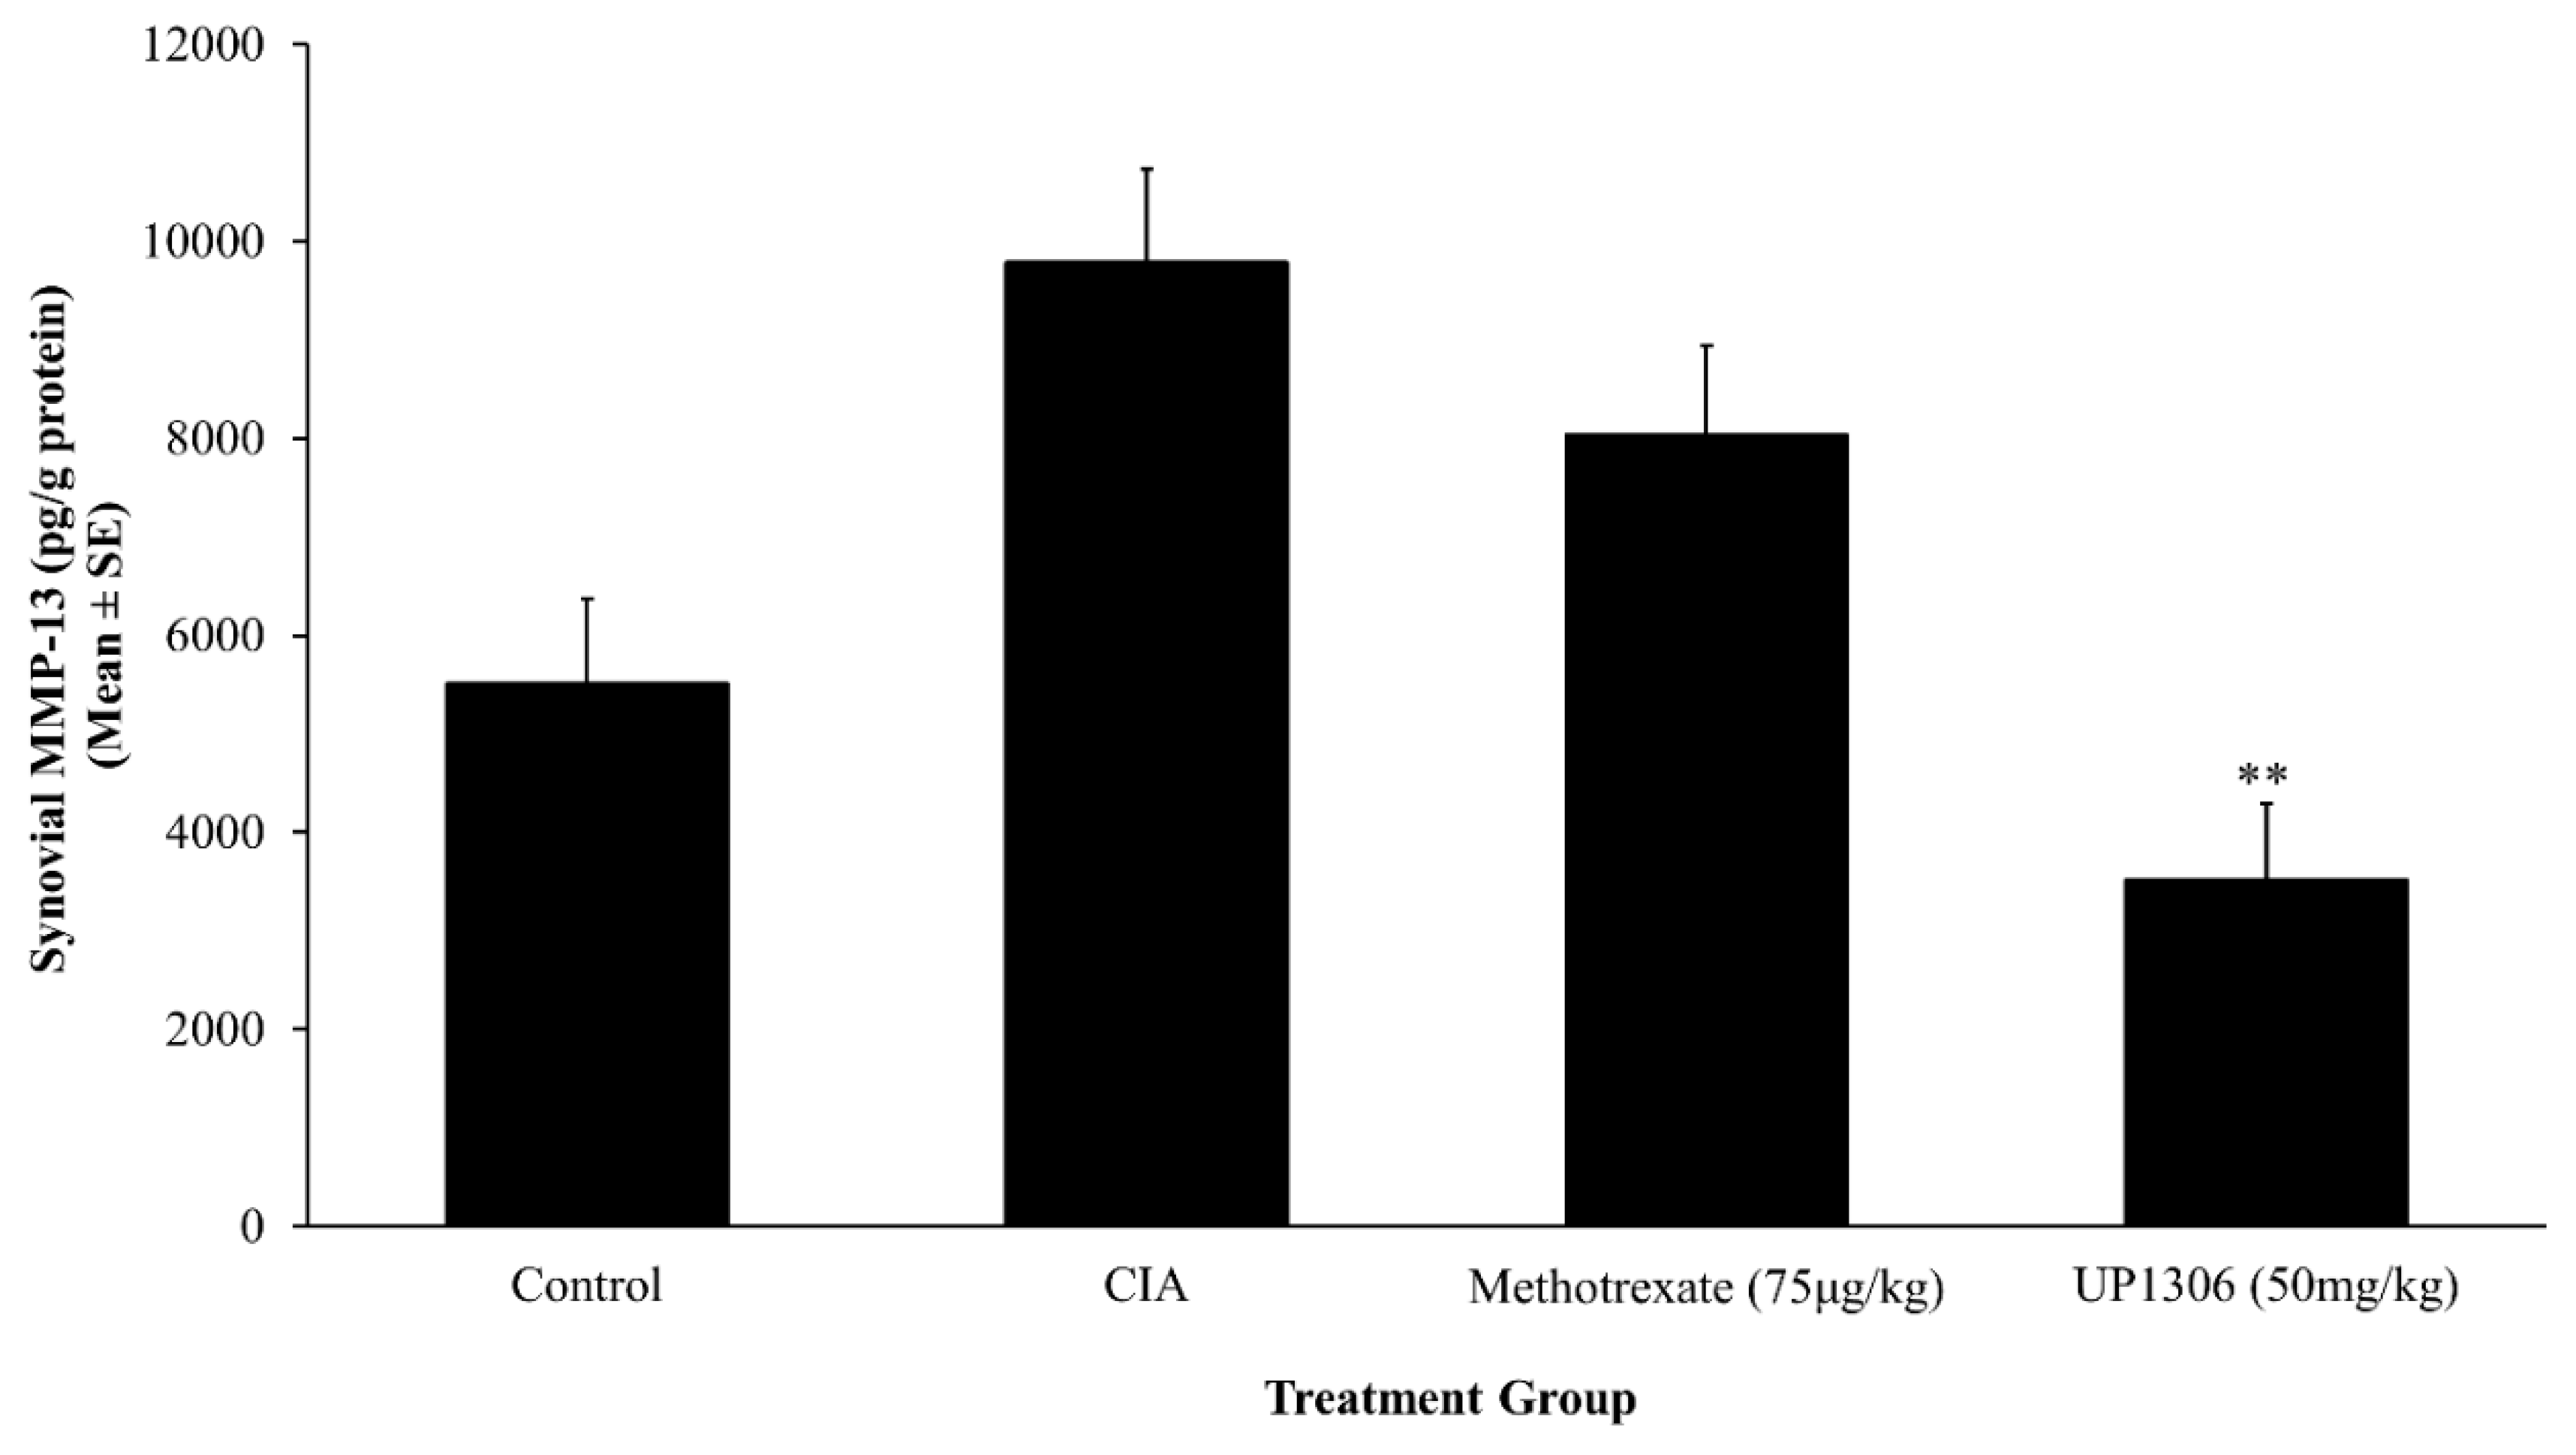
3.6. Synovial MMP-13
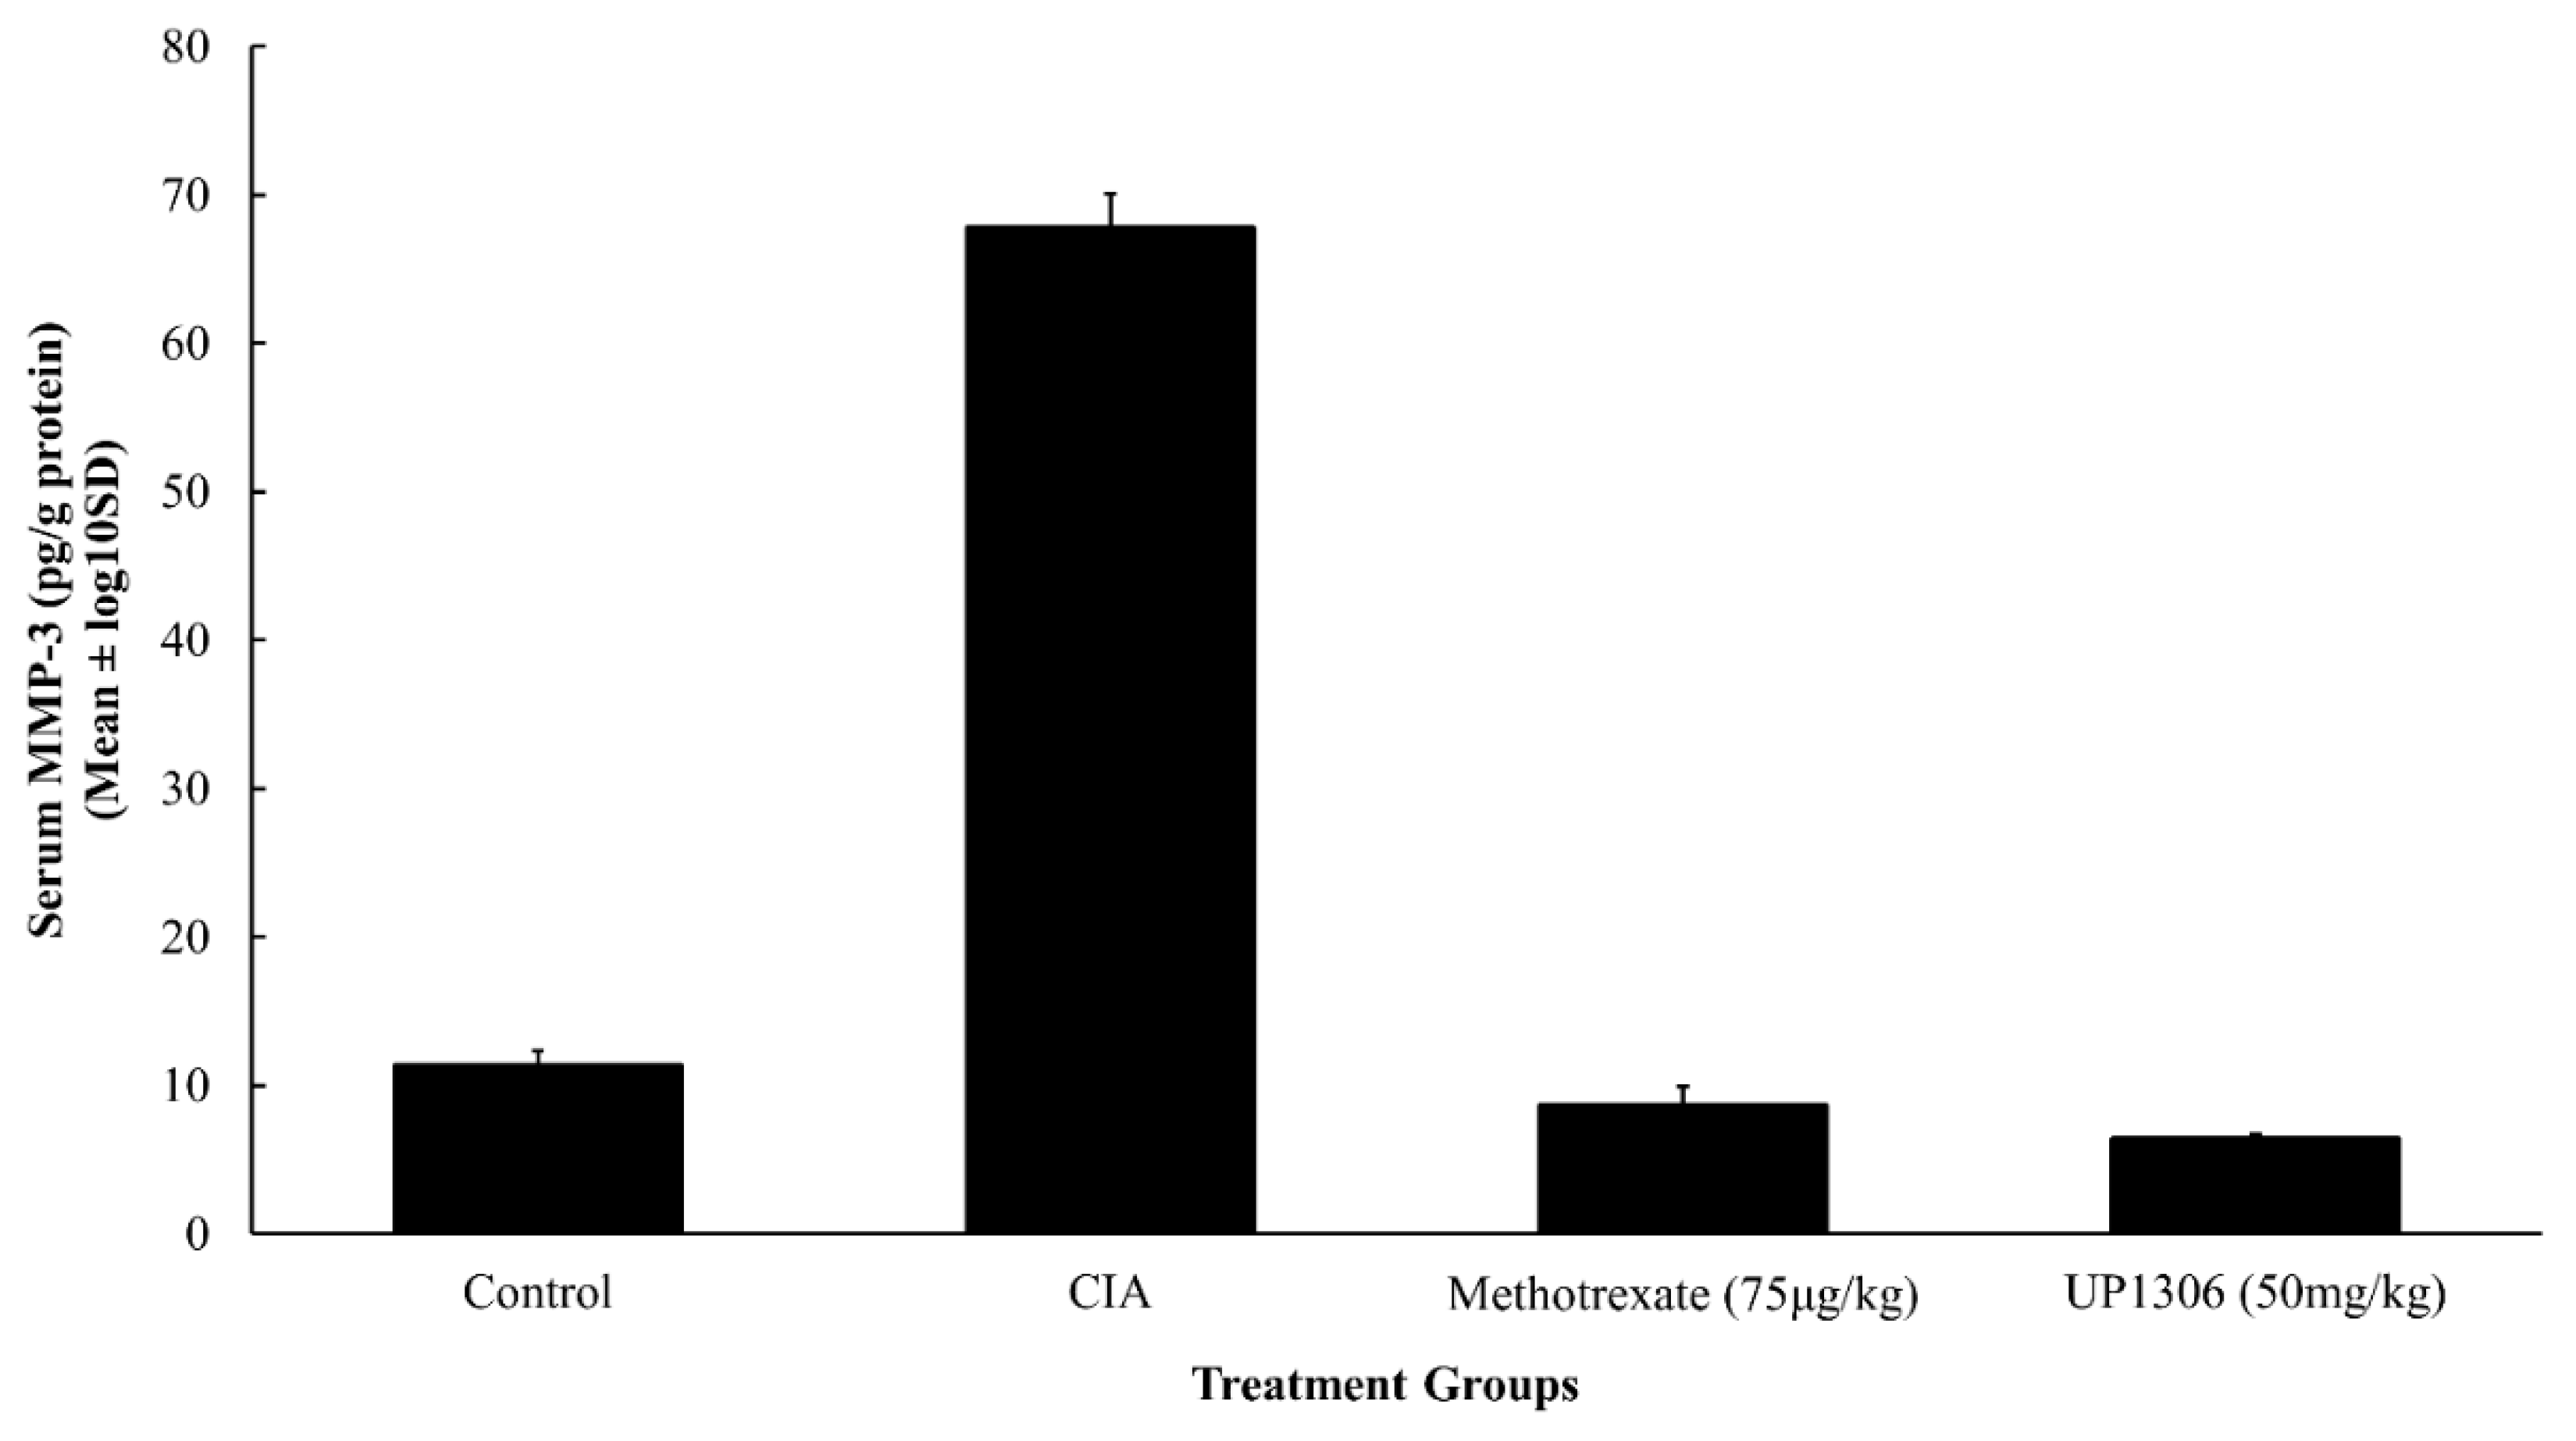
3.7. Serum MMP-3
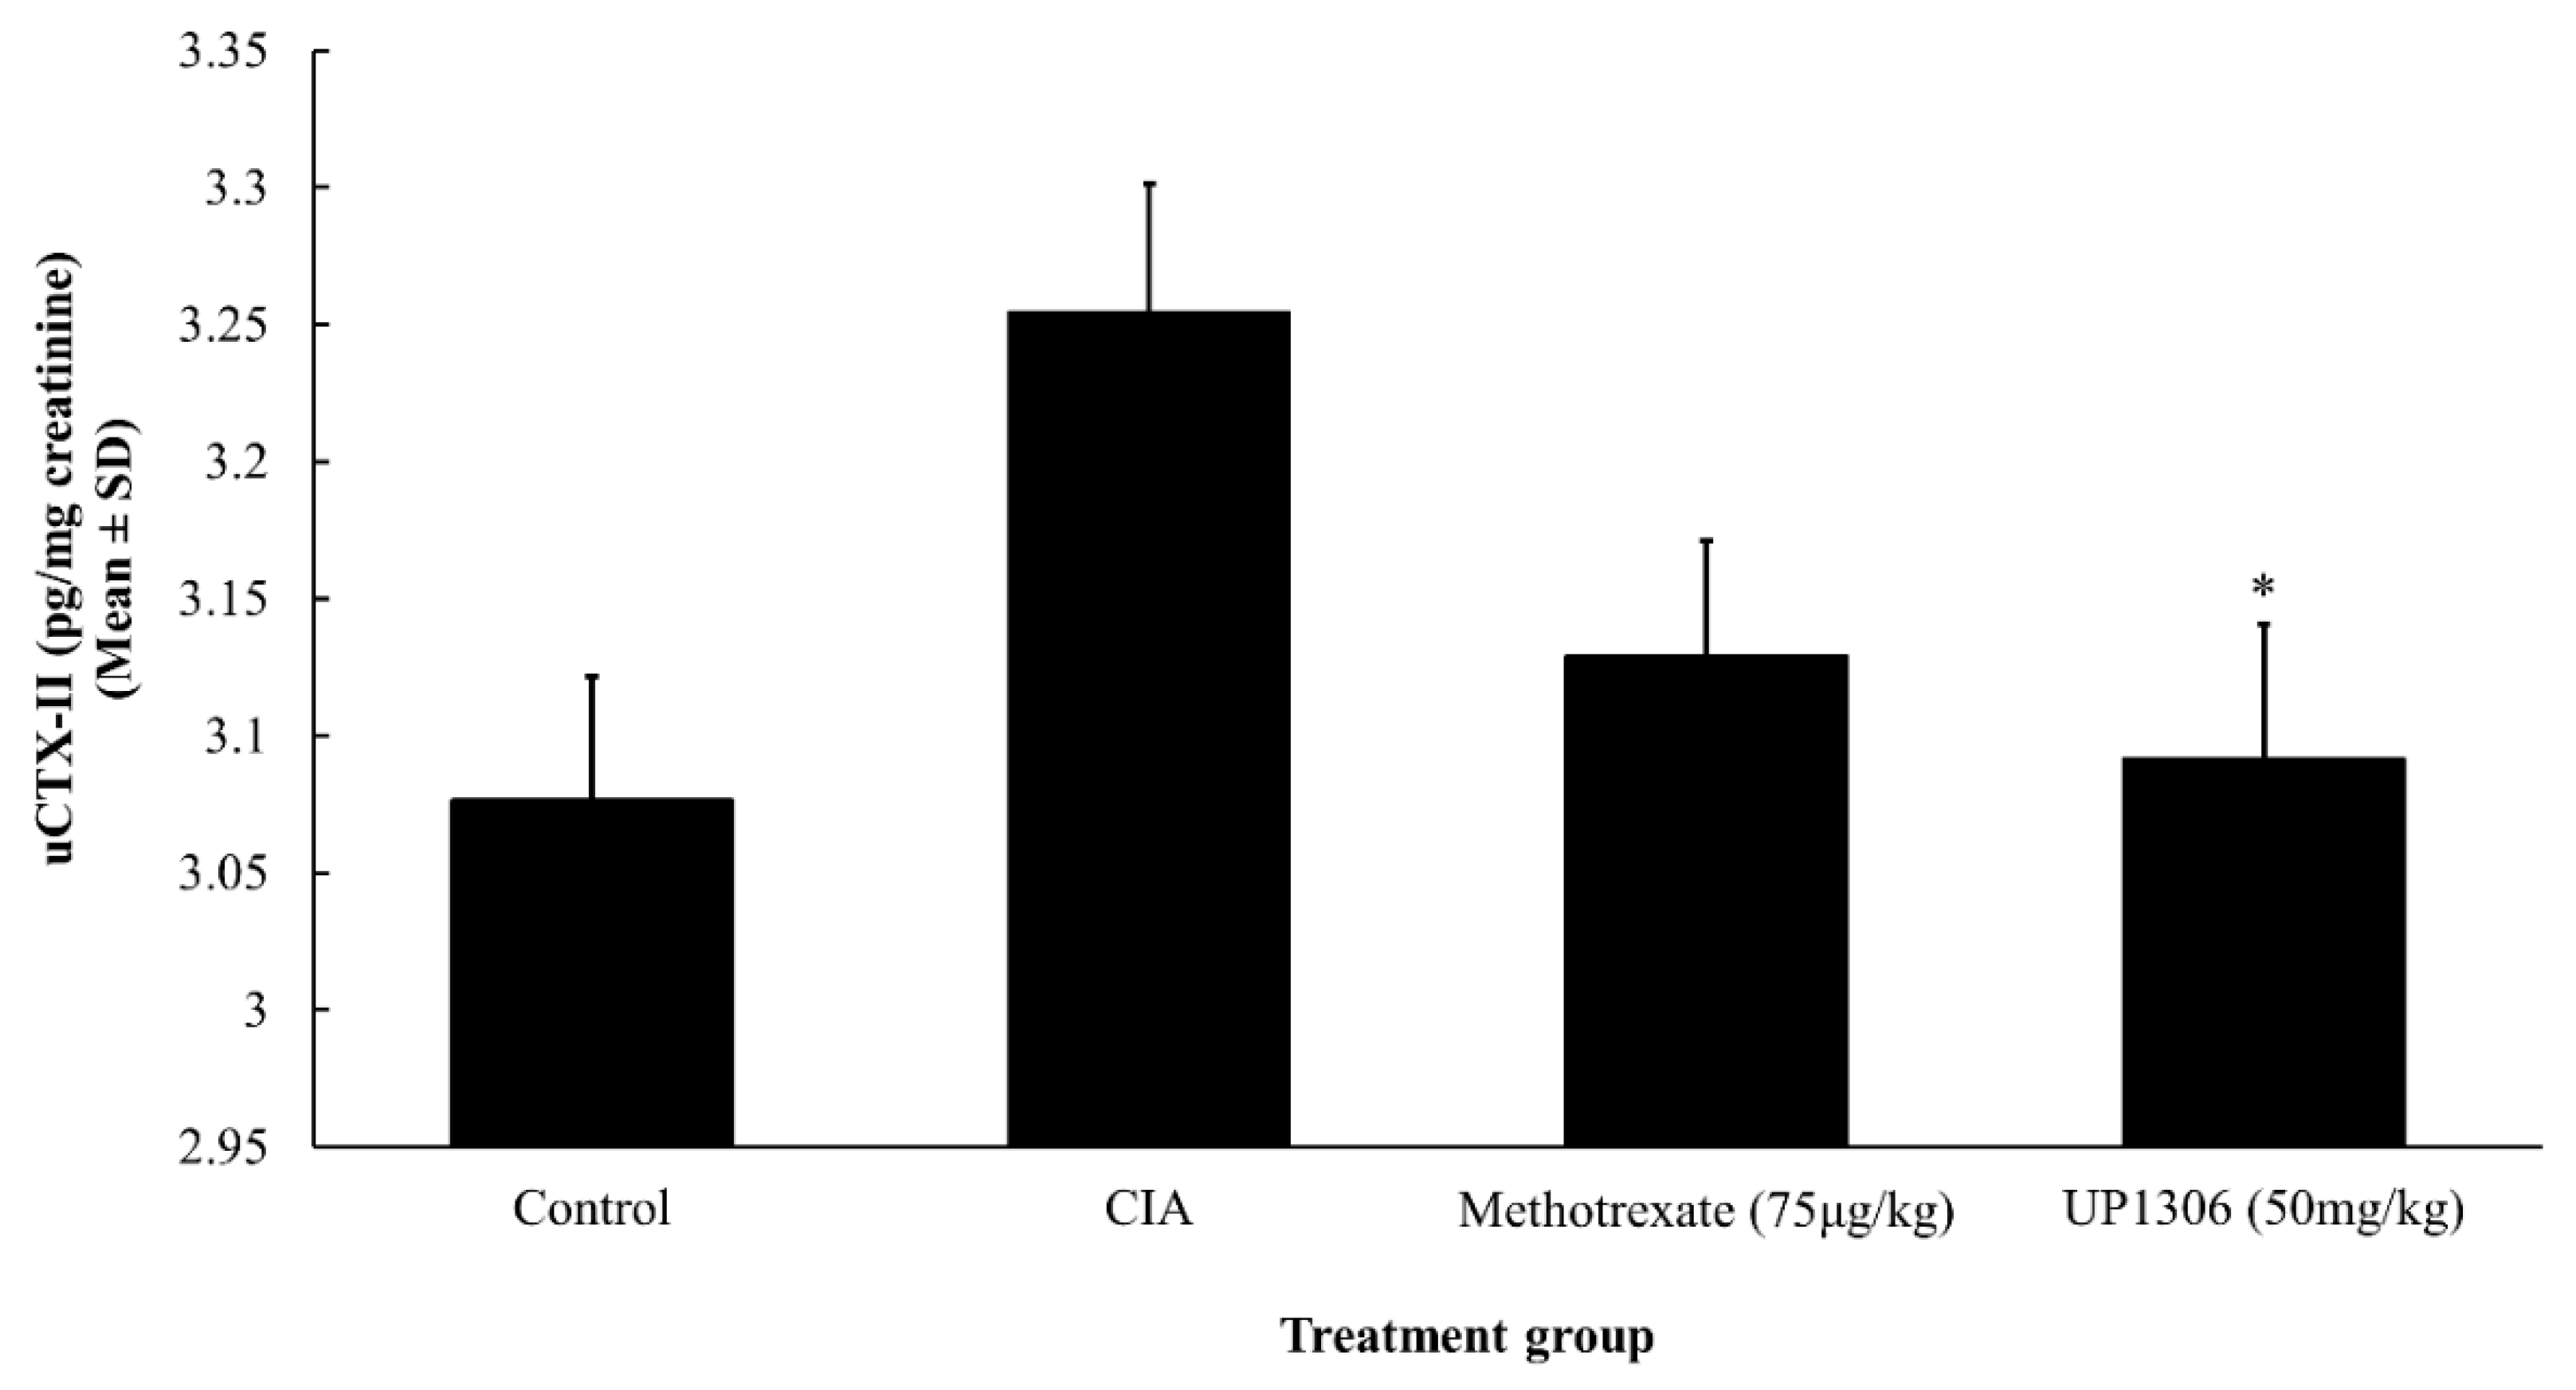
3.8. Urinary CTX-II
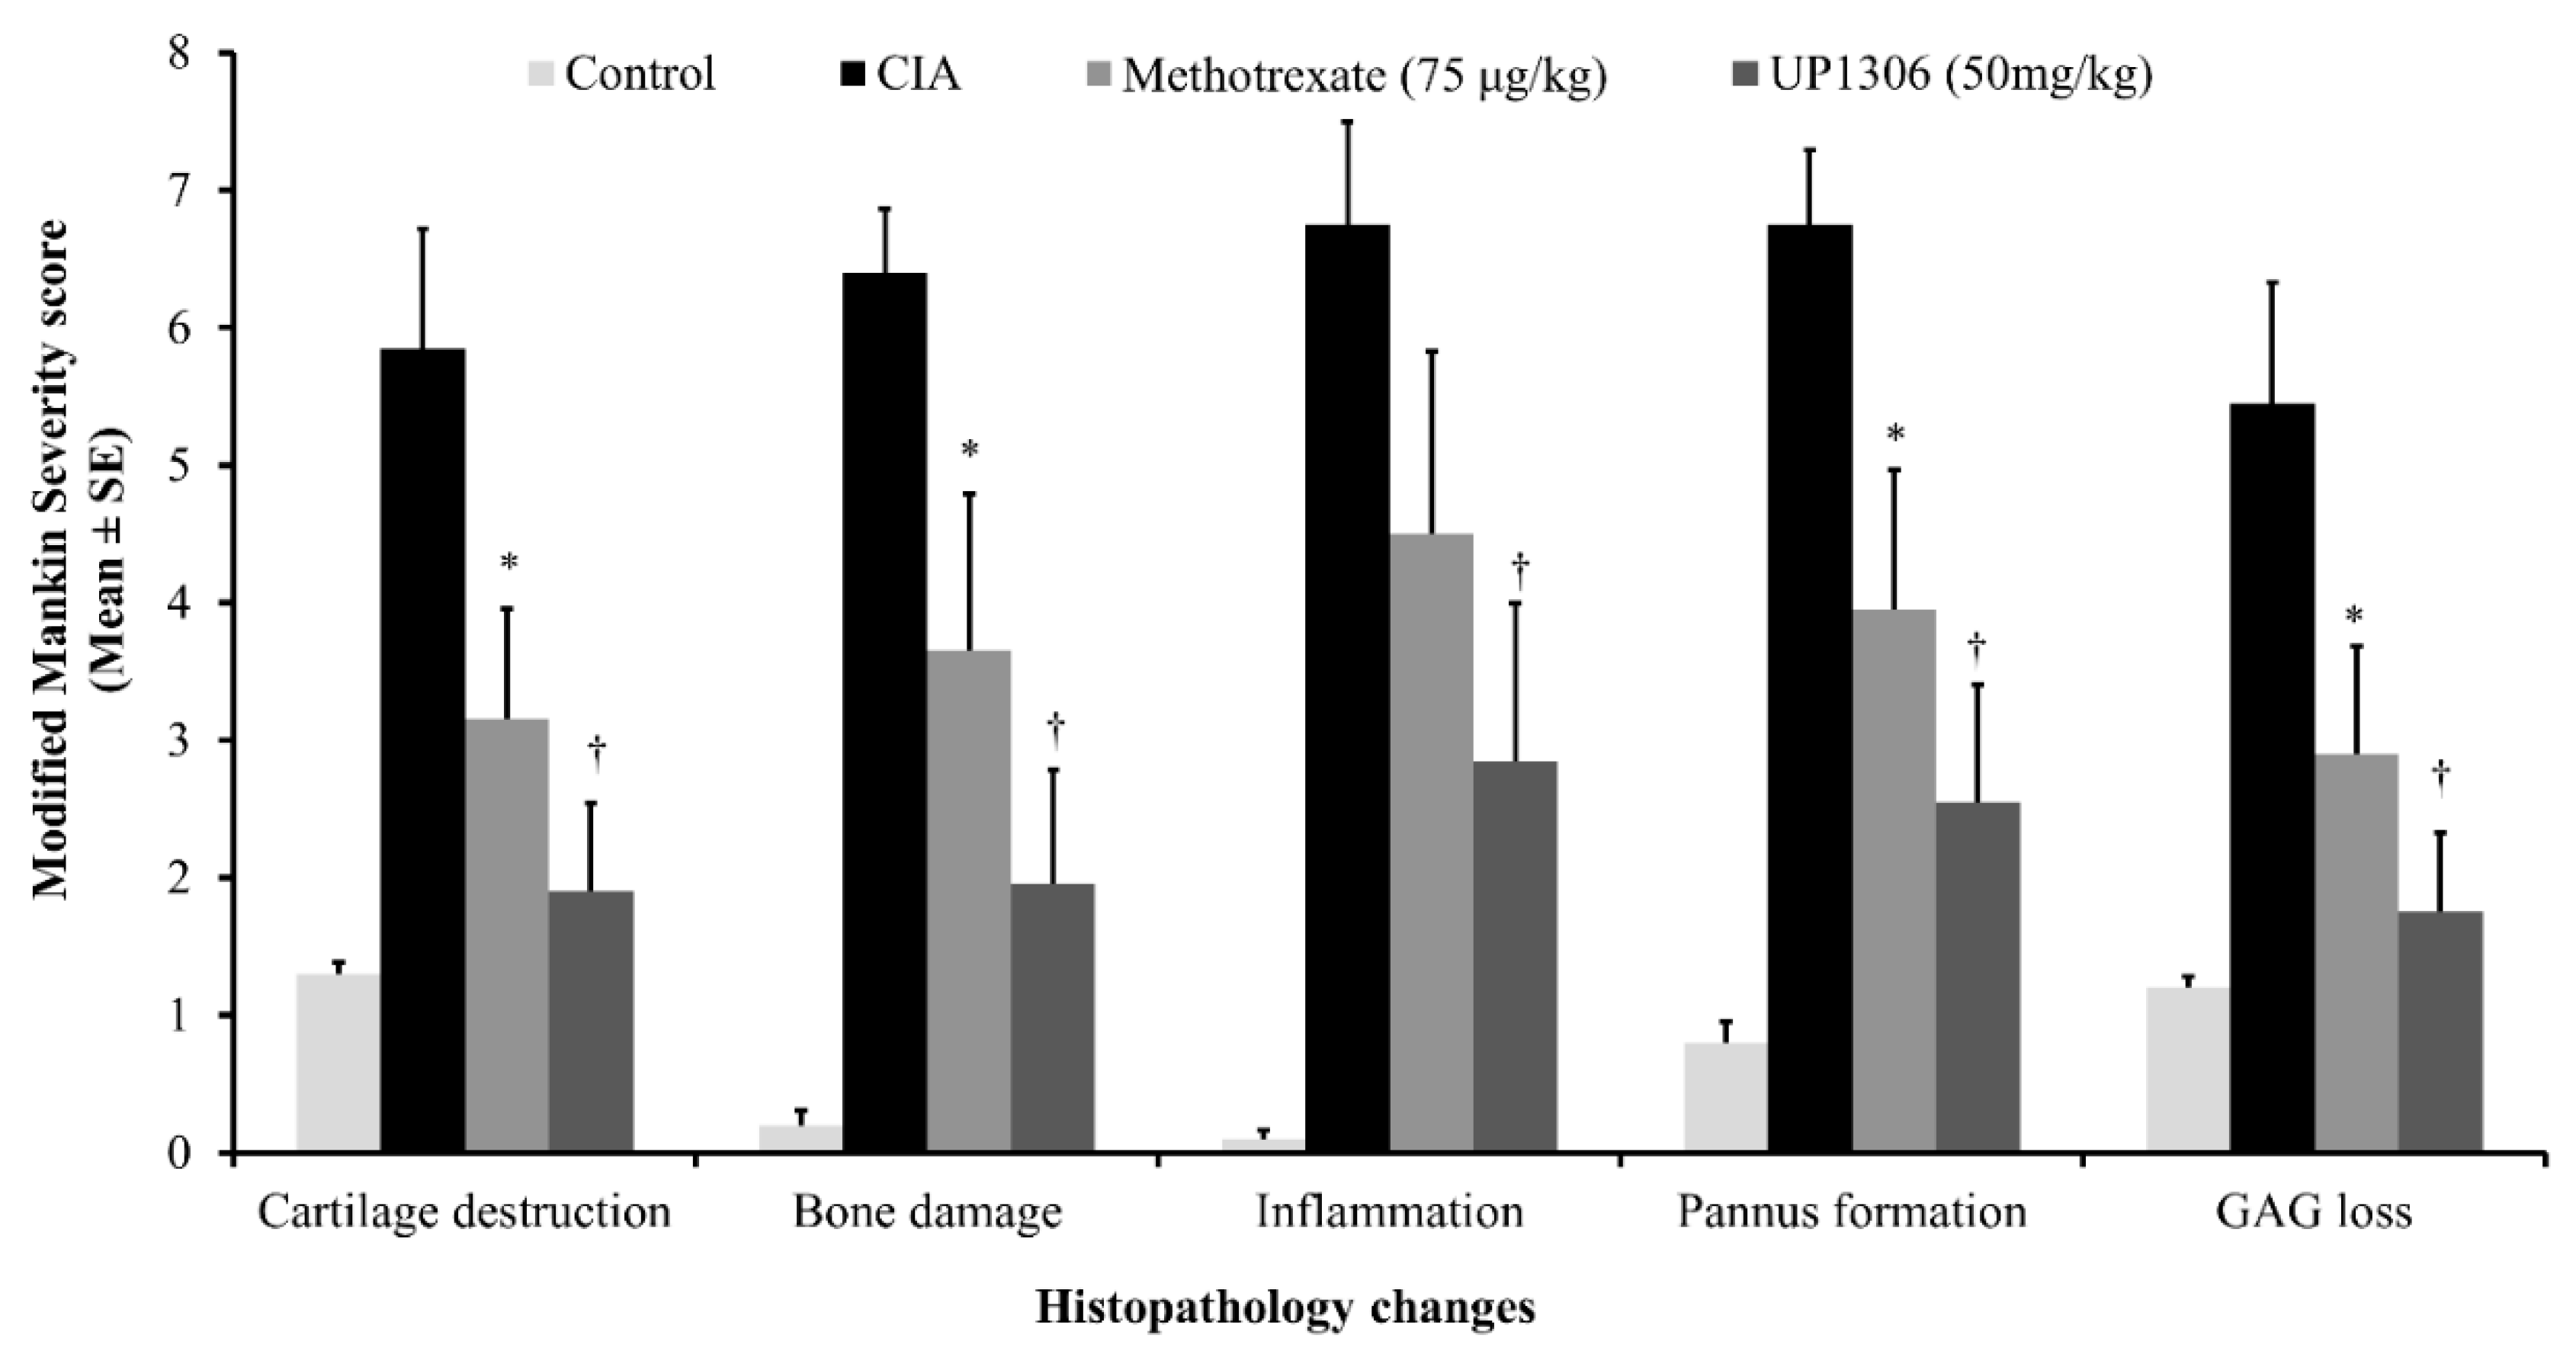
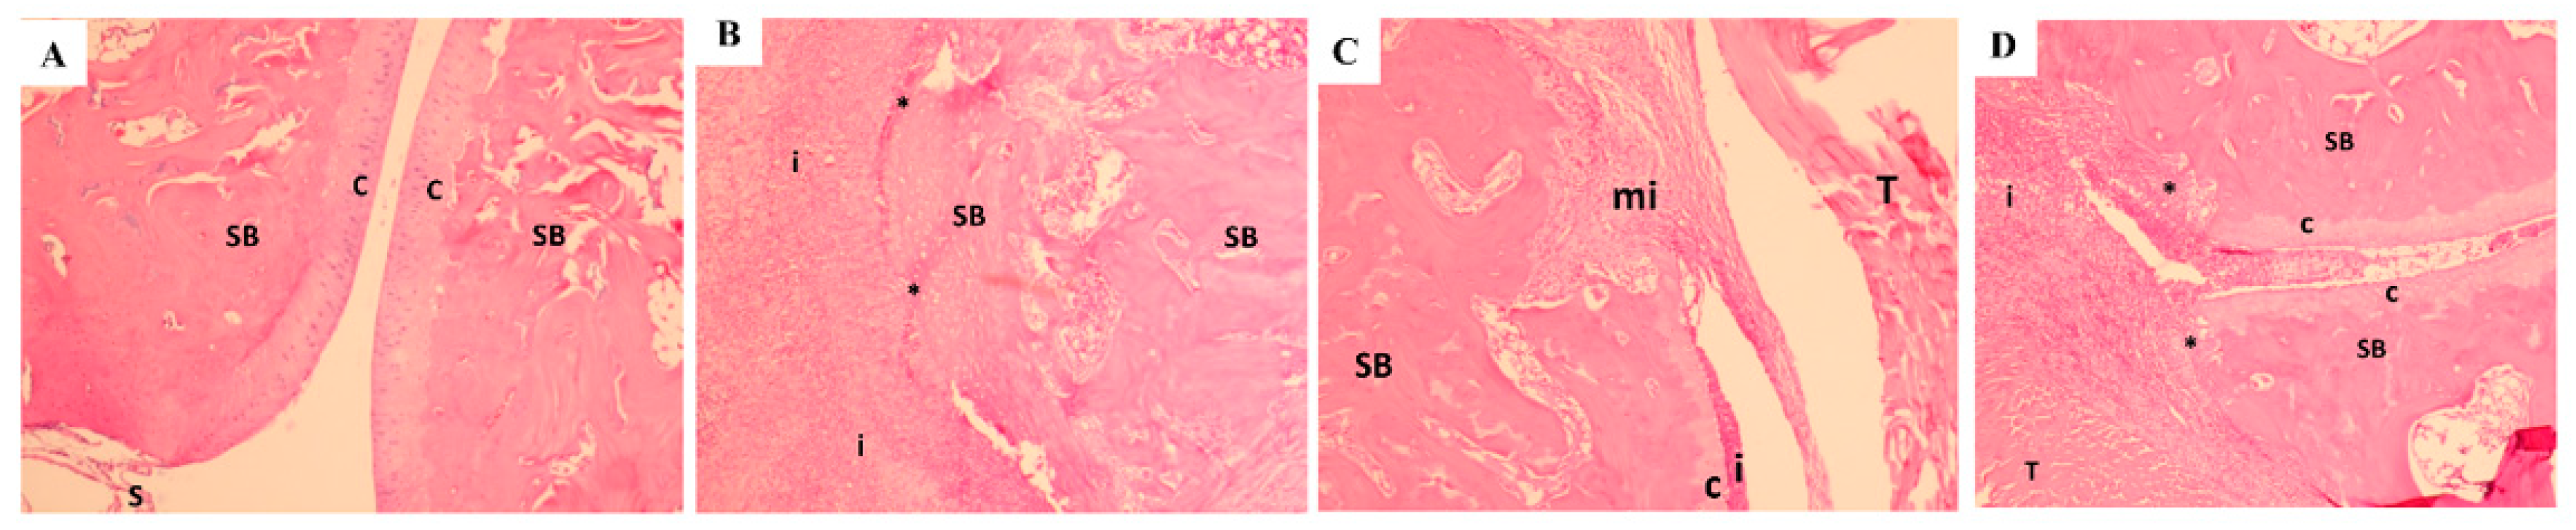
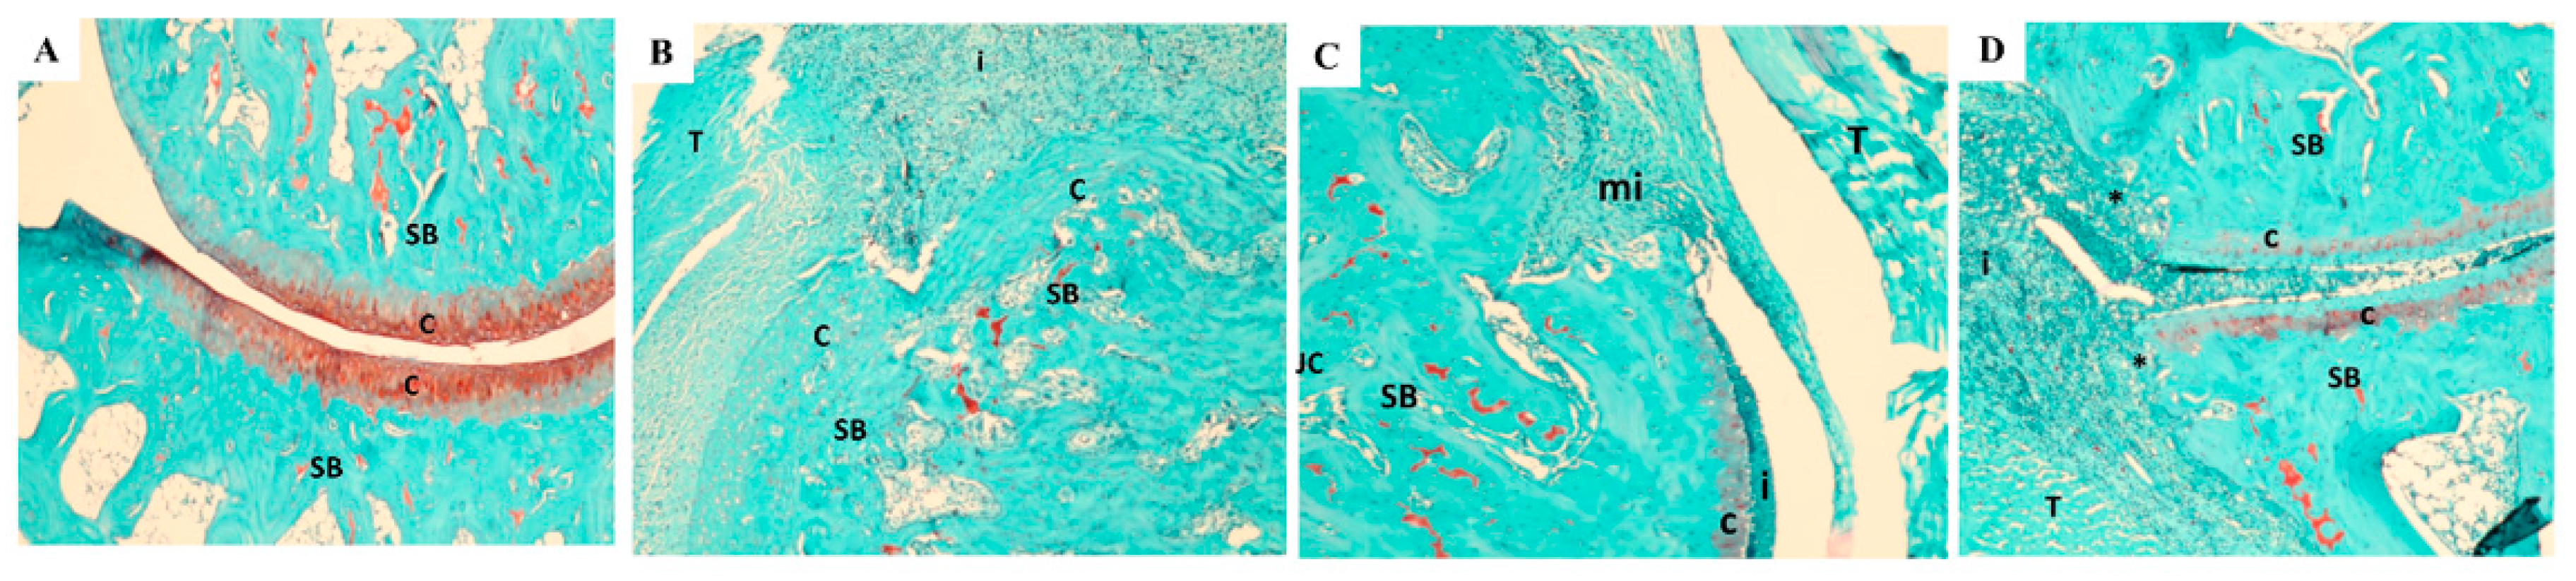
3.9. Histopathology Findings
4. Discussion
5. Conclusions
Author Contributions
Funding
Acknowledgments
Conflicts of Interest
References
- Ashford, S.; Williard, J. Osteoarthritis: A review. Nurse Pract. 2014, 39, 1–8. [Google Scholar] [CrossRef] [PubMed]
- Hootman, J.M.; Helmick, C.G.; Barbour, K.E.; Theis, K.A.; Boring, M.A. Updated Projected Prevalence of Self-Reported Doctor-Diagnosed Arthritis and Arthritis-Attributable Activity Limitation Among US Adults, 2015–2040. Arthritis Rheumatol. 2016, 68, 1582–1587. [Google Scholar] [CrossRef] [PubMed]
- Bozimowski, G. A Review of Nonsteroidal Anti-inflammatory Drugs. AANA J. 2015, 83, 425–433. [Google Scholar] [PubMed]
- Gunjal, S.; Ankola, A.V.; Bhat, K. In vitro antibacterial activity of ethanolic extract of Morus alba leaf against periodontal pathogens. Indian J. Dent. Res. 2015, 26, 533–536. [Google Scholar] [CrossRef] [PubMed]
- Raman, S.T.; Ganeshan, A.K.; Chen, C.; Jin, C.; Li, S.H.; Chen, H.J.; Gui, Z. In vitro and In vivo Antioxidant Activity of Flavonoid Extracted from Mulberry Fruit (Morus alba L.). Pharmacogn Mag. 2016, 12, 128–133. [Google Scholar] [PubMed]
- Wang, Y.; Xiang, L.; Wang, C.; Tang, C.; He, X. Antidiabetic and antioxidant effects and phytochemicals of mulberry fruit (Morus alba L.) polyphenol enhanced extract. PLoS ONE 2013, 8, e71144. [Google Scholar] [CrossRef] [PubMed]
- Jo, S.P.; Kim, J.K.; Lim, Y.H. Antihyperlipidemic effects of stilbenoids isolated from Morus alba in rats fed a high-cholesterol diet. Food Chem. Toxicol. 2014, 65, 213–218. [Google Scholar] [CrossRef] [PubMed]
- El-Beshbishy, H.A.; Singab, A.N.; Sinkkonen, J.; Pihlaja, K. Hypolipidemic and antioxidant effects of Morus alba L. (Egyptian mulberry) root bark fractions supplementation in cholesterol-fed rats. Life Sci. 2006, 78, 2724–2733. [Google Scholar] [CrossRef]
- Eo, H.J.; Park, J.H.; Park, G.H.; Lee, M.H.; Lee, J.R.; Koo, J.S.; Jeong, J.B. Anti-inflammatory and anti-cancer activity of mulberry (Morus alba L.) root bark. BMC Complement. Altern. Med. 2014. [Google Scholar] [CrossRef]
- Chan, E.W.; Lye, P.Y.; Wong, S.K. Phytochemistry, pharmacology, and clinical trials of Morus alba. Chin. J. Nat. Med. 2016, 14, 17–30. [Google Scholar]
- Lee, J.H.; Ko, H.J.; Woo, E.R.; Lee, S.K.; Moon, B.S.; Lee, C.W.; Mandava, S.; Samala, M.; Lee, J.; Kim, H.P. Moracin M inhibits airway inflammation by interrupting the JNK/c-Jun and NF-κB pathways in vitro and in vivo. Eur J. Pharmacol. 2016, 783, 64–72. [Google Scholar] [CrossRef] [PubMed]
- Kim, H.S.; Kim, A.R.; Park, H.J.; Park, D.K.; Kim, D.K.; Ko, N.Y.; Kim, B.; Choi, D.K.; Won, H.S.; Shin, W.S.; et al. Morus bombycis Koidzumi extract suppresses collagen-induced arthritis by inhibiting the activation of nuclear factor-κB and activator protein-1 in mice. J. Ethnopharmacol. 2011, 136, 392–398. [Google Scholar] [CrossRef] [PubMed]
- Lim, H.J.; Jin, H.G.; Woo, E.R.; Lee, S.K.; Kim, H.P. The root barks of Morus alba and the flavonoid constituents inhibit airway inflammation. J. Ethnopharmacol. 2013, 149, 169–175. [Google Scholar] [CrossRef] [PubMed]
- Zelová, H.; Hanáková, Z.; Čermáková, Z.; Šmejkal, K.; Dalĺ Acqua, S.; Babula, P.; Cvačka, J.; Hošek, J. Evaluation of anti-inflammatory activity of prenylated substances isolated from Morus alba and Morus nigra. J. Nat Prod. 2014, 77, 1297–1303. [Google Scholar] [CrossRef] [PubMed]
- Naik, G.H.; Priyadarsini, K.I.; Satav, J.G.; Banavalikar, M.M.; Sohoni, D.P.; Biyani, M.K.; Mohan, H. Comparative antioxidant activity of individual herbal components used in Ayurvedic medicine. Phytochemistry 2003, 63, 97–104. [Google Scholar] [CrossRef]
- Hazra, B.; Sarkar, R.; Ghate, N.B.; Chaudhuri, D.; Mandal, N. Study of the protective effects of Katha (Heartwood Extract of Acacia catechu) in liver damage induced by iron overload. J. Environ. Pathol. Toxicol. Oncol. 2013, 32, 229–240. [Google Scholar] [CrossRef] [PubMed]
- Guleria, S.; Tiku, A.K.; Singh, G.; Vyas, D.; Bhardwaj, A. Antioxidant activity and protective effect against plasmid DNA strand scission of leaf, bark, and heartwood extracts from Acacia catechu. J. Food Sci. 2011, 76, 959–964. [Google Scholar] [CrossRef] [PubMed]
- Nadumane, V.K.; Nair, S. Evaluation of the anticancer and cytotoxic potentials of Acacia catechu extracts in vitro. J. Nat. Pharm. 2011, 2, 190–195. [Google Scholar] [CrossRef]
- Jarald, E.; Joshi, S.B.; Jain, D.C. Biochemical study on the hypoglycemic effects of extract and fraction of Acacia catechu Willd in alloxan-induced diabetic rats. Int. J. Diabetes Metabol. 2009, 17, 63–69. [Google Scholar]
- Gunindro, N.; Devi, K.P.; Singh, T.I. Effects of Acacia catechu on intestinal absorption of glucose in rats. J. Chem. Pharm. Res. 2013, 5, 78–81. [Google Scholar]
- Ray, D.; Sharatchandra, K.; Thokchom, I.S. Antipyretic, antidiarrheal, hypoglycemic and hepatoprotective activities of ethyl acetate extract of Acacia catechu Willd. in albino rats. Indian J. Pharmacol. 2006, 38, 408–413. [Google Scholar] [CrossRef]
- Kuang, X.; Huang, Y.; Gu, H.F.; Zu, X.Y.; Zou, W.Y.; Song, Z.B.; Guo, Q.L. Effects of intrathecal epigallocatechin gallate, an inhibitor of Toll-like receptor 4, on chronic neuropathic pain in rats. Eur. J. Pharmacol. 2012, 676, 51–56. [Google Scholar] [CrossRef] [PubMed]
- Rahmatullah, M.; Hossain, M.; Mahmud, A.; Sultana, N.; Rahman, S.M.; Islam, M.R.; Khatoon, M.S.; Jahan, S.; Islam, F. Antihyperglycemic and antinociceptive activity evaluation of “khoyer” prepared from boiling the wood of Acacia catechu in water. Afr. J. Tradit. Complement. Altern. Med. 2013, 10, 1–5. [Google Scholar] [CrossRef] [PubMed]
- Monga, J.; Chauhan, C.S.; Sharma, M. Human breast adenocarcinoma cytotoxicity and modulation of 7,12-dimethylbenz[a]anthracene-induced mammary carcinoma in Balb/c mice by Acacia catechu (L.f.) Wild heartwood. Integr. Cancer Ther. 2013, 12, 347–362. [Google Scholar] [CrossRef] [PubMed]
- Patel, J.D.; Kumar, V.; Bhatt, S.A. Antimicrobial screening and phytochemical analysis of the resin part of Acacia catechu. Pharmaceut. Biol. 2009, 47, 34–37. [Google Scholar] [CrossRef]
- Zhong, Y.; Chiou, Y.S.; Pan, M.H.; Shahidi, F. Anti-inflammatory activity of lipophilic epigallocatechin gallate (EGCG) derivatives in LPS-stimulated murine macrophages. Food Chem. 2012, 134, 742–748. [Google Scholar] [CrossRef] [PubMed]
- Yimam, M.; Lee, Y.C.; Jiao, P.; Hong, M.; Nam, J.B.; Brownell, L.; Hyun, E.; Jia, Q. UP1306, a Botanical Composition with Analgesic and Anti-inflammatory Effect. Pharmacogn. Res. 2016, 8, 186–192. [Google Scholar] [CrossRef] [PubMed]
- Yimam, M.; Lee, Y.C.; Wright, L.; Jiao, P.; Horm, T.; Hong, M.; Brownell, L.; Jia, Q. A Botanical Composition Mitigates Cartilage Degradations and Pain Sensitivity in Osteoarthritis Disease Model. J. Med. Food 2017, 20, 568–576. [Google Scholar] [CrossRef]
- Kalman, D.S.; Hewlings, S.J. The Effects of Morus alba and Acacia catechu on Quality of Life and Overall Function in Adults with Osteoarthritis of the Knee. J. Nutr. Metab. 2017, 2017, 4893104. [Google Scholar] [CrossRef]
- Cho, Y.G.; Cho, M.L.; Min, S.Y.; Kim, H.Y. Type II collagen autoimmunity in a mouse model of human rheumatoid arthritis. Autoimmun. Rev. 2007, 7, 65–70. [Google Scholar] [CrossRef]
- Zhang, J.M.; An, J. Cytokines, inflammation, and pain. Int. Anesthesiol. Clin. 2007, 45, 27–37. [Google Scholar] [CrossRef]
- Martinez-Cutillas, J.; Alerany-Pardo, C.; Borrás-Blasco, J.; Broto-Sumalla, A.; Burgos-SanJosé, A.; Climent-Bolta, C.; Fernández-Fuente, M.A.; Ferrit-Martin, M.; Gómez-Germá, P.; Martínez-Sesmero, J.M.; et al. The use of adalimumab, etanercept, golimumab and infliximab in rheumatic pathologies: Variation between label dosage and real-world use. Expert Rev. Pharmacoecon. Outcomes Res. 2015, 15, 851–858. [Google Scholar] [CrossRef]
- Koenders, M.I.; van den Berg, W.B. Novel therapeutic targets in rheumatoid arthritis. Trends Pharmacol. Sci. 2015, 36, 189–195. [Google Scholar] [CrossRef] [PubMed]
- Sandborg, C.; Mellins, E.D. A new era in the treatment of systemic juvenile idiopathic arthritis. N. Engl. J. Med. 2012, 367, 2439–2440. [Google Scholar] [CrossRef] [PubMed]
- Siebuhr, A.S.; Wang, J.; Karsdal, M.; Bay-Jensen, A.C.; Jin, Y.; Zheng, Q. Matrix metalloproteinase-dependent turnover of cartilage, synovial membrane, and connective tissue is elevated in rats with collagen induced arthritis. J. Transl. Med. 2012, 10, 195. [Google Scholar] [CrossRef]
- Sumeet, G.; Rachna, K.; Samrat, C.; Ipshita, C.; Vikas, J.; Manu, S. Anti-Inflammatory and Anti Arthritic Activity of Different Milk Based Formulation of Curcumin in Rat Model. Curr. Drug Deliv. 2018, 15, 205–214. [Google Scholar] [CrossRef] [PubMed]
- Umar, S.; Umar, K.; Sarwar, A.H.; Khan, A.; Ahmad, N.; Ahmad, S.; Katiyar, C.K.; Husain, S.A.; Khan, H.A. Boswellia serrata extract attenuates inflammatory mediators and oxidative stress in collagen induced arthritis. Phytomedicine 2014, 21, 847–856. [Google Scholar] [CrossRef]
- Brand, D.D.; Kang, A.H.; Rosloniec, E.F. Immunopathogenesis of collagen arthritis. Springer Semin. Immunopathol. 2003, 25, 3–18. [Google Scholar] [CrossRef]
- Rosloniec, E.F.; Cremer, M.; Kang, A.H.; Myers, L.K.; Brand, D.D. Collagen-induced arthritis. Curr. Protoc. Immunol. 2001. [Google Scholar] [CrossRef]
- Mankin, H.J.; Dorfman, H.; Lippiello, L.; Zarins, A. Biochemical and metabolic abnormalities in articular cartilage from osteo-arthritic human hips. II. Correlation of morphology with biochemical and metabolic data. J. Bone Jt. Surg. Am. 1971, 53, 523–537. [Google Scholar] [CrossRef]
- Miyoshi, M.; Liu, S. Collagen-Induced Arthritis Models. Methods Mol. Biol. 2018, 1868, 3–7. [Google Scholar] [PubMed]
- Kapoor, M.; Martel-Pelletier, J.; Lajeunesse, D.; Pelletier, J.P.; Fahmi, H. Role of proinflammatory cytokines in the pathophysiology of osteoarthritis. Nat. Rev. Rheumatol. 2011, 7, 33–42. [Google Scholar] [CrossRef] [PubMed]
- Saklatvala, J. Tumour necrosis factor alpha stimulates resorption and inhibits synthesis of proteoglycan in cartilage. Nature 1986, 322, 547–549. [Google Scholar] [CrossRef] [PubMed]
- Goldring, M.B.; Fukuo, K.; Birkhead, J.R.; Dudek, E.; Sandell, L.J. Transcriptional suppression by interleukin-1 and interferon-gamma of type II collagen gene expression in human chondrocytes. J. Cell Biochem. 1994, 54, 85–99. [Google Scholar] [CrossRef] [PubMed]
- Lefebvre, V.; Peeters-Joris, C.; Vaes, G. Modulation by interleukin 1 and tumor necrosis factor alpha of production of collagenase, tissue inhibitor of metalloproteinases and collagen types in differentiated and dedifferentiated articular chondrocytes. Biochim. Biophys. Acta 1990, 1052, 366–378. [Google Scholar] [CrossRef]
- Guerne, P.A.; Carson, D.A.; Lotz, M. IL-6 production by human articular chondrocytes. Modulation of its synthesis by cytokines, growth factors, and hormones in vitro. J. Immunol. 1990, 144, 499–505. [Google Scholar] [PubMed]
- Mathy-Hartert, M.; Hogge, L.; Sanchez, C.; Deby-Dupont, G.; Crielaard, J.M.; Henrotin, Y. Interleukin-1beta and interleukin-6 disturb the antioxidant enzyme system in bovine chondrocytes: A possible explanation for oxidative stress generation. Osteoarthr. Cartil. 2008, 16, 756–763. [Google Scholar] [CrossRef]
- Lepetsos, P.; Papavassiliou, A.G. ROS/oxidative stress signaling in osteoarthritis. Biochim. Biophys. Acta 2016, 1862, 576–591. [Google Scholar] [CrossRef]
- Chandrasekhar, S.; Harvey, A.K.; Hrubey, P.S. Intra-articular administration of interleukin-1 causes prolonged suppression of cartilage proteoglycan synthesis in rats. Matrix 1992, 12, 1–10. [Google Scholar] [CrossRef]
- Bolon, B.; Campagnuolo, G.; Zhu, L.; Duryea, D.; Zack, D.; Feige, U. Interleukin-1beta and tumor necrosis factor-alpha produce distinct, time-dependent patterns of acute arthritis in the rat knee. Vet. Pathol. 2004, 41, 235–243. [Google Scholar] [CrossRef]
- Joosten, L.A.; Helsen, M.M.; Saxne, T.; van De Loo, F.A.; Heinegard, D.; van Den Berg, W.B. IL-1 alpha beta blockade prevents cartilage and bone destruction in murine type II collagen-induced arthritis, whereas TNF-alpha blockade only ameliorates joint inflammation. J. Immunol. 1999, 163, 5049–5055. [Google Scholar] [PubMed]
- Kobayashi, M.; Squires, G.R.; Mousa, A.; Tanzer, M.; Zukor, D.J.; Antoniou, J.; Feige, U.; Poole, A.R. Role of interleukin-1 and tumor necrosis factor alpha in matrix degradation of human osteoarthritic cartilage. Arthritis Rheum. 2005, 52, 128–135. [Google Scholar] [CrossRef] [PubMed]
- van de Loo, F.A.; Arntz, O.J.; Otterness, I.G.; van den Berg, W.B. Protection against cartilage proteoglycan synthesis inhibition by antiinterleukin 1 antibodies in experimental arthritis. J. Rheumatol. 1992, 19, 348–356. [Google Scholar] [PubMed]
- Wei, S.T.; Sun, Y.H.; Zong, S.H.; Xiang, Y.B. Serum Levels of IL-6 and TNF-α May Correlate with Activity and Severity of Rheumatoid Arthritis. Med. Sci. Monit. 2015, 21, 4030–4038. [Google Scholar] [CrossRef] [PubMed] [Green Version]
- Fosang, A.J.; Stanton, H.; Little, C.B.; Atley, L.M. Neoepitopes as biomarkers of cartilage catabolism. Inflamm. Res. 2003, 52, 277–282. [Google Scholar] [CrossRef] [PubMed]
- Rose, B.J.; Kooyman, D.L. A Tale of Two Joints: The Role of Matrix Metalloproteases in Cartilage Biology. Dis. Markers 2016, 2016, 4895050. [Google Scholar] [CrossRef]
- Yamanaka, H.; Matsuda, Y.; Tanaka, M.; Sendo, W.; Nakajima, H.; Taniguchi, A.; Kamatani, N. Serum matrix metalloproteinase 3 as a predictor of the degree of joint destruction during the six months after measurement, in patients with early rheumatoid arthritis. Arthritis Rheum. 2000, 43, 852–858. [Google Scholar] [CrossRef] [Green Version]
- Galil, S.M.; El-Shafey, A.M.; Hagrass, H.A.; Fawzy, F.; Sammak, A.E. Baseline serum level of matrix metalloproteinase-3 as a biomarker of progressive joint damage in rheumatoid arthritis patients. Int. J. Rheum. Dis. 2016, 19, 377–384. [Google Scholar] [CrossRef]
- Ma, M.J.; Liu, H.C.; Qu, X.Q.; Wang, J.L. Matrix metalloproteinase-3 gene polymorphism and its mRNA expression in rheumatoid arthritis. Genet. Mol. Res. 2015, 14, 15652–15659. [Google Scholar] [CrossRef]
- Oestergaard, S.; Chouinard, L.; Doyle, N.; Smith, S.Y.; Tankó, L.B.; Qvist, P. Early elevation in circulating levels of C-telopeptides of type II collagen predicts structural damage in articular cartilage in the rodent model of collagen-induced arthritis. Arthritis Rheum. 2006, 54, 2886–2890. [Google Scholar] [CrossRef] [Green Version]
- Garnero, P.; Piperno, M.; Gineyts, E.; Christgau, S.; Delmas, P.D.; Vignon, E. Cross sectional evaluation of biochemical markers of bone, cartilage, and synovial tissue metabolism in patients with knee osteoarthritis: Relations with disease activity and joint damage. Ann. Rheum. Dis. 2001, 60, 619–626. [Google Scholar] [CrossRef] [PubMed]
- Oestergaard, S.; Chouinard, L.; Doyle, N.; Karsdal, M.A.; Smith, S.Y.; Qvist, P.; Tankó, L.B. The utility of measuring C-terminal telopeptides of collagen type II (CTX-II) in serum and synovial fluid samples for estimation of articular cartilage status in experimental models of destructive joint diseases. Osteoarthr. Cartil. 2006, 14, 670–679. [Google Scholar] [CrossRef] [PubMed] [Green Version]
- Chen, D.; Shen, J.; Zhao, W.; Wang, T.; Han, L.; Hamilton, J.L.; Im, H.J. Osteoarthritis: Toward a comprehensive understanding of pathological mechanism. Bone Res. 2017, 5, 16044. [Google Scholar] [CrossRef] [PubMed]
- Kalaiselvi, P.; Rajashree, K.; Bharathi Priya, L.; Padma, V.V. Cytoprotective effect of epigallocatechin-3-gallate against deoxynivalenol-induced toxicity through anti-oxidative and anti-inflammatory mechanisms in HT-29 cells. Food Chem. Toxicol. 2013, 56, 110–118. [Google Scholar] [CrossRef] [PubMed]
- Yang, J.A.; Choi, J.H.; Rhee, S.J. Effects of green tea catechin on phospholipase A2 activity and antithrombus in streptozotocin diabetic rats. J. Nutr. Sci. Vitaminol. (Tokyo) 1999, 45, 337–346. [Google Scholar] [CrossRef] [PubMed]
- Hošek, J.; Bartos, M.; Chudík, S.; Dall’Acqua, S.; Innocenti, G.; Kartal, M.; Kokoška, L.; Kollár, P.; Kutil, Z.; Landa, P.; et al. Natural compound cudraflavone B shows promising anti-inflammatory properties in vitro. J. Nat. Prod. 2011, 74, 614–619. [Google Scholar]
- Chen, Y.C.; Tien, Y.J.; Chen, C.H.; Beltran, F.N.; Amor, E.C.; Wang, R.J.; Wu, D.J.; Mettling, C.; Lin, Y.L.; Yang, W.C. Morus alba and active compound oxyresveratrol exert anti-inflammatory activity via inhibition of leukocyte migration involving MEK/ERK signaling. BMC Complement. Altern. Med. 2013, 13, 45. [Google Scholar] [CrossRef] [PubMed]
- Chung, K.O.; Kim, B.Y.; Lee, M.H.; Kim, Y.R.; Chung, H.Y.; Park, J.H.; Moon, J.O. In vitro and in vivo anti-inflammatory effect of oxyresveratrol from Morus alba L. J. Pharm. Pharmacol. 2003, 55, 1695–1700. [Google Scholar] [CrossRef] [PubMed]
- Cheon, B.S.; Kim, Y.H.; Son, K.S.; Chang, H.W.; Kang, S.S.; Kim, H.P. Effects of prenylated flavonoids and biflavonoids on lipopolysaccharide-induced nitric oxide production from the mouse macrophage cell line RAW 264.7. Planta Med. 2000, 66, 596–600. [Google Scholar] [CrossRef] [PubMed]
- Zhang, D.D.; Ling, S.; Zhang, H.P.; Shi, H.X.; Xue, Y.L.; Yang, X.L.; Xu, J.W.; Bian, K. Effects of total flavones from Morus alba L. On inflammation reaction of macrophages. Shizhen Guoyi Guoyao 2010, 21, 2787–2790. [Google Scholar]


| Parameters | AUC (d12–d18) | |||
|---|---|---|---|---|
| Control | CIA | Methotrexate (75 μg/kg) | UP1306 (50 mg/kg) | |
| Arthritis Index | 0 | 13.50 ± 0.80 | 5.55 ± 0.51 * | 6.60 ± 0.50 * |
| Ankle diameter | 35.55 ± 0.02 † | 47.02 ± 0.66 | 40.24 ± 0.16 ** | 41.37 ± 0.30 * |
| Paw thickness | 17.13 ± 0.02 † | 30.41 ± 0.85 | 21.17 ± 0.36 ** | 22.30 ± 0.43 * |
© 2019 by the authors. Licensee MDPI, Basel, Switzerland. This article is an open access article distributed under the terms and conditions of the Creative Commons Attribution (CC BY) license (http://creativecommons.org/licenses/by/4.0/).
Share and Cite
Yimam, M.; Horm, T.; Wright, L.; Jiao, P.; Hong, M.; Brownell, L.; Jia, Q. UP1306: A Composition Containing Standardized Extracts of Acacia catechu and Morus alba for Arthritis Management. Nutrients 2019, 11, 272. https://0-doi-org.brum.beds.ac.uk/10.3390/nu11020272
Yimam M, Horm T, Wright L, Jiao P, Hong M, Brownell L, Jia Q. UP1306: A Composition Containing Standardized Extracts of Acacia catechu and Morus alba for Arthritis Management. Nutrients. 2019; 11(2):272. https://0-doi-org.brum.beds.ac.uk/10.3390/nu11020272
Chicago/Turabian StyleYimam, Mesfin, Teresa Horm, Laura Wright, Ping Jiao, Mei Hong, Lidia Brownell, and Qi Jia. 2019. "UP1306: A Composition Containing Standardized Extracts of Acacia catechu and Morus alba for Arthritis Management" Nutrients 11, no. 2: 272. https://0-doi-org.brum.beds.ac.uk/10.3390/nu11020272