Salmon in Combination with High Glycemic Index Carbohydrates Increases Diet-Induced Thermogenesis Compared with Salmon with Low Glycemic Index Carbohydrates–An Acute Randomized Cross-Over Meal Test Study

 , , ,
, , ,  , , and
Abstract
:1. Introduction
2. Materials and Methods
2.1. Study Design
2.2. Experimental Protocol
2.3. Subjects
2.4. Standardization
2.5. Test Meals
2.6. Energy Expenditure and Substrate Oxidation
2.7. Visual Analog Scales
2.8. Ad Libitum Buffet Style Lunch
2.9. Biochemical Analyses
2.10. Blinding and Randomization
2.11. Sample Size
2.12. Statistical Analysis
3. Results
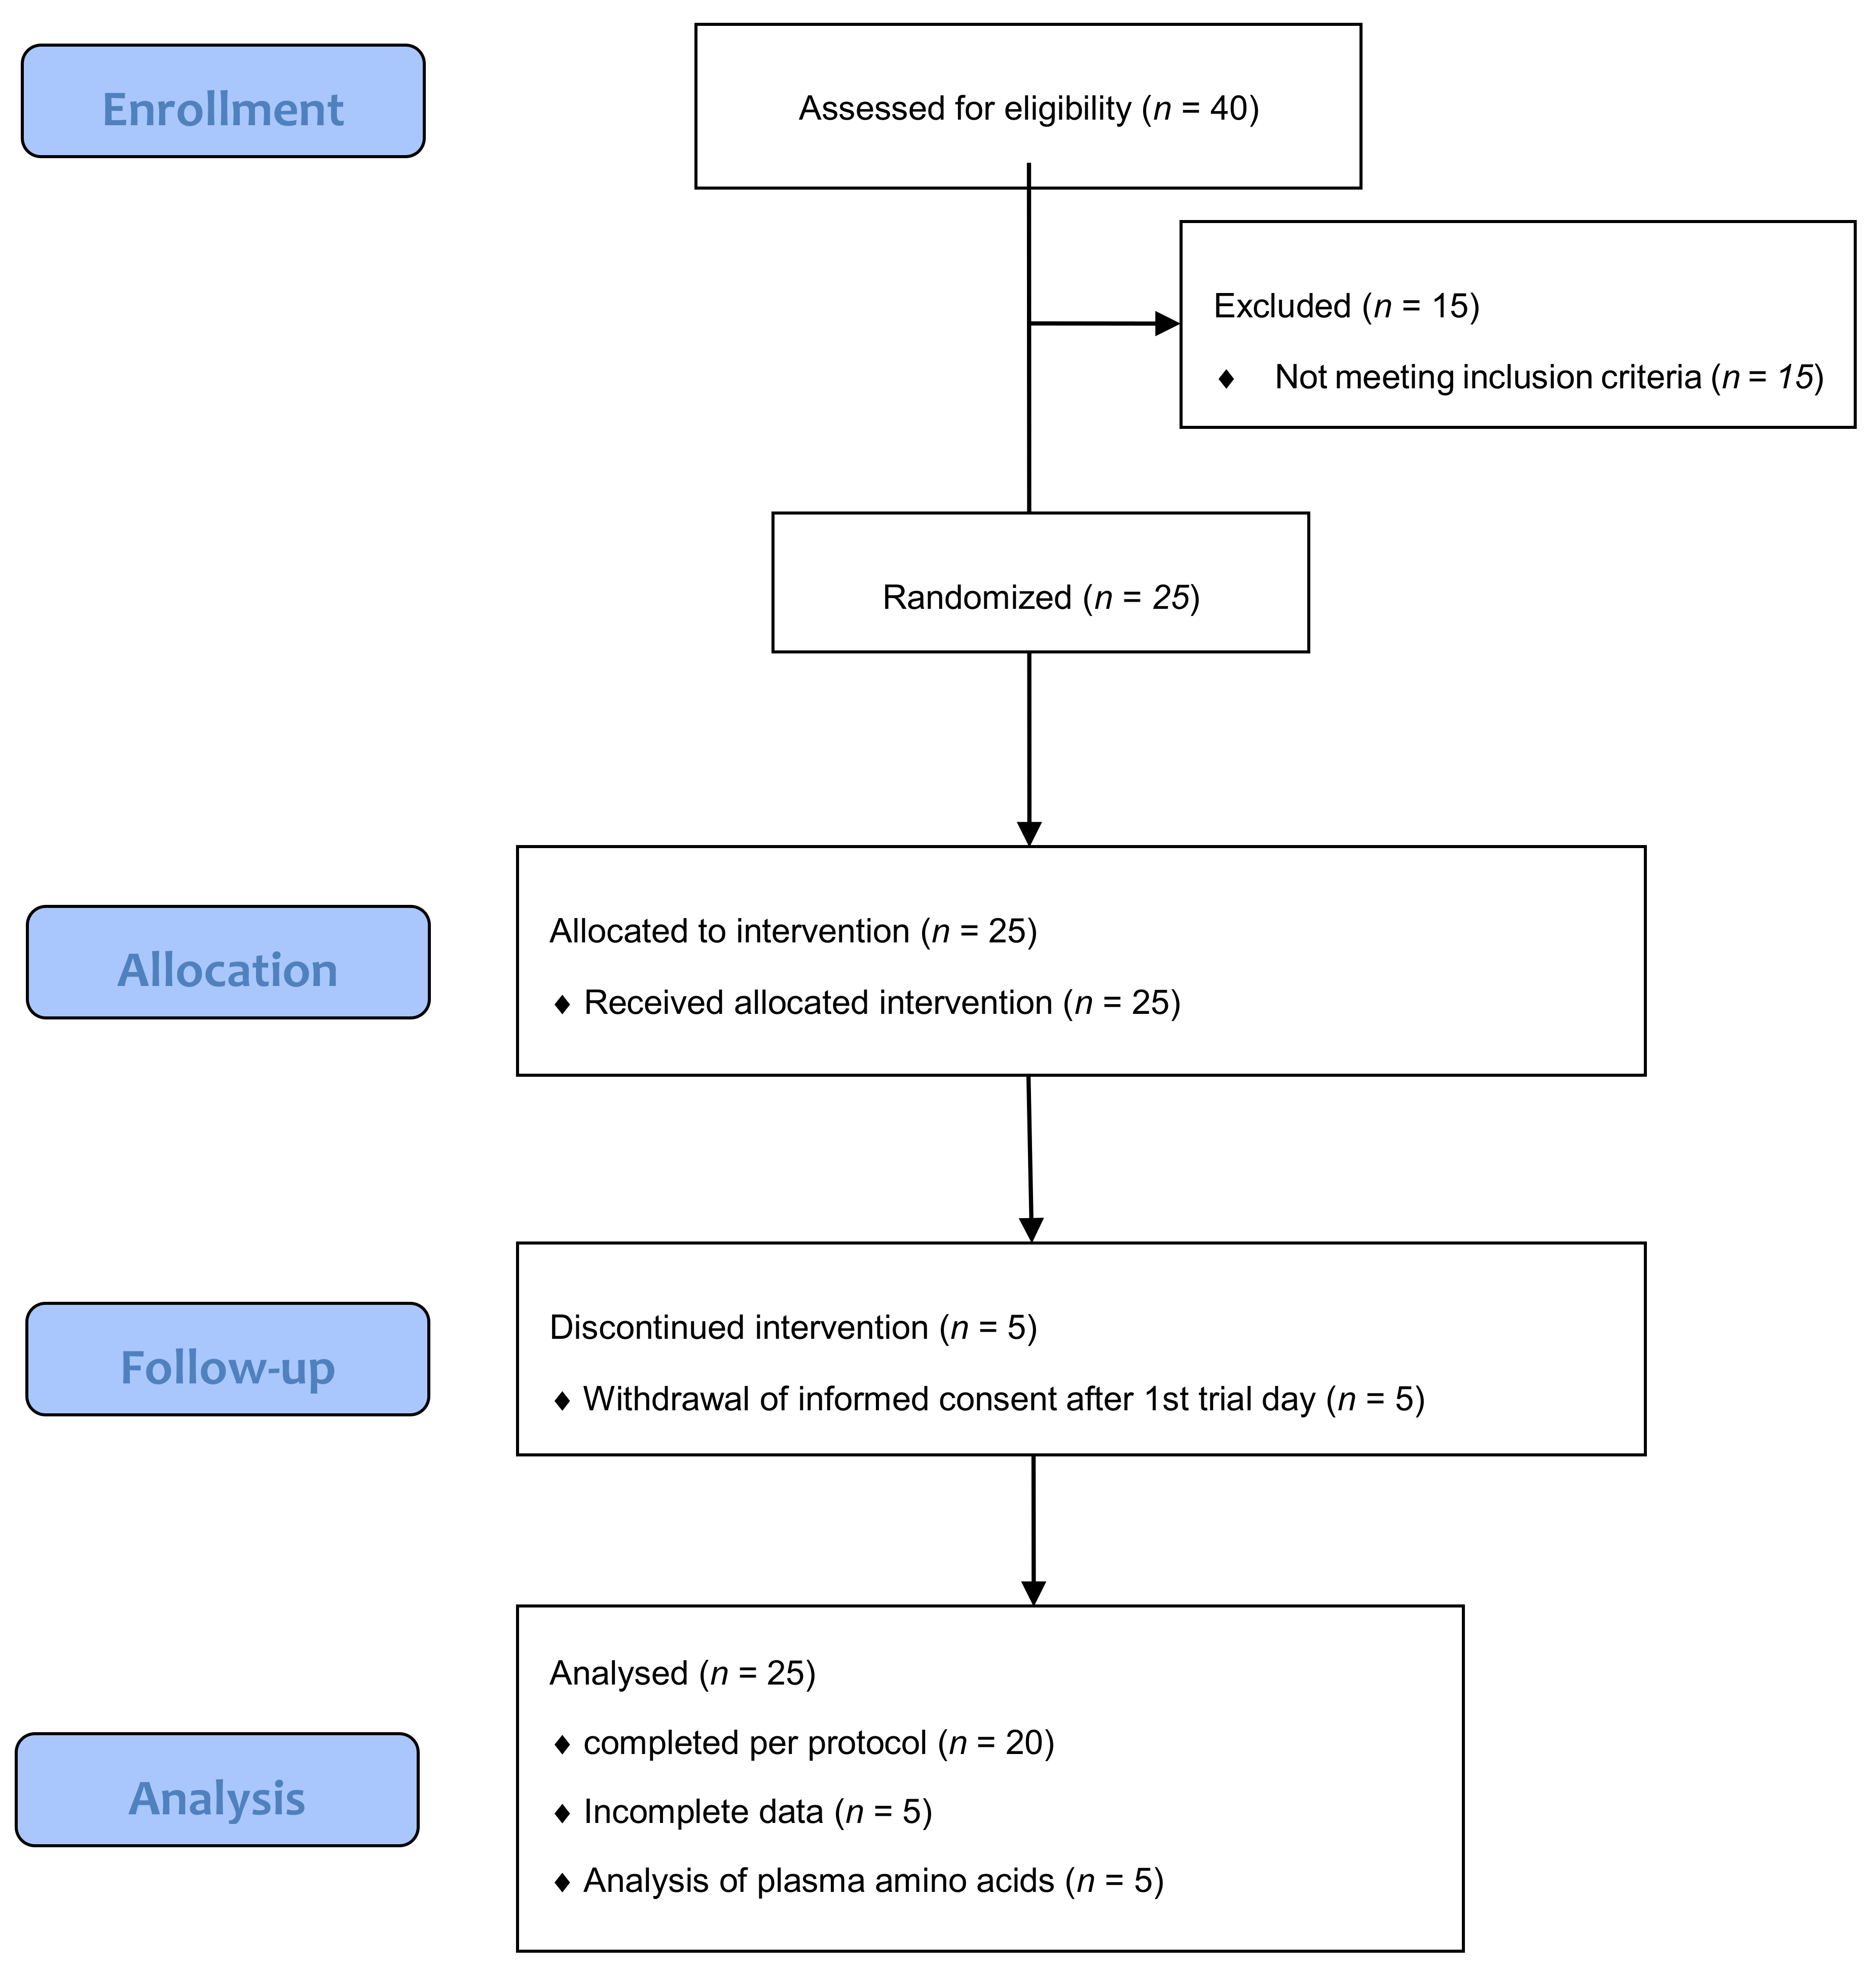
3.1. Subjects
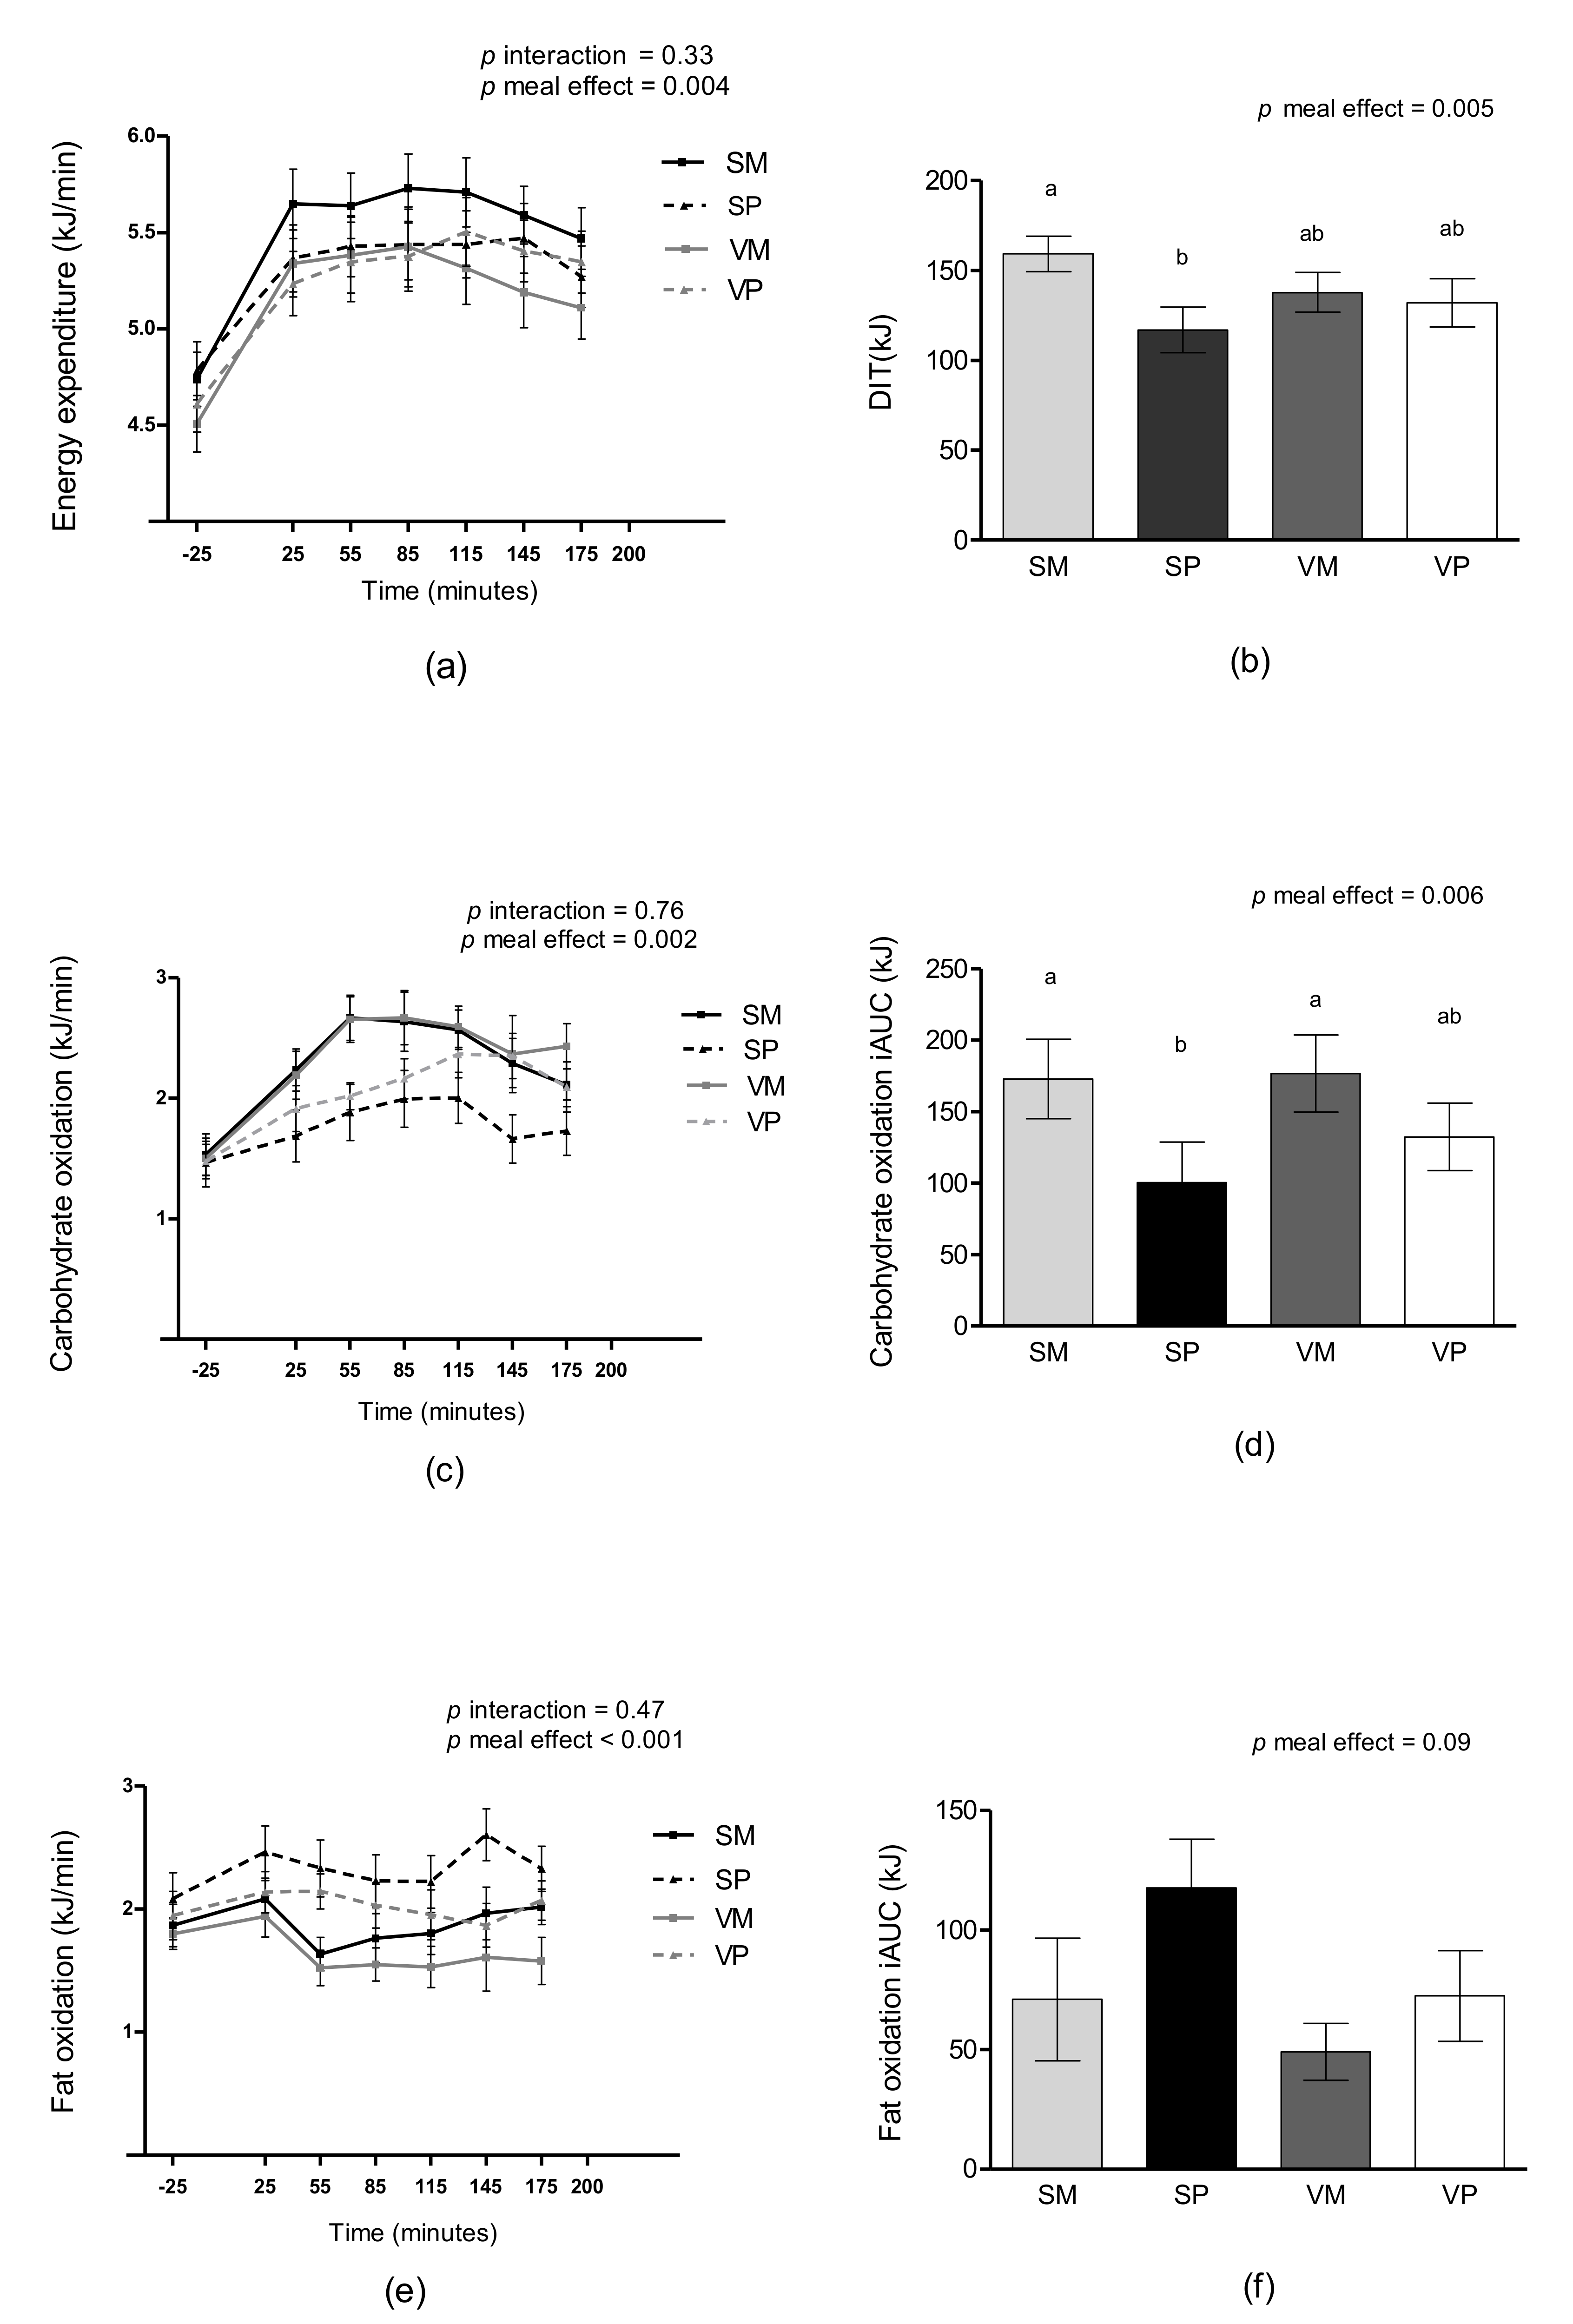
3.2. DIT and Substrate Oxidation
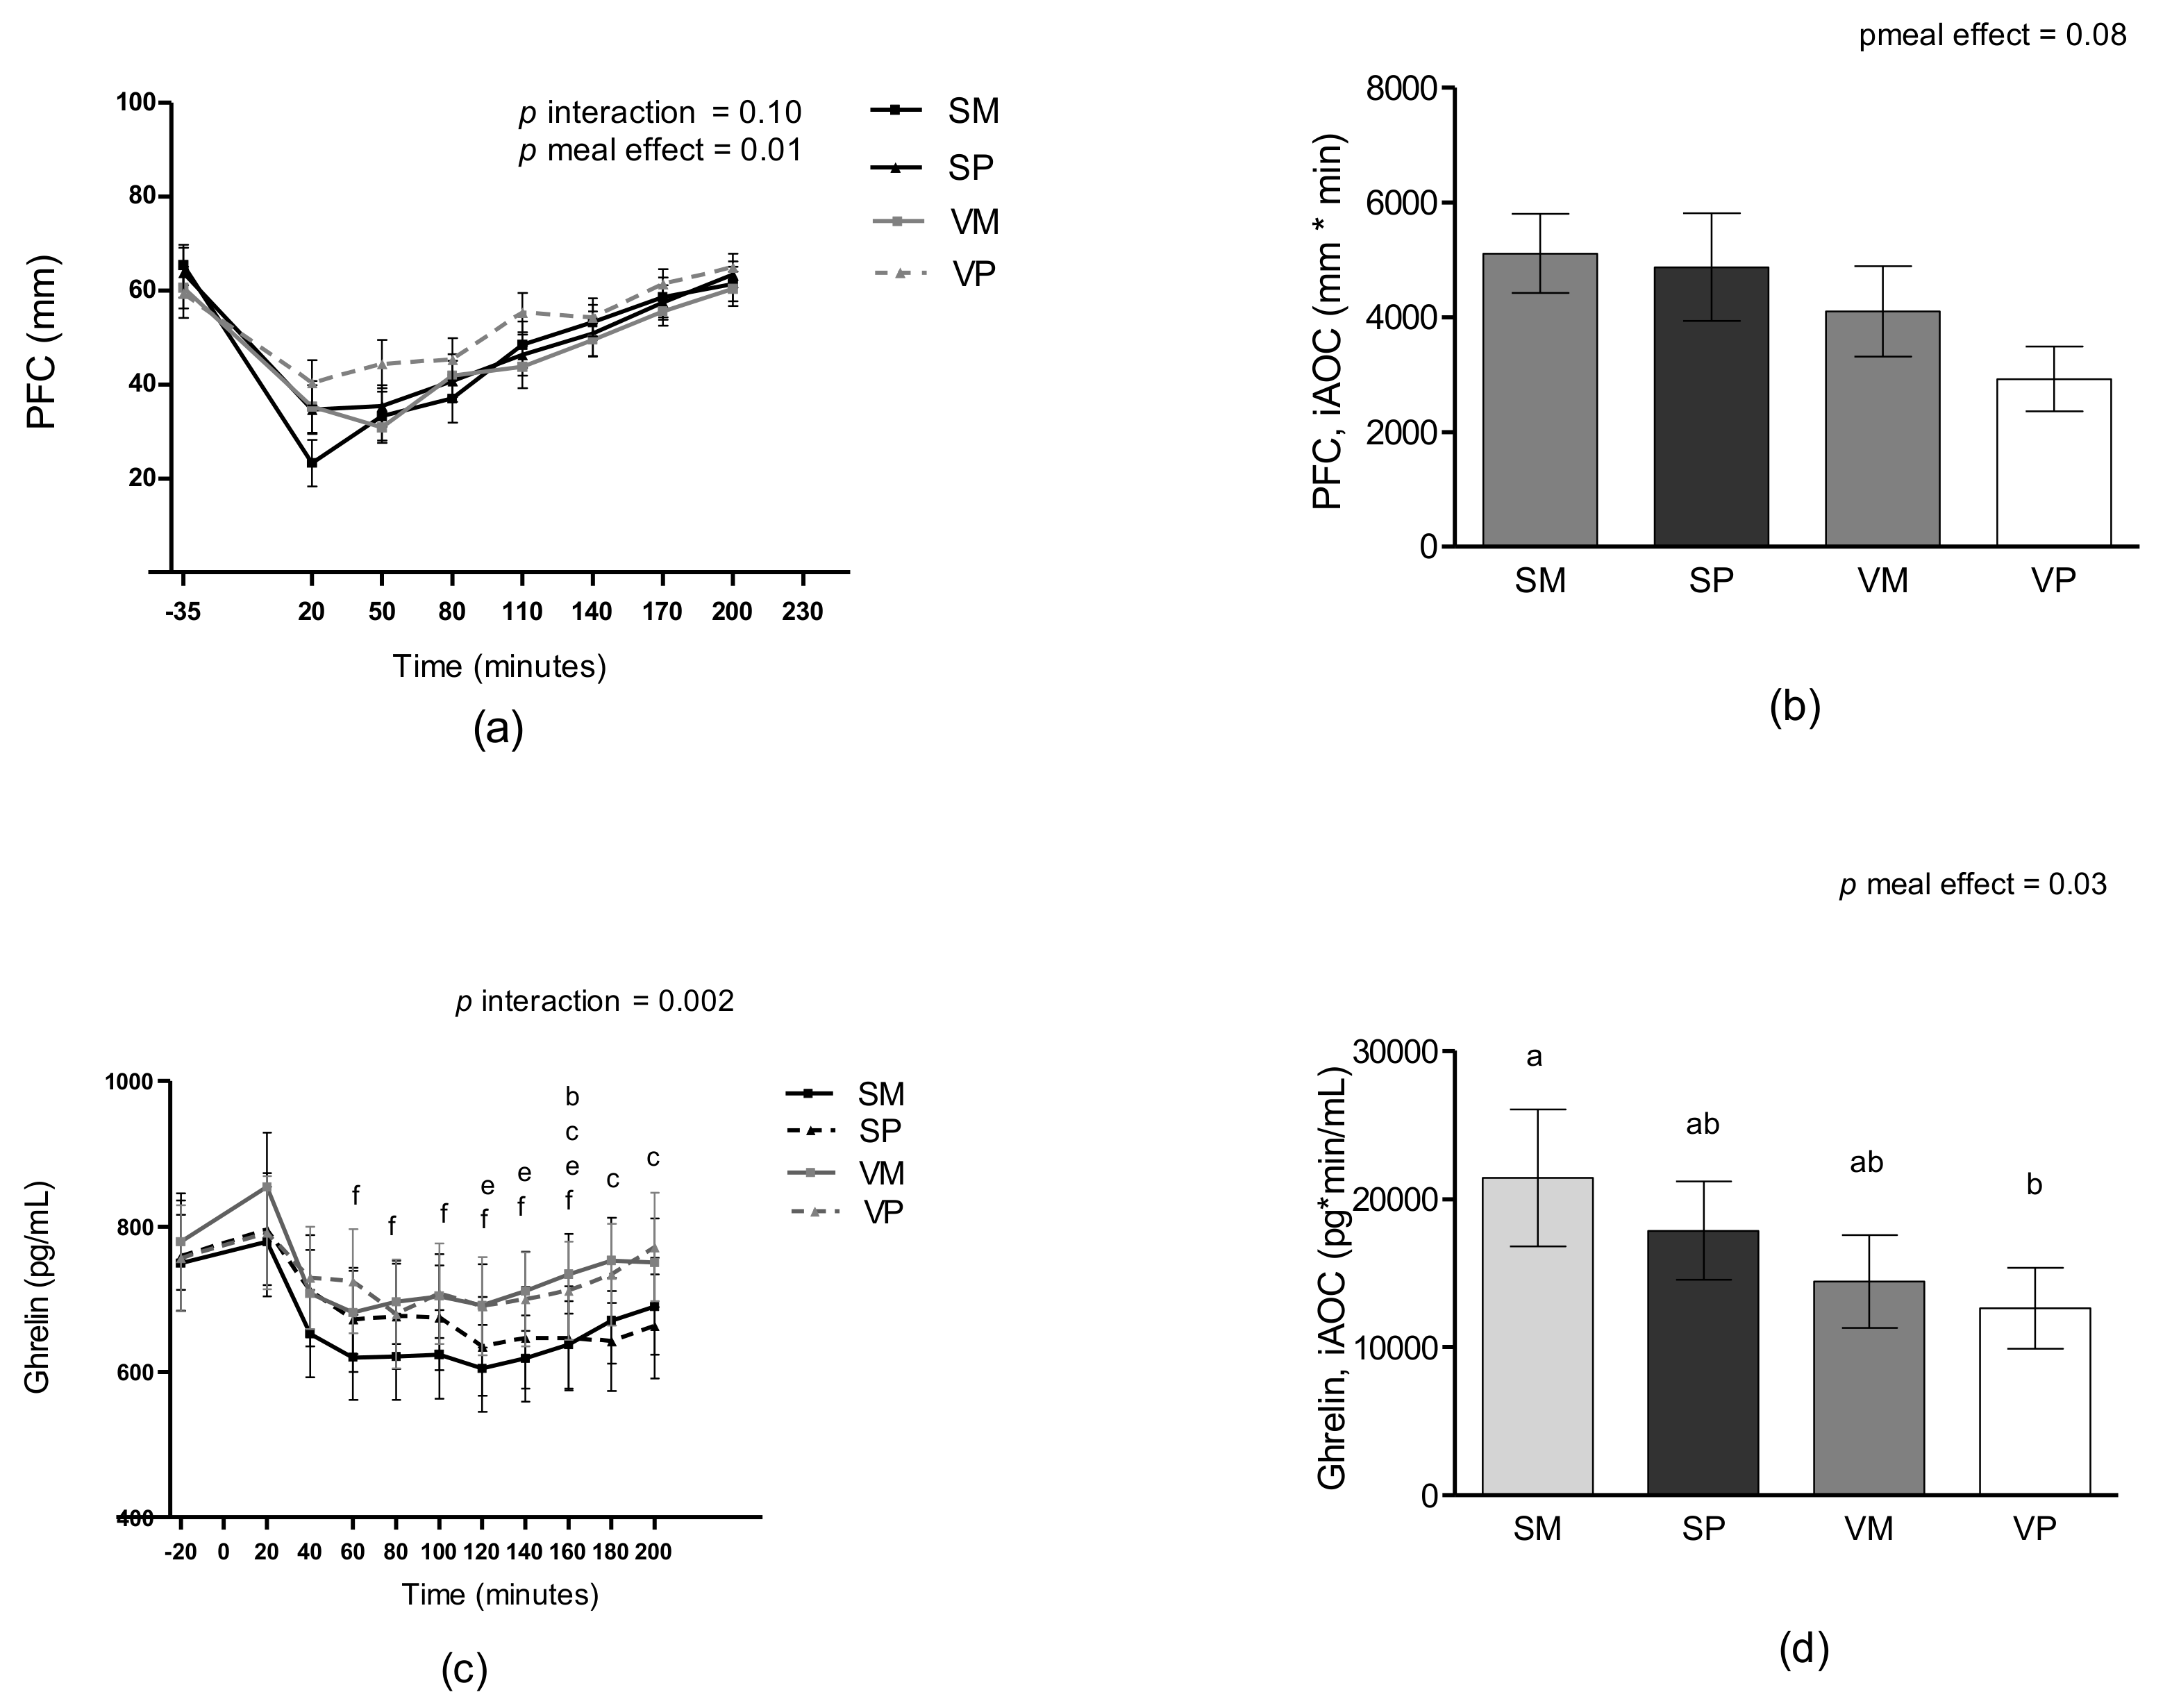
3.3. Appetite Sensations
3.4. Ad Libitum Energy Intake
3.5. Ghrelin
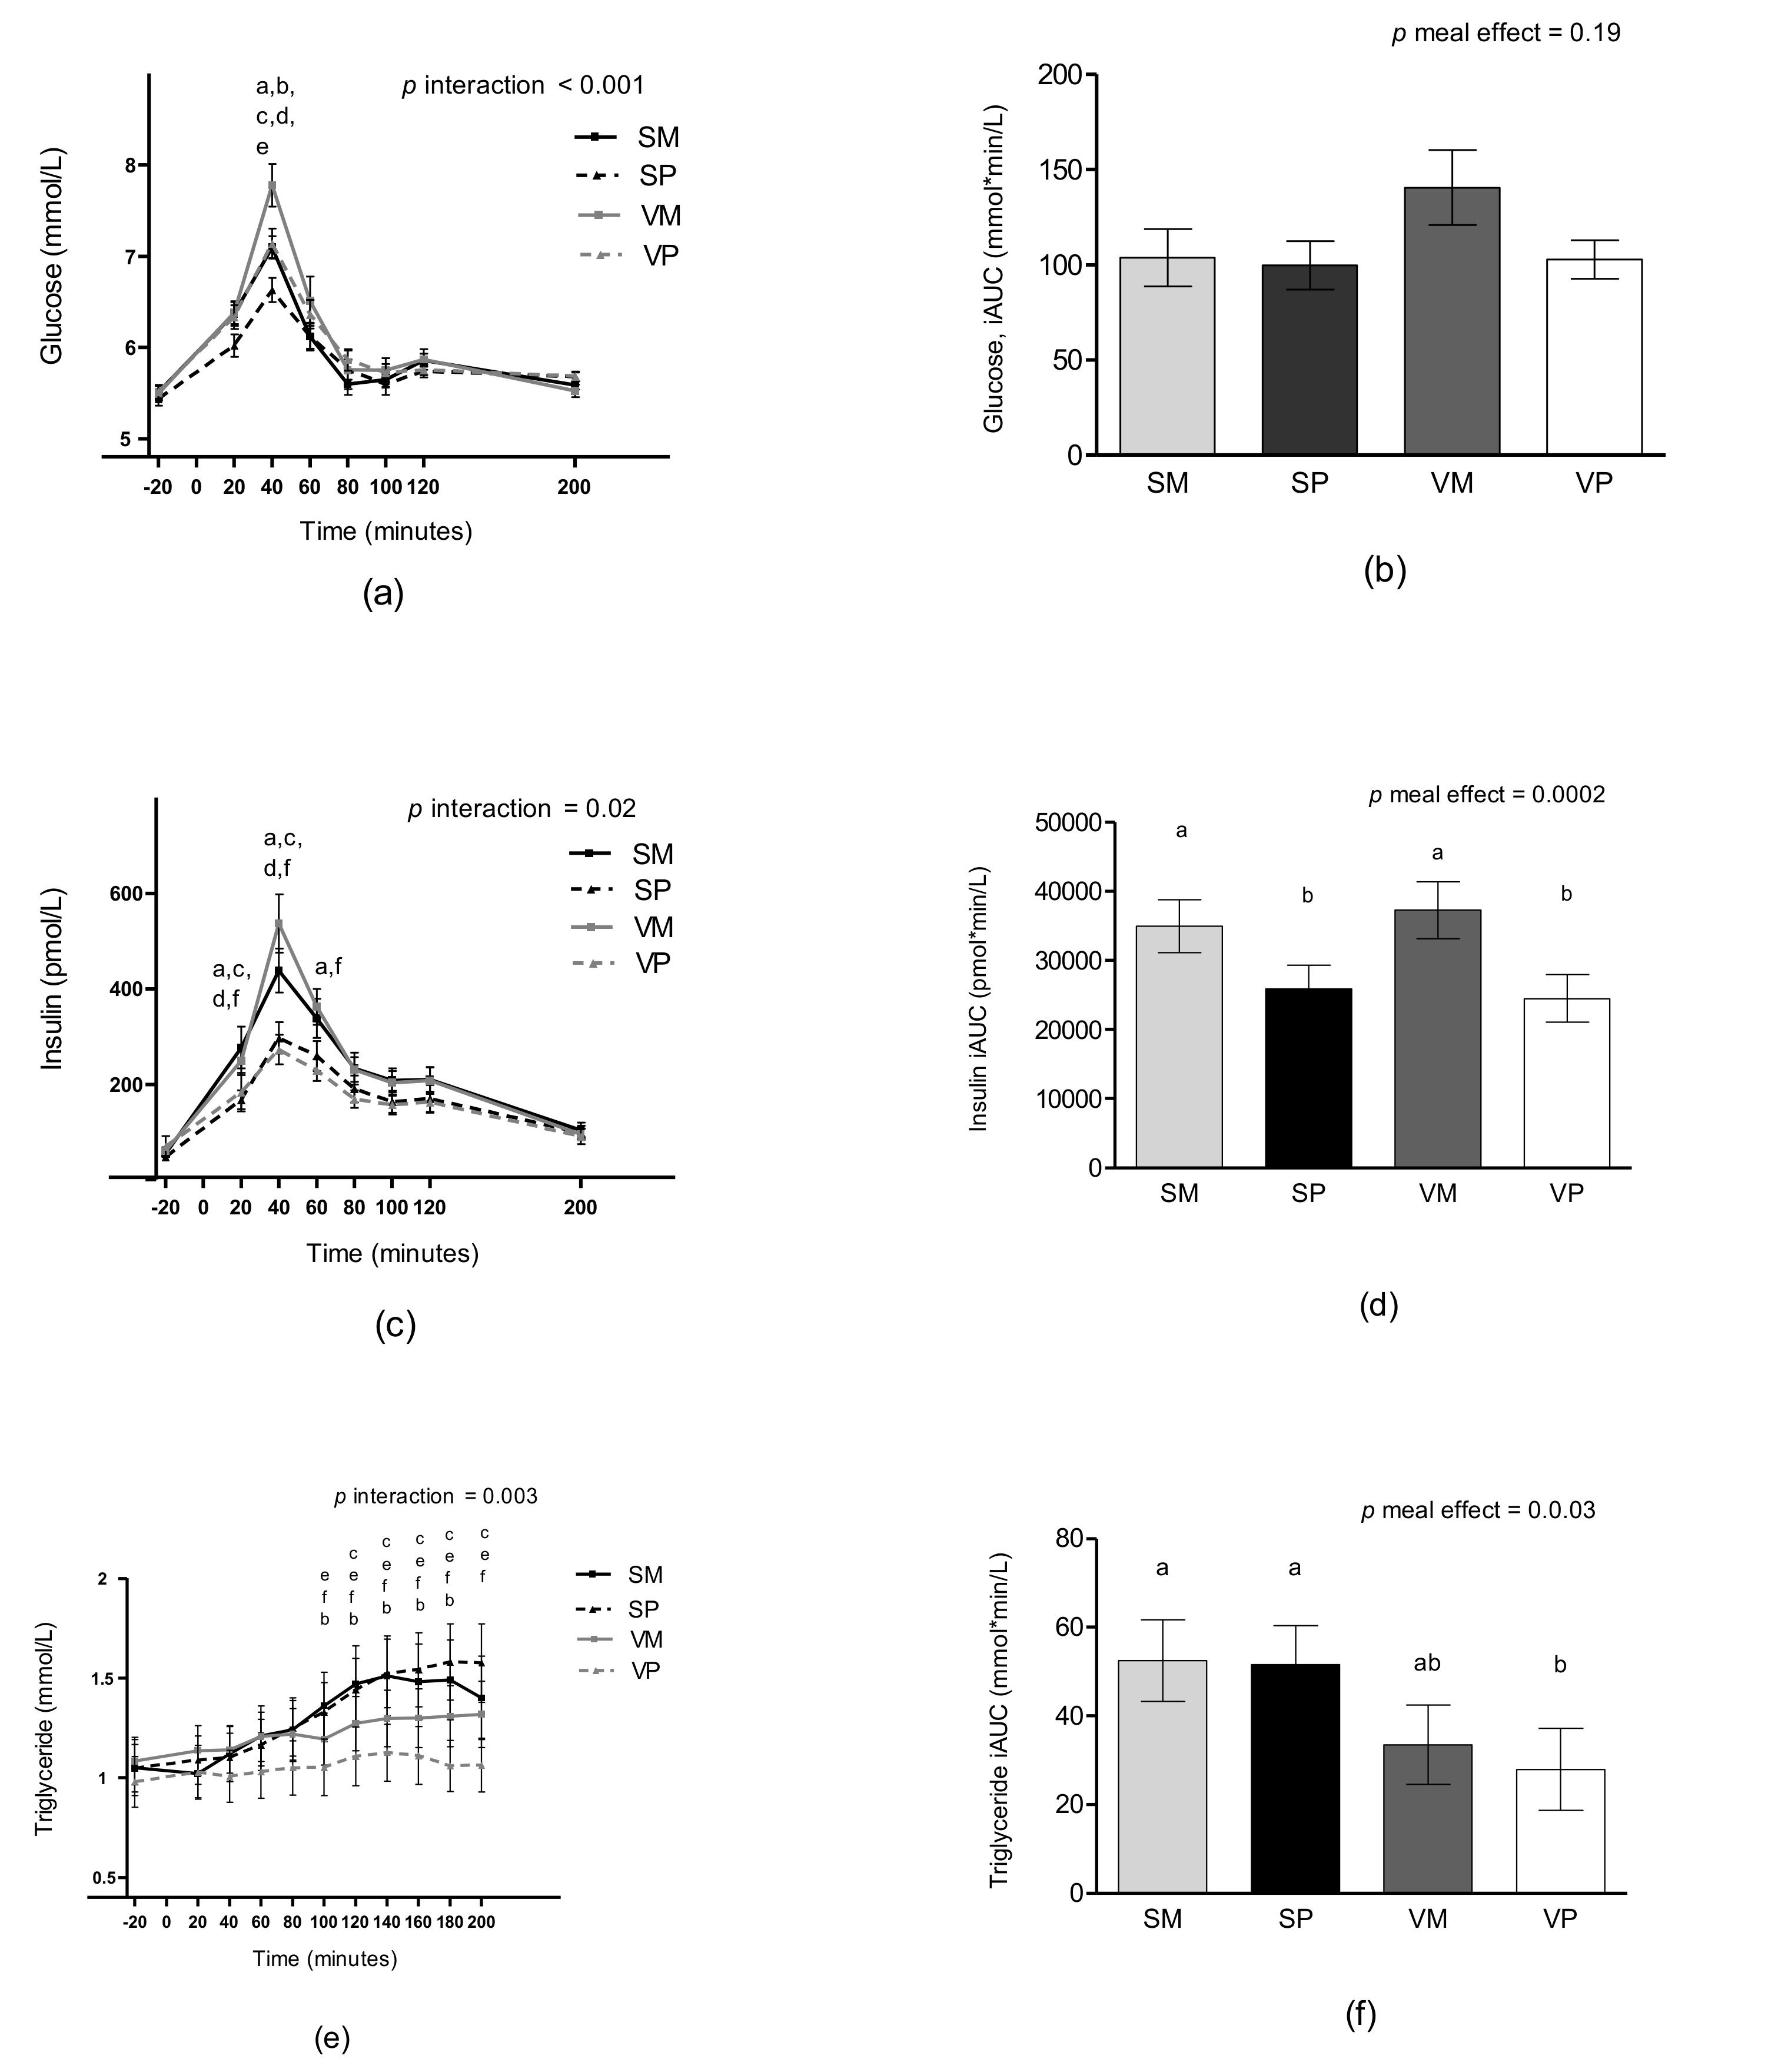
3.6. Glucose and Insulin
3.7. Triglycerides
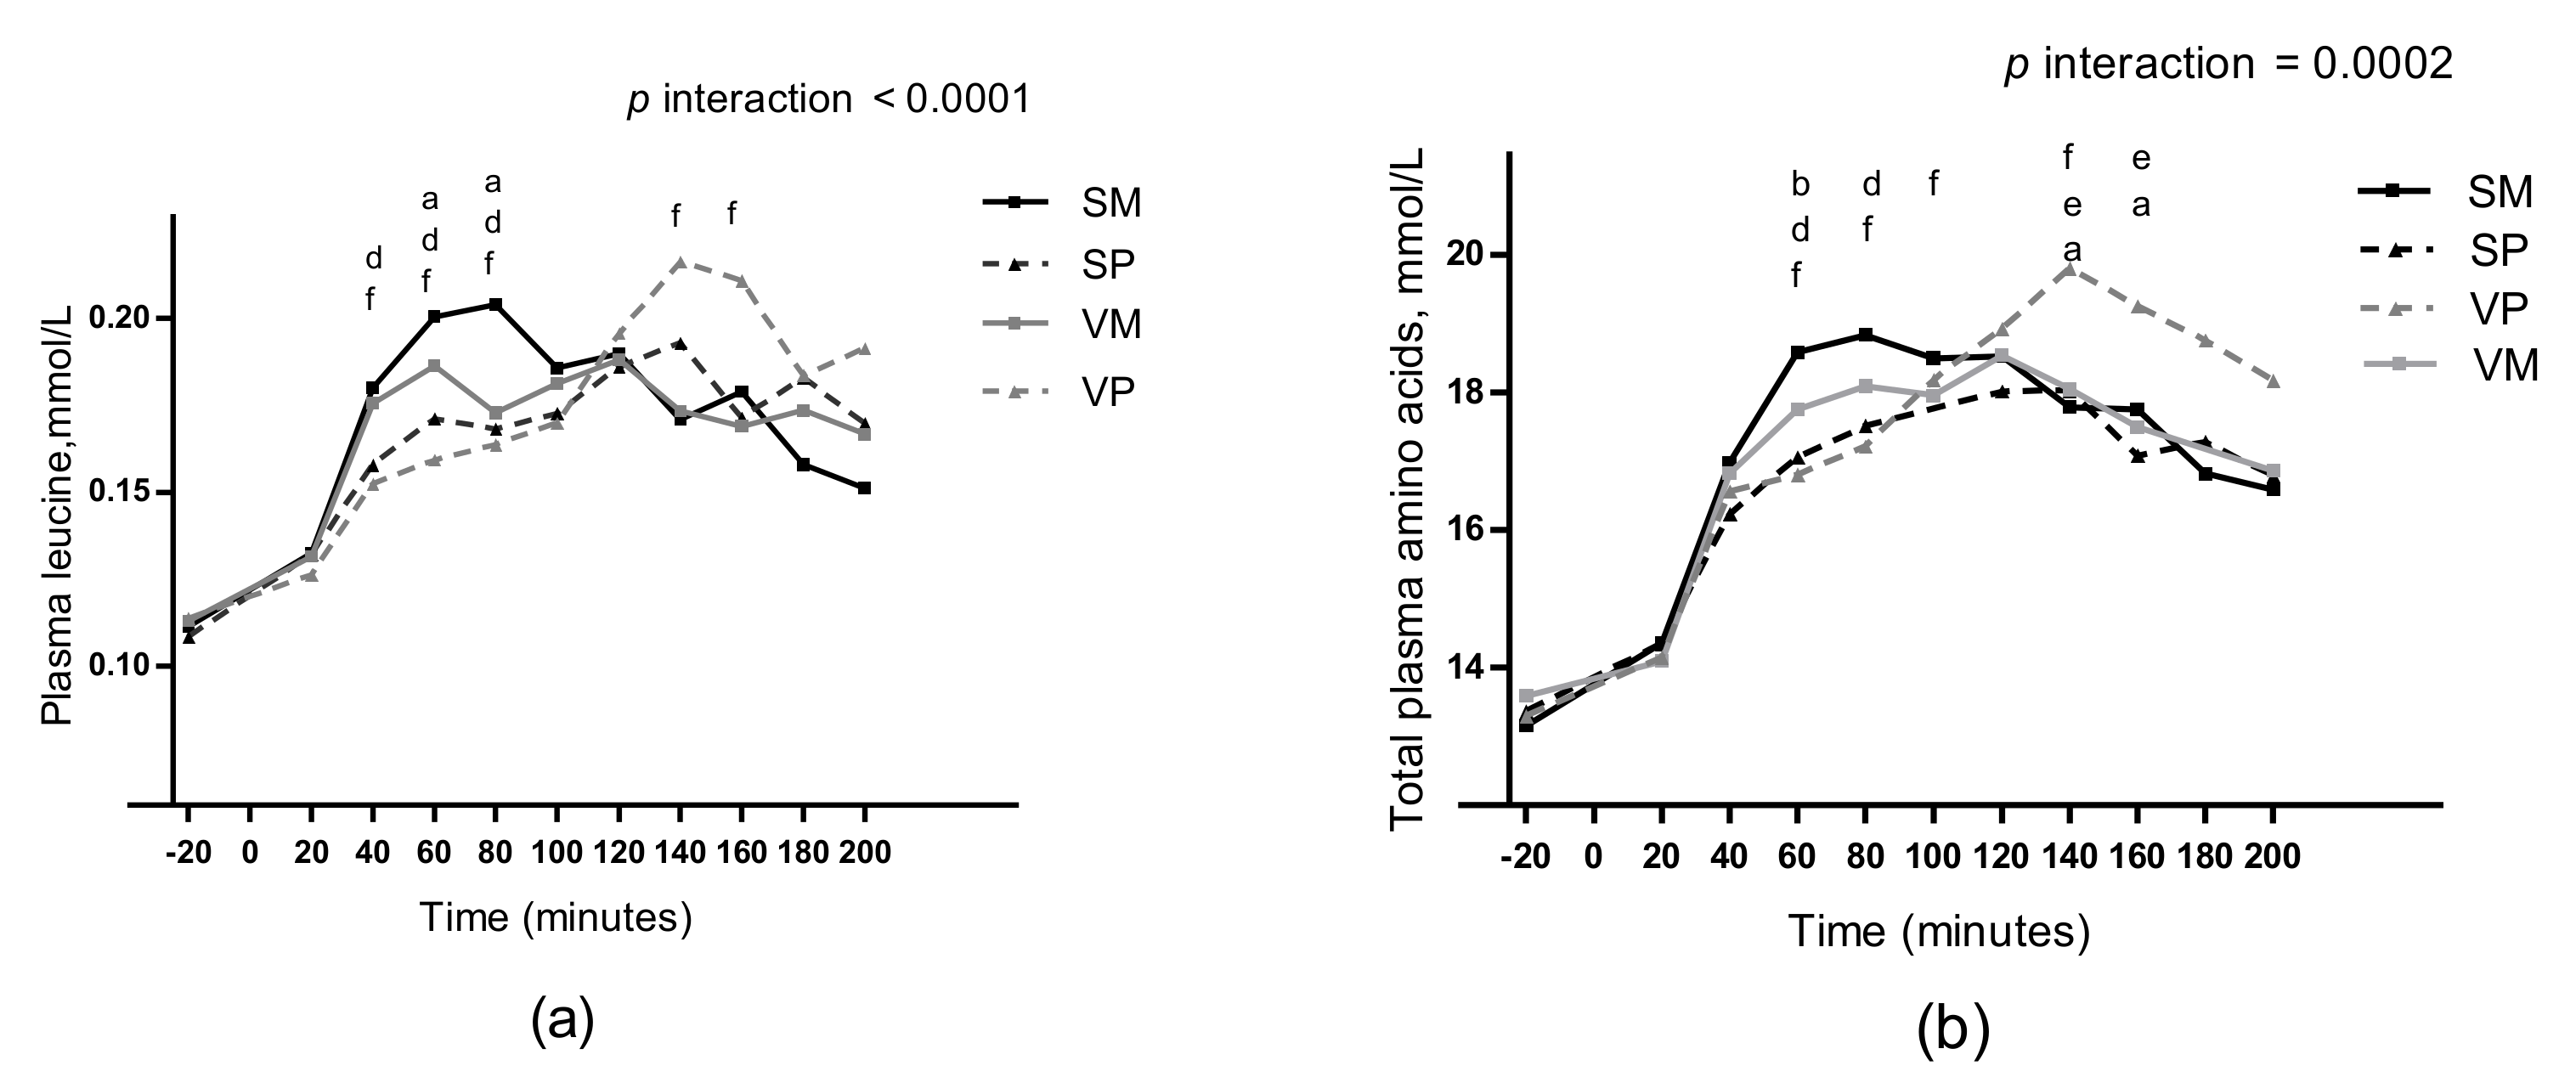
3.8. Plasma Amino Acids
3.9. Evaluations of the Test Meals
3.10. Wel-Bleing and Gastrointestinal Side Effects
4. Discussion
4.1. Strengths and Limitations
4.2. Conclusions
Supplementary Materials
Author Contributions
Funding
Acknowledgments
Conflicts of Interest
References
- Belza, A.; Ritz, C.; Sørensen, M.Q.; Holst, J.J.; Rehfeld, J.F.; Astrup, A. Contribution of gastroenteropancreatic appetite hormones to protein-induced satiety. Am. J. Clin. Nutr. 2013, 97, 980–989. [Google Scholar] [CrossRef] [PubMed] [Green Version]
- Hochstenbach-Waelen, A.; Westerterp-Plantenga, M.S.; Veldhorst, M.A.B.; Westerterp, K.R. Single-protein casein and gelatin diets affect energy expenditure similarly but substrate balance and appetite differently in adults. J. Nutr. 2009, 139, 2285–2292. [Google Scholar] [CrossRef] [PubMed]
- Lejeune, M.P.; Westerterp, K.R.; Adam, T.C.; Luscombe-Marsh, N.D.; Westerterp-Plantenga, M.S. Ghrelin and glucagon-like peptide 1 concentrations, 24-h satiety, and energy and substrate metabolism during a high-protein diet and measured in a respiration chamber. Am. J. Clin. Nutr. 2006, 83, 89–94. [Google Scholar] [CrossRef] [PubMed]
- Smeets, A.J.; Soenen, S.; Luscombe-Marsh, N.D.; Ueland, Ø.; Westerterp-Plantenga, M.S. Energy expenditure, satiety, and plasma ghrelin, glucagon-like peptide 1, and peptide tyrosine-tyrosine concentrations following a single high-protein lunch. J. Nutr. 2008, 138, 698–702. [Google Scholar] [CrossRef] [PubMed]
- Uhe, A.M.; Collier, G.R.; O’Dea, K. A comparison of the effects of beef, chicken and fish protein on satiety and amino acid profiles in lean male subjects. J. Nutr. 1992, 122, 467–472. [Google Scholar] [CrossRef] [PubMed]
- Holt, S.H.; Miller, J.C.; Petocz, P.; Farmakalidis, E. A satiety index of common foods. Eur. J. Clin. Nutr. 1995, 49, 675–690. [Google Scholar] [PubMed]
- Pal, S.; Ellis, V. The acute effects of four protein meals on insulin, glucose, appetite and energy intake in lean men. Br. J. Nutr. 2010, 104, 1241–1248. [Google Scholar] [CrossRef] [Green Version]
- Borzoei, S.; Neovius, M.; Barkeling, B.; Teixeira-Pinto, A.; Rössner, S. A comparison of effects of fish and beef protein on satiety in normal weight men. Eur. J. Clin. Nutr. 2006, 60, 897–902. [Google Scholar] [CrossRef] [Green Version]
- Kristensen, M.D.; Bendsen, N.T.; Christensen, S.M.; Astrup, A.; Raben, A. Meals based on vegetable protein sources (beans and peas) are more satiating than meals based on animal protein sources (veal and pork) - a randomized cross-over meal test study. Food Nutr. Res. 2016, 60, 32634. [Google Scholar] [CrossRef]
- Soucy, J.; Leblanc, J. Protein Meals and Postprandial Thermogenesis. Physiol. Behav. 1998, 65, 705–709. [Google Scholar] [CrossRef]
- Nielsen, L.; Kristensen, M.; Klingenberg, L.; Ritz, C.; Belza, A.; Astrup, A.; Raben, A. Protein from Meat or Vegetable Sources in Meals Matched for Fiber Content has Similar Effects on Subjective Appetite Sensations and Energy Intake—A Randomized Acute Cross-Over Meal Test Study. Nutrients 2018, 10, 96. [Google Scholar] [CrossRef] [PubMed]
- Nielsen, L.V.; Nyby, S.; Klingenberg, L.; Juul-Hindsgaul, N.; Rudnicki, J.; Ritz, C.; Liaset, B.; Kristiansen, K.; Madsen, L.; Raben, A. Meals based on cod or veal in combination with high or low glycemic index carbohydrates did not affect diet-induced thermogenesis, appetite sensations, or subsequent energy intake differently. Appetite 2018, 130, 199–208. [Google Scholar] [CrossRef] [PubMed]
- Nordic Council of Ministers. Nordic Nutrition Recommendations 2012: Integrating nutrition and physical activity. 2014, 5. [Google Scholar]
- Martens, M.J.I.; Lemmens, S.G.T.; Born, J.M.; Westerterp-Plantenga, M.S. A Solid High-Protein Meal Evokes Stronger Hunger Suppression Than a Liquefied High-Protein Meal. Obesity 2011, 19, 522–527. [Google Scholar] [CrossRef] [PubMed]
- Jenkins, D.J.; Wolever, T.M.; Taylor, R.H.; Barker, H.; Fielden, H.; Baldwin, J.M.; Bowling, A.C.; Newman, H.C.; Jenkins, A.L.; Goff, D.V. Glycemic index of foods: A physiological basis for carbohydrate exchange. Am. J. Clin. Nutr. 1981, 34, 362–366. [Google Scholar] [CrossRef] [PubMed]
- Díaz, E.; Galgani, J.; Aguirre, C.; Atwater, I.; Burrows, R. Effect of glycemic index on whole-body substrate oxidation in obese women. Int. J. Obes. 2005, 29, 108–114. [Google Scholar] [CrossRef]
- Keogh, J.B.; Lau, C.W.H.; Noakes, M.; Bowen, J.; Clifton, P.M. Effects of meals with high soluble fibre, high amylose barley variant on glucose, insulin, satiety and thermic effect of food in healthy lean women. Eur. J. Clin. Nutr. 2007, 61, 597–604. [Google Scholar] [CrossRef]
- Scazzina, F.; Rio, D. Del; Benini, L.; Melegari, C.; Pellegrini, N.; Marcazzan, E.; Brighenti, F. The effect of breakfasts varying in glycemic index and glycemic load on dietary induced thermogenesis and respiratory quotient. Metab. Cardiovasc. Dis. 2011, 21, 121–125. [Google Scholar] [CrossRef]
- Krog-Mikkelsen, I.; Sloth, B.; Dimitrov, D.; Tetens, I.; Björck, I.; Flint, A.; Holst, J.J.; Astrup, A.; Elmståhl, H.; Raben, A. A low glycemic index diet does not affect postprandial energy metabolism but decreases postprandial insulinemia and increases fullness ratings in healthy women. J. Nutr. 2011, 141, 1679–1684. [Google Scholar] [CrossRef]
- Kaur, B.; Quek Yu Chin, R.; Camps, S.; Henry, C.J. The impact of a low glycaemic index (GI) diet on simultaneous measurements of blood glucose and fat oxidation: A whole body calorimetric study. J. Clin. Transl. Endocrinol. 2016, 4, 45–52. [Google Scholar] [CrossRef] [Green Version]
- Hao, Q.; Lillefosse, H.H.; Fjaere, E.; Myrmel, L.S.; Midtbø, L.K.; Jarlsby, R.H.; Ma, T.; Jia, B.; Petersen, R.K.; Sonne, S.B.; et al. High-glycemic index carbohydrates abrogate the antiobesity effect of fish oil in mice. Am. J. Physiol. Endocrinol. Metab. 2012, 302, E1097–E1112. [Google Scholar] [CrossRef] [PubMed]
- Raben, A. Should obese patients be counselled to follow a low-glycaemic index diet? No. Obes. Rev. 2002, 3, 245–256. [Google Scholar] [CrossRef] [PubMed]
- Bornet, F.R.J.; Jardy-Gennetier, A.-E.; Jacquet, N.; Stowell, J. Glycaemic response to foods: Impact on satiety and long-term weight regulation. Appetite 2007, 49, 535–553. [Google Scholar] [CrossRef] [PubMed]
- Sun, F.-H.; Li, C.; Zhang, Y.-J.; Wong, S.; Wang, L. Effect of Glycemic Index of Breakfast on Energy Intake at Subsequent Meal among Healthy People: A Meta-Analysis. Nutrients 2016, 8, 37. [Google Scholar] [CrossRef] [PubMed]
- Flint, A.; Raben, A.; Blundell, J.E.; Astrup, A. Reproducibility, power and validity of visual analogue scales in assessment of appetite sensations in single test meal studies. Int. J. Obes. Relat. Metab. Disord. 2000, 24, 38–48. [Google Scholar] [CrossRef] [PubMed] [Green Version]
- Atkinson, F.S.; Foster-Powell, K.; Brand-Miller, J.C. International tables of glycemic index and glycemic load values: 2008. Diabetes Care 2008, 31, 2281–2283. [Google Scholar] [CrossRef]
- Tastesen, H.S.; Keenan, A.H.; Madsen, L.; Kristiansen, K.; Liaset, B. Scallop protein with endogenous high taurine and glycine content prevents high-fat, high-sucrose-induced obesity and improves plasma lipid profile in male C57BL/6J mice. Amino Acids 2014, 46, 1659–1671. [Google Scholar] [CrossRef] [Green Version]
- Elia, M.; Livesey, G. Energy expenditure and fuel selection in biological systems: The theory and practice of calculations based on indirect calorimetry and tracer methods. World Rev. Nutr. Diet. 1992, 70, 68–131. [Google Scholar]
- Abumrad, N.N.; Rabin, D.; Diamond, M.P.; Lacy, W.W. Use of a heated superficial hand vein as an alternative site for the measurement of amino acid concentrations and for the study of glucose and alanine kinetics in man. Metabolism 1981, 30, 936–940. [Google Scholar] [CrossRef]
- Research Randomizer. Available online: https://www.randomizer.org/ (accessed on 6 February 2018).
- Lorenzen, J.; Frederiksen, R.; Hoppe, C.; Hvid, R.; Astrup, A. The effect of milk proteins on appetite regulation and diet-induced thermogenesis. Eur. J. Clin. Nutr. 2012, 66, 622–627. [Google Scholar] [CrossRef] [Green Version]
- Hothorn, T.; Bretz, F.; Westfall, P. Simultaneous Inference in General Parametric Models. Biom. J. 2008, 50, 346–363. [Google Scholar] [CrossRef] [PubMed] [Green Version]
- Boirie, Y.; Dangin, M.; Gachon, P.; Vasson, M.P.; Maubois, J.L.; Beaufrère, B. Slow and fast dietary proteins differently modulate postprandial protein accretion. Proc. Natl. Acad. Sci. USA 1997, 94, 14930–14935. [Google Scholar] [CrossRef] [PubMed] [Green Version]
- Acheson, K.J.; Blondel-Lubrano, A.; Oguey-Araymon, S.; Beaumont, M.; Emady-Azar, S.; Ammon-Zufferey, C.; Monnard, I.; Pinaud, S.; Nielsen-Moennoz, C.; Bovetto, L. Protein choices targeting thermogenesis and metabolism. Am. J. Clin. Nutr. 2011, 93, 525–534. [Google Scholar] [CrossRef] [PubMed] [Green Version]
- Wall, B.T.; Hamer, H.M.; de Lange, A.; Kiskini, A.; Groen, B.B.L.; Senden, J.M.G.; Gijsen, A.P.; Verdijk, L.B.; van Loon, L.J.C. Leucine co-ingestion improves post-prandial muscle protein accretion in elderly men. Clin. Nutr. 2013, 32, 412–419. [Google Scholar] [CrossRef] [PubMed]
- Tsujinaka, T.; Sakaue, M.; Iijima, S.; Ebisui, C.; Kan, K.; Kishibuchi, M.; Morimoto, T.; Kido, Y. Modulation of thermogenic response to parenteral amino acid infusion in surgical stress. Nutrition 1996, 12, 36–39. [Google Scholar] [CrossRef]
- Camps, S.G.; Kaur, B.; Quek, R.Y.C.; Henry, C.J. Does the ingestion of a 24 hour low glycaemic index Asian mixed meal diet improve glycaemic response and promote fat oxidation? A controlled, randomized cross-over study. Nutr. J. 2017, 16, 43. [Google Scholar] [CrossRef] [PubMed]
- Robertson, M.D.; Jackson, K.G.; Fielding, B.A.; Morgan, L.M.; Williams, C.M.; Frayn, K.N. Acute ingestion of a meal rich in n-3 polyunsaturated fatty acids results in rapid gastric emptying in humans. Am. J. Clin. Nutr. 2002, 76, 232–238. [Google Scholar] [CrossRef]
- Griffo, E.; Di Marino, L.; Patti, L.; Bozzetto, L.; Annuzzi, G.; Cipriano, P.; Mangione, A.; Della Pepa, G.; Cocozza, S.; Riccardi, G.; et al. Test meals rich in marine long-chain n-3 polyunsaturated fatty acids increase postprandial chylomicron response. Nutr. Res. 2014, 34, 661–666. [Google Scholar] [CrossRef]
- Roche, H.M.; Gibney, M.J. Effect of long-chain n−3 polyunsaturated fatty acids on fasting and postprandial triacylglycerol metabolism. Am. J. Clin. Nutr. 2000, 71, 232s–237s. [Google Scholar] [CrossRef] [PubMed]
- Stevenson, J.L.; Clevenger, H.C.; Cooper, J.A. Hunger and satiety responses to high-fat meals of varying fatty acid composition in women with obesity. Obesity (Silver Spring) 2015, 23, 1980–1986. [Google Scholar] [CrossRef] [Green Version]
- Gatti, E.; Noè, D.; Pazzucconi, F.; Gianfranceschi, G.; Porrini, M.; Testolin, G.; Sirtori, C.R. Differential effect of unsaturated oils and butter on blood glucose and insulin response to carbohydrate in normal volunteers. Eur. J. Clin. Nutr. 1992, 46, 161–166. [Google Scholar] [PubMed]
- Dworatzek, P.D.N.; Hegele, R.A.; Wolever, T.M.S. Postprandial lipemia in subjects with the threonine 54 variant of the fatty acid-binding protein 2 gene is dependent on the type of fat ingested. Am. J. Clin. Nutr. 2004, 79, 1110–1117. [Google Scholar] [CrossRef] [PubMed]
- Henry, C.J.K.; Lightowler, H.J.; Newens, K.J.; Pata, N. The influence of adding fats of varying saturation on the glycaemic response of white bread. Int. J. Food Sci. Nutr. 2008, 59, 61–69. [Google Scholar] [CrossRef] [PubMed]
- MacIntosh, C.G.; Holt, S.H.A.; Brand-Miller, J.C. The degree of fat saturation does not alter glycemic, insulinemic or satiety responses to a starchy staple in healthy men. J. Nutr. 2003, 133, 2577–2580. [Google Scholar] [CrossRef] [PubMed]
- Sun, L.; Tan, K.W.J.; Lim, J.Z.; Magkos, F.; Henry, C.J. Dietary fat and carbohydrate quality have independent effects on postprandial glucose and lipid responses. Eur. J. Nutr. 2018, 57, 243–250. [Google Scholar] [CrossRef] [PubMed]
- Jahan-Mihan, A.; Luhovyy, B.L.; El Khoury, D.; Anderson, G.H. Dietary proteins as determinants of metabolic and physiologic functions of the gastrointestinal tract. Nutrients 2011, 3, 574–603. [Google Scholar] [CrossRef] [PubMed]
- Fødevareinstituttet, D.T.U. Frida Fødevaredata. Version 2. 2016. Available online: https://frida.fooddata.dk (accessed on 14 March 2018).
- Salo-Viiiinhen, P.P.; Koivistoinen, P.E. Determination of protein in foods: Comparison of net protein and crude protein (Nx 6.25) values. Food Chembtry 1996, 51, 21–31. [Google Scholar]


| SM | SP | VM | VP | |
|---|---|---|---|---|
| Salmon filet, g | 108.8 | 108.8 | - | - |
| Wholegrain pasta, g | - | 45.2 | - | 44 |
| Veal, g | - | - | 108.8 | 108.8 |
| Mashed Potato Powder, g | 48.0 | - | 46.8 | - |
| Tomato puree concentrate, g | 17.6 | 17.6 | 17.6 | 17.6 |
| Onion, g | 22.4 | 22.4 | 22.4 | 22.4 |
| Table salt, g | 2.4 | 2.4 | 2.4 | 2.4 |
| Water, g | 28.8 | 28.8 | 28.8 | 28.8 |
| Whole egg, g | 9.6 | 9.6 | 9.6 | 9.6 |
| Onion, g | 9.6 | 9.6 | 9.6 | 9.6 |
| Cream 38% fat, g | 11.2 | 11.2 | 11.2 | 11.2 |
| Breadcrumbs, g | 9.6 | 9.6 | 9.6 | 9.6 |
| Water with meal, g | 216 | 219 | 217 | 220 |
| Energy kJ | 2012 | 2011 | 2012 | 2010 |
| Total weight (g) | 484 | 484 | 484 | 484 |
| Energy density (kJ/g) | 4.16 | 4.15 | 4.16 | 4.15 |
| Protein %E | 25.1 | 25.7 | 25.1 | 25.7 |
| Protein, g | 29.8 | 30.4 | 29.8 | 30.3 |
| Fat %E | 34.3 | 33.3 | 35.0 | 34.0 |
| Fat, g | 18.6 | 18.1 | 19.0 | 18.5 |
| Carbohydrate %E | 40.6 | 41.1 | 39.8 | 40.3 |
| Carbohydrate, g | 45.8 | 46.2 | 44.9 | 45.3 |
| Fiber, g | 4.8 | 5.0 | 4.7 | 4.9 |
| Saturated fat, g | 6.6 | 5.7 | 9.1 | 8.2 |
| Mono unsaturated fat, g | 5.4 | 5.4 | 7.3 | 7.3 |
| Poly unsaturated fat, g | 4.4 | 4.4 | 0.9 | 0.9 |
| n-3 fatty acids | 3.6 | 3.6 | 0.2 | 0.2 |
| n-6 fatty acids | 0.8 | 0.8 | 0.7 | 0.7 |
| GI | 85 | 40 | 85 | 40 |
| GL | 35 | 16 | 38 | 18 |
| SM | SP | VM | VP | |
|---|---|---|---|---|
| g/meal | ||||
| Histidine | 0.68 | 0.68 | 0.90 | 0.89 |
| Taurine | 0.03 | 0.04 | 0.07 | 0.07 |
| Serine | 1.11 | 1.14 | 1.22 | 1.28 |
| Arginine | 1.52 | 1.48 | 1.81 | 1.84 |
| Glycine | 1.21 | 1.18 | 1.53 | 1.64 |
| Aspartic acid | 3.05 | 2.41 | 3.25 | 2.72 |
| Glutamic acid | 4.10 | 4.81 | 5.10 | 5.83 |
| Threonine | 1.20 | 1.13 | 1.28 | 1.25 |
| Alanine | 1.46 | 1.41 | 1.67 | 1.69 |
| Lysine | 2.28 | 2.02 | 2.51 | 2.30 |
| Tyrosine | 0.94 | 0.89 | 0.97 | 0.96 |
| Methionine | 0.72 | 0.69 | 0.70 | 0.72 |
| Valine | 1.44 | 1.37 | 1.50 | 1.47 |
| Isoleucine | 1.15 | 1.10 | 1.26 | 1.24 |
| Leucine | 2.05 | 2.04 | 2.33 | 2.37 |
| Phenylalanine | 1.19 | 1.23 | 1.29 | 1.34 |
| Proline | 1.07 | 1.36 | 1.43 | 1.75 |
| Hydroxyproline | 0.06 | 0.05 | 0.26 | 0.29 |
| Tryptophan | 0.31 | 0.37 | 0.37 | 0.42 |
| Total | 25.59 | 25.39 | 29.46 | 30.08 |
| Characteristics | Values |
|---|---|
| Age, y | 28.8 ± 7.6 |
| Weight, kg | 83.3 ± 9.2 |
| Height, m | 174 ± 7 |
| BMI, kg/m2 | 27.5 ± 1.5 |
| Systolic blood pressure, mmHg | 119 ± 9 |
| Diastolic blood pressure, mmHg | 73 ± 6 |
| Fasting glucose, mmol/L | 5.1 ± 0.4 |
| SM | SP | VM | VP | |
|---|---|---|---|---|
| Total energy intake, kJ | 4911± 559 | 4975 ± 556 | 5059 ± 545 | 5059 ± 535 |
| Protein, kJ | 735 ± 110 | 812 ± 109 | 808 ± 107 | 808 ± 104 |
| Carbohydrates, kJ | 2301 ± 222 | 2275 ± 220 | 2320 ± 214 | 2184 ± 207 |
| Fat, kJ | 1863 ± 286 | 1881 ± 284 | 1919 ± 278 | 2061 ± 272 |
| SM | SP | VM | VP | |
|---|---|---|---|---|
| General appearance (mm) | 63.6 ± 6.4 a | 59.8 ± 6.3 | 53.5 ± 6.0 | 50.5 ± 5.5 a |
| Look (mm) | 78.1 ± 6.8 ab | 72.4 ± 6.7 | 63.9 ± 6.4 b | 60.5 ± 5.9 a |
| Off taste (mm) | 29.0 ± 8.1 | 32.5 ± 8.1 | 25.9 ± 7.7 | 24.8 ± 7.0 |
| Smell (mm) | 52.0 ± 6.8 | 42.0 ± 6.9 | 43.7 ± 6.5 | 40.1 ± 5.9 |
| Palatability (mm) | 43.7 ± 6.4 | 45.6 ± 6.4 | 36.1 ± 6.1 | 33.7 ± 5.5 |
© 2019 by the authors. Licensee MDPI, Basel, Switzerland. This article is an open access article distributed under the terms and conditions of the Creative Commons Attribution (CC BY) license (http://creativecommons.org/licenses/by/4.0/).
Share and Cite
Nielsen, L.V.; Nyby, S.; Klingenberg, L.; Ritz, C.; Sundekilde, U.K.; Bertram, H.C.; Westerterp-Plantenga, M.S.; Liaset, B.; Kristiansen, K.; Madsen, L.; et al. Salmon in Combination with High Glycemic Index Carbohydrates Increases Diet-Induced Thermogenesis Compared with Salmon with Low Glycemic Index Carbohydrates–An Acute Randomized Cross-Over Meal Test Study. Nutrients 2019, 11, 365. https://0-doi-org.brum.beds.ac.uk/10.3390/nu11020365
Nielsen LV, Nyby S, Klingenberg L, Ritz C, Sundekilde UK, Bertram HC, Westerterp-Plantenga MS, Liaset B, Kristiansen K, Madsen L, et al. Salmon in Combination with High Glycemic Index Carbohydrates Increases Diet-Induced Thermogenesis Compared with Salmon with Low Glycemic Index Carbohydrates–An Acute Randomized Cross-Over Meal Test Study. Nutrients. 2019; 11(2):365. https://0-doi-org.brum.beds.ac.uk/10.3390/nu11020365
Chicago/Turabian StyleNielsen, Lone V., Signe Nyby, Lars Klingenberg, Christian Ritz, Ulrik K. Sundekilde, Hanne C. Bertram, Margriet S. Westerterp-Plantenga, Bjørn Liaset, Karsten Kristiansen, Lise Madsen, and et al. 2019. "Salmon in Combination with High Glycemic Index Carbohydrates Increases Diet-Induced Thermogenesis Compared with Salmon with Low Glycemic Index Carbohydrates–An Acute Randomized Cross-Over Meal Test Study" Nutrients 11, no. 2: 365. https://0-doi-org.brum.beds.ac.uk/10.3390/nu11020365