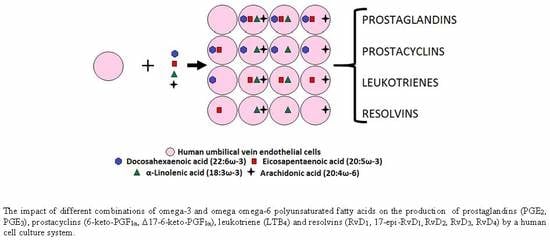
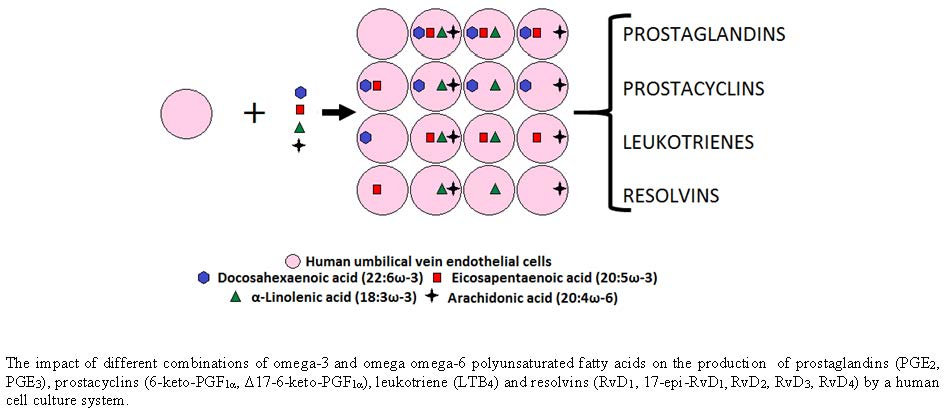
The Effect of Omega-3 and Omega-6 Polyunsaturated Fatty Acids on the Production of Cyclooxygenase and Lipoxygenase Metabolites by Human Umbilical Vein Endothelial Cells

 ,
,
Abstract
:
1. Introduction
2. Materials and Methods
2.1. Reagents
2.2. Cell Culture
2.3. Extraction and Quantitative Measuring of Cyclooxygenase and Lipoxygenase Metabolites
2.4. Statistics
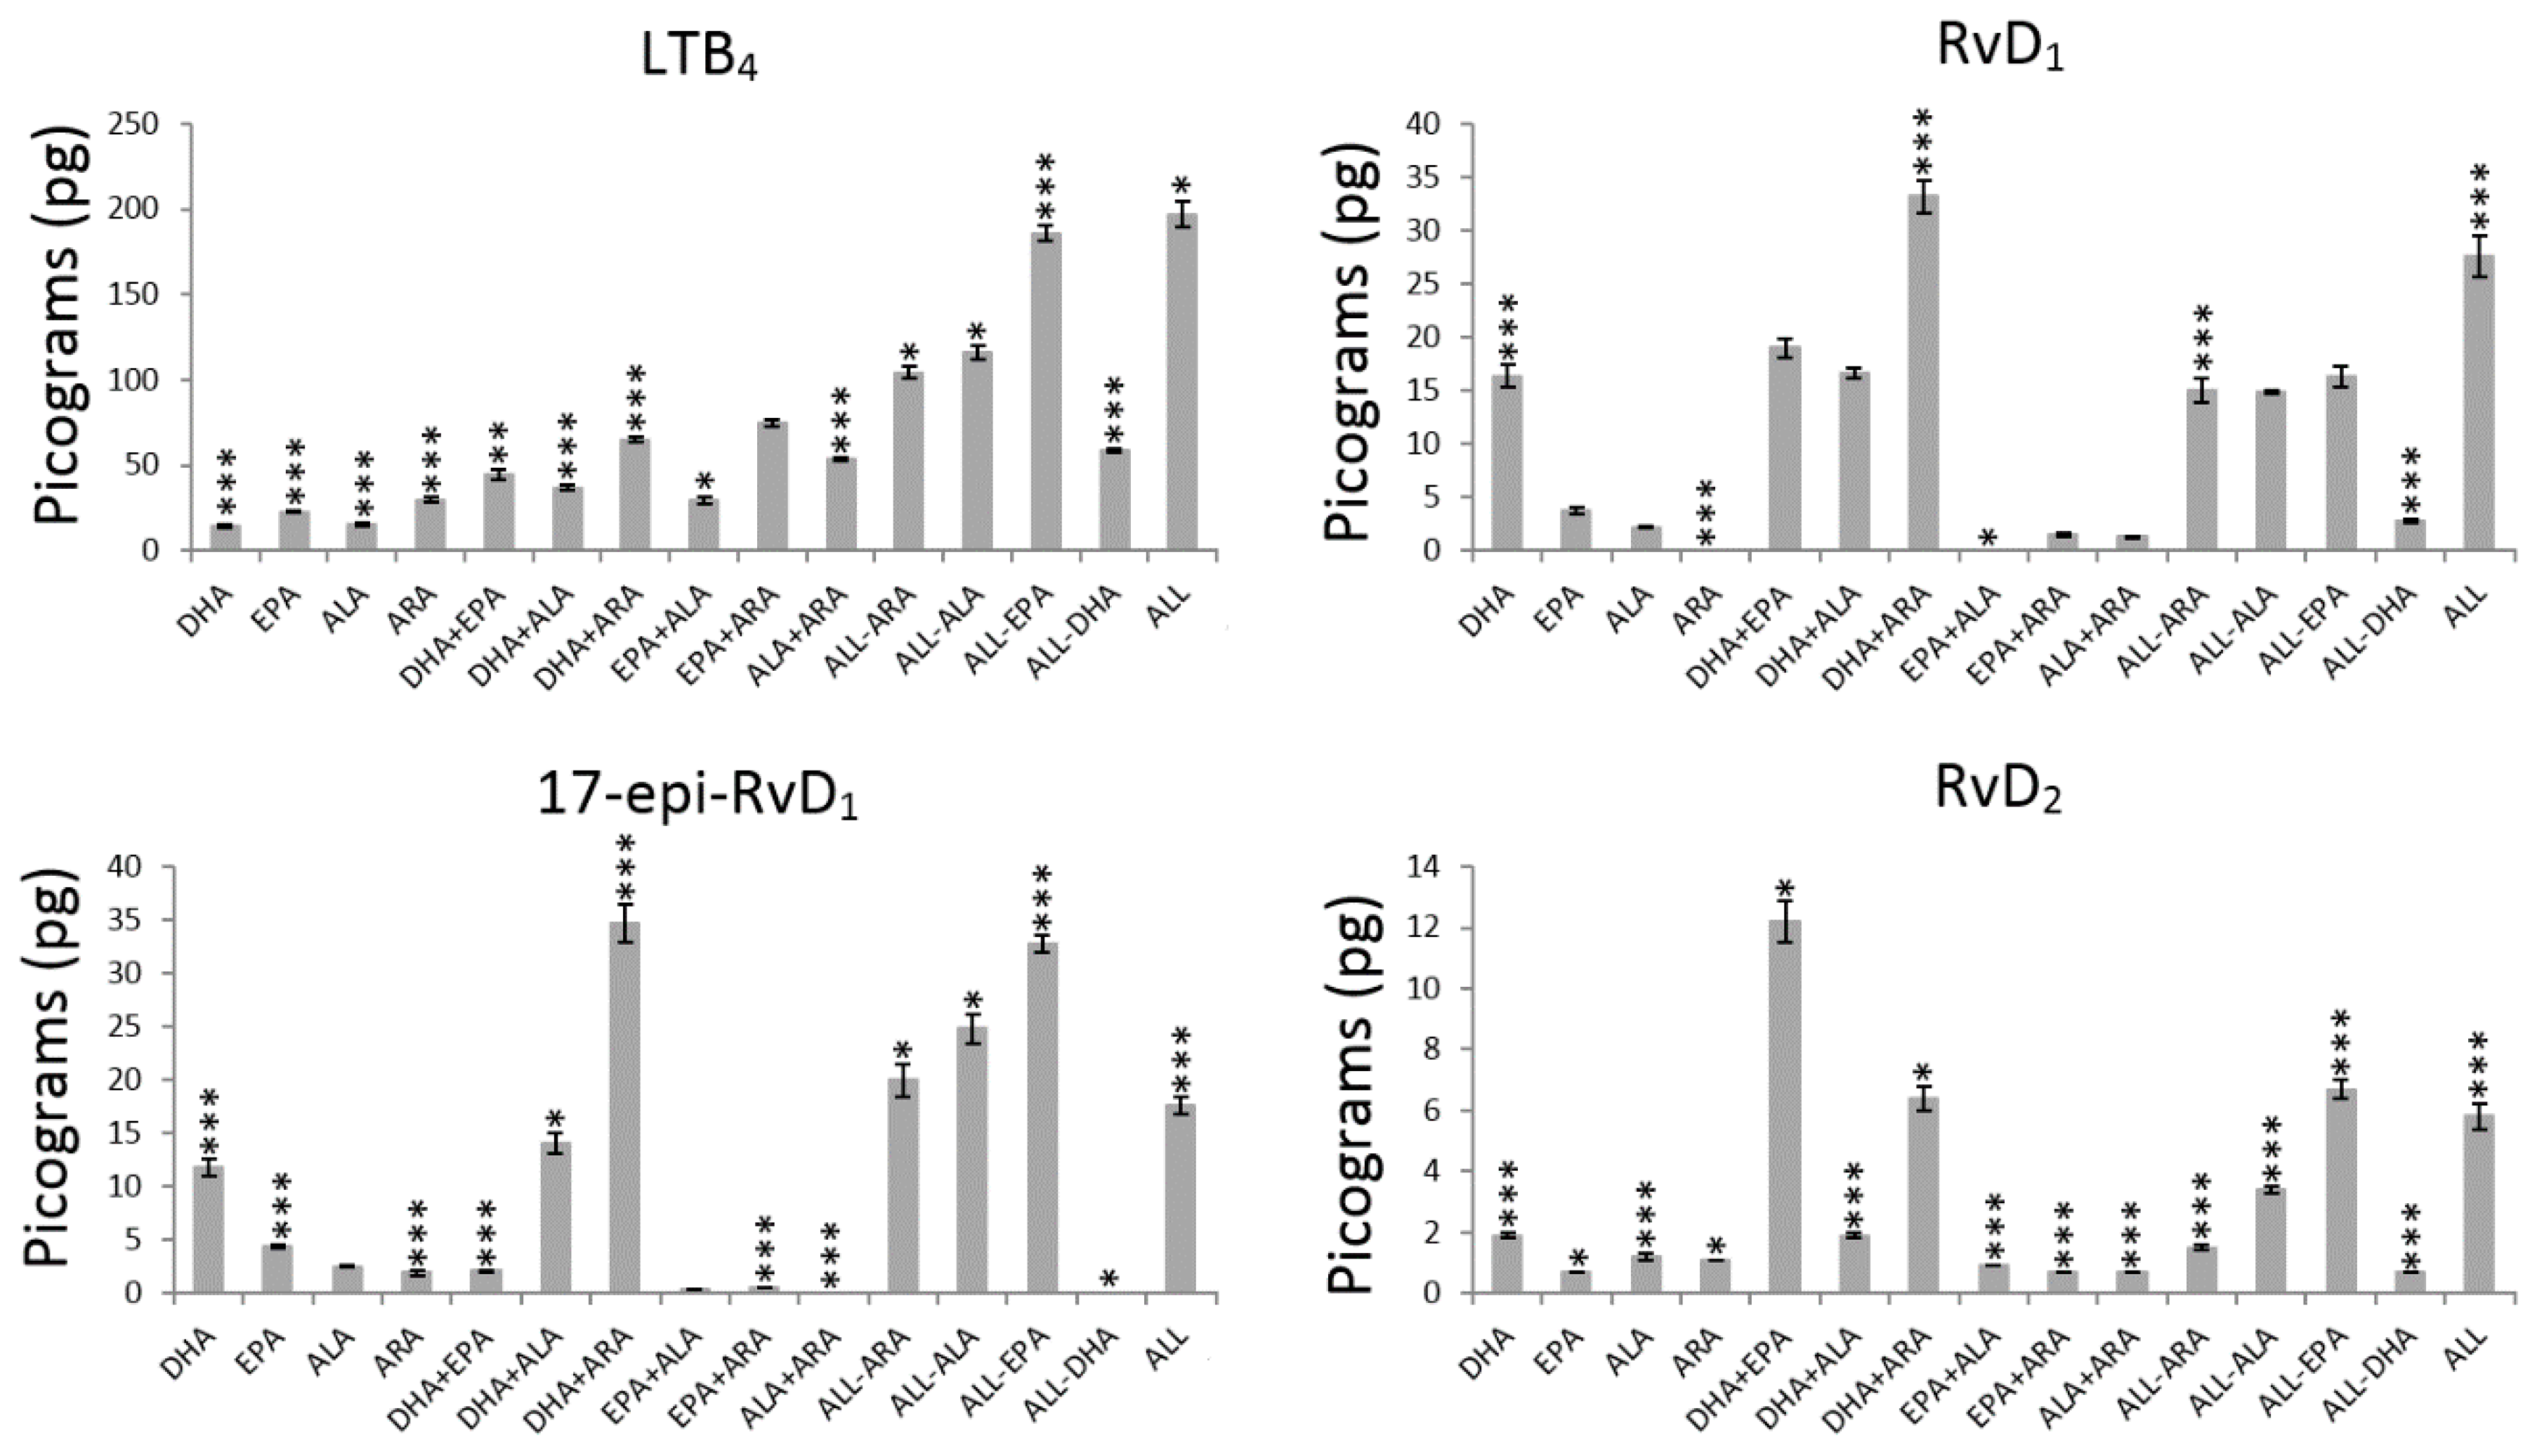
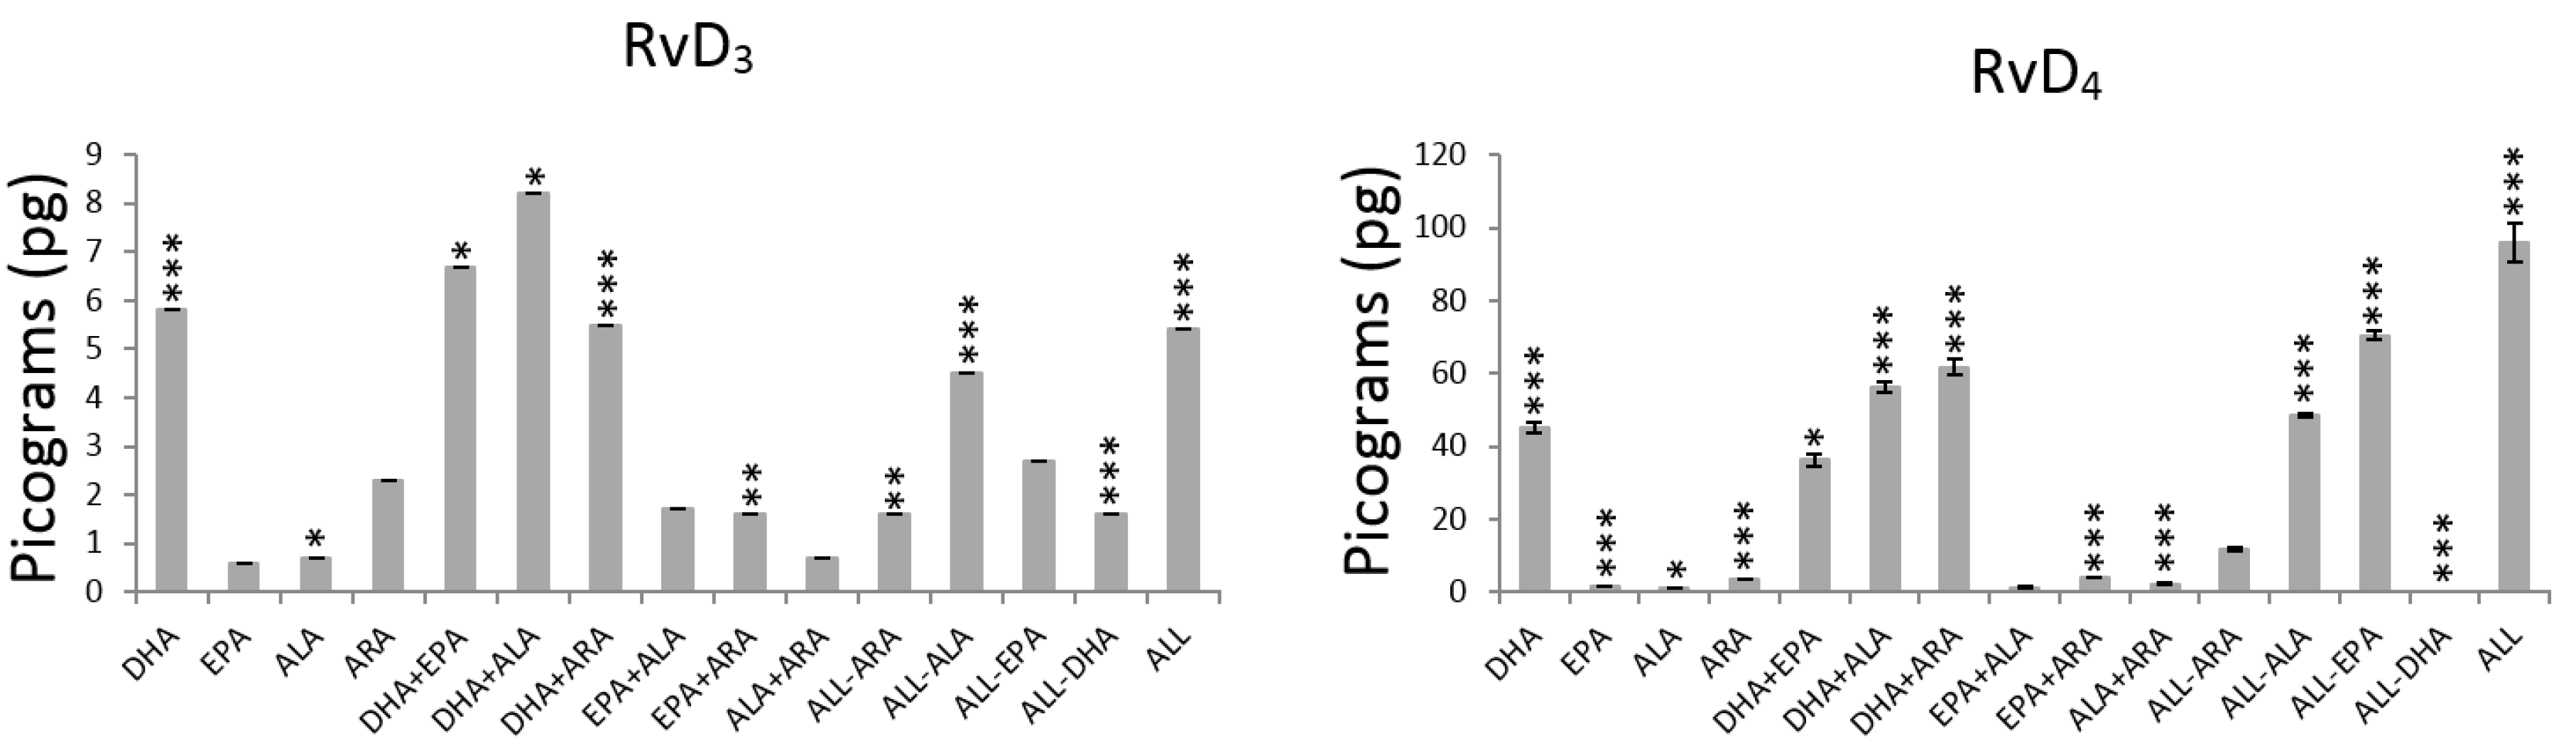
3. Results
3.1. Main Effects Evaluation
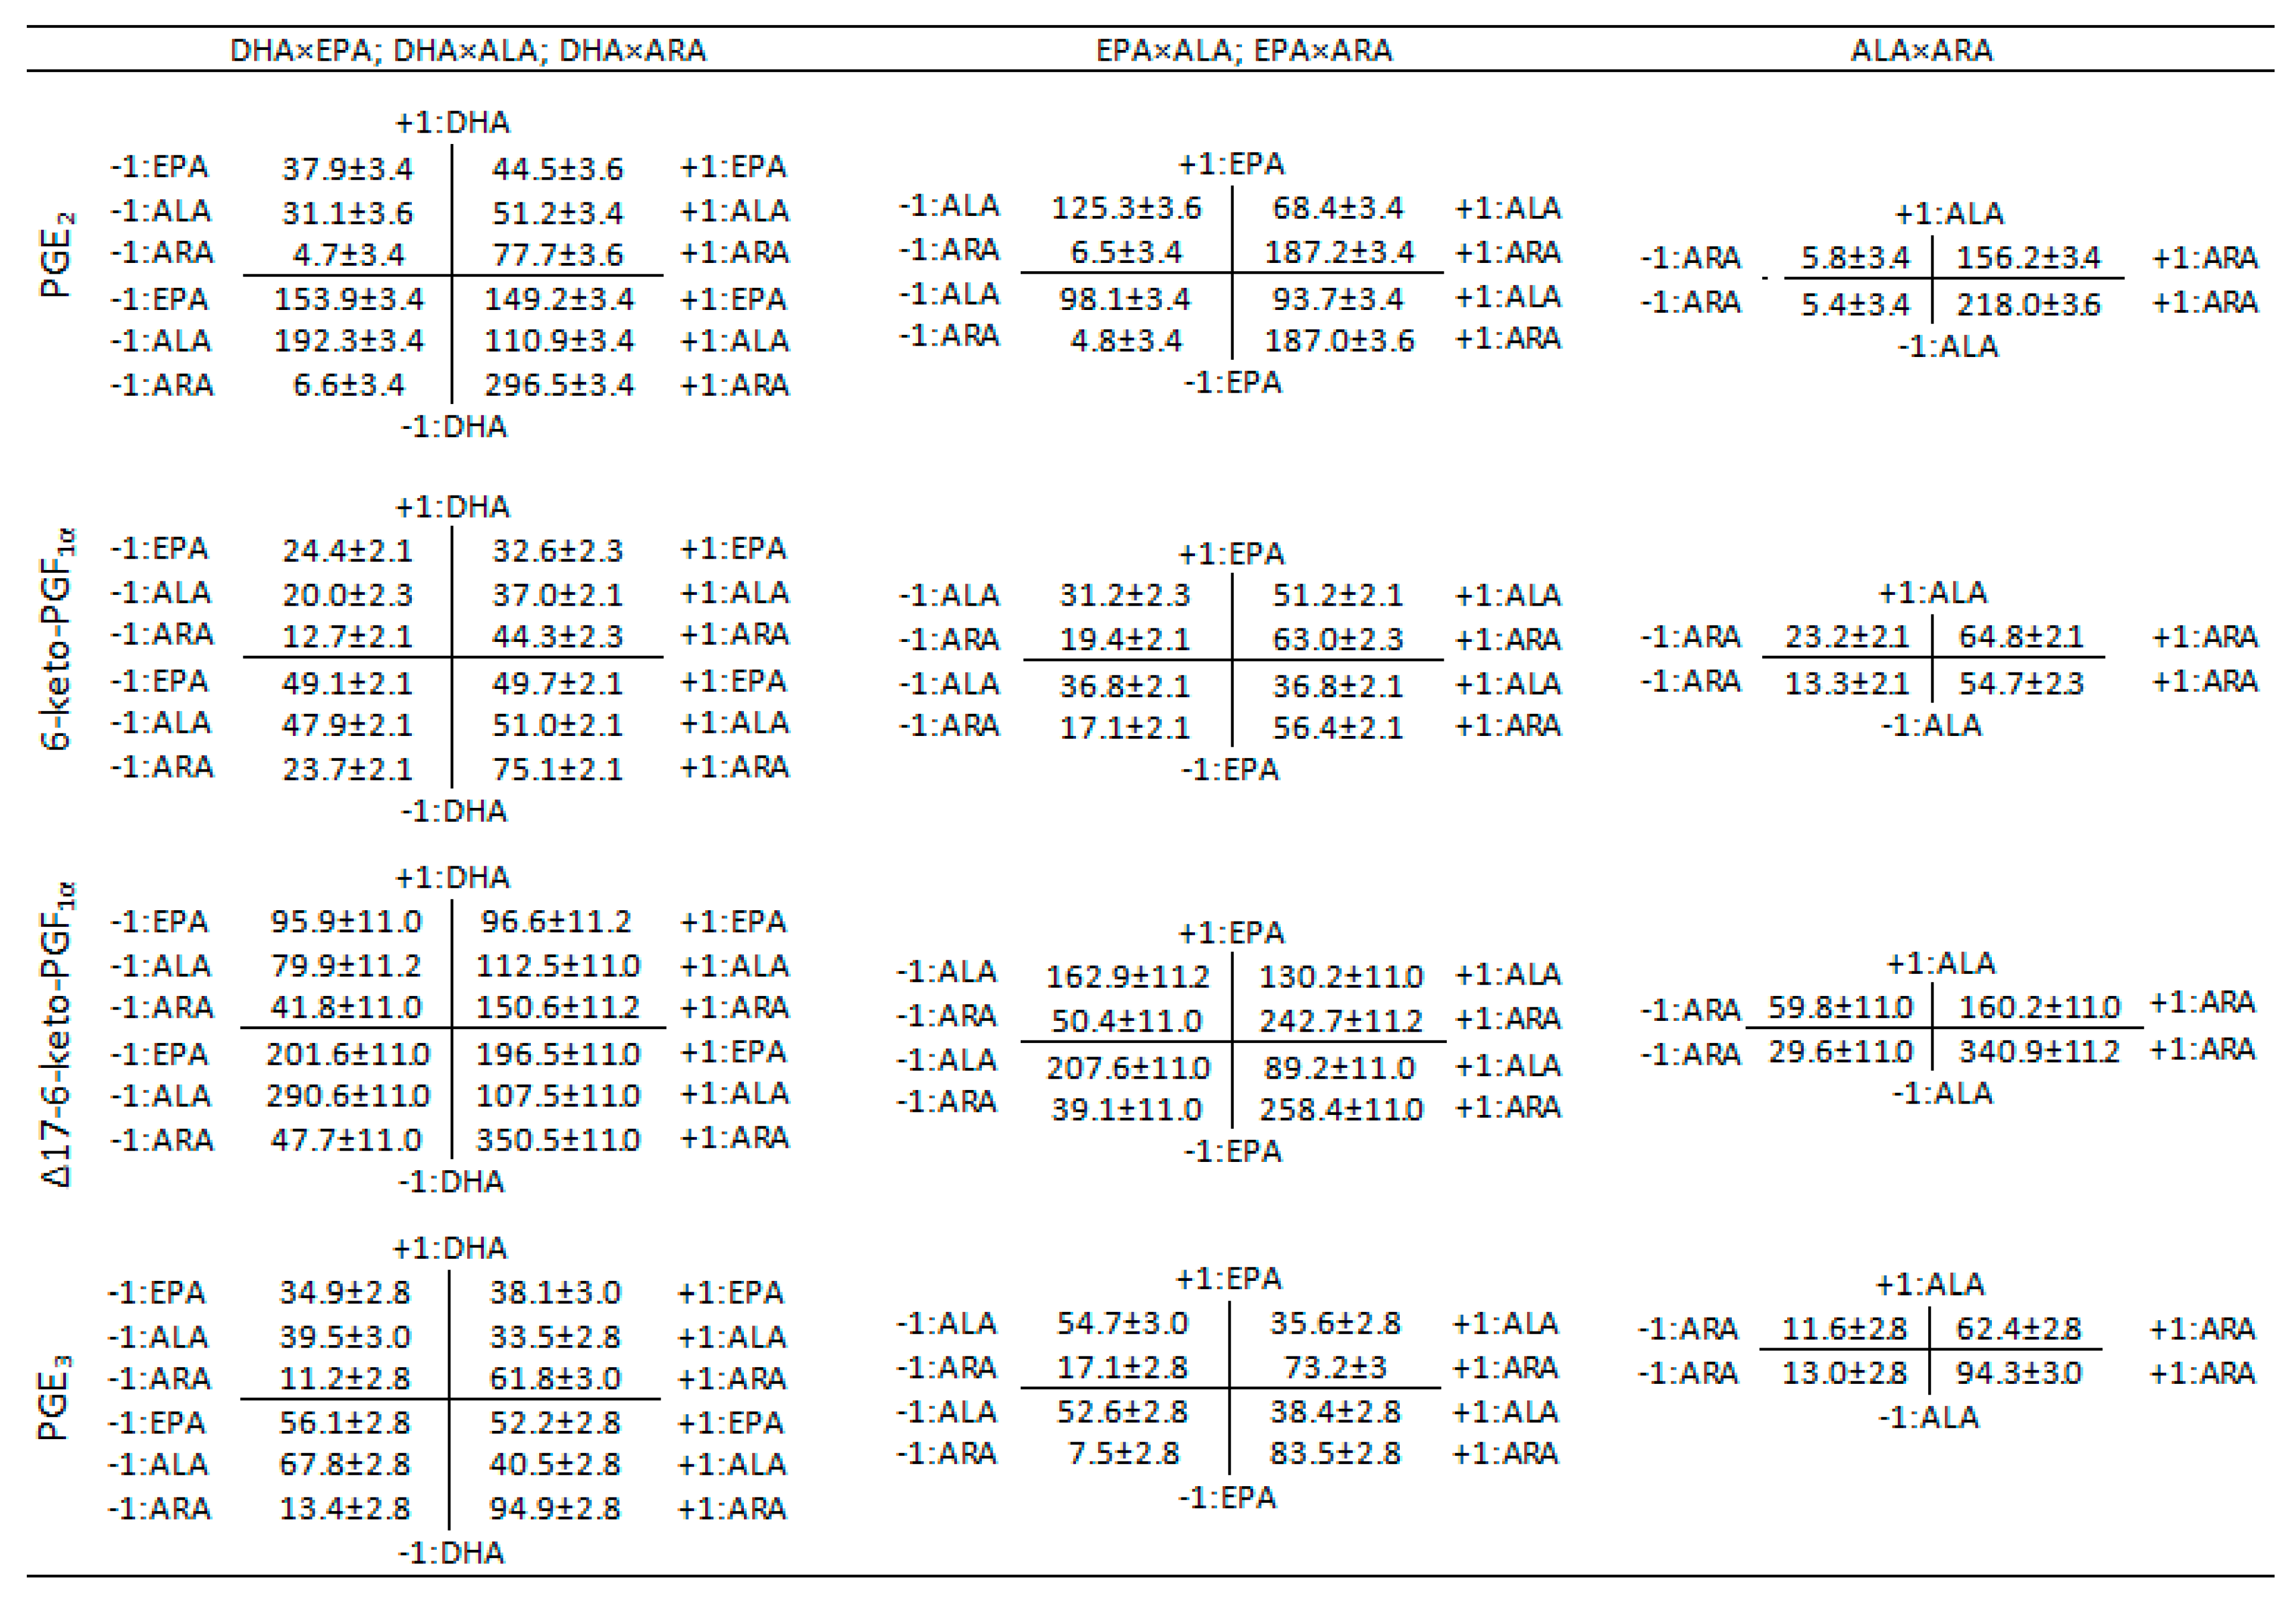
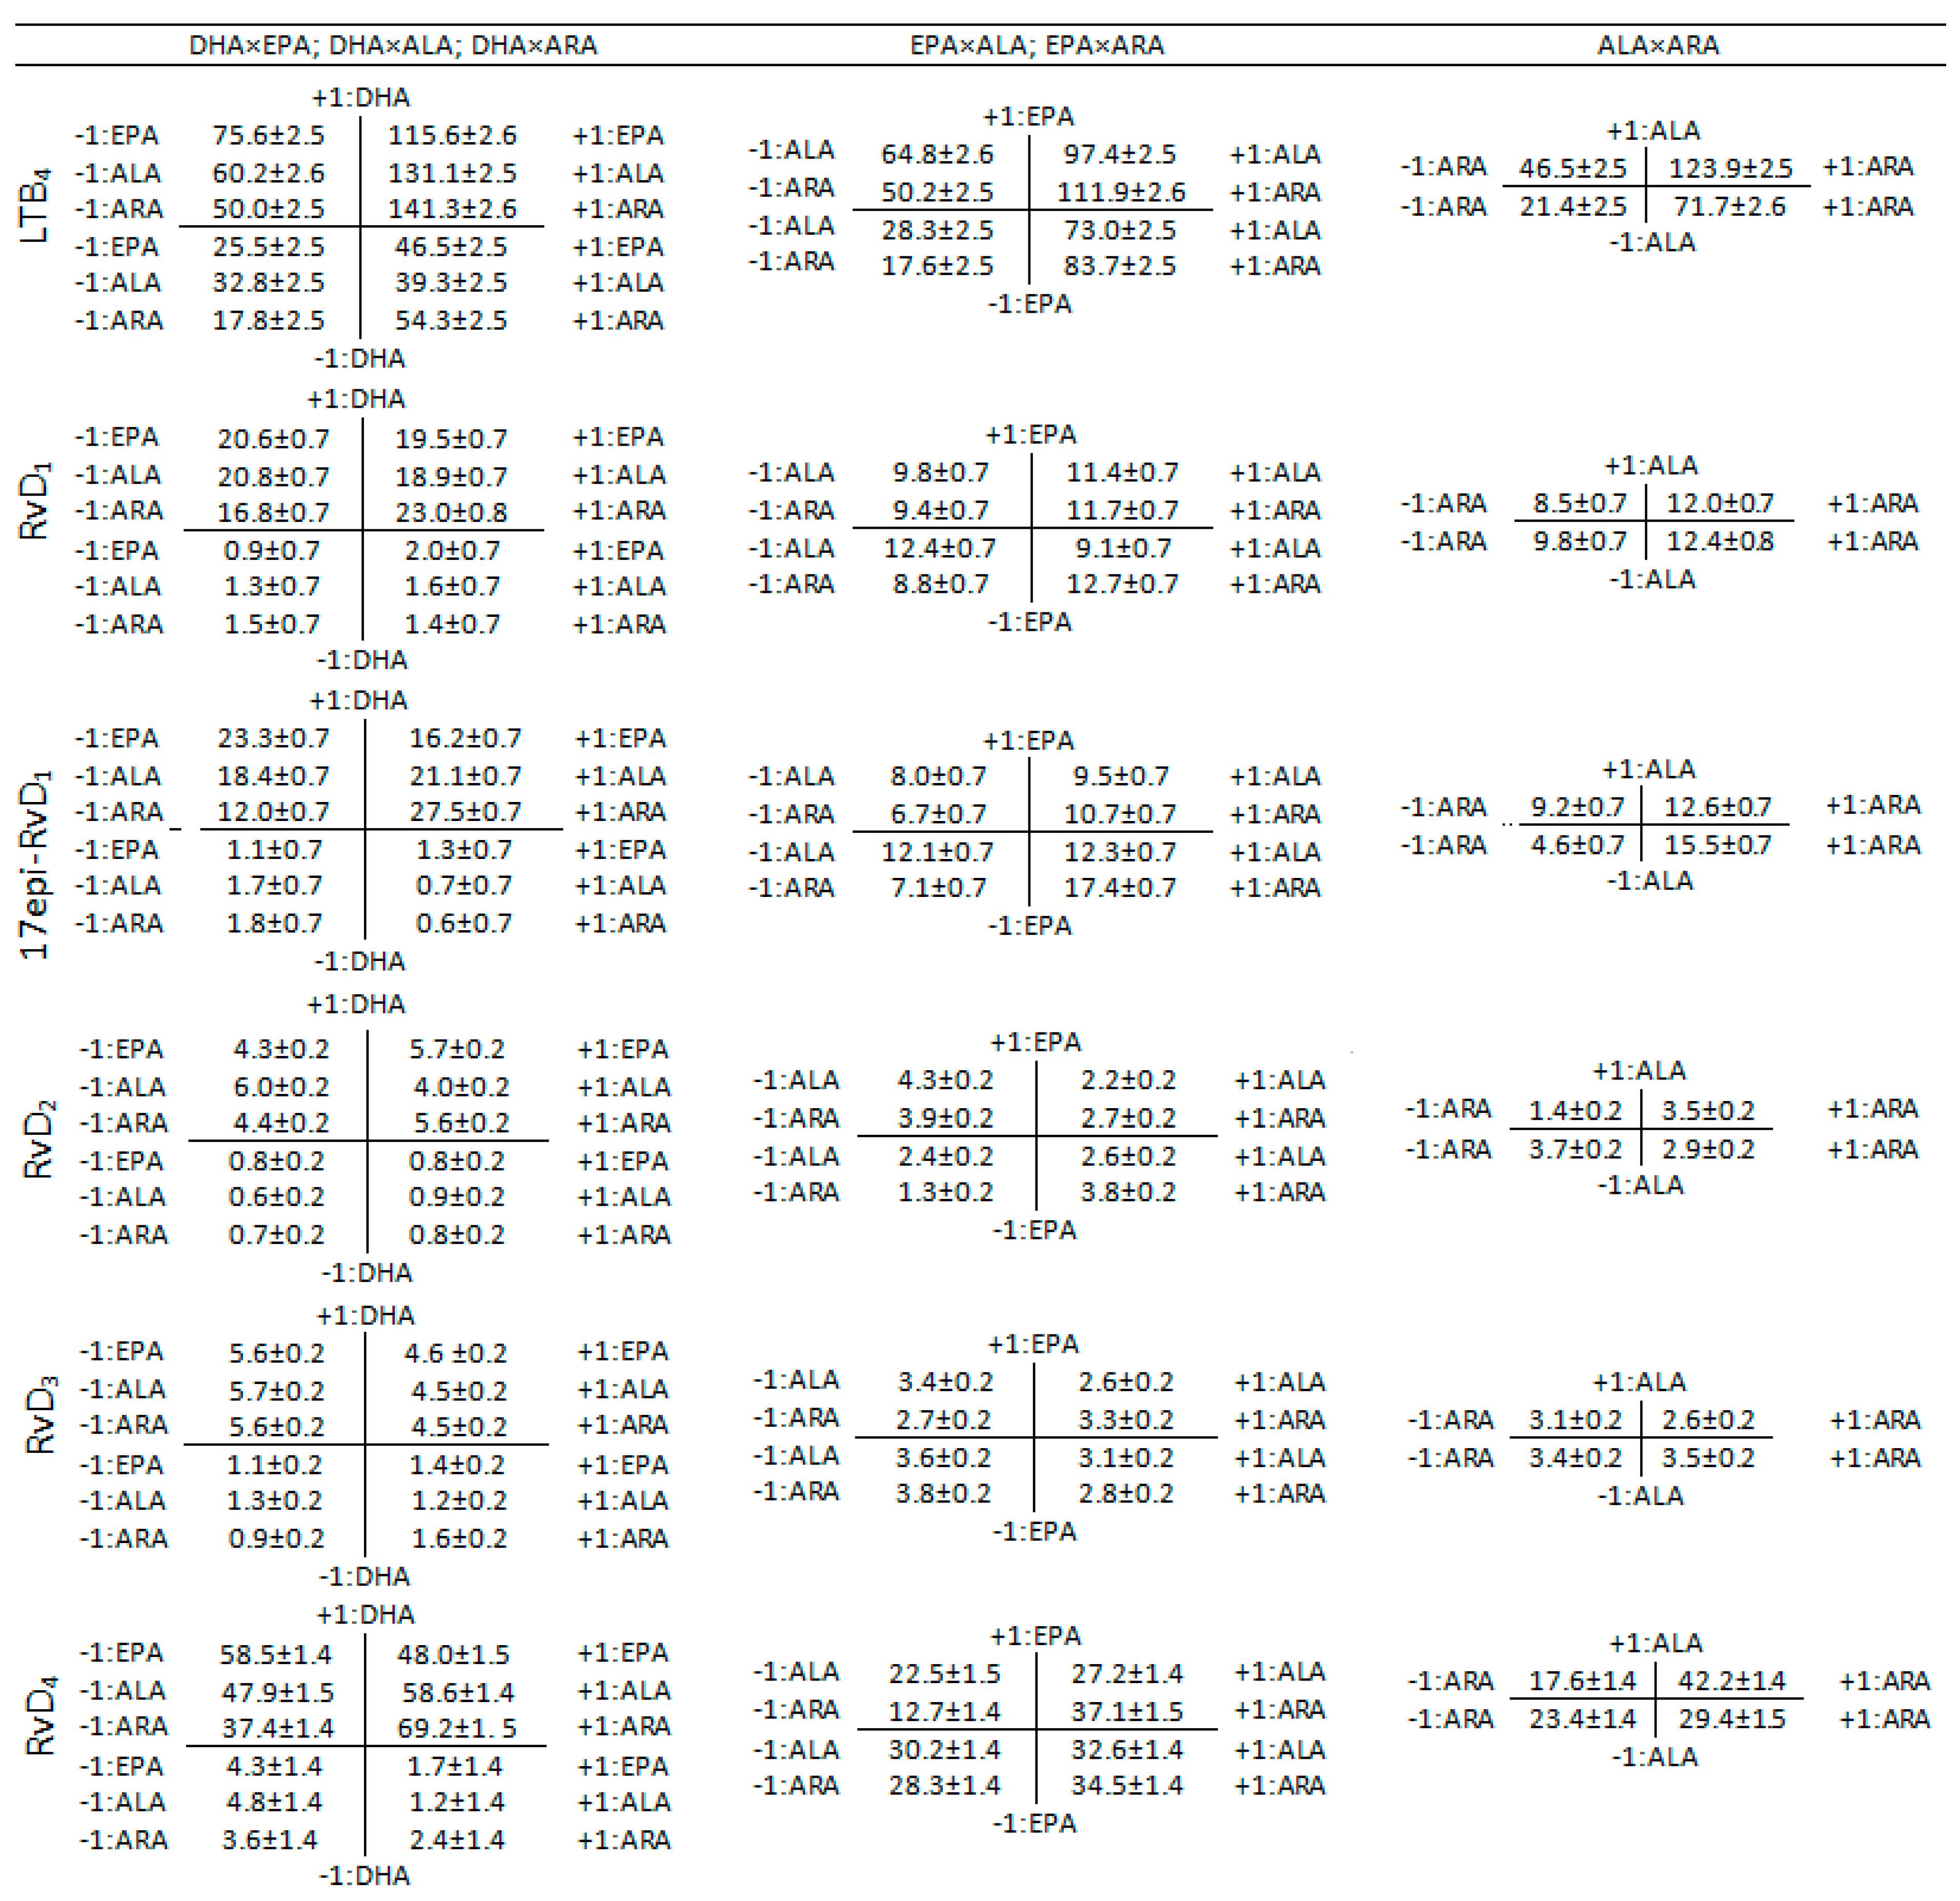
3.2. Interaction Effects Evaluation
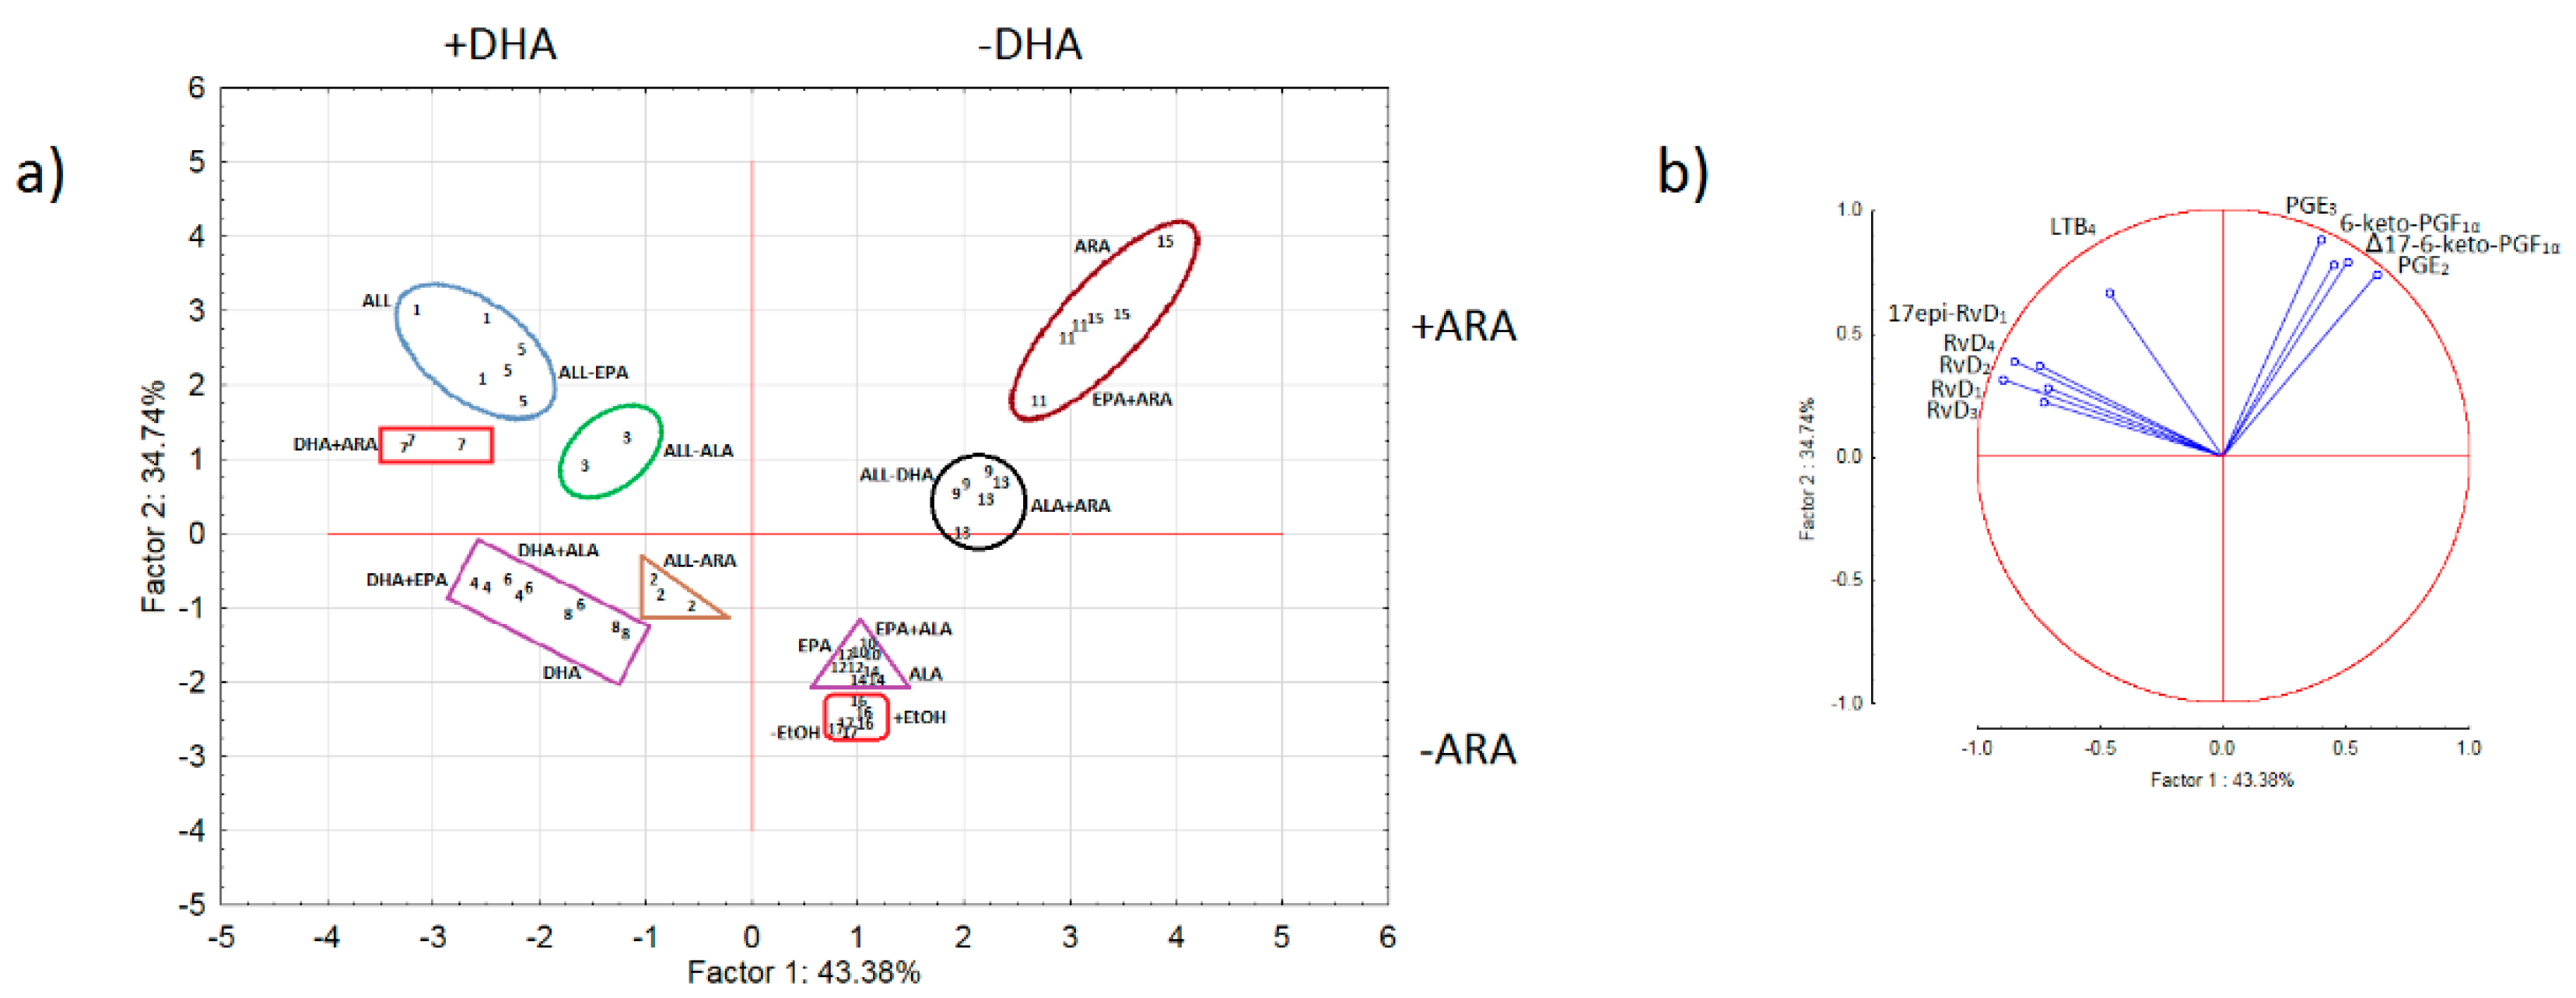
3.3. Principal Component Analysis (PCA)
4. Discussion
4.1. Main Effects
4.1.1. DHA Effect
4.1.2. EPA Effect
4.1.3. ALA Effect
4.1.4. ARA Effect
4.2. Two-Term Interactions
4.2.1. DHA×EPA, DHA×ALA, DHA×ARA
4.2.2. EPA×ALA, EPA×ARA
4.2.3. ALA×ARA
4.3. Three- and Four-Term Interactions
5. Conclusions
Supplementary Materials
Author Contributions
Funding
Conflicts of Interest
References
- Bang, H.O.; Dyerberg, J.; Nielsen, A.B. Plasma lipid and lipoprotein pattern in Greenlandic West-coast Eskimos. Lancet 1971, 1, 1143–1145. [Google Scholar] [CrossRef]
- Dyerberg, J.; Bang, H.O.; Hjørne, N. Fatty acid composition of the plasma lipids in Greenland Eskimos. Am. J. Clin. Nutr. 1975, 28, 958–966. [Google Scholar] [CrossRef] [PubMed]
- Ander, B.P.; Dupasquier, C.M.C.; Prociuk, M.A.; Pierce, G.N. Polyunsaturated fatty acids and their effects on cardiovascular disease. Exp. Clin. Cardiol. 2003, 8, 164–172. [Google Scholar] [PubMed]
- Manuelli, M.; Guardia, L.D.; Cena, H. Enriching diet with n-3 PUFAs to help prevent cardiovascular diseases in healthy adults: Results from clinical trials. Int. J. Mol. Sci. 2017, 18, 1552. [Google Scholar] [CrossRef]
- Watkins, B.A.; Hutchins, H.; Li, Y.; Seifert, M.F. The endocannabinoid signaling system: A marriage of PUFA and musculoskeletal health. J. Nutr. Biochem. 2010, 21, 1141–1152. [Google Scholar] [CrossRef] [PubMed]
- Costantini, L.; Molinari, R.; Farinon, B.; Merendino, N. Impact of omega-3 fatty acids on the gut microbiota. Int. J. Mol. Sci. 2017, 18, 2645. [Google Scholar] [CrossRef] [PubMed]
- Calder, P.C. Polyunsaturated fatty acids, inflammation, and immunity. Lipids 2001, 36, 1007–1024. [Google Scholar] [CrossRef] [PubMed]
- Calder, P.C.; Grimble, R.F. Polyunsaturated fatty acids, inflammation and immunity. Eur. J. Clin. Nutr. 2002, 56, S14–S19. [Google Scholar] [CrossRef] [PubMed] [Green Version]
- Yang, P.; Jiang, Y.; Fischer, S.M. Prostaglandin E3 metabolism and cancer. Cancer Lett. 2014, 348, 1–11. [Google Scholar] [CrossRef] [PubMed] [Green Version]
- Pettersen, C.H.H. The effect of omega-3 polyunsaturated fatty acids on human cancer cells – molecular mechanisms involved. Philosophiae. Ph.D. Thesis, Norwegian University of Science and Technology, Trondheim, Norway, June 2012. [Google Scholar]
- Kinsella, J.E.; Lokesh, B.; Stone, R.A. Dietary n-3 polyunsaturated fatty acids and amelioration of cardiovascular diseaseL possible mechanisms. Am. J. Clin. Nutr. 1990, 52, 1–28. [Google Scholar] [CrossRef]
- Lee, Y.H.; Bae, S.C.; Song, G.G. Omega-3 polyunsaturated fatty acids and the treatment of rheumatoid arthritis: A meta-analysis. Arch. Med. Res. 2012, 43, 356–362. [Google Scholar] [CrossRef]
- VanDyke, T.E.; Serhan, C.N. Resolution of inflammation: A new paradigm for the pathogenesis of periodontal diseases. J. Dent. Res. 2003, 82, 82–90. [Google Scholar] [CrossRef] [PubMed]
- Tuppo, E.E.; Arias, H.R. The role of inflammation in Alzheimer’s disease. Int. J. Biochem. Cell B. 2005, 37, 289–305. [Google Scholar] [CrossRef]
- Larsson, S.C.; Kumlin, M.; Ingelman-Sundberg, M.; Wolk, A. Dietary long-chain n-3 fatty acids for the prevention of cancer: A review of potential mechanisms. Am. J. Clin. Nutr. 2004, 79, 935–945. [Google Scholar] [CrossRef]
- Rose, D.P.; Connolly, J.M. Omega-3 fatty acids as cancer chemopreventive agents. Pharmacol. Therapeu. 1999, 83, 217–244. [Google Scholar] [CrossRef]
- Serhan, C.N.; Arita, M.; Hong, S.; Gotlinger, K. Resolvins, docosatrienes and neuroprotectins, novel omega-3-derived mediators and their endogenous Aspirin-triggered epimers. Lipids 2004, 39, 1125–1132. [Google Scholar] [CrossRef]
- Tetaert, D.; Pierre, M.; Demeyer, D.; Husson, M.O.; Béghin, L.; Galabert, C.; Gottrand, F.; Beermann, C.; Guery, B.; Desseyn, J.L. Dietary n-3 fatty acids have suppressive effects on mucin upregulation in mice infected with Pseudomonas aeruginosa. Respir. Res. 2007, 8, 1–11. [Google Scholar] [CrossRef] [PubMed]
- Miyata, J.; Arita, M. Role of omega-3 fatty acids and their metabolites in asthma and allergic diseases. Allergol. Int. 2015, 64, 27–34. [Google Scholar] [CrossRef] [PubMed] [Green Version]
- Habicht, J.-P.; Butz, W.P. Measurement of health and nutrition effects on large-scale intervention projects. In Evaluating the Impact of Nutrition and Health Programs, 1st ed.; Klein, R.E., Read, M.S., Riecken, H.W., Brown, J.A., Pradilla, A., Daza, C.H., Eds.; Plenum Press: New York, NY, USA, 1979; Volume 1, pp. 133–179. [Google Scholar]
- Araujo, P.; Lucena, E.; Yang, Y.; Ceemala, B.; Mengesha, Z.; Holen, E. The impact of exogenous ω-6 and ω-3 polyunsaturated fatty acids on the induced production of pro- and anti-inflammatory prostaglandins and leukotrienes in Atlantic salmon head kidney cells using a full factorial design and LC–MS/MS. J. Chromatogr. B 2014, 964, 164–171. [Google Scholar] [CrossRef] [PubMed]
- Araujo, P.; Janagap, S.; Holen, E. Application of Doehlert uniform shell designs for selecting optimal amounts of internal standards in the analysis of prostaglandins and leukotrienes by liquid chromatography–tandem mass spectrometry. J. Chromatogr. A 2012, 1260, 102–110. [Google Scholar] [CrossRef] [PubMed]
- Araujo, P.; Mengesha, Z.; Lucena, E.; Grung, B. Development and validation of an extraction method for the determination of pro-inflammatory eicosanoids in human plasma using liquid chromatography–tandem mass spectrometry. J. Chromatogr. A 2014, 1353, 57–64. [Google Scholar] [CrossRef]
- Zhang, X.; Yang, N.; Ai, D.; Zhu, Y. Systematic metabolomic analysis of eicosanoids after omega-3 polyunsaturated fatty acid supplementation by a highly specific liquid chromatography–tandem mass spectrometry-based method. J. Proteome Res. 2015, 14, 1843–1853. [Google Scholar] [CrossRef] [PubMed]
- Clària, J.; Nguyen, B.T.; Madenci, A.L.; Ozaki, C.K.; Serhan, C.N. Diversity of lipid mediators in human adipose tissue depots. Am. J. Physiol. Cell Physiol. 2013, 304, 1141–1149. [Google Scholar] [CrossRef] [PubMed]
- Lucena, E.; Yang, Y.; Mendez, C.; Holen, E.; Araujo, P. Extraction of pro- and anti-inflammatory biomarkers from fish cells exposed to polyunsaturated fatty acids and quantification by liquid chromatography tandem mass spectrometry. Curr. Anal. Chem. 2018, 1, 1–9. [Google Scholar]
- Araujo, P.W.; Brereton, R.G. Experimental design I. Screening. Trend. Anal. Chem. 1996, 15, 26–31. [Google Scholar] [CrossRef]
- Araujo, P.; Nguyen, T.-T.; Frøyland, L.; Wang, J.; Kang, J.X. Evaluation of a rapid method for the quantitative analysis of fatty acids in various matrices. J. Chromatogr. A 2008, 1212, 106–113. [Google Scholar] [CrossRef]
- Lee, S.A.; Kim, H.J.; Chang, K.C.C.; Baek, J.C.; Park, J.K.; Shin, J.K.; Choi, W.J.; Lee, J.H.; Paik, W.Y. DHA and EPA down-regulate COX-2 expression through suppression of NF-κB activity in LPS-treated human umbilical vein endothelial cells. Korean J. Physiol. Pharmacol. 2009, 13, 301–307. [Google Scholar] [CrossRef]
- Hadjagapiou, C.; Kaduce, T.L.; Spector, A.A. Eicosapentaenoic acid utilization by bovine aortic endothelial cells: Effects on prostacyclin production. Biochim. Biophys. Acta 1986, 87, 369–381. [Google Scholar] [CrossRef]
- Hadjagapiou, C.; Spector, A.A. Docosahexaenoic acid metabolism and effect on prostacyclin production in endothelial cells. Arch. Biochem. Biophys. 1987, 253, 1–12. [Google Scholar] [CrossRef]
- Bénistant, C.; Achard, F.; Marcelon, G.; Lagarde, M. Platelet inhibitory functions of aortic endothelial cells. Effects of eicosapentaenoic and docosahexaenoic acids. Atherosclerosis 1993, 104, 27–35. [Google Scholar] [CrossRef]
- Achard, F.; Bénistant, C.; Lagarde, M. Interconversions and distinct metabolic fate of eicosapentaenoic, docosapentaenoic and docosahexaenoic acids in bovine aortic endothelial cells. Biochim. Biophys. Acta 1995, 1255, 260–266. [Google Scholar] [CrossRef]
- Bénistant, C.; Achard, F.; Slama, S.B.; Lagarde, M. Docosapentaenoic acid (22:5,n.3): Metabolism and effect on prostacyclin production in endothelial cells. Prostag. Leukotr. Ess. 1996, 55, 287–292. [Google Scholar] [CrossRef]
- Malkowski, M.G.; Thuresson, E.D.; Lakkides, K.M.; Rieke, C.J.; Micielli, R.; Smith, W.L.; Garavito, R.M. Structure of eicosapentaenoic and linoleic acids in the cyclooxygenase site of prostaglandin endoperoxide H synthase−1. J. Biol. Chem. 2001, 276, 37547–37555. [Google Scholar] [CrossRef]
- Fischer, S.; Weber, P.C. Prostaglandin I3 formed in vivo in man after dietary eicosapentaenoic acid. Nature 1984, 307, 165–168. [Google Scholar] [CrossRef] [PubMed]
- Kearns, R.J.; Hayek, M.G.; Turek, J.J.; Meydani, M.; Burr, J.R.; Greene, R.J.; Marshall, C.A.; Adams, S.M.; Borgert, R.C.; Reinhart, G.A. Effect of age, breed and dietary omega-6 (n-6): Omega-3 (n-3) fatty acid ratio on immune function, eicosanoid production, and lipid peroxidation in young and aged dogs. Vet. Immunol. Immunopathol. 1999, 69, 165–183. [Google Scholar] [CrossRef]
- Vanamala, J.; Glagolenko, A.; Yang, P.; Carroll, R.J.; Murphy, M.E.; Newman, R.A.; Ford, J.R.; Braby, L.A.; Chapkin, R.S.; Turner, N.D.; et al. Dietary fish oil and pectin enhance colonocyte apoptosis in part through suppression of PPARdelta/PGE2 and elevation of PGE3. Carcinogenesis 2008, 29, 790–796. [Google Scholar] [CrossRef]
- Neilson, A.P.; Djuric, Z.; Ren, J.W.; Hong, Y.H.; Sen, A.; Lager, C.; Jiang, Y.; Reuven, S.; Smith, W.L.; Brenner, D.E. Effect of cyclooxygenase genotype and dietary fish oil on colonic eicosanoids in mice. J. Nutr. Biochem. 2012, 23, 966–976. [Google Scholar] [CrossRef] [PubMed]
- Pirman, D.A.; Efuet, E.; Ding, X.P.; Pan, Y.; Tan, L.; Fischer, S.M.; DuBois, R.N.; Yang, P. Changes in cancer cell metabolism revealed by direct sample analysis with MALDI mass spectrometry. PLoS ONE 2013, 8, e61379. [Google Scholar] [CrossRef] [PubMed]
- Calder, P.C. n-3 Polyunsaturated fatty acids, inflammation, and inflammatory diseases. Am. J. Clin. Nutr. 2006, 83, 1505S–1519S. [Google Scholar] [CrossRef] [PubMed]
- Schacky, C.V.; Fischer, S.; Weber, P.C. Long-term effects of dietary marine w-3 fatty acids upon plasma and cellular lipids, platelet function, and eicosanoid formation in humans. J. Clin. Invest. 1985, 76, 1626–1631. [Google Scholar] [CrossRef] [PubMed]
- Szymczak, M.; Murray, M.; Petrovic, N. Modulation of angiogenesis by ω-3 polyunsaturated fatty acids is mediated by cyclooxygenases. Blood 2008, 111, 3514–3521. [Google Scholar] [CrossRef] [PubMed]
- Jäger, A.K.; Petersen, K.N.; Thomasen, G.; Christensen, S.B. Isolation of linoleic and α-linolenic acids as COX−1 and -2 inhibitors in rose hip. Phytother. Res. 2008, 22, 982–984. [Google Scholar] [CrossRef]
- Chap, H.; Mauco, G.; Perret, B.; Plantavid, M.; Laffont, F.; Simon, M.F.; Douste-Blazy, L. Studies on topological distribution of arachidonic acid replacement in platelet phospholipids and on enzymes involved in the phospholipid effect accompanying platelet activation. Agents Actions 1981, 11, 538–540. [Google Scholar] [CrossRef] [PubMed]
- Vaughn, D.M.; Swaim, S.F.; Lauten, S.D.; Garner, C.A.; Boudreaux, M.K.; Spano, J.S.; Hoffman, C.E.; Conner, B. Evaluation of effects of dietary n-6 to n-3 fatty acid ratios on leukotriene B synthesis in dog skin and neutrophils. Vet. Dermatol. 1994, 5, 163–173. [Google Scholar] [CrossRef]
- Calder, P.C. Immunoregulatory and anti-inflammatory effects of n-3 polyunsaturated fatty acids. Braz. J. Med. Biol. Res. 1998, 31, 467–490. [Google Scholar] [CrossRef] [Green Version]
- Ringbom, T.; Huss, U.; Stenholm, Å.; Flock, S.; Skattebøl, L.; Perera, P.; Bohlin, L. COX-2 inhibitory effects of naturally occurring and modified fatty acids. J. Nat. Prod. 2001, 64, 745–749. [Google Scholar] [CrossRef]
- Khanapure, S.P.; Garvey, D.S.; Janero, D.R.; Letts, L.G. Eicosanoids in inflammation: Biosynthesis, pharmacology, and therapeutic frontiers. Curr. Top. Med. Chem. 2007, 7, 311–340. [Google Scholar] [CrossRef]
- Yamagata, K. Docosahexaenoic acid regulates vascular endothelial cell function and prevents cardiovascular disease. Lipids Health Dis. 2017, 16, 118. [Google Scholar] [CrossRef] [Green Version]
- Calder, P.C. Polyunsaturated fatty acids and inflammatory processes: New twists in an old tale. Biochimie 2009, 91, 791–795. [Google Scholar] [CrossRef]


| CODE | PUFA | Metabolites | ||||||||||||
|---|---|---|---|---|---|---|---|---|---|---|---|---|---|---|
| ω-3 | ω-6 | Cyclooxygenase Pathway | Lipoxygenase Pathway | |||||||||||
| DHA | EPA | ALA | ARA | PGE2 | PGE3 | 6-keto-PGF1α | Δ17-6-keto-PGF1α | LTB4 | RvD1 | 17epi-RvD1 | RvD2 | RvD3 | RvD4 | |
| ALL | +1 | +1 | +1 | +1 | 76.1 ± 5.0 | 51.9 ± 1.7 | 75.6 ± 4.3 | 175.5 ± 12.4 | 197.2 ± 7.7 | 27.6 ± 1.9 | 17.6 ± 0.8 | 5.8 ± 0.4 | 5.4 ± 0.4 | 95.9 ± 5.4 |
| ALL-ARA | +1 | +1 | +1 | −1 | 5.7 ± 0.2 | 14.3 ± 0.7 | 13.4 ± 0.5 | 69.7 ± 5.2 | 104.2 ± 3.5 | 15.0 ± 1.1 | 20 ± 1.5 | 1.5 ± 0.1 | 1.6 ± 0.1 | 11.7 ± 0.5 |
| ALL-ALA * | +1 | +1 | −1 | +1 | 90.4 ± 5.2 | 70.4 ± 7.8 | 33.8 ± 3.6 | 123.5 ± 9.6 | 116.6 ± 4.0 | 14.9 ± 0.2 | 24.8 ± 1.3 | 3.4 ± 0.1 | 4.5 ± 0.1 | 48.6 ± 0.5 |
| DHA+EPA | +1 | +1 | −1 | −1 | 5.6 ± 0.2 | 15.6 ± 1.0 | 7.9 ± 0.5 | 17.5 ± 1.1 | 44.8 ± 3.0 | 19.0 ± 0.9 | 2.1 ± 0.1 | 12.2 ± 0.7 | 6.7 ± 0.1 | 36.2 ± 1.5 |
| ALL-EPA | +1 | −1 | +1 | +1 | 119.7 ± 2.5 | 60.8 ± 4.3 | 42.7 ± 2.8 | 154.1 ± 3.4 | 186.0 ± 4.7 | 16.3 ± 1 | 32.7 ± 0.8 | 6.7 ± 0.3 | 2.7 ± 0.1 | 70.5 ± 1.4 |
| DHA+ALA | +1 | −1 | +1 | −1 | 3.3 ± 0.1 | 7.0 ± 0.2 | 16.5 ± 0.9 | 50.8 ± 4.1 | 36.9 ± 1.2 | 16.7 ± 0.5 | 14.1 ± 1.0 | 1.9 ± 0.1 | 8.2 ± 0.6 | 56.4 ± 1.5 |
| DHA+ARA | +1 | −1 | −1 | +1 | 24.5 ± 1.4 | 64 ± 3.7 | 25.1 ± 0.2 | 149.4 ± 6.5 | 65.2 ± 1.9 | 33.2 ± 1.5 | 34.7 ± 1.8 | 6.4 ± 0.4 | 5.5 ± 0.4 | 61.7 ± 2.1 |
| DHA | +1 | −1 | −1 | −1 | 4.2 ± 0.3 | 7.9 ± 0.6 | 13.2 ± 0.5 | 29.2 ± 2.2 | 14.3 ± 1.1 | 16.4 ± 1 | 11.8 ± 0.8 | 1.9 ± 0.1 | 5.8 ± 0.5 | 45.3 ± 1.4 |
| ALL-DHA | −1 | +1 | +1 | +1 | 184.9 ± 3.0 | 58.5 ± 0.8 | 83.3 ± 3.9 | 198.3 ± 1.0 | 58.8 ± 0.9 | 2.8 ± 0.2 | 0.0 ± 0.0 | 0.7 ± 0.0 | 1.6 ± 0.1 | 0.0 ± 0.0 |
| EPA+ALA | −1 | +1 | +1 | −1 | 6.8 ± 0.5 | 17.5 ± 0.6 | 32.8 ± 0.5 | 77.1 ± 5.8 | 29.3 ± 2.0 | 0.0 ± 0.0 | 0.3 ± 0.0 | 0.9 ± 0.0 | 1.7 ± 0.1 | 1.3 ± 0.1 |
| EPA+ARA | −1 | +1 | −1 | +1 | 397.3 ± 4.9 | 111.9 ± 6.3 | 59.3 ± 1.7 | 473.4 ± 33.9 | 75.1 ± 1.9 | 1.5 ± 0.1 | 0.5 ± 0.0 | 0.7 ± 0.0 | 1.6 ± 0.1 | 3.9 ± 0.1 |
| EPA | −1 | +1 | −1 | −1 | 7.8 ± 0.2 | 20.8 ± 1.4 | 23.6 ± 1.5 | 37.2 ± 2.4 | 22.8 ± 0.8 | 3.7 ± 0.3 | 4.4 ± 0.1 | 0.7 ± 0.0 | 0.6 ± 0.0 | 1.6 ± 0.1 |
| ALA+ARA | −1 | −1 | +1 | +1 | 244.2 ± 7.6 | 78.6 ± 6.2 | 57.6 ± 2.6 | 113 ± 2.3 | 53.5 ± 0.7 | 1.3 ± 0.1 | 0.0 ± 0.0 | 0.7 ± 0.0 | 0.7 ± 0.0 | 2.3 ± 0.1 |
| ALA | −1 | −1 | +1 | −1 | 7.5 ± 0.2 | 7.4 ± 0.5 | 30.2 ± 0.8 | 41.7 ± 2.6 | 15.5 ± 1.2 | 2.2 ± 0.1 | 2.5 ± 0.1 | 1.2 ± 0.1 | 0.7 ± 0.0 | 1.2 ± 0.1 |
| ARA | −1 | −1 | −1 | +1 | 359.7 ± 10.6 | 130.8 ± 5.4 | 100.3 ± 6 | 617.3 ± 28.6 | 29.9 ± 1.4 | 0.0 ± 0.0 | 1.9 ± 0.2 | 1.1 ± 0.0 | 2.3 ± 0.2 | 3.4 ± 0.1 |
| EtOH | −1 | −1 | −1 | −1 | 4.2 ± 0.3 | 7.6 ± 0.6 | 8.4 ± 0.6 | 34.5 ± 0.5 | 3.6 ± 0.2 | 0.0 ± 0.0 | 0.0 ± 0.0 | 0.0 ± 0.0 | 0.5 ± 0.0 | 10.5 ± 0.6 |
| Prostaglandins | Prostacyclins | Leukotriene | Resolvins | ||||||||
|---|---|---|---|---|---|---|---|---|---|---|---|
| PUFA | Level | PGE2 | PGE3 | 6-keto-PGF1α | Δ17-6-keto-PGF1α | LTB4 | RvD1 | 17epi-RvD1 | RvD2 | RvD3 | RvD4 |
| DHA | −1 | 151.6 ± 2.4 | 54.1 ± 2.0 | 49.4 ± 1.5 | 199.1 ± 7.5 | 36.1 ± 1.7 | 1.4 ± 0.5 | 1.2 ± 0.5 | 0.8 ± 0.2 | 1.3 ± 0.2 | 3.0 ± 1.0 |
| +1 | 41.2 ± 2.5 | 36.5 ± 2.0 | 28.5 ± 1.6 | 96.2 ± 7.7 | 95.7 ± 1.8 | 19.9 ± 0.5 | 19.7 ± 0.5 | 5.0 ± 0.2 | 5.1 ± 0.2 | 53.3 ± 1.0 | |
| EPA | −1 | 95.9 ± 2.4 | 45.5 ± 2.0 | 36.8 ± 1.5 | 148.8 ± 7.5 | 50.6 ± 1.7 | 10.8 ± 0.5 | 12.2 ± 0.5 | 2.5 ± 0.2 | 3.3 ± 0.2 | 31.4 ± 1.0 |
| +1 | 96.8 ± 2.5 | 45.1 ± 2.0 | 41.2 ± 1.6 | 146.6 ± 7.7 | 81.1 ± 1.8 | 10.6 ± 0.5 | 8.7 ± 0.50.5 | 3.3 ± 0.2 | 3.0 ± 0.2 | 24.9 ± 1.0 | |
| ALA | −1 | 111.7 ± 2.5 | 53.6 ± 2.0 | 34.0 ± 1.6 | 185.3 ± 7.7 | 46.5 ± 1.8 | 11.1 ± 0.5 | 10.1 ± 0.5 | 3.3 ± 0.2 | 3.5 ± 0.2 | 26.4 ± 1.0 |
| +1 | 81.0 ± 2.4 | 37.0 ± 2.0 | 44.0 ± 1.5 | 110.0 ± 7.5 | 85.2 ± 1.7 | 10.2 ± 0.5 | 10.9 ± 0.5 | 2.4 ± 0.2 | 2.9 ± 0.2 | 29.9 ± 1.0 | |
| ARA | −1 | 5.6 ± 2.4 | 12.3 ± 2.0 | 18.2 ± 1.5 | 44.7 ± 7.5 | 33.9 ± 1.7 | 9.1 ± 0.5 | 6.9 ± 0.5 | 2.6 ± 0.2 | 3.3 ± 0.2 | 20.5 ± 1.0 |
| +1 | 187.1 ± 2.5 | 78.4 ± 2.0 | 59.7 ± 1.6 | 250.6 ± 7.7 | 97.8 ± 1.8 | 12.2 ± 0.5 | 14.0 ± 0.5 | 3.2 ± 0.2 | 3.1 ± 0.2 | 35.8 ± 1.0 | |
© 2019 by the authors. Licensee MDPI, Basel, Switzerland. This article is an open access article distributed under the terms and conditions of the Creative Commons Attribution (CC BY) license (http://creativecommons.org/licenses/by/4.0/).
Share and Cite
Araujo, P.; Belghit, I.; Aarsæther, N.; Espe, M.; Lucena, E.; Holen, E. The Effect of Omega-3 and Omega-6 Polyunsaturated Fatty Acids on the Production of Cyclooxygenase and Lipoxygenase Metabolites by Human Umbilical Vein Endothelial Cells. Nutrients 2019, 11, 966. https://0-doi-org.brum.beds.ac.uk/10.3390/nu11050966
Araujo P, Belghit I, Aarsæther N, Espe M, Lucena E, Holen E. The Effect of Omega-3 and Omega-6 Polyunsaturated Fatty Acids on the Production of Cyclooxygenase and Lipoxygenase Metabolites by Human Umbilical Vein Endothelial Cells. Nutrients. 2019; 11(5):966. https://0-doi-org.brum.beds.ac.uk/10.3390/nu11050966
Chicago/Turabian StyleAraujo, Pedro, Ikram Belghit, Niels Aarsæther, Marit Espe, Eva Lucena, and Elisabeth Holen. 2019. "The Effect of Omega-3 and Omega-6 Polyunsaturated Fatty Acids on the Production of Cyclooxygenase and Lipoxygenase Metabolites by Human Umbilical Vein Endothelial Cells" Nutrients 11, no. 5: 966. https://0-doi-org.brum.beds.ac.uk/10.3390/nu11050966