The Role of Muscle Mass Gain Following Protein Supplementation Plus Exercise Therapy in Older Adults with Sarcopenia and Frailty Risks: A Systematic Review and Meta-Regression Analysis of Randomized Trials


Abstract
:1. Introduction
2. Method
2.1. Design
2.2. Search Strategy
2.3. Selection Criteria of Studies
2.4. Data Extraction
2.5. Assessment of Bias Risks and Methodological Quality of Included Studies
2.6. Data Synthesis and Analysis
3. Results
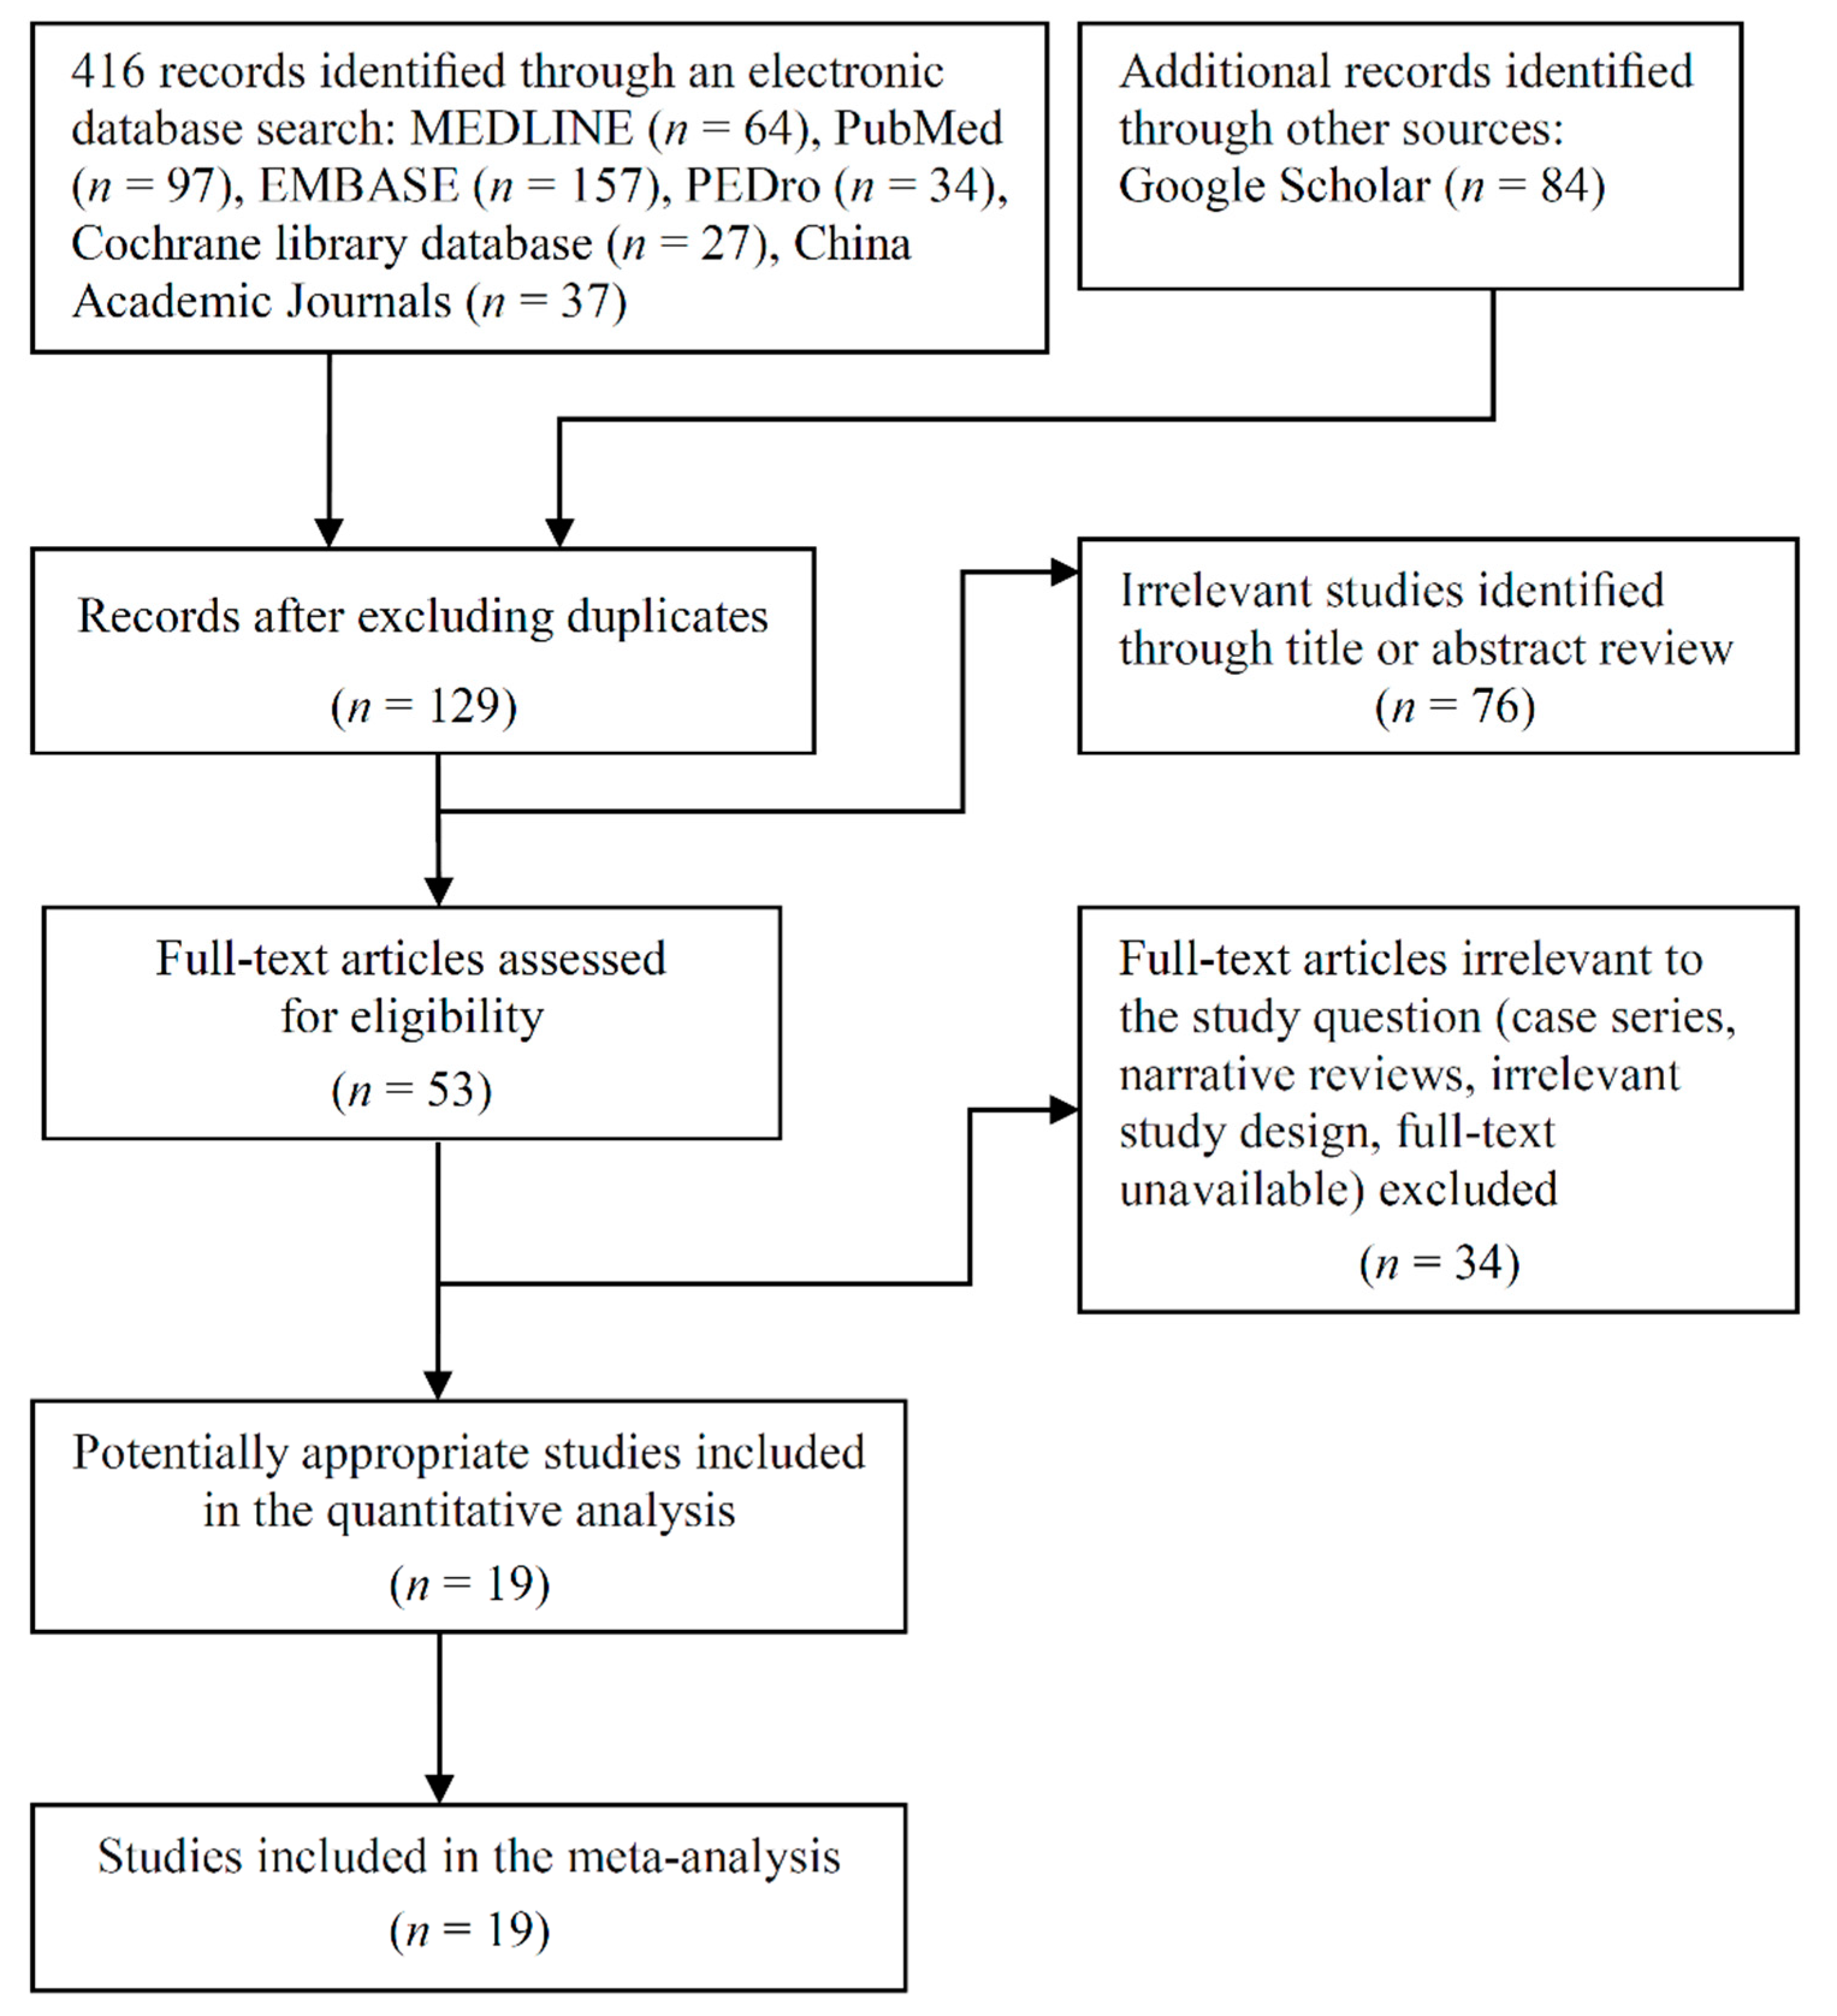
3.1. Trial Flow
3.2. Study Characteristics
3.3. Protein Supplementation Characteristics
3.4. Protocol of Exercise Training
3.5. Risk of Bias in Included Studies
3.6. Effectiveness on Muscle Mass
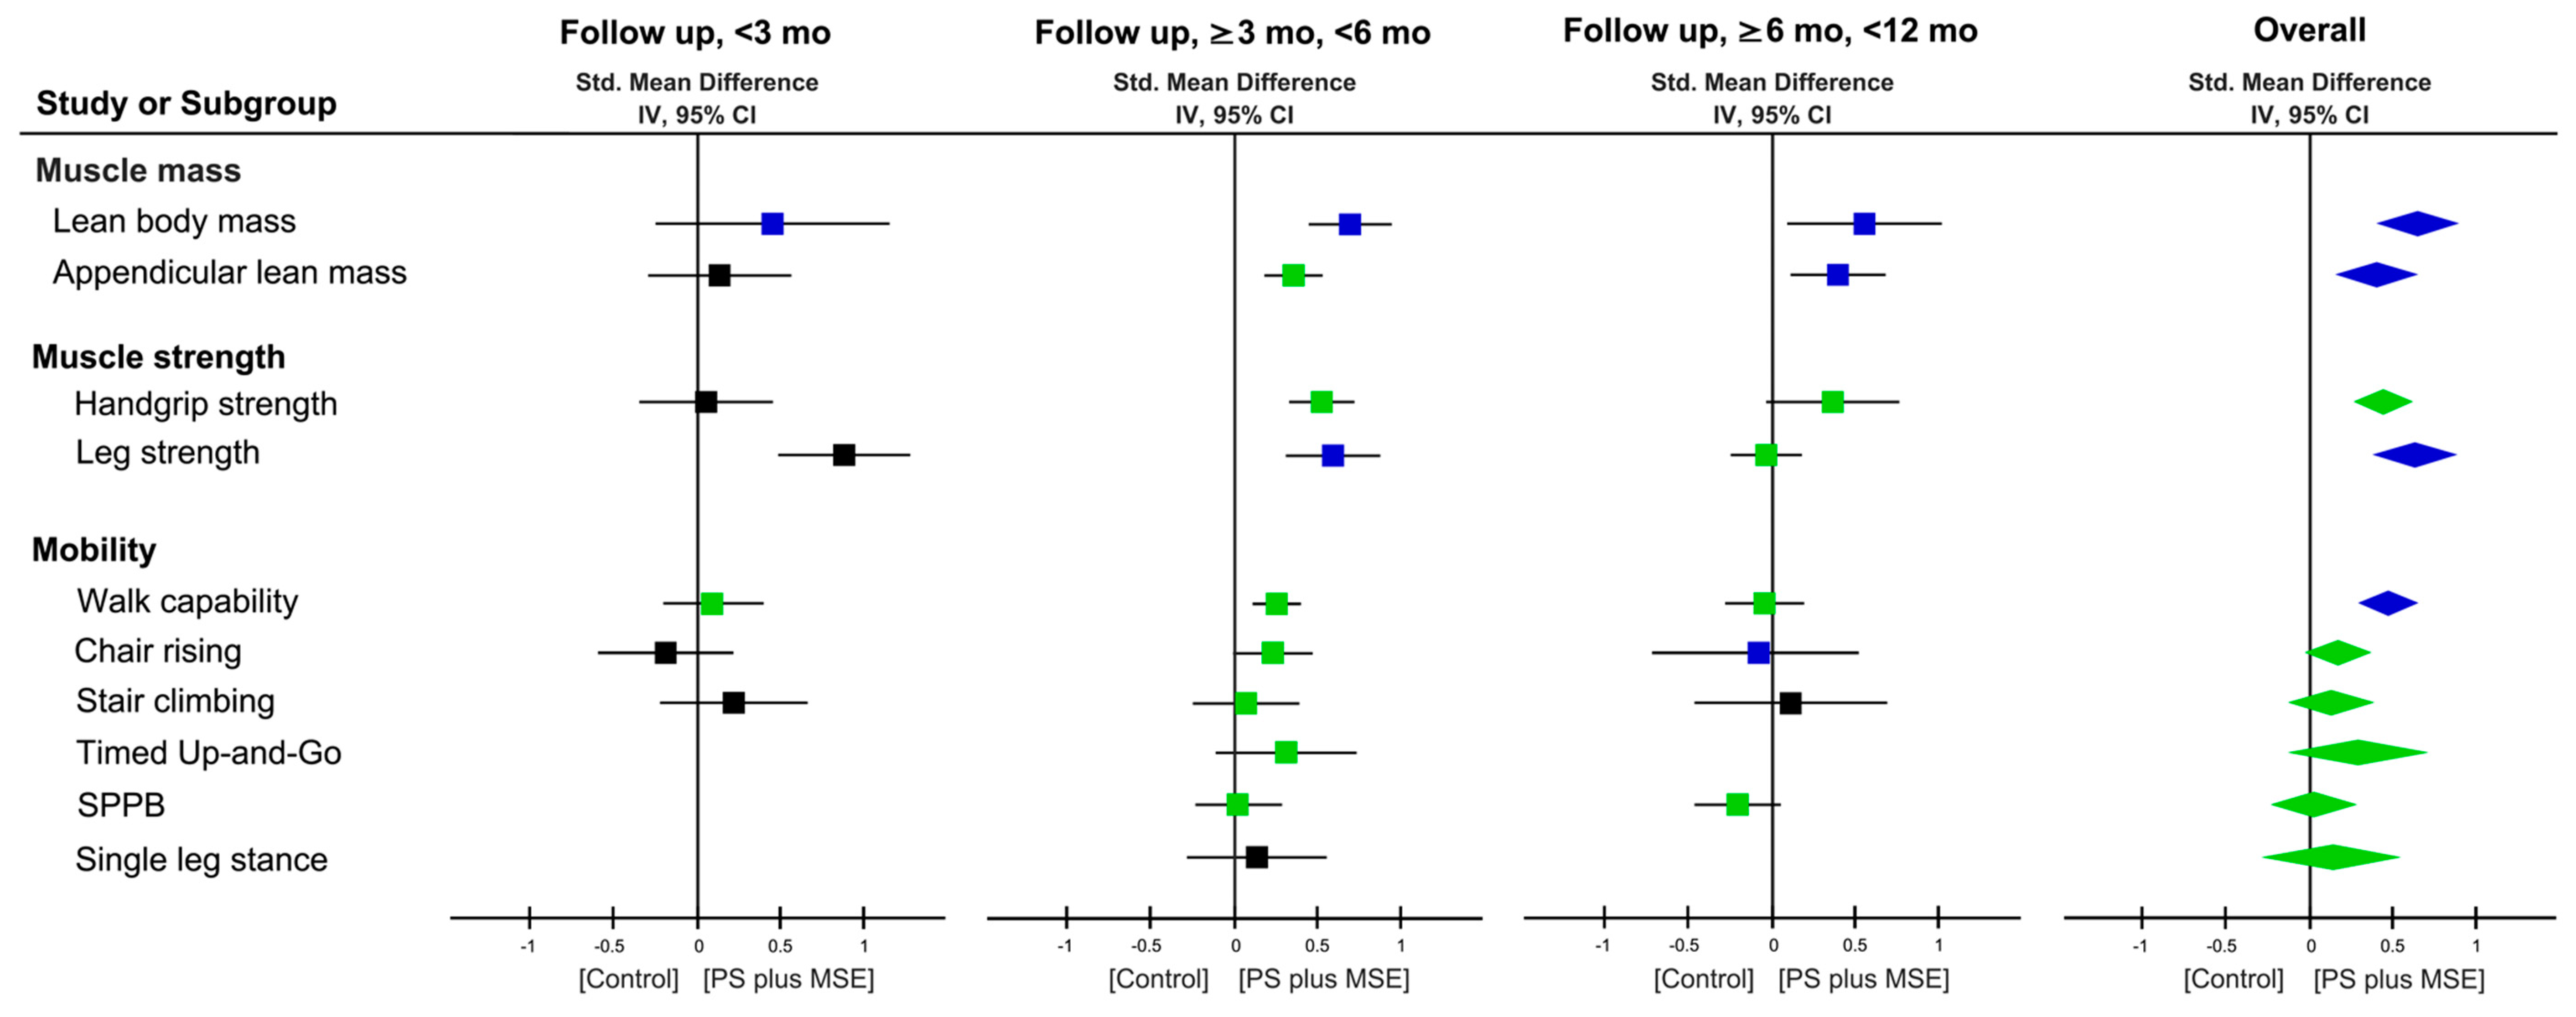
3.7. Effectiveness on Muscle Strength and Physical Mobility Outcome
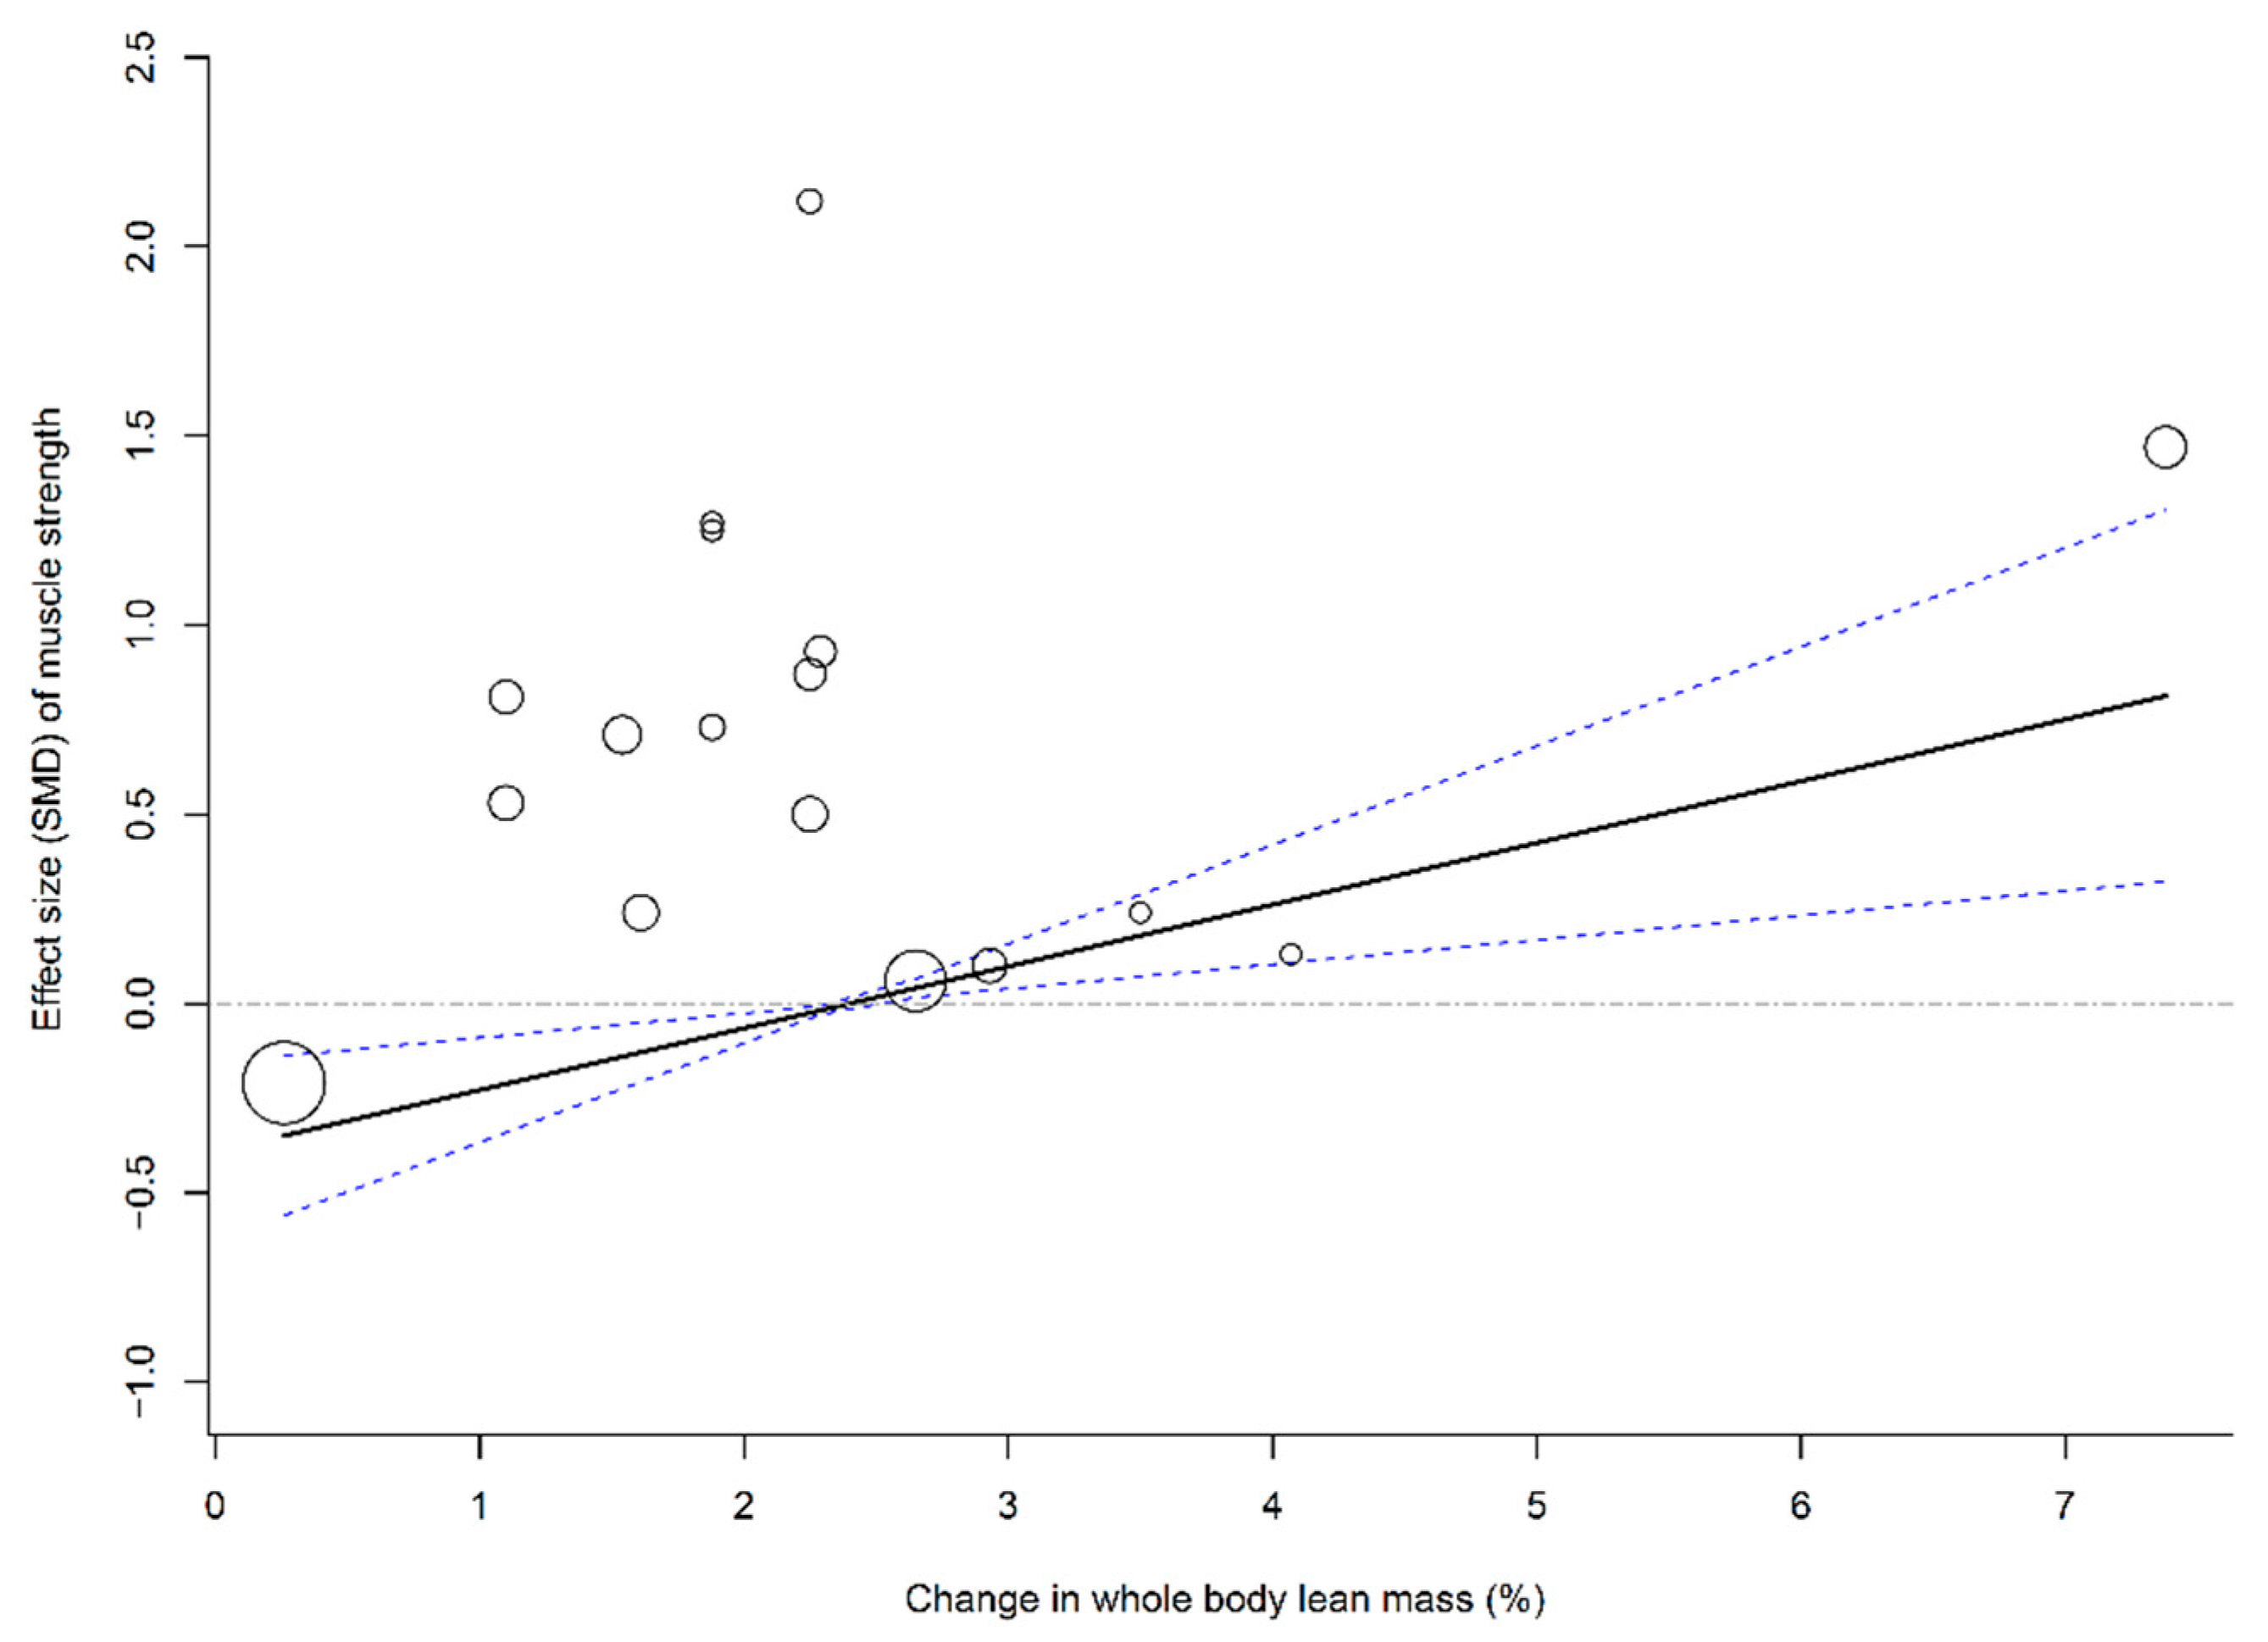
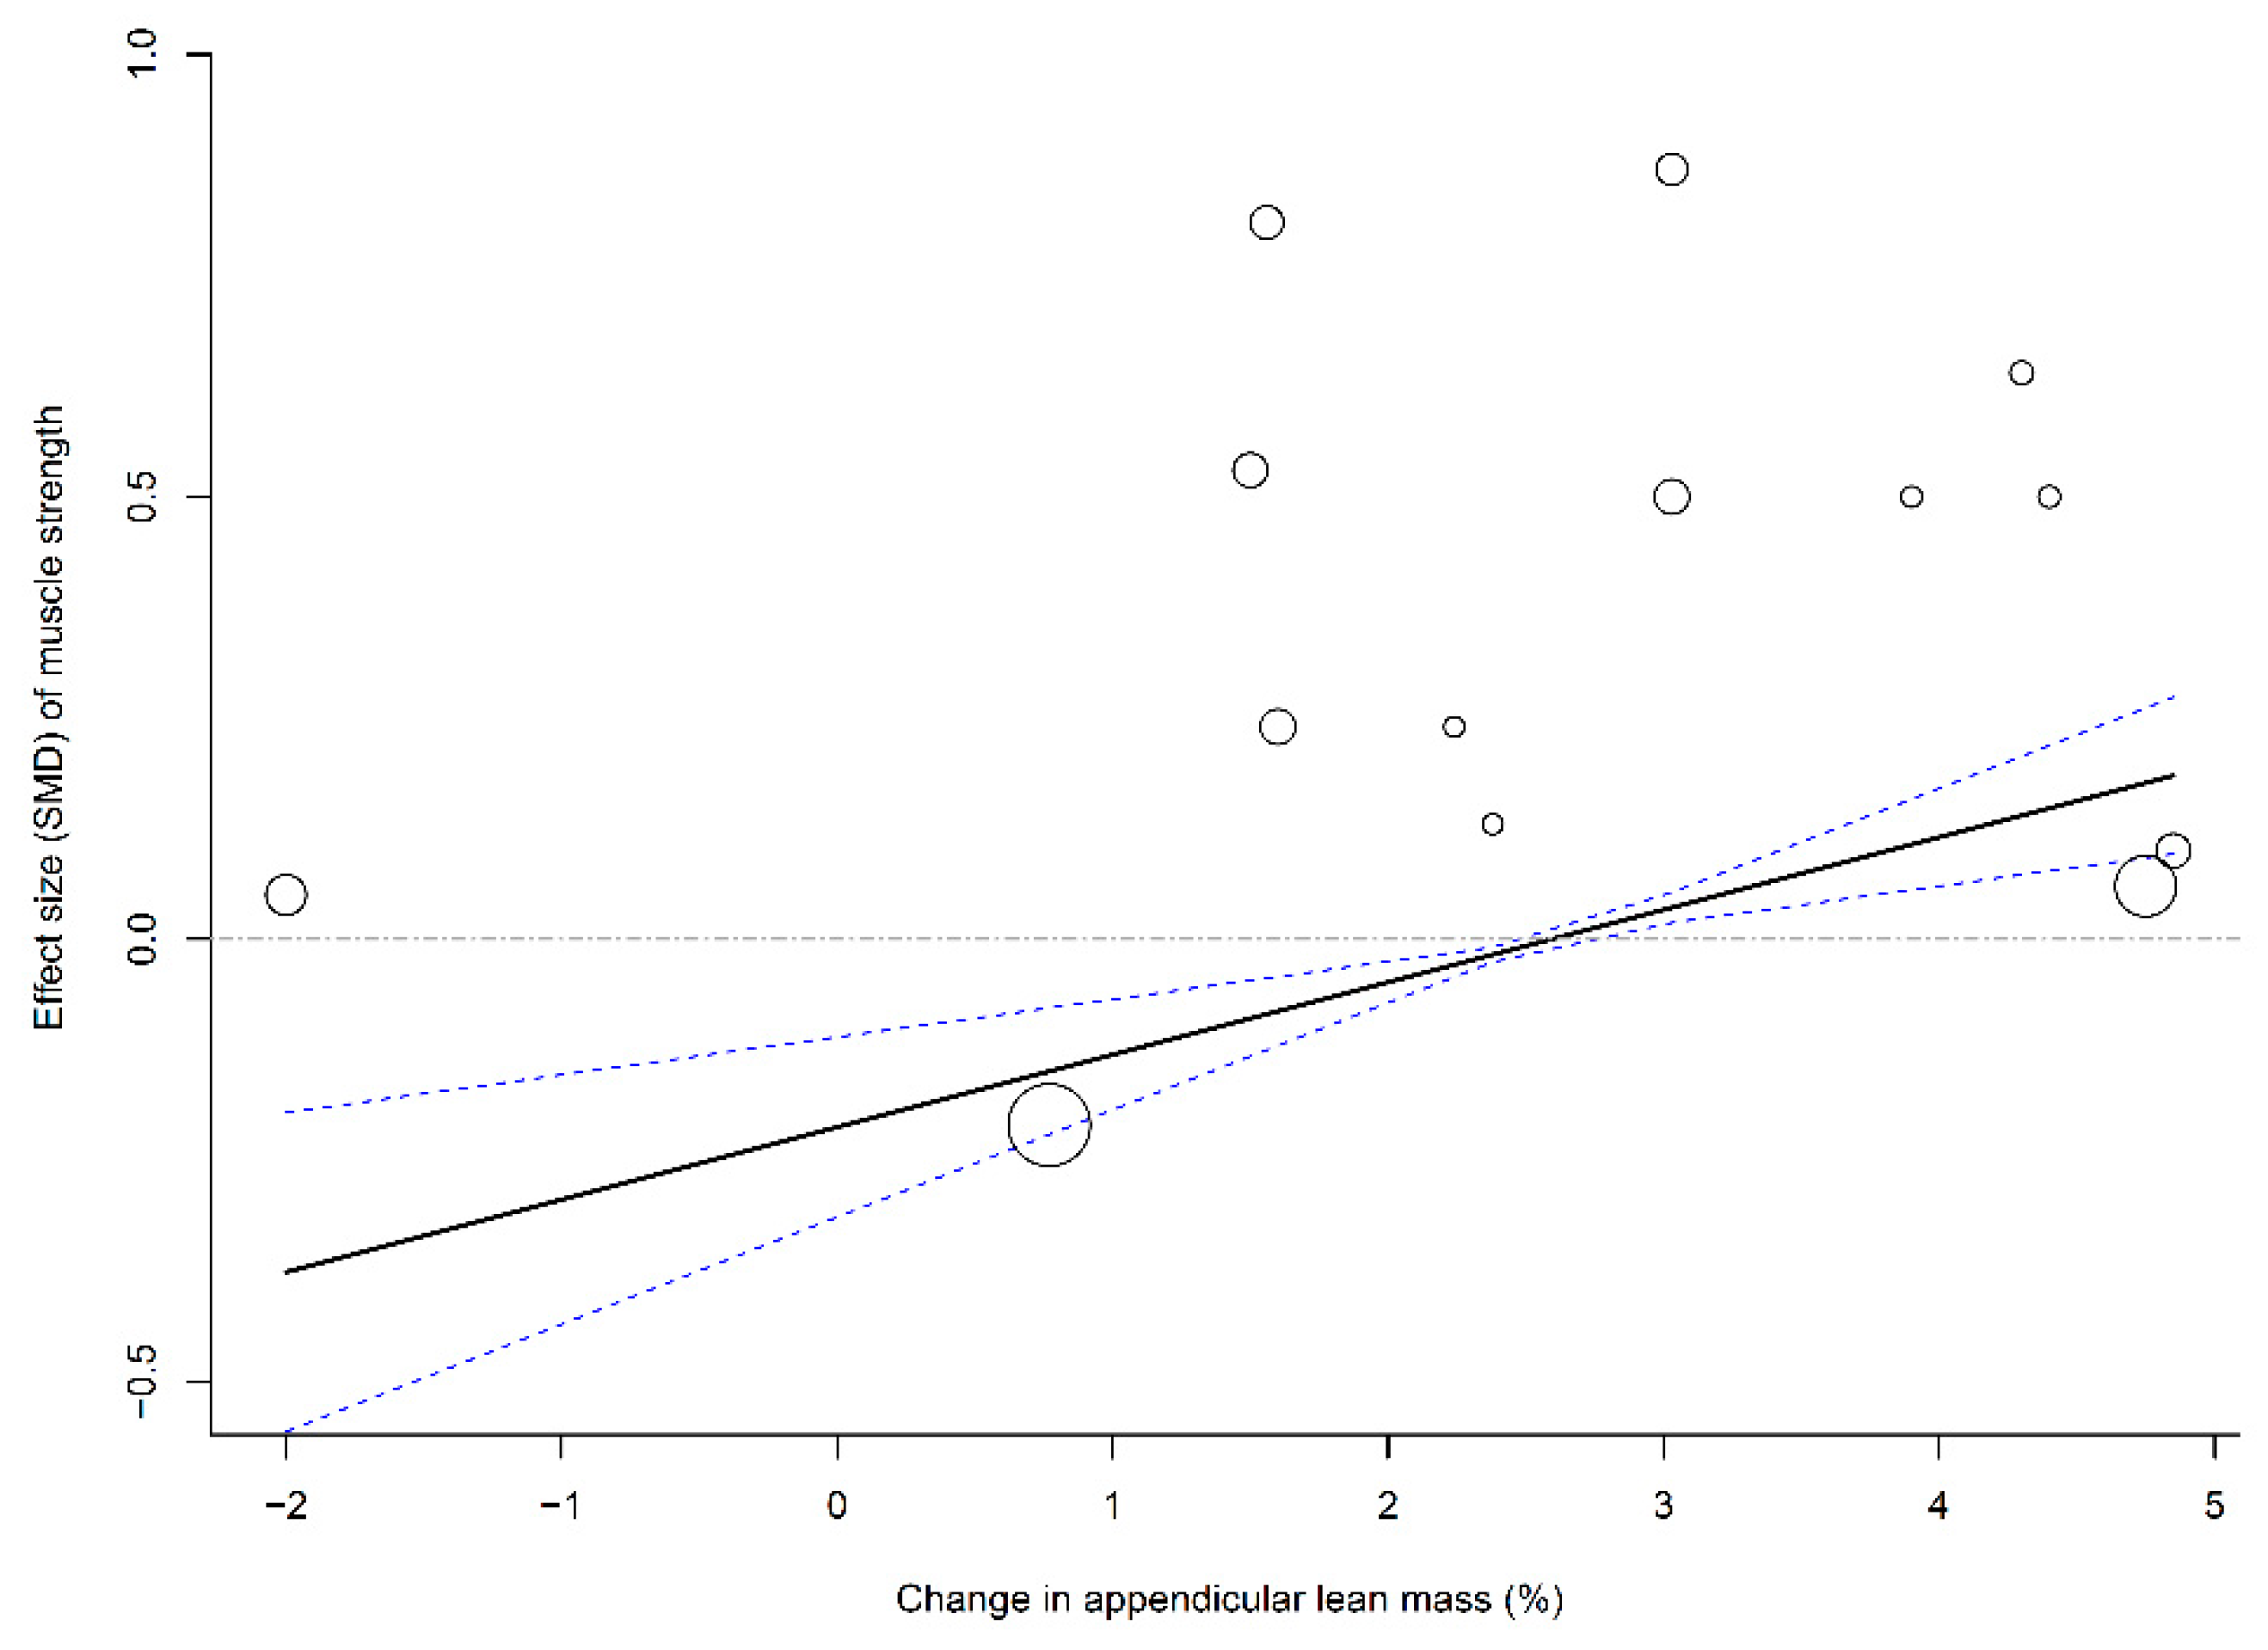
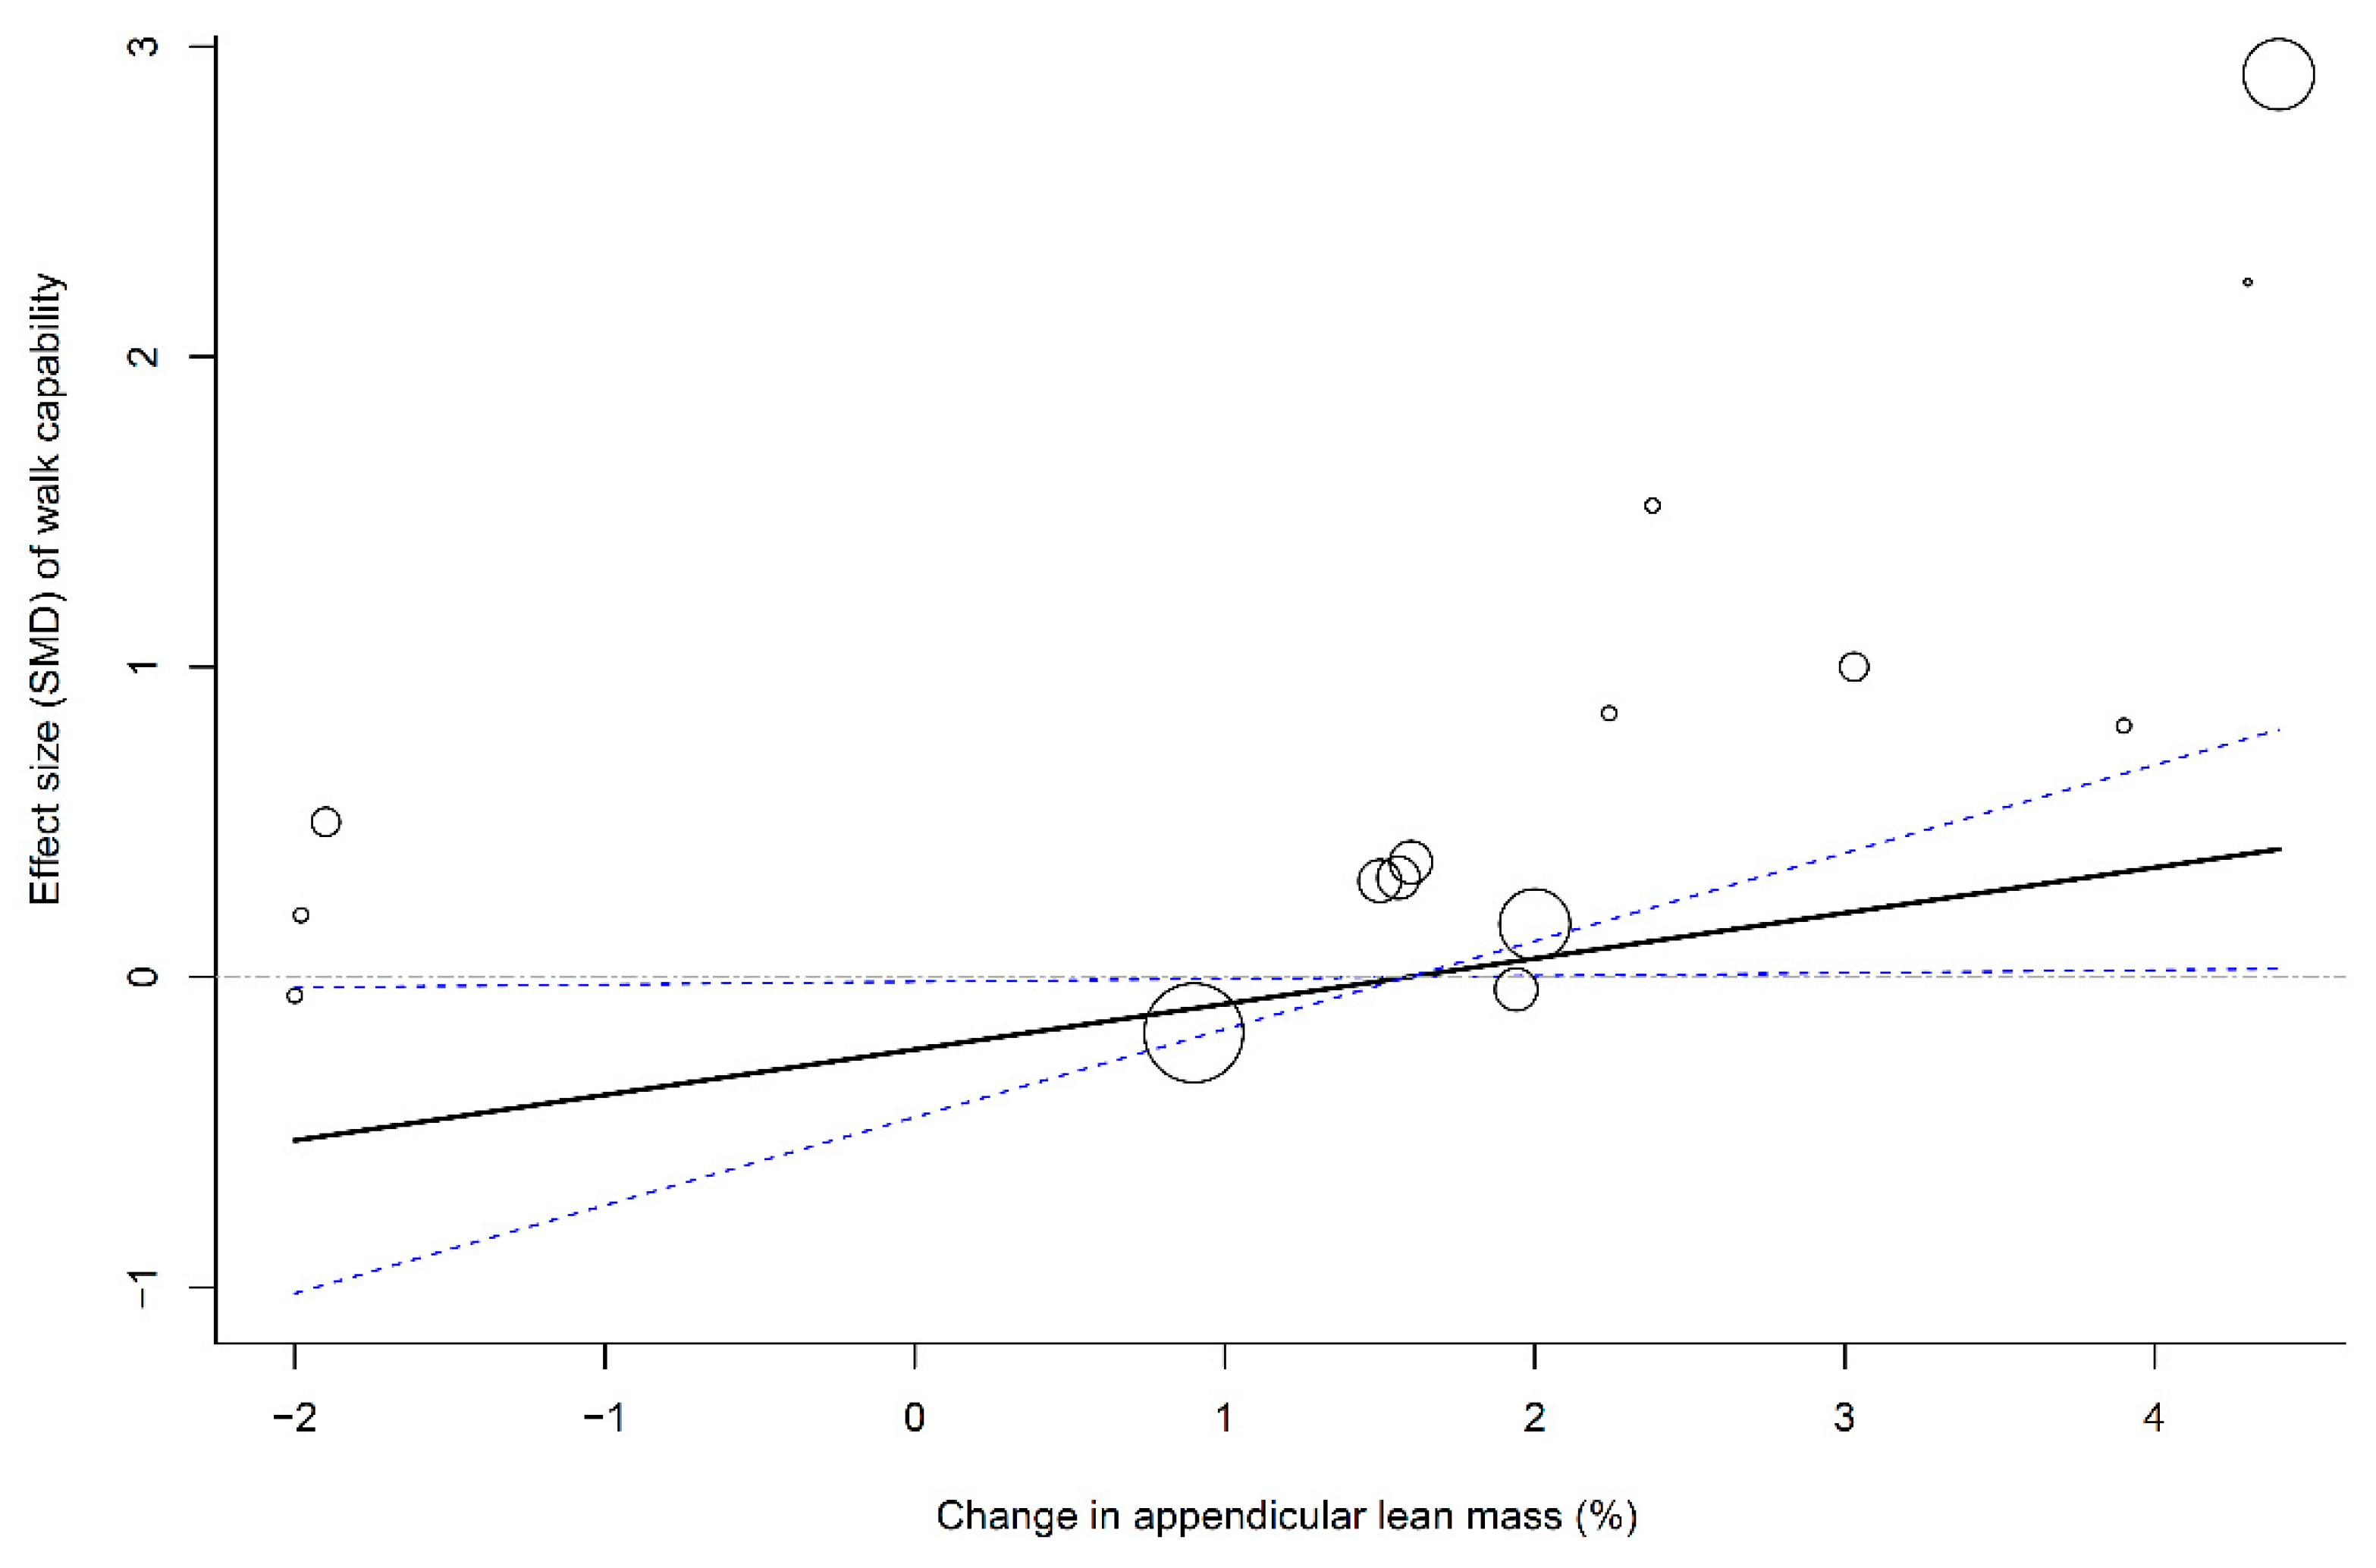
3.8. Associations of Muscle Mass Change with Muscle Strength and Physical Function
3.9. Side Effects and Compliance
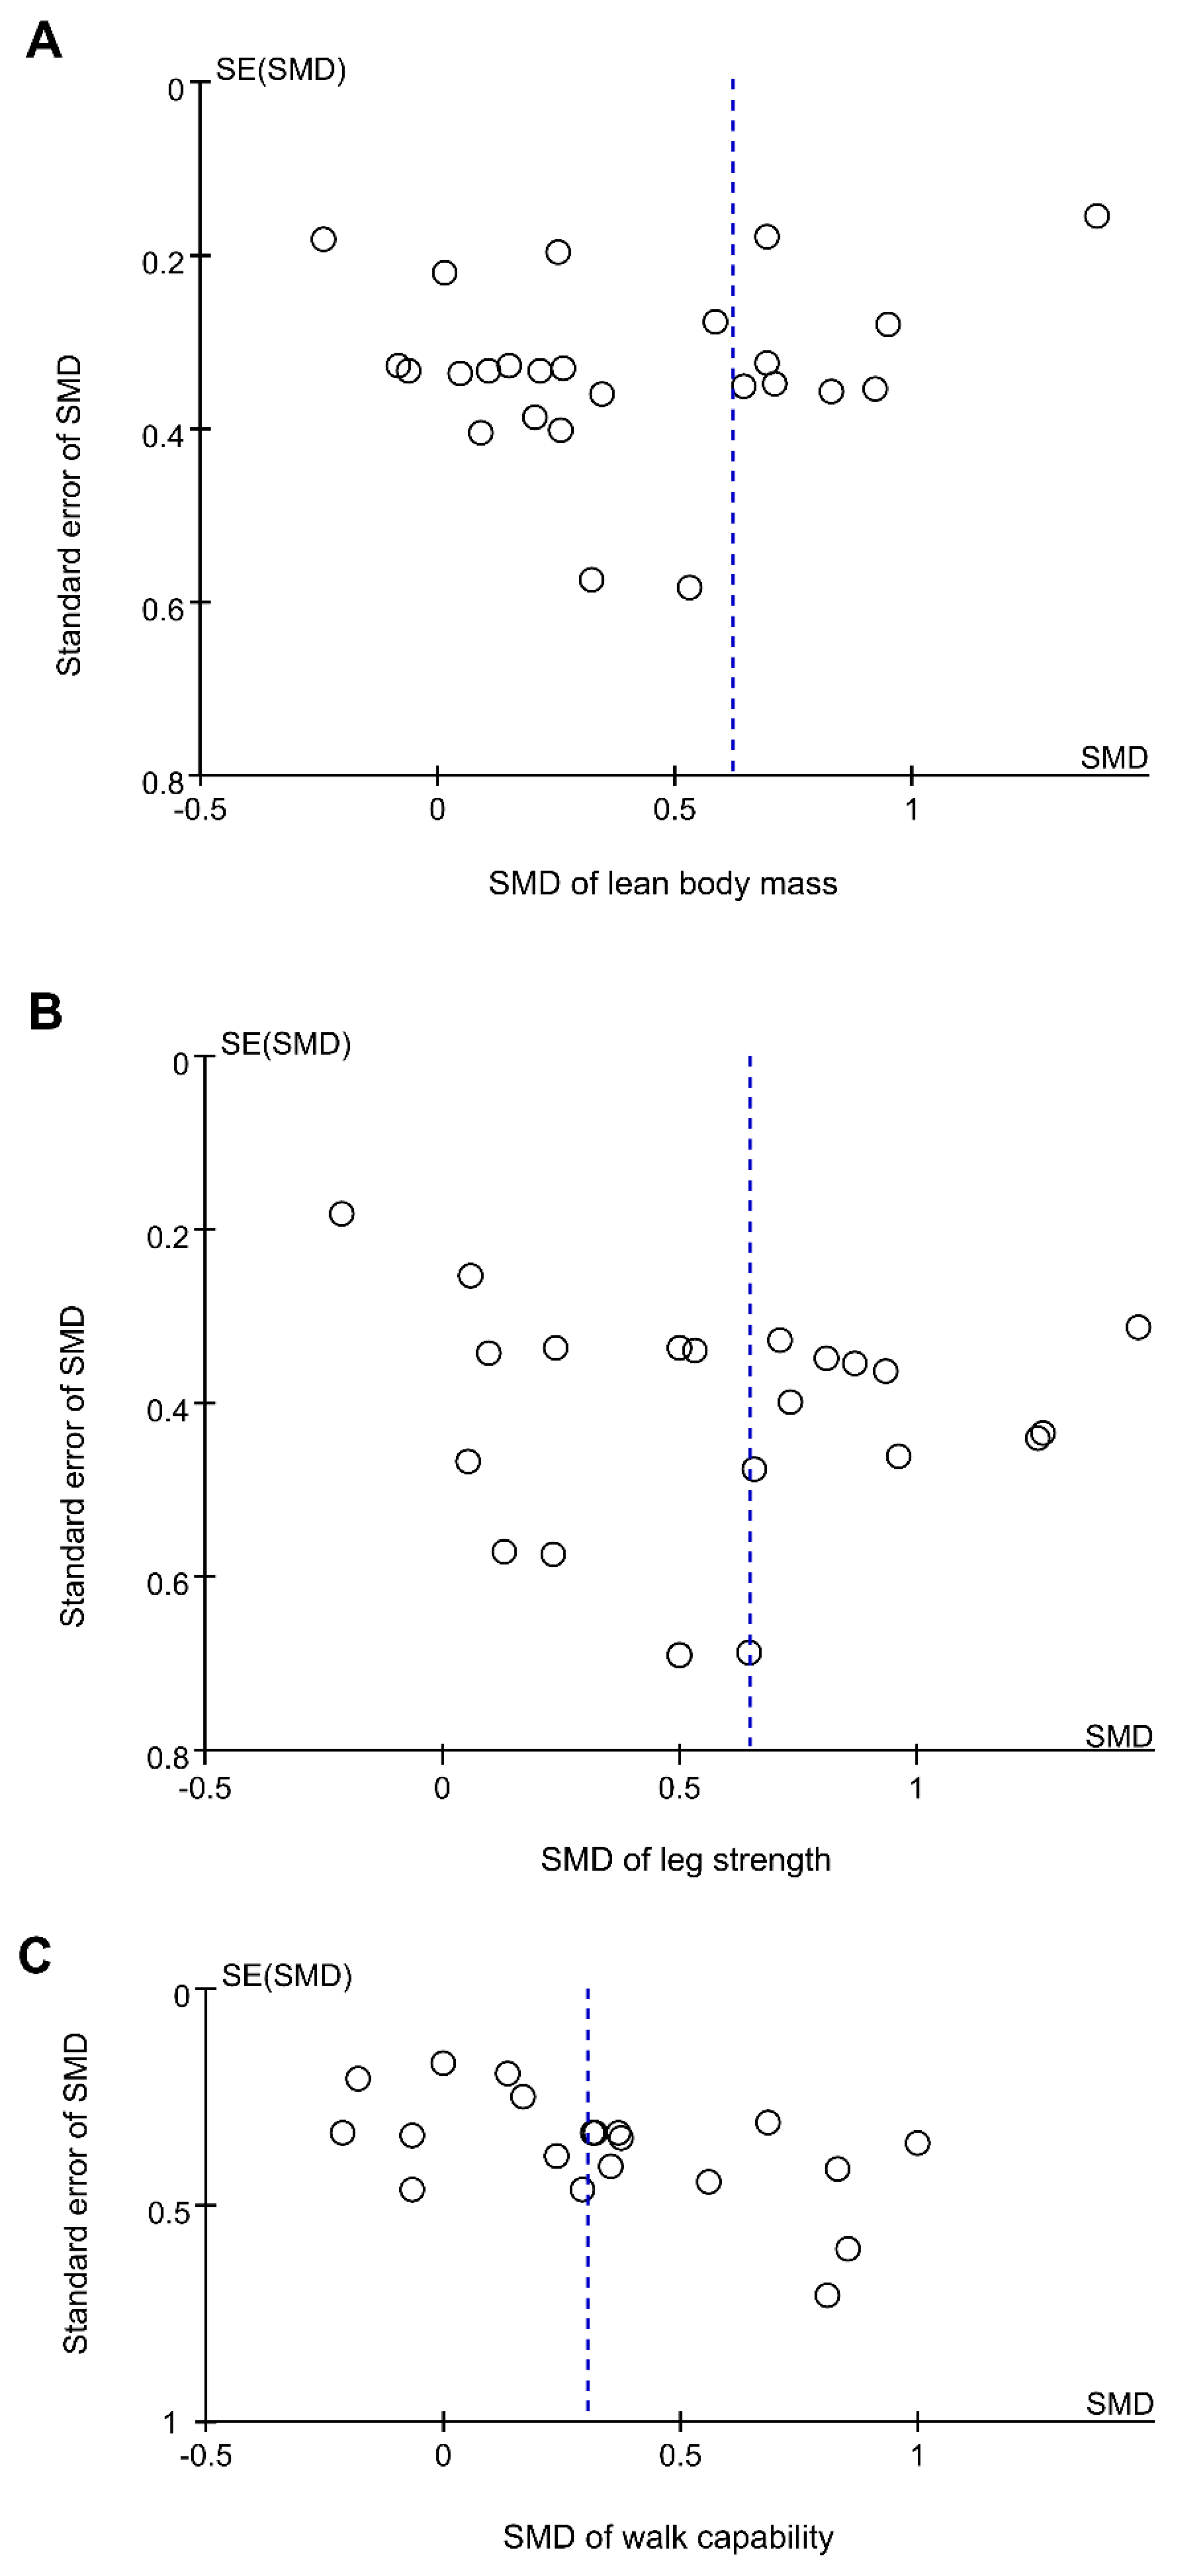
3.10. Publication Bias
4. Discussion
5. Conclusions
Supplementary Materials
Author Contributions
Funding
Acknowledgments
Conflicts of Interest
References
- Bernabei, R.; Martone, A.M.; Vetrano, D.L.; Calvani, R.; Landi, F.; Marzetti, E. Frailty, Physical Frailty, Sarcopenia: A New Conceptual Model. Stud. Health Technol. Inform. 2014, 203, 78–84. [Google Scholar] [PubMed]
- Dodds, R.; Sayer, A.A. Sarcopenia and frailty: New challenges for clinical practice. Clin. Med. 2016, 16, 455–458. [Google Scholar] [CrossRef] [PubMed]
- Buch, A.; Carmeli, E.; Boker, L.K.; Marcus, Y.; Shefer, G.; Kis, O.; Berner, Y.; Stern, N. Muscle function and fat content in relation to sarcopenia, obesity and frailty of old age—An overview. Exp. Gerontol. 2016, 76, 25–32. [Google Scholar] [CrossRef] [PubMed]
- Cruz-Jentoft, A.J.; Bahat, G.; Bauer, J.; Boirie, Y.; Bruyère, O.; Cederholm, T.; Cooper, C.; Landi, F.; Rolland, Y.; Sayer, A.A.; et al. Sarcopenia: Revised European consensus on definition and diagnosis. Age Ageing 2019, 48, 16–31. [Google Scholar] [CrossRef] [PubMed]
- Fried, L.P.; Tangen, C.M.; Walston, J.; Newman, A.B.; Hirsch, C.; Gottdiener, J.; Seeman, T.; Tracy, R.; Kop, W.J.; Burke, G.; et al. Frailty in Older Adults: Evidence for a Phenotype. J. Gerontol. Ser. A Boil. Sci. Med. Sci. 2001, 56, M146–M157. [Google Scholar] [CrossRef] [PubMed]
- Lee, J.S.; Auyeung, T.-W.; Kwok, T.; Lau, E.M.; Leung, P.-C.; Woo, J. Associated Factors and Health Impact of Sarcopenia in Older Chinese Men and Women: A Cross-Sectional Study. Gerontology 2007, 53, 404–410. [Google Scholar] [CrossRef]
- Janssen, I.; Heymsfield, S.B.; Ross, R. Low Relative Skeletal Muscle Mass (Sarcopenia) in Older Persons Is Associated with Functional Impairment and Physical Disability. J. Am. Geriatr. Soc. 2002, 50, 889–896. [Google Scholar] [CrossRef] [Green Version]
- Trethewey, S.P.; Brown, N.; Gao, F.; Turner, A.M. Interventions for the management and prevention of sarcopenia in the critically ill: A systematic review. J. Crit. Care 2019, 50, 287–295. [Google Scholar] [CrossRef]
- Jadczak, A.D.; Makwana, N.; Luscombe-Marsh, N.; Visvanathan, R.; Schultz, T.J. Effectiveness of exercise interventions on physical function in community-dwelling frail older people: An umbrella review of systematic reviews. JBI Database Syst. Rev. Implement. Rep. 2018, 16, 752–775. [Google Scholar] [CrossRef]
- Tessier, A.-J.; Chevalier, S. An Update on Protein, Leucine, Omega-3 Fatty Acids, and Vitamin D in the Prevention and Treatment of Sarcopenia and Functional Decline. Nutrients 2018, 10, 1099. [Google Scholar] [CrossRef]
- Phillips, S.M. Nutritional Supplements in Support of Resistance Exercise to Counter Age-Related Sarcopenia12. Adv. Nutr. 2015, 6, 452–460. [Google Scholar] [CrossRef]
- Denison, H.J.; Cooper, C.; Sayer, A.A.; Robinson, S.M. Prevention and optimal management of sarcopenia: A review of combined exercise and nutrition interventions to improve muscle outcomes in older people. Clin. Interv. Aging 2015, 10, 859–869. [Google Scholar]
- Morton, R.W.; Murphy, K.T.; McKellar, S.R.; Schoenfeld, B.J.; Henselmans, M.; Helms, E.; Aragon, A.A.; Devries, M.C.; Banfield, L.; Krieger, J.W.; et al. A systematic review, meta-analysis and meta-regression of the effect of protein supplementation on resistance training-induced gains in muscle mass and strength in healthy adults. Br. J. Sports. Med. 2018, 52, 376–384. [Google Scholar] [CrossRef]
- Liao, C.-D.; Lee, P.-H.; Hsiao, D.-J.; Huang, S.-W.; Tsauo, J.-Y.; Chen, H.-C.; Liou, T.-H. Effects of Protein Supplementation Combined with Exercise Intervention on Frailty Indices, Body Composition, and Physical Function in Frail Older Adults. Nutrients 2018, 10, 1916. [Google Scholar] [CrossRef]
- Hidayat, K.; Chen, G.C.; Wang, Y.; Zhang, Z.; Dai, X.; Szeto, I.M.Y.; Qin, L.Q. Effects of milk proteins supplementation in older adults undergoing resistance training: A meta-analysis of randomized control trials. J. Nutr. Health Aging. 2018, 22, 237–245. [Google Scholar] [CrossRef]
- Naclerio, F.; Larumbe-Zabala, E. Effects of Whey Protein Alone or as Part of a Multi-ingredient Formulation on Strength, Fat-Free Mass, or Lean Body Mass in Resistance-Trained Individuals: A Meta-analysis. Sports Med. 2016, 46, 125–137. [Google Scholar] [CrossRef]
- Luo, D.; Lin, Z.; Li, S.; Liu, S.-J. Effect of nutritional supplement combined with exercise intervention on sarcopenia in the elderly: A meta-analysis. Int. J. Nurs. Sci. 2017, 4, 389–401. [Google Scholar] [CrossRef]
- Cheng, H.; Kong, J.; Underwood, C.; Petocz, P.; Hirani, V.; Dawson, B.; O’Leary, F. Systematic review and meta-analysis of the effect of protein and amino acid supplements in older adults with acute or chronic conditions. Br. J. Nutr. 2018, 119, 527–542. [Google Scholar] [CrossRef]
- Wu, Y.-T.; Cheng, C.-P.; Chen, H.-C.; Liao, C.-D.; Tsauo, J.-Y.; Huang, Y.-C.; Liou, T.-H. Effects of protein supplementation combined with resistance exercise on body composition and physical function in older adults: A systematic review and meta-analysis. Am. J. Clin. Nutr. 2017, 106, 1078–1091. [Google Scholar]
- Finger, D.; Goltz, F.R.; Umpierre, D.; Meyer, E.; Rosa, L.H.; Schneider, C.D. Effects of protein supplementation in older adults undergoing resistance training: A systematic review and meta-analysis. Sports Med. 2015, 45, 245–255. [Google Scholar] [CrossRef]
- Liu, L.-K.; Lee, W.-J.; Liu, C.-L.; Chen, L.-Y.; Lin, M.-H.; Peng, L.-N.; Chen, L.-K. Age-related skeletal muscle mass loss and physical performance in Taiwan: Implications to diagnostic strategy of sarcopenia in Asia. Geriatr. Gerontol. Int. 2013, 13, 964–971. [Google Scholar] [CrossRef]
- Santos, M.; Gomes, W.; Pereira, D.; Oliveira, D.; Dias, J.; Ferrioli, E.; Pereira, L. Muscle strength, muscle balance, physical function and plasma interleukin-6 (IL-6) levels in elderly women with knee osteoarthritis (OA). Arch. Gerontol. Geriatr. 2011, 52, 322–326. [Google Scholar] [CrossRef]
- Wilson, D.; Jackson, T.; Sapey, E.; Lord, J.M. Frailty and sarcopenia: The potential role of an aged immune system. Ageing Res. Rev. 2017, 36, 1–10. [Google Scholar] [CrossRef]
- Shamseer, L.; Moher, D.; Clarke, M.; Ghersi, D.; Liberati, A.; Petticrew, M.; Shekelle, P.; Stewart, L.A. The PRISMA-P Group. Preferred reporting items for systematic review and meta-analysis protocols (PRISMA-P) 2015: Elaboration and explanation. BMJ 2015, 349, g7647. [Google Scholar] [CrossRef]
- Higgins, J.P.T.; Deeks, J.J.; Altman, D.G. Chapter 16: Special topics in statistics. In Cochrane Handbook for Systematic Reviews of Interventions Version 5.1.0; Updated March 2011; Higgins, J.P.T., Green, S., Eds.; The Cochrane Collaboration: London, UK, 2011. [Google Scholar]
- Wu, C.-H.; Chen, K.-T.; Hou, M.-T.; Chang, Y.-F.; Chang, C.-S.; Liu, P.-Y.; Wu, S.-J.; Chiu, C.-J.; Jou, I.-M.; Chen, C.-Y. Prevalence and associated factors of sarcopenia and severe sarcopenia in older Taiwanese living in rural community: The Tianliao Old People study 04. Geriatr. Gerontol. Int. 2014, 14, 69–75. [Google Scholar] [CrossRef] [Green Version]
- Briani, R.V.; Ferreira, A.S.; Pazzinatto, M.F.; Pappas, E.; Silva, D.D.O.; De Azevedo, F.M. What interventions can improve quality of life or psychosocial factors of individuals with knee osteoarthritis? A systematic review with meta-analysis of primary outcomes from randomised controlled trials. Br. J. Sports Med. 2018, 52, 1031–1038. [Google Scholar] [CrossRef] [Green Version]
- Cermak, N.M.; Res, P.T.; De Groot, L.C.; Saris, W.H.; Van Loon, L.J. Protein supplementation augments the adaptive response of skeletal muscle to resistance-type exercise training: A meta-analysis. Am. J. Clin. Nutr. 2012, 96, 1454–1464. [Google Scholar] [CrossRef]
- Haaf, D.S.; Eijsvogels, T.M.; Bongers, C.C.; Horstman, A.M.; Timmers, S.; Groot, L.C.; Hopman, M.T.; Haaf, D.S.T.; De Groot, L.C. Protein supplementation improves lean body mass in physically active older adults: A randomized placebo-controlled trial. J. Cachex Sarcopenia Muscle 2019, 10, 298–310. [Google Scholar] [CrossRef]
- Oesen, S.; Halper, B.; Hofmann, M.; Jandrasits, W.; Franzke, B.; Strasser, E.-M.; Graf, A.; Tschan, H.; Bachl, N.; Quittan, M.; et al. Effects of elastic band resistance training and nutritional supplementation on physical performance of institutionalised elderly—A randomized controlled trial. Exp. Gerontol. 2015, 72, 99–108. [Google Scholar] [CrossRef]
- Kim, H.; Kim, M.; Kojima, N.; Fujino, K.; Hosoi, E.; Kobayashi, H.; Somekawa, S.; Niki, Y.; Yamashiro, Y.; Yoshida, H. Exercise and Nutritional Supplementation on Community-Dwelling Elderly Japanese Women with Sarcopenic Obesity: A Randomized Controlled Trial. J. Am. Med. Dir. Assoc. 2016, 17, 1011–1019. [Google Scholar] [CrossRef]
- Luo, D.; Wan, X.; Liu, J.; Tong, T. Optimally estimating the sample mean from the sample size, median, mid-range, and/or mid-quartile range. Stat. Methods Med. Res. 2018, 27, 1785–1805. [Google Scholar] [CrossRef]
- Bowden, J.; Tierney, J.F.; Copas, A.J.; Burdett, S. Quantifying, displaying and accounting for heterogeneity in the meta-analysis of RCTs using standard and generalised Q statistics. BMC Med. Res. Methodol. 2011, 11, 41. [Google Scholar] [CrossRef]
- Churchward-Venne, T.A.; Holwerda, A.M.; Phillips, S.M.; Van Loon, L.J. What is the Optimal Amount of Protein to Support Post-Exercise Skeletal Muscle Reconditioning in the Older Adult? Sports Med. 2016, 46, 1205–1212. [Google Scholar] [CrossRef]
- Beaudreuil, J.; Coudreuse, J.M.; Guyen, C.N.; Deat, P.; Chabaud, A.; Pereira, B.; Lorenzo, A.; Sailhan, F.; Rannou, F.; Coudeyre, E. An algorithm to improve knee orthosis prescription for osteoarthritis patients. Ann. Phys. Rehabil. Med. 2016, 59, e156. [Google Scholar] [CrossRef]
- Egger, M.; Smith, G.D.; Schneider, M.; Minder, C. Bias in meta-analysis detected by a simple, graphical test. BMJ 1997, 315, 629–634. [Google Scholar] [CrossRef] [Green Version]
- Björkman, M.P.; Pilvi, T.K.; Kekkonen, R.A.; Korpela, R.; Tilvis, R.S. Similar effects of leucine rich and regular dairy products on muscle mass and functions of older polymyalgia rheumatica patients: A randomized crossover trial. J. Nutr. Health Aging 2011, 15, 462–467. [Google Scholar] [CrossRef]
- Bonnefoy, M.; Boutitie, F.; Mercier, C.; Gueyffier, F.; Carre, C.; Guetemme, G.; Ravis, B.; Laville, M.; Cornu, C. Efficacy of a home-based intervention programme on the physical activity level and functional ability of older people using domestic services: A randomised study. J. Nutr. Health Aging 2012, 16, 370–377. [Google Scholar] [CrossRef]
- Bonnefoy, M.; Cornu, C.; Normand, S.; Boutitie, F.; Bugnard, F.; Rahmani, A.; Lacour, J.R.; Laville, M. The effects of exercise and protein–energy supplements on body composition and muscle function in frail elderly individuals: A long-term controlled randomised study. Br. J. Nutr. 2003, 89, 731–738. [Google Scholar] [CrossRef]
- Carlsson, M.; Littbrand, H.; Gustafson, Y.; Lundin-Olsson, L.; Lindelöf, N.; Rosendahl, E.; Håglin, L. Effects of high-intensity exercise and protein supplement on muscle mass in ADL dependent older people with and without malnutrition: A randomized controlled trial. J. Nutr. Health Aging 2011, 15, 554–560. [Google Scholar] [CrossRef]
- Dirks, M.L.; Tieland, M.; Verdijk, L.B.; Losen, M.; Nilwik, R.; Mensink, M.; De Groot, L.C.; Van Loon, L.J. Protein Supplementation Augments Muscle Fiber Hypertrophy but Does Not Modulate Satellite Cell Content During Prolonged Resistance-Type Exercise Training in Frail Elderly. J. Am. Med Dir. Assoc. 2017, 18, 608–615. [Google Scholar] [CrossRef]
- Englund, D.A.; Kirn, D.R.; Koochek, A.; Zhu, H.; Travison, T.G.; Reid, K.F.; Von Berens, Å.; Melin, M.; Cederholm, T.; Gustafsson, T.; et al. Nutritional Supplementation With Physical Activity Improves Muscle Composition in Mobility-Limited Older Adults, The VIVE2 Study: A Randomized, Double-Blind, Placebo-Controlled Trial. J. Gerontol. Ser. A Boil. Sci. Med Sci. 2017, 73, 95–101. [Google Scholar]
- Fiatarone, M.A.; O’Neill, E.F.; Ryan, N.D.; Clements, K.M.; Solares, G.R.; Nelson, M.E.; Kehayias, J.J.; Lipsitz, L.A.; Roberts, S.B.; Evans, W.J. Exercise Training and Nutritional Supplementation for Physical Frailty in Very Elderly People. N. Engl. J. Med. 1994, 330, 1769–1775. [Google Scholar] [CrossRef] [Green Version]
- Fielding, R.A.; Travison, T.G.; Kirn, D.R.; Koochek, A.; Reid, K.F.; Von Berens, Å.; Zhu, H.; Folta, S.C.; Sacheck, J.M.; Nelson, M.E.; et al. Effect of structured physical activity and nutritional supplementation on physical function in mobility-limited older adults: Results from the VIVE2 randomized trial. J. Nutr. Heal. Aging 2017, 21, 936–942. [Google Scholar] [CrossRef]
- Hegerová, P.; Dědková, Z.; Sobotka, L. Early nutritional support and physiotherapy improved long-term self-sufficiency in acutely ill older patients. Nutrition 2015, 31, 166–170. [Google Scholar] [CrossRef]
- Imaoka, M.; Higuchi, Y.; Todo, E.; Kitagwa, T.; Ueda, T. Low-frequency Exercise and Vitamin D Supplementation Reduce Falls among Institutionalized Frail Elderly. Int. J. Gerontol. 2016, 10, 202–206. [Google Scholar] [CrossRef]
- Kim, H.K.; Suzuki, T.; Saito, K.; Yoshida, H.; Kobayashi, H.; Kato, H.; Katayama, M. Effects of exercise and amino acid supplementation on body composition and physical function in community-dwelling elderly Japanese sarcopenic women: A randomized controlled trial. J. Am. Geriatr. Soc. 2012, 60, 16–23. [Google Scholar] [CrossRef]
- Maltais, M.L.; Ladouceur, J.P.; Dionne, I.J. The Effect of Resistance Training and Different Sources of Postexercise Protein Supplementation on Muscle Mass and Physical Capacity in Sarcopenic Elderly Men. J. Strength Cond. Res. 2016, 30, 1680–1687. [Google Scholar] [CrossRef]
- Molnar, A.; Jonasne Sztruhar, I.; Csontos, A.A.; Ferencz, C.; Varbiro, S.; Szekacs, B. Special nutrition intervention is required for muscle protective efficacy of physical exercise in elderly people at highest risk of sarcopenia. Physiol. Int. 2016, 103, 368–376. [Google Scholar] [CrossRef] [Green Version]
- Rondanelli, M.; Klersy, C.; Terracol, G.; Talluri, J.; Maugeri, R.; Guido, D.; Faliva, M.A.; Solerte, B.S.; Fioravanti, M.; Lukaski, H.; et al. Whey protein, amino acids, and vitamin D supplementation with physical activity increases fat-free mass and strength, functionality, and quality of life and decreases inflammation in sarcopenic elderly. Am. J. Clin. Nutr. 2016, 103, 830–840. [Google Scholar] [CrossRef]
- Tieland, M.; Dirks, M.L.; Van Der Zwaluw, N.; Verdijk, L.B.; Van De Rest, O.; De Groot, L.C.; Van Loon, L.J. Protein Supplementation Increases Muscle Mass Gain During Prolonged Resistance-Type Exercise Training in Frail Elderly People: A Randomized, Double-Blind, Placebo-Controlled Trial. J. Am. Med Dir. Assoc. 2012, 13, 713–719. [Google Scholar] [CrossRef]
- Yamada, M.; Kimura, Y.; Ishiyama, D.; Nishio, N.; Otobe, Y.; Tanaka, T.; Ohji, S.; Koyama, S.; Sato, A.; Suzuki, M.; et al. Synergistic effect of bodyweight resistance exercise and protein supplementation on skeletal muscle in sarcopenic or dynapenic older adults. Geriatr. Gerontol. Int. 2019, 19, 429–437. [Google Scholar] [CrossRef]
- Yamada, M.; Nishiguchi, S.; Fukutani, N.; Aoyama, T.; Arai, H. Mail-Based Intervention for Sarcopenia Prevention Increased Anabolic Hormone and Skeletal Muscle Mass in Community-Dwelling Japanese Older Adults: The INE (Intervention by Nutrition and Exercise) Study. J. Am. Med. Dir. Assoc. 2015, 16, 654–660. [Google Scholar] [CrossRef]
- Zdzieblik, D.; Oesser, S.; Baumstark, M.W.; Gollhofer, A.; König, D. Collagen peptide supplementation in combination with resistance training improves body composition and increases muscle strength in elderly sarcopenic men: A randomised controlled trial. Br. J. Nutr. 2015, 114, 1237–1245. [Google Scholar] [CrossRef]
- Karelis, A.D.; Messier, V.; Suppere, C.; Briand, P.; Rabasa-Lhoret, R. Effect of cysteine-rich whey protein (immunocal(R)) supplementation in combination with resistance training on muscle strength and lean body mass in non-frail elderly subjects: A randomized, double-blind controlled study. J. Nutr. Health Aging. 2015, 19, 531–536. [Google Scholar] [CrossRef]
- Liao, C.-D.; Tsauo, J.-Y.; Chen, H.-C.; Liou, T.-H. Reply to RW Morton and SM Phillips. Am. J. Clin. Nutr. 2018, 107, 1056–1057. [Google Scholar] [CrossRef]
- Coelho-Júnior, H.J.; Rodrigues, B.; Uchida, M.; Marzetti, E. Low Protein Intake Is Associated with Frailty in Older Adults: A Systematic Review and Meta-Analysis of Observational Studies. Nutrients 2018, 10, 1334. [Google Scholar] [CrossRef]
- Arrieta, H.; Rezola-Pardo, C.; Gil, S.M.; Irazusta, J.; Rodriguez-Larrad, A. Physical training maintains or improves gait ability in long-term nursing home residents: A systematic review of randomized controlled trials. Maturitas 2018, 109, 45–52. [Google Scholar] [CrossRef]
- Deutz, N.E.; Bauer, J.M.; Barazzoni, R.; Biolo, G.; Boirie, Y.; Bosy-Westphal, A.; Cederholm, T.; Cruz-Jentoft, A.; Krznariç, Z.; Nair, K.S.; et al. Protein intake and exercise for optimal muscle function with aging: Recommendations from the ESPEN Expert Group. Clin. Nutr. 2014, 33, 929–936. [Google Scholar] [CrossRef] [Green Version]
- Iuliano, S.; Poon, S.; Wang, X.; Bui, M.; Seeman, E. Dairy food supplementation may reduce malnutrition risk in institutionalised elderly. Br. J. Nutr. 2017, 117, 142–147. [Google Scholar] [CrossRef] [Green Version]
- Tieland, M.; Beelen, J.; Laan, A.C.; Poon, S.; De Groot, L.C.; Seeman, E.; Wang, X.; Iuliano, S. An Even Distribution of Protein Intake Daily Promotes Protein Adequacy but Does Not Influence Nutritional Status in Institutionalized Elderly. J. Am. Med Dir. Assoc. 2018, 19, 33–39. [Google Scholar] [CrossRef]
- Douma, J.G.; Volkers, K.M.; Engels, G.; Sonneveld, M.H.; Goossens, R.H.M.; Scherder, E.J.A. Setting-related influences on physical inactivity of older adults in residential care settings: A review. BMC Geriatr. 2017, 17, 97. [Google Scholar] [CrossRef]
- Tieland, M.; Borgonjen-Van den Berg, K.J.; van Loon, L.J.; De Groot, L.C. Dietary protein intake in community-dwelling, frail, and institutionalized elderly people: Scope for improvement. Eur. J. Nutr. 2012, 51, 173–179. [Google Scholar] [CrossRef]
- Guimarães-Ferreira, L.; Cholewa, J.M.; Naimo, M.A.; Zhi, X.; Magagnin, D.; De Sá, R.B.D.P.; Streck, E.L.; Teixeira, T.D.S.; Zanchi, N.E. Synergistic effects of resistance training and protein intake: Practical aspects. Nutrition 2014, 30, 1097–1103. [Google Scholar] [CrossRef]
- Fry, A.C. The role of resistance exercise intensity on muscle fibre adaptations. Sports Med. 2004, 34, 663–679. [Google Scholar] [CrossRef]
- Helms, E.R.; Cronin, J.; Storey, A.; Zourdos, M.C. Application of the Repetitions in Reserve-Based Rating of Perceived Exertion Scale for Resistance Training. Strength Cond. J. 2016, 38, 42–49. [Google Scholar] [CrossRef] [Green Version]
- Molina, R.G.; Ruíz-Grao, M.C.; García, A.N.; Reig, M.M.; Víctor, M.E.; Izquierdo, M.; Abizanda, P.; Grao, M.C.R.; Redín, M.I.; Soler, P.A. Benefits of a multicomponent Falls Unit-based exercise program in older adults with falls in real life. Exp. Gerontol. 2018, 110, 79–85. [Google Scholar] [CrossRef]
- Gwyther, H.; Bobrowicz-Campos, E.; Apostolo, J.L.A.; Marcucci, M.; Cano, A.; Holland, C. A realist review to understand the efficacy and outcomes of interventions designed to minimise, reverse or prevent the progression of frailty. Health Psychol. Rev. 2018, 12, 382–404. [Google Scholar] [CrossRef]
- Miller, P.E.; Alexander, D.D.; Perez, V. Effects of Whey Protein and Resistance Exercise on Body Composition: A Meta-Analysis of Randomized Controlled Trials. J. Am. Coll. Nutr. 2014, 33, 163–175. [Google Scholar] [CrossRef]
- Gade, J.; Pedersen, R.J.; Beck, A.M. Effect of Protein or Essential Amino Acid Supplementation During Prolonged Resistance Exercise Training in Older Adults on Body Composition, Muscle Strength, and Physical Performance Parameters: A Systematic Review. Rehabil. Process Outcome 2018, 7, 1179572718765760. [Google Scholar] [CrossRef]
- Borenstein, M.; Hedges, L.V.; Higgins, J.P.T.; Rothstein, H.R. Notes on subgroup analyses and Meta-regression. In Introduction to Meta-Analysis; Borenstein, M., Ed.; John Wiley & Sons: Hoboken, NJ, USA, 2009; pp. 205–212. [Google Scholar]
- Fu, R.; Gartlehner, G.; Grant, M.; Shamliyan, T.; Sedrakyan, A.; Wilt, T.J.; Griffith, L.; Oremus, M.; Raina, P.; Ismaila, A.; et al. Conducting quantitative synthesis when comparing medical interventions: AHRQ and the Effective Health Care Program. J. Clin. Epidemiol. 2011, 64, 1187–1197. [Google Scholar] [CrossRef]


| Study (Author, Year, Ref) | Groups 1 | Age (y) 2 | Sex (F/M) | N | Design | Patient Type | Body Composition Assessment Method | Exercise Intervention | Protein supplement | Measured Time Point | Outcome Results | ||
|---|---|---|---|---|---|---|---|---|---|---|---|---|---|
| Type, Compliance (%, EG/CG) | Frequency × Duration | Type, Compliance (%, EG/CG) 10 | Intake Amount (g/d or g/session) | ||||||||||
| Bjorkman, 2011 [37] | EG: MSE + PS | 69.9 ± 7.4 | 20/3 | 23 | RCT, DB | Sarcopenia | DXA | RET | 2 d/wk × 8 wk | WP, | 14.0 g/d | Baseline | ↑ ALM/FM ratio 6,7 |
| CG: MSE | 69.1 ± 6.9 | 22/2 | 24 | Crossover | (PMR) | NA/NA | (16 sessions) | 85.9/89.3 | Posttest: 8 wk | ↑ CRT 6,7; ↑ HG 6,7 | |||
| Bonnefoy, 2012 [38] | EG: MSE + PS | 86.3 ± 14.1 4 | 49/4 | 53 | RCT | Pre-frail elder | NA | MET | 7 d/wk × 16 wk | Milk, soy, BCAA | 20.0 g/d | Baseline | FFM 8; PASE 8; ADL 8; GS 8 |
| CG: Control 3 | 86.0 ± 14.8 4 | 39/10 | 49 | adults | 44/NA | (116 sessions) | 44/NA | Posttest: 16 wk | ↓ IADL 5,7; TUG 8 | ||||
| Bonnefoy, 2003 [39] | EG: MSE + PS | 83.5 ± 1.2 9 | 50/7 9 | 57 9 | RCT, SB | Frail elder | DLW | MET | 3 d/wk × 36 wk | Proteins | 30.0 g/d | Baseline | FFM 8; GS 8; SC 8 |
| CG 1: MSE + PLA-S | individuals | method | 63–70 9 | (108 sessions) | 61/54 | Midtest: 12 wk | ↑ Leg strength 7 | ||||||
| CG 2: CT + PS | Posttest: 36 wk | ||||||||||||
| CG 3: CT + PLA-S | |||||||||||||
| Carlsson, 2011 [40] | EG: MSE + PS | 84.4 ± 6.3 | 33/9 | 42 | RCT, DB | Frail | BIA | MET | 2–3 d/wk × 13 wk | Milk protein | 7.4 g/session | Baseline | ICW 8; BBS 8 |
| CG 1: MSE + PLA-S | 85.3 ± 5.5 | 28/13 | 41 | elderly | 79/72 | (29 sessions) | 84/79 | Midtest: 12 wk | |||||
| CG 2: PS | 82.7 ± 6.4 | 34/13 | 47 | Posttest: 24 wk | |||||||||
| CG 3: PLA-S | 85.4 ± 7.2 | 36/11 | 47 | ||||||||||
| Dirks, 2017 [41] | EG: MSE + PS | 76.0 ± 8.2 | 11/6 | 17 | RCT, DB | Frail elderly | DXA | RET | 2 d/wk × 24 wk | Milk protein | 30.0 g/d | Baseline | ↑ LBM 6,7; ↑ ALM 6,7 |
| CG: MSE + PLA-S | 77.0 ± 8.2 | 11/6 | 17 | 84 9 | (48 sessions) | NR | Midtest: 12 wk | ↓ CRT 5,6; ↑ SPPB 5,6,8 | |||||
| Posttest: 24 wk | ↑ LP 1-RM 5,6 | ||||||||||||
| Englund, 2017 [42] | EG: MSE + PS | 78.1 ± 5.8 | 34/40 | 74 | RCT, DB | Mobility- | DXA | MET | 3 d/wk × 24 wk | Whey proteins | 20.0 g/session | Baseline | ↑ LBM 5,6; ↑ ALM 5,6 |
| CG: MSE + PLA-S | 76.9 ± 4.9 | 35/40 | 75 | limited elderly | >70 | (72 sessions) | >85 | Posttest: 24 wk | ↑ Leg strength 5,6 | ||||
| Fiatarone, 1994 [43] | EG: MSE + PS | 87.2 ± 6.0 | 16/9 | 25 | RCT, DB | Nursing- | WBP | RET | 3 d/wk × 10 wk | Soy protein | 40.8 g/d | Baseline | WBP 8; ↑ GS 6,7; ↑ SC 6,7 |
| CG 1: MSE + PLA-S | 86.2 ± 5.0 | 16/9 | 25 | home residents | method | 97/100 | (30 sessions) | 99/100 | Posttest: 10 wk | ↑ LP 1-RM 6,7 | |||
| CG 2: PS | 85.7 ± 5.8 | 17/7 | 24 | ||||||||||
| CG 3: PLA-S | 89.2 ± 4.1 | 14/12 | 26 | ||||||||||
| Fielding, 2017 [44] | EG: MSE + PS | 78.1 ± 5.8 | 34/40 | 74 | RCT, DB | Mobility- | DXA | MET | 3 d/wk × 24 wk | Whey proteins | 20.0 g/session | Baseline | ALM |
| CG: MSE + PLA-S | 76.9 ± 4.9 | 35/40 | 75 | limited elderly | 75/72 | (72 sessions) | 88/86 | Posttest: 24 wk | ↑ GS 5,6,8; ↑ SPPB 5,6,8 | ||||
| Hegerova, 2015 [45] | EG: MSE + PS | 83.6 ± 3.8 | NR | 100 | RCT | Hospitalized | BIA | MET | 6 d/wk × 3 wk | Protein | 20.0 g/d | Baseline | SMM 8; HG 8 |
| CG: Control 3 | 83.2 ± 3.8 | 100 | elderly adults | NR | (18 sessions) | 83/71.3 | Posttest: 3, 6, 12 mo | ↓ Barthel index 5,6,7 | |||||
| Imaoka, 2016 [46] | EG: MSE + PS | 87.6 ± 6.5 | 18/5 | 23 | RCT | Institutionalized | BIA | MET | 2 d/wk × 12 wk | Proteins | 4.1 g/d | Baseline | SMI 8; FIM 8 |
| CG 1: MSE | 82.6 ± 9.1 | 16/6 | 22 | frail elderly | NR | (24 sessions) | NR | Posttest: 12 w | ↓ Incidence of falls 7 | ||||
| CG 2: PS | 84.6 ± 7.7 | 20/3 | 23 | Follow up: 26 wk | |||||||||
| CG 3: Control 3 | 82.5 ± 10.9 | 15/8 | 23 | ||||||||||
| Kim, 2016 [31] | EG: MSE + PS | 80.9 ± 2.9 | 36/0 | 36 | RCT | Sarcopenic | BIA | MET | 2 d/wk × 12 wk | Leucine, EAA | 3.0 g/d | Baseline | ↑ LLM 7; ↑ GS 7; ↑ HG 7 |
| CG 1: MSE | 81.4 ± 4.3 | 35/0 | 35 | elderly | NR | (24 sessions) | NR | Posttest: 12 wk | ↑ Leg strength 7 | ||||
| CG 2: PS | 81.2 ± 4.9 | 34/0 | 34 | women | |||||||||
| CG 3: Control 3 | 81.1 ± 5.1 | 34/0 | 34 | ||||||||||
| Kim, 2012 [47] | EG: MSE + PS | 79.5 ± 2.9 | 38/0 | 38 | RCT, DB | Sarcopenic | BIA | MET | 2 d/w × 12 w | Leucine, EAA | 6.0 g/d | Baseline | ↑ LBM 6; ↑ ALM 6 |
| CG 1: MSE | 79.0 ± 2.9 | 39/0 | 39 | elderly | 70.3/71.8–80.5 | (24 sessions) | NR | Posttest: 12 wk | ↑ LLM 6,7; ↑ GS 6,7 | ||||
| CG 2: PS | 79.2 ± 2.8 | 39/0 | 39 | women | ↑ Leg strength 6,7 | ||||||||
| CG 3: Control 3 | 78.7 ± 2.8 | 39/0 | 39 | ||||||||||
| Maltais, 2016 [48] | EG 1: MSE + Milk PS | 68.0 ± 5.6 | 0/8 | 8 | RCT, DB | Sarcopenic | DXA | RET | 3 d/w × 16 w | Milk protein, | 19–20.5 g/d | Baseline | ↑ LBM 5,6,7; ↓ TUG 6,7 |
| EG 2: MSE + EAA PS | 64.0 ± 4.8 | 0/8 | 8 | elderly men | >90 9 | (48 sessions) | EAA | (3.5 g leucine) | Posttest: 16 wk | ||||
| CG: MSE + PLA-S | 64.0 ± 4.9 | 0/10 | 10 | >90 9 | |||||||||
| Molnar, 2016 [49] | EG: MSE + PS | 66.6 ± 1.6 | 10/7 | 17 | RCT | Institutionalized | BIA | MET | 2 d/w × 12 w | WP, Leucine | 33.0 g/d | Baseline | ↑ LBM 7 |
| CG: MSE | 66.4 ± 1.8 | 12/5 | 17 | elderly | NR | (24 sessions) | NR | Posttest: 12 wk | ↑ Leg strength 7 | ||||
| Rondanelli, 2016 [50] | EG: MSE + PS | 80.8 ± 6.3 | 40/29 | 69 | RCT, DB | Sarcopenic | DXA | MET | 5 d/wk × 12 wk | WP | 22.0 g/d | Baseline | ↑ LBM 6,7; ↑ ADL 5,6,7 |
| CG: MSE + PLA-S | 80.2 ± 8.5 | 37/24 | 61 | elderly | NR | (60 sessions) | 100 9 | Posttest: 12 wk | ↑ HG 6,7; ↑ SF-36 PF 7 | ||||
| Tieland, 2012 [51] | EG: MSE + PS | 78.0 ± 9.0 | 20/11 | 31 | RCT, DB | Frail | DXA | RET | 2 d/wk × 24 wk | Milk protein | 30.0 g/d | Baseline | ↑ LBM 6,7; ↑ ALM 6,7 |
| CG: MSE + PLA-S | 79.0 ± 6.0 | 21/10 | 31 | elderly | ≥98 9 | (48 sessions) | ≥98 9 | Midtest: 12 wk | ↑ LP 1-RM 5,6; ↓ CRT 5,6 | ||||
| Yamada, 2019 [52] | EG: MSE + PS | 84.9 ± 5.6 | 20/8 | 28 | RCT, SB | Sarcopenic | DXA | RET | 2 d/wk × 12 wk | WP | 10.0 g/d | Baseline | ↑ ALM 6,7; ↑ GS 6,7 |
| CG 1: MSE | 84.7 ± 5.1 | 18/10 | 28 | elderly | 88.1/81 | (24 sessions) | 97.6/98.8–100 | Posttest: 12 wk | ↑ Leg power 5,6,7 | ||||
| CG 2: PS | 83.2 ± 5.7 | 20/8 | 28 | ↓ CRT 5,6; ↑ HG 6,7; SLS 8 | |||||||||
| CG 3: Control3 | 83.9 ± 5.7 | 15/13 | 28 | ||||||||||
| Yamada, 2015 [53] 11 | EG: MSE + PS | 78.1 ± 5.7 | 19/12 | 31 | RCT | Frail | BIA | Weighted | 7 d/wk × 24 wk | Protein (BCAA) | 10.0 g/d | Baseline | ↑ SMI 7 |
| CG 1: MSE | 75.7 ± 5.8 | 8/7 | 15 | elderly | walking | 80 (67–92) | Posttest: 24 wk | ||||||
| CG 2: Control 3 | 76.4 ± 6.2 | 15/10 | 25 | NR | |||||||||
| Zdzieblik, 2015 [54] | EG: MSE + PS | 72.3 ± 3.7 | 0/26 | 26 | RCT, DB | Sarcopenic | DXA | RET | 3 d/wk × 12 wk | EAA | 15.0 g/d | Baseline | ↑ FFM 6,7,8 |
| CG: MSE + PLA-S | 72.1 ± 5.5 | 0/27 | 27 | Elderly men | 86.7/90 | (36 sessions) | NR | Posttest: 12 wk | |||||
| Study Author (year) (Reference Number) | Overall b | Eligibility Criteria c | 1 | 2 | 3 | 4 | 5 | 6 | 7 | 8 | 9 | 10 |
|---|---|---|---|---|---|---|---|---|---|---|---|---|
| Bjorkman 2011 [37] | 8/10 | X | X | X | X | X | X | X | X | X | ||
| Bonnefoy 2012 [38] | 7/10 | X | X | X | X | X | X | X | X | |||
| Bonnefoy 2003 [39] | 7/10 | X | X | X | X | X | X | X | X | |||
| Carlsson 2011 [40] | 9/10 | X | X | X | X | X | X | X | X | X | X | |
| Dirks 2017 [41] | 7/10 | X | X | X | X | X | X | X | X | |||
| Englund 2017 [42] | 6/10 | X | X | X | X | X | X | X | ||||
| Fiatarone 1994 [43] | 8/10 | X | X | X | X | X | X | X | X | X | ||
| Fielding 2017 [44] | 6/10 | X | X | X | X | X | X | X | ||||
| Hegerova 2015 [45] | 7/10 | X | X | X | X | X | X | X | X | |||
| Imaoka 2016 [46] | 6/10 | X | X | X | X | X | X | X | ||||
| Kim 2016 [31] | 5/10 | X | X | X | X | X | X | |||||
| Kim 2012 [47] | 7/10 | X | X | X | X | X | X | X | X | |||
| Maltais 2016 [48] | 8/10 | X | X | X | X | X | X | X | X | X | ||
| Molnar 2016 [49] | 6/10 | X | X | X | X | X | X | X | ||||
| Rondanelli 2016 [50] | 9/10 | X | X | X | X | X | X | X | X | X | X | |
| Tieland 2012 [51] | 7/10 | X | X | X | X | X | X | X | X | |||
| Yamada 2019 [52] | 6/10 | X | X | X | X | X | X | X | ||||
| Yamada 2015 [53] | 6/10 | X | X | X | X | X | X | X | ||||
| Zdzieblik 2015 [54] | 8/10 | X | X | X | X | X | X | X | X | X | ||
| Summary # | 19 | 19 | 4 | 19 | 9 | 4 | 10 | 17 | 12 | 19 | 19 |
| Subgroups | Lean Body Mass | Appendicular Skeletal Muscle Mass | ||||||||
|---|---|---|---|---|---|---|---|---|---|---|
| Comparison, n | SMD | (95%CI) | p-value | I2 (%) | Comparison, n | SMD | (95%CI) | p-value | I2 (%) | |
| Overall | 29 | 0.66 | (0.41, 0.91) ‡ | <0.00001 | 79 | 19 | 0.35 | (0.20, 0.50) ‡ | <0.00001 | 59 |
| MQ level | ||||||||||
| PEDro score ≥7/10 | 19 | 0.52 | (0.29, 0.75) ‡ | <0.00001 | 64 | 9 | 0.63 | (0.31, 0.95) ‡ | 0.0001 | 56 |
| PEDro score <7/10 | 10 | 1.09 | (0.41, 1.76) ‡ | <0.00001 | 83 | 10 | 0.06 | (−0.17, 0.29) † | n.s. | 39 |
| Subgroup difference | n.s. | 58.8 | 0.03 | 79.2 | ||||||
| Participant type | ||||||||||
| Community-dwelled | 21 | 0.44 | (0.24, 0.64) ‡ | <0.0001 | 57 | 19 | 0.35 | (0.20, 0.50) ‡ | <0.00001 | 59 |
| Institutionalized resident | 8 | 1.34 | (0.67, 2.01) ‡ | <0.0001 | 84 | 0 | ||||
| Subgroup difference | 0.01 | 84.4 | NA | NA | ||||||
| Participant condition | ||||||||||
| Sarcopenia | 11 | 0.44 | (0.27, 0.62) † | <0.00001 | 17 | 13 | 0.49 | (0.14, 0.85) ‡ | 0.007 | 66 |
| Frailty | 17 | 0.90 | (0.52, 1.27) ‡ | <0.00001 | 82 | 2 | 0.75 | (0.32, 1.18) † | 0.0006 | 0 |
| Other conditions | 1 | −0.20 | (−0.56, 0.16) | n.s. | NA | 4 | 0.03 | (−0.26, 0.33) † | n.s. | 0 |
| Subgroup difference | 0.0002 | 88.4 | 0.02 | 76.0 | ||||||
| Gender | ||||||||||
| Men | 3 | 0.57 | (0.12, 1.03) † | 0.01 | 0 | 2 a | −0.03 | (−0.82, 0.76) † | n.s. | 0 |
| Women | 8 | 0.34 | (0.12, 0.56) † | 0.002 | 22 | 7 | 0.41 | (−0.09 0.91) ‡ | n.s. | 77 |
| Mixed | 18 | 0.82 | (0.46, 1.19) ‡ | <0.0001 | 85 | 10 | 0.45 | (0.13, 0.78) ‡ | 0.006 | 49 |
| Subgroup difference | n.s. | 53.6 | n.s. | 0 | ||||||
| Control group type | ||||||||||
| PLA-S or non-exercise | 10 | 0.89 | (0.42, 1.36) ‡ | 0.0002 | 90 | 5 | 0.80 | (0.04, 1.56) ‡ | 0.04 | 89 |
| Exercise | 14 | 0.53 | (0.21, 0.86) ‡ | 0.001 | 77 | 10 | 0.25 | (−0.02, 0.52) ‡ | n.s. | 50 |
| PS | 5 | 0.65 | (0.03, 1.27) ‡ | 0.04 | 85 | 4 | 0.53 | (−0.16, 1.22) ‡ | n.s. | 55 |
| Subgroup difference | n.s. | 0 | n.s. | 5.4 | ||||||
| Exercise type | ||||||||||
| RET | 11 | 0.57 | (0.25, 0.88) ‡ | 0.0005 | 54 | 12 | 0.37 | (0.13, 0.62) † | 0.002 | 42 |
| MET | 18 | 0.73 | (0.38, 1.07) ‡ | <0.0001 | 85 | 7 | 0.40 | (0.01, 0.79) ‡ | 0.04 | 74 |
| Subgroup difference | n.s. | 0 | n.s. | 0 | ||||||
| PS dose (g/day) b | ||||||||||
| <20 | 10 | 1.06 | (0.43, 1.69) ‡ | 0.0009 | 87 | 7 | 0.24 | (−0.08, 0.55) † | n.s. | 50 |
| ≥20 | 13 | 0.57 | (0.24, 0.90) ‡ | 0.0008 | 78 | 6 | 0.37 | (0.16, 0.58) † | 0.0005 | 28 |
| Subgroup difference | n.s. | 46.1 | n.s. | 0 | ||||||
| Intervention duration (week) | ||||||||||
| <12 | 4 | 0.14 | (−0.18, 0.45) † | n.s. | 0 | 1 | 0.14 | (−0.30, 0.58) | n.s. | NA |
| 12–23 | 21 | 0.69 | (0.42, 0.96) ‡ | <0.00001 | 70 | 17 | 0.38 | (0.09, 0.68) ‡ | 0.01 | 58 |
| ≥24 | 9 | 0.44 | (0.05, 0.83) ‡ | 0.03 | 73 | 3 | 0.49 | (−0.02, 1.00) † | n.s. | 65 |
| Subgroup difference | 0.03 | 70.8 | n.s. | 0 | ||||||
| Subgroups | Leg Muscle Strength | Walk Capability | Chair Rise | ||||||||||||
|---|---|---|---|---|---|---|---|---|---|---|---|---|---|---|---|
| Comparison, n | SMD | (95%CI) | p-value | I2 (%) | Comparison, n | SMD | (95%CI) | p-value | I2 (%) | Comparison, n | SMD | (95%CI) | p-value | I2 (%) | |
| Overall | 23 | 0.65 | (0.39, 0.90) ‡ | <0.00001 | 62 | 23 | 0.33 | (0.14, 0.52) ‡ | 0.0006 | 39 | 13 | 0.17 | (−0.02, 0.37) † | n.s. | 0 |
| MQ level | |||||||||||||||
| PEDro score ≥ 7/10 | 12 | 0.79 | (0.42, 1.16) ‡ | <0.0001 | 66 | 13 | 0.24 | (0.07, 0.41) † | 0.006 | 41 | 7 | 0.10 | (−0.12, 0.32) † | n.s. | 9 |
| PEDro score < 7/10 | 11 | 0.31 | (0.09, 0.52) † | 0.005 | 40 | 10 | 0.25 | (0.03, 0.48) † | 0.02 | 43 | 6a | 0.47 | (0.04, 0.91) † | 0.03 | 0 |
| Subgroup difference | n.s. | 50.5 | n.s. | 0 | n.s. | 55.7 | |||||||||
| Participant type | |||||||||||||||
| Community-dwelled | 19 | 0.56 | (0.28, 0.85) ‡ | 0.0001 | 64 | 20 | 0.32 | (0.11, 0.53) ‡ | 0.002 | 44 | 13 | 0.17 | (−0.02, 0.37) † | n.s. | 0 |
| Institutionalized resident | 4 | 1.02 | (0.62, 1.42) † | <0.00001 | 0 | 3a | 0.46 | (0.00, 0.92) † | 0.05 | 0 | 0 | ||||
| Subgroup difference | 0.009 | 85.2 | n.s. | 0 | NA | NA | |||||||||
| Participant condition | |||||||||||||||
| Sarcopenia | 15 | 0.73 | (0.44, 1.03) ‡ | <0.00001 | 43 | 15 | 0.46 | (0.15, 0.77) ‡ | 0.003 | 51 | 9 | 0.12 | (−0.16, 0.40) † | n.s. | 0 |
| Frailty | 7 | 0.58 | (0.32, 0.84) † | <0.0001 | 51 | 7 | 0.27 | (0.05, 0.49) † | 0.02 | 0 | 4 | 0.23 | (−0.05, 0.50) † | n.s. | 24 |
| Other conditions | 1 | −0.21 | (−0.57, 0.15) ‡ | n.s. | 89 | 1 | 0.00 | (−0.34, 0.34) | n.s. | NA | 0 | ||||
| Subgroup difference | 0.0001 | 88.7 | n.s. | 49.3 | n.s. | 0 | |||||||||
| Gender | |||||||||||||||
| Men | 3 | 0.71 | (−0.25, 1.67) ‡ | n.s. | 68 | 2a | 1.15 | (0.27, 2.03) † | 0.01 | 0 | 2 a | 0.15 | (−0.65, 0.95) † | n.s. | 0 |
| Women | 7 | 0.79 | (0.39, 1.20) ‡ | 0.0001 | 59 | 8 | 0.24 | (0.03, 0.46) † | 0.02 | 45 | 2 | 0.03 | (−0.31, 0.37) † | n.s. | 74 |
| Mixed | 13 | 0.51 | (0.18, 0.83) ‡ | 0.002 | 54 | 13 | 0.21 | (0.03, 0.39) † | 0.02 | 36 | 9 | 0.25 | (−0.00, 0.51) † | n.s. | 0 |
| Subgroup difference | n.s. | 0 | n.s. | 41.7 | n.s. | 0 | |||||||||
| Control group type | |||||||||||||||
| PLA-S or non-exercise | 6 | 1.12 | (0.67, 1.57) ‡ | <0.00001 | 67 | 5 | 0.50 | (0.29, 0.72) † | <0.00001 | 56 | 4 | 0.52 | (0.21, 0.83) † | 0.001 | 0 |
| Exercise | 12 | 0.43 | (0.14, 0.73) ‡ | 0.004 | 63 | 15 | 0.25 | (0.00, 0.50) ‡ | 0.05 | 48 | 7 | 0.00 | (−0.24, 0.24) † | n.s. | 0 |
| PS | 5 | 0.69 | (0.43, 0.96) ‡ | <0.00001 | 56 | 3 | 0.33 | (0.04, 0.61) † | 0.03 | 0 | 2a | 0.31 | (−0.22, 0.84) † | n.s. | 0 |
| Subgroup difference | <0.00001 | 92.5 | n.s. | 0 | 0.04 | 70.1 | |||||||||
| Exercise type | |||||||||||||||
| RET | 14 | 0.61 | (0.38, 0.83) † | <0.00001 | 41 | 14 | 0.44 | (0.11, 0.76) ‡ | 0.008 | 48 | 11 | 0.09 | (−0.14, 0.32) † | n.s. | 0 |
| MET | 9 | 0.68 | (0.25, 1.12) ‡ | 0.002 | 77 | 9 | 0.23 | (0.06, 0.41) † | 0.01 | 27 | 2 | 0.41 | (0.02, 0.79) † | 0.04 | 0 |
| Subgroup difference | n.s. | 0 | n.s. | 0 | n.s. | 48.5 | |||||||||
| PS dose (g/day) b | |||||||||||||||
| <20 | 7 | 0.86 | (0.51, 1.22) † | <0.00001 | 21 | 7 | 0.59 | (−0.05, 1.23) ‡ | n.s. | 66 | 7 | 0.12 | (−0.18, 0.41) † | n.s. | 13 |
| ≥20 | 10 | 0.48 | (0.12, 0.84) ‡ | 0.01 | 63 | 10 | 0.28 | (0.05, 0.50) † | 0.02 | 24 | 6 | 0.22 | (−0.05, 0.48) † | n.s. | 0 |
| Subgroup difference | n.s. | 26.6 | n.s. | 0 | n.s. | 0 | |||||||||
| Intervention duration (week) | |||||||||||||||
| <12 | 3a | 1.06 | (0.58, 1.54) † | <0.0001 | 0 | 4 | 0.10 | (−0.20, 0.41) † | n.s. | 44 | 1 | −0.20 | (−0.61, 0.21) | n.s. | NA |
| 12–23 | 19 | 0.60 | (0.32, 0.89) ‡ | <0.0001 | 59 | 19 | 0.26 | (0.11, 0.42) † | 0.0006 | 36 | 11 | 0.23 | (−0.01, 0.48) † | n.s. | 0 |
| ≥24 | 4 | −0.04 | (−0.28, 0.21) † | n.s. | 0 | 4 | −0.05 | (−0.29, 0.19) † | n.s. | 57 | 3 | −0.09 | (−0.71, 0.52) ‡ | n.s. | 69 |
| Subgroup difference | <0.0001 | 90.5 | n.s. | 2.7 | n.s. | 44 | |||||||||
© 2019 by the authors. Licensee MDPI, Basel, Switzerland. This article is an open access article distributed under the terms and conditions of the Creative Commons Attribution (CC BY) license (http://creativecommons.org/licenses/by/4.0/).
Share and Cite
Liao, C.-D.; Chen, H.-C.; Huang, S.-W.; Liou, T.-H. The Role of Muscle Mass Gain Following Protein Supplementation Plus Exercise Therapy in Older Adults with Sarcopenia and Frailty Risks: A Systematic Review and Meta-Regression Analysis of Randomized Trials. Nutrients 2019, 11, 1713. https://0-doi-org.brum.beds.ac.uk/10.3390/nu11081713
Liao C-D, Chen H-C, Huang S-W, Liou T-H. The Role of Muscle Mass Gain Following Protein Supplementation Plus Exercise Therapy in Older Adults with Sarcopenia and Frailty Risks: A Systematic Review and Meta-Regression Analysis of Randomized Trials. Nutrients. 2019; 11(8):1713. https://0-doi-org.brum.beds.ac.uk/10.3390/nu11081713
Chicago/Turabian StyleLiao, Chun-De, Hung-Chou Chen, Shih-Wei Huang, and Tsan-Hon Liou. 2019. "The Role of Muscle Mass Gain Following Protein Supplementation Plus Exercise Therapy in Older Adults with Sarcopenia and Frailty Risks: A Systematic Review and Meta-Regression Analysis of Randomized Trials" Nutrients 11, no. 8: 1713. https://0-doi-org.brum.beds.ac.uk/10.3390/nu11081713