Effects of Consuming Sugar-Sweetened Beverages for 2 Weeks on 24-h Circulating Leptin Profiles, Ad Libitum Food Intake and Body Weight in Young Adults

 ,
,  , , , and
Abstract
:1. Introduction
2. Materials and Methods
2.1. Participants
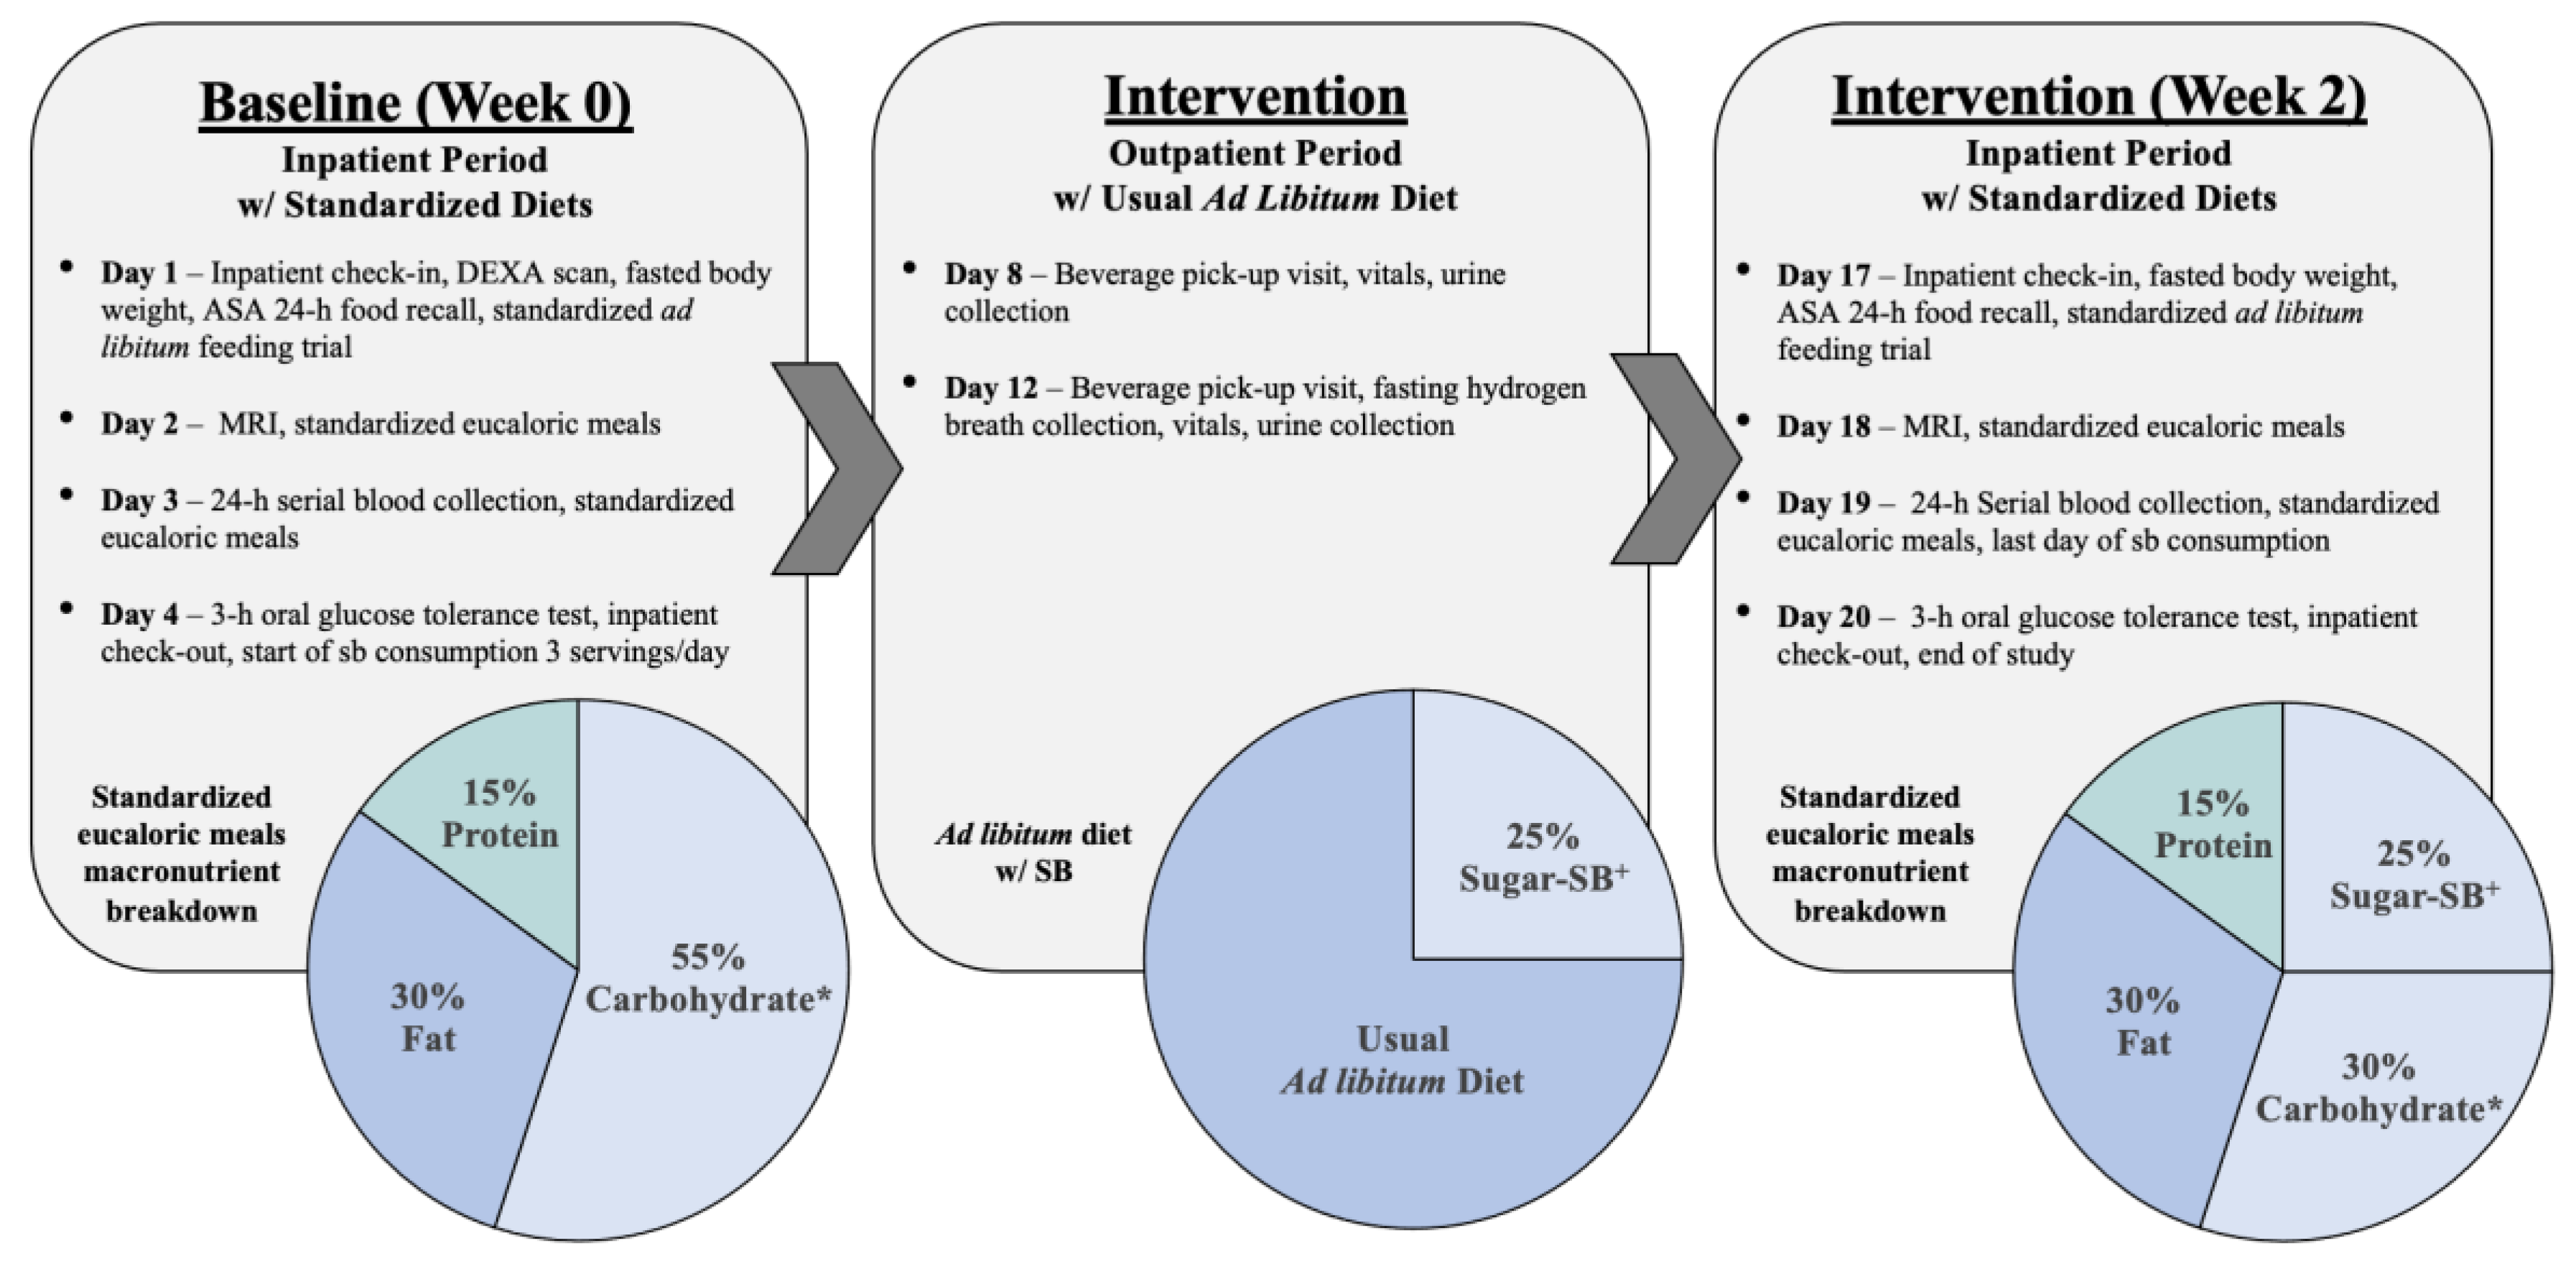
2.2. Study Protocol
2.2.1. Body Weight
2.2.2. Ad Libitum Food Intake Trials
2.2.3. 24-h Serial Blood Collections
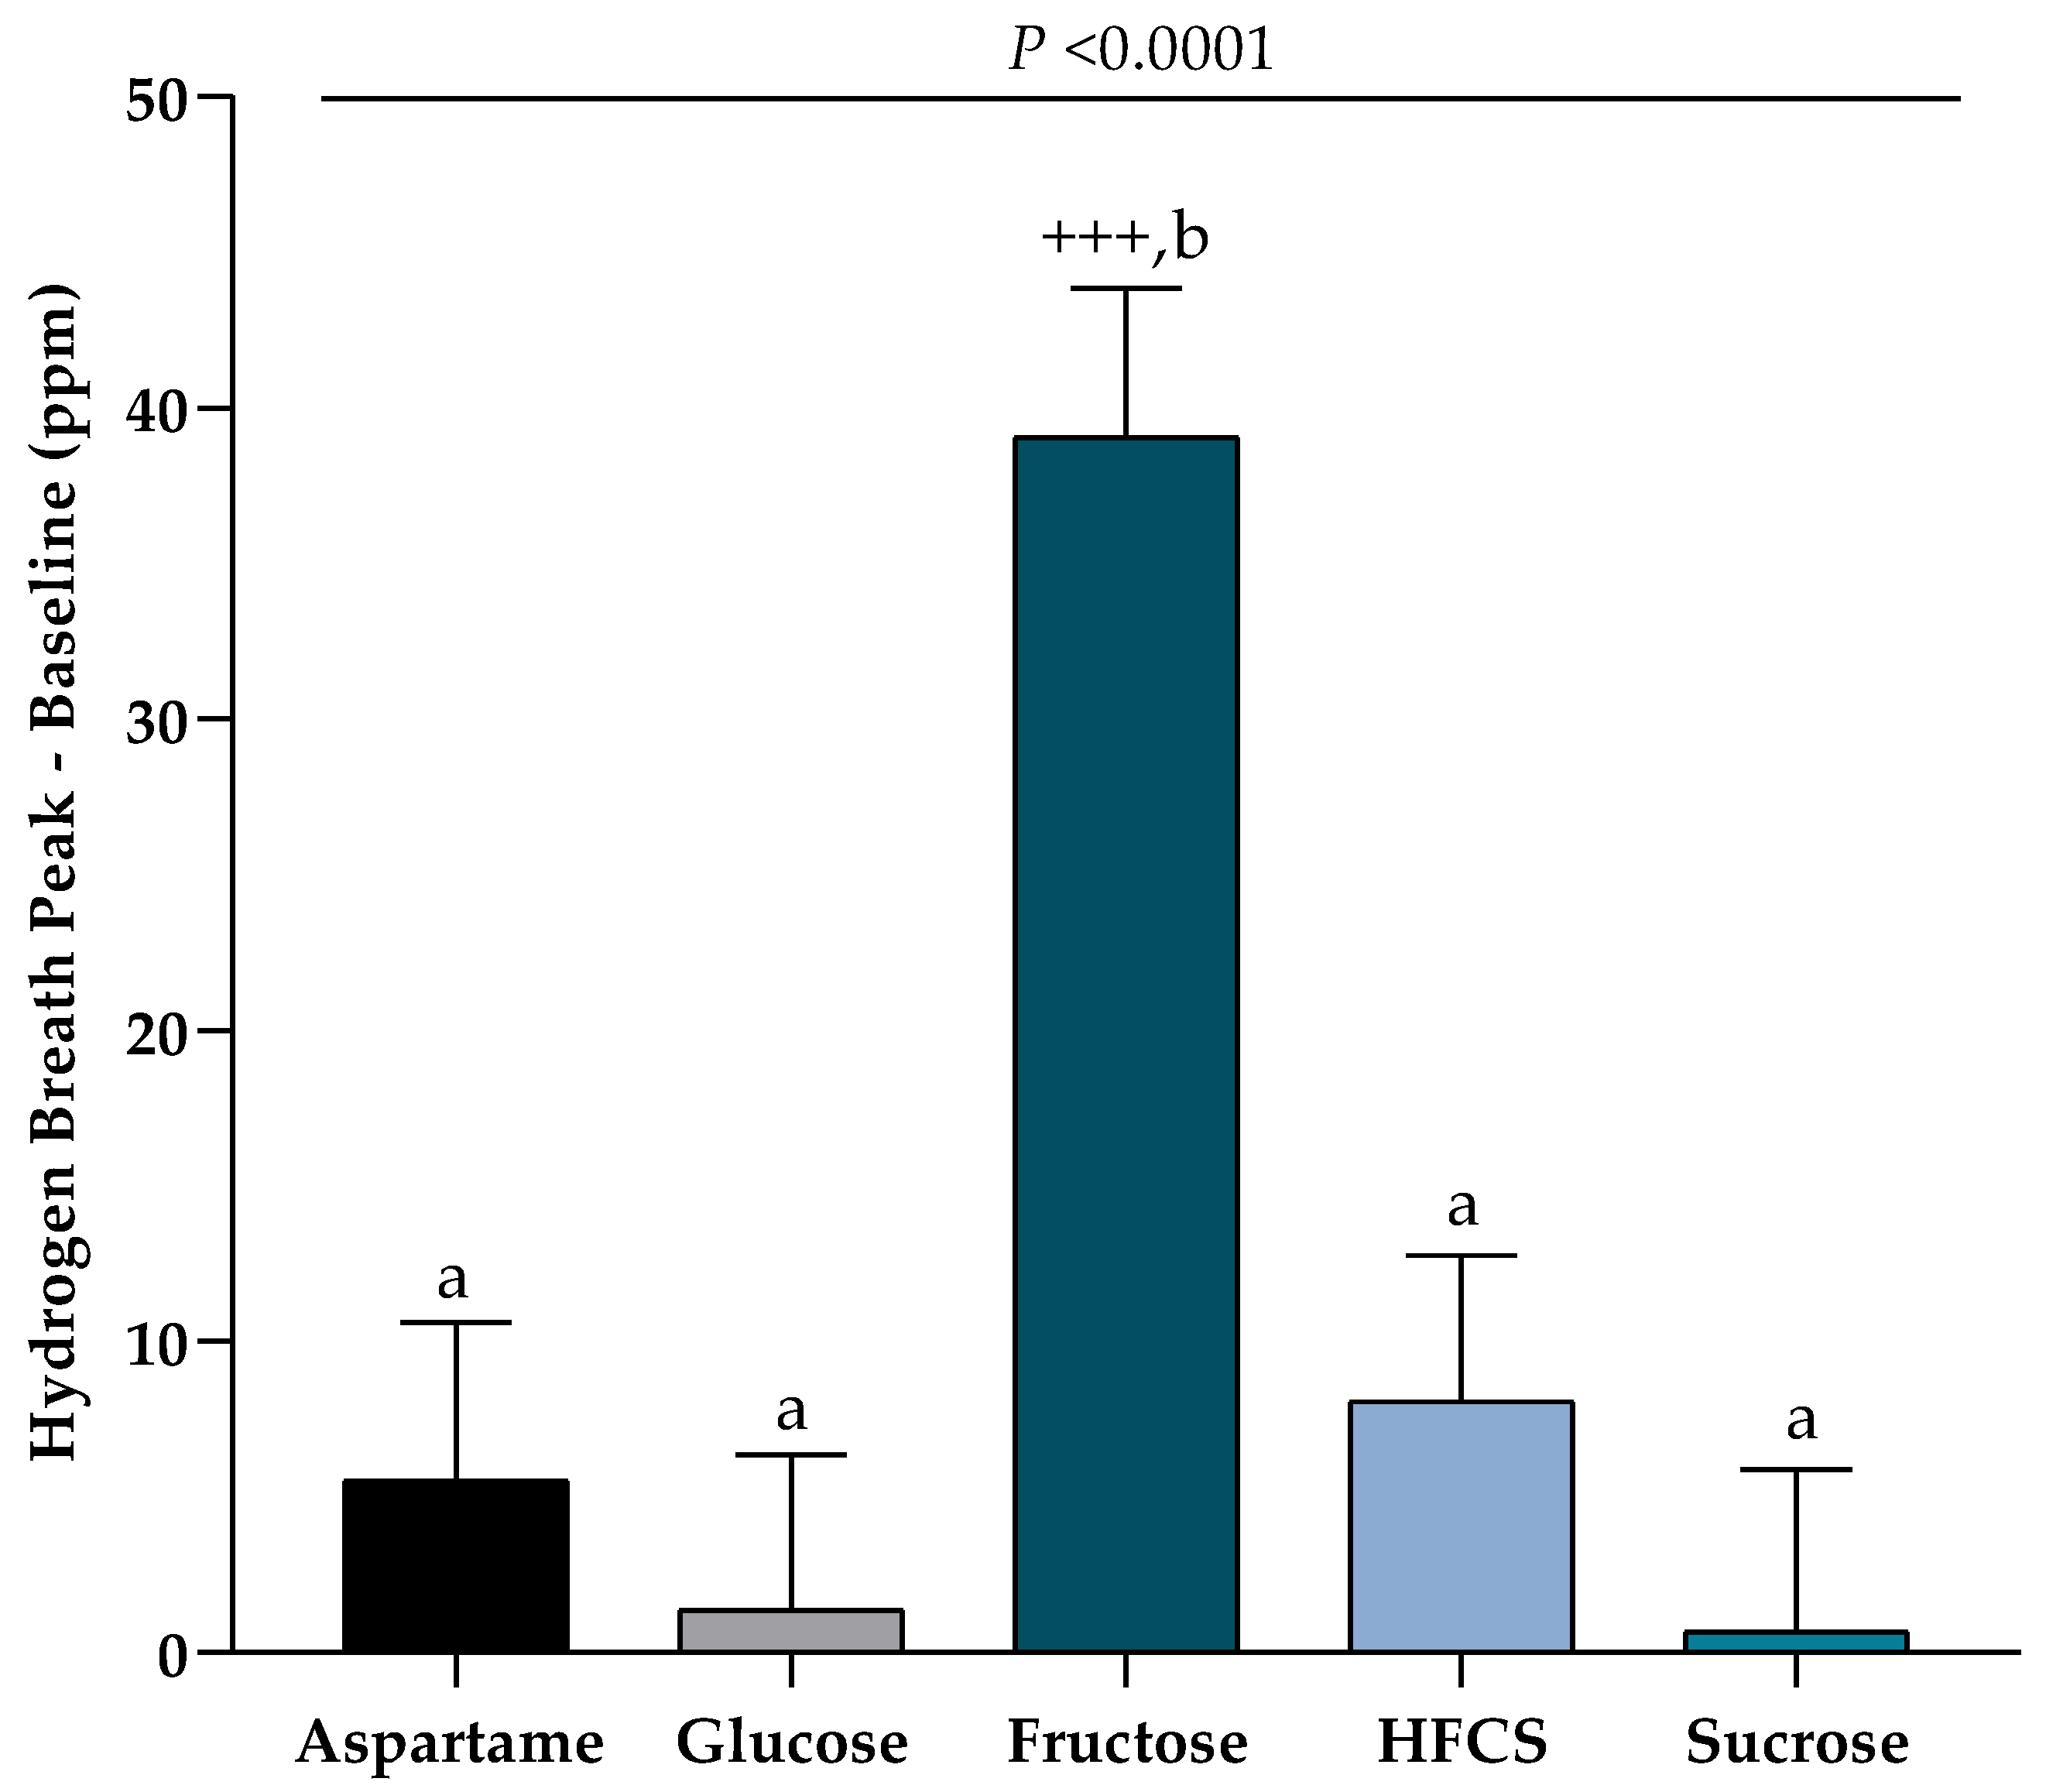
2.2.4. Hydrogen Breath Collections
2.2.5. 24-h Recall of Outpatient Dietary Intake
2.2.6. Physical Activity
2.3. Assays and Statistical Analysis
3. Results
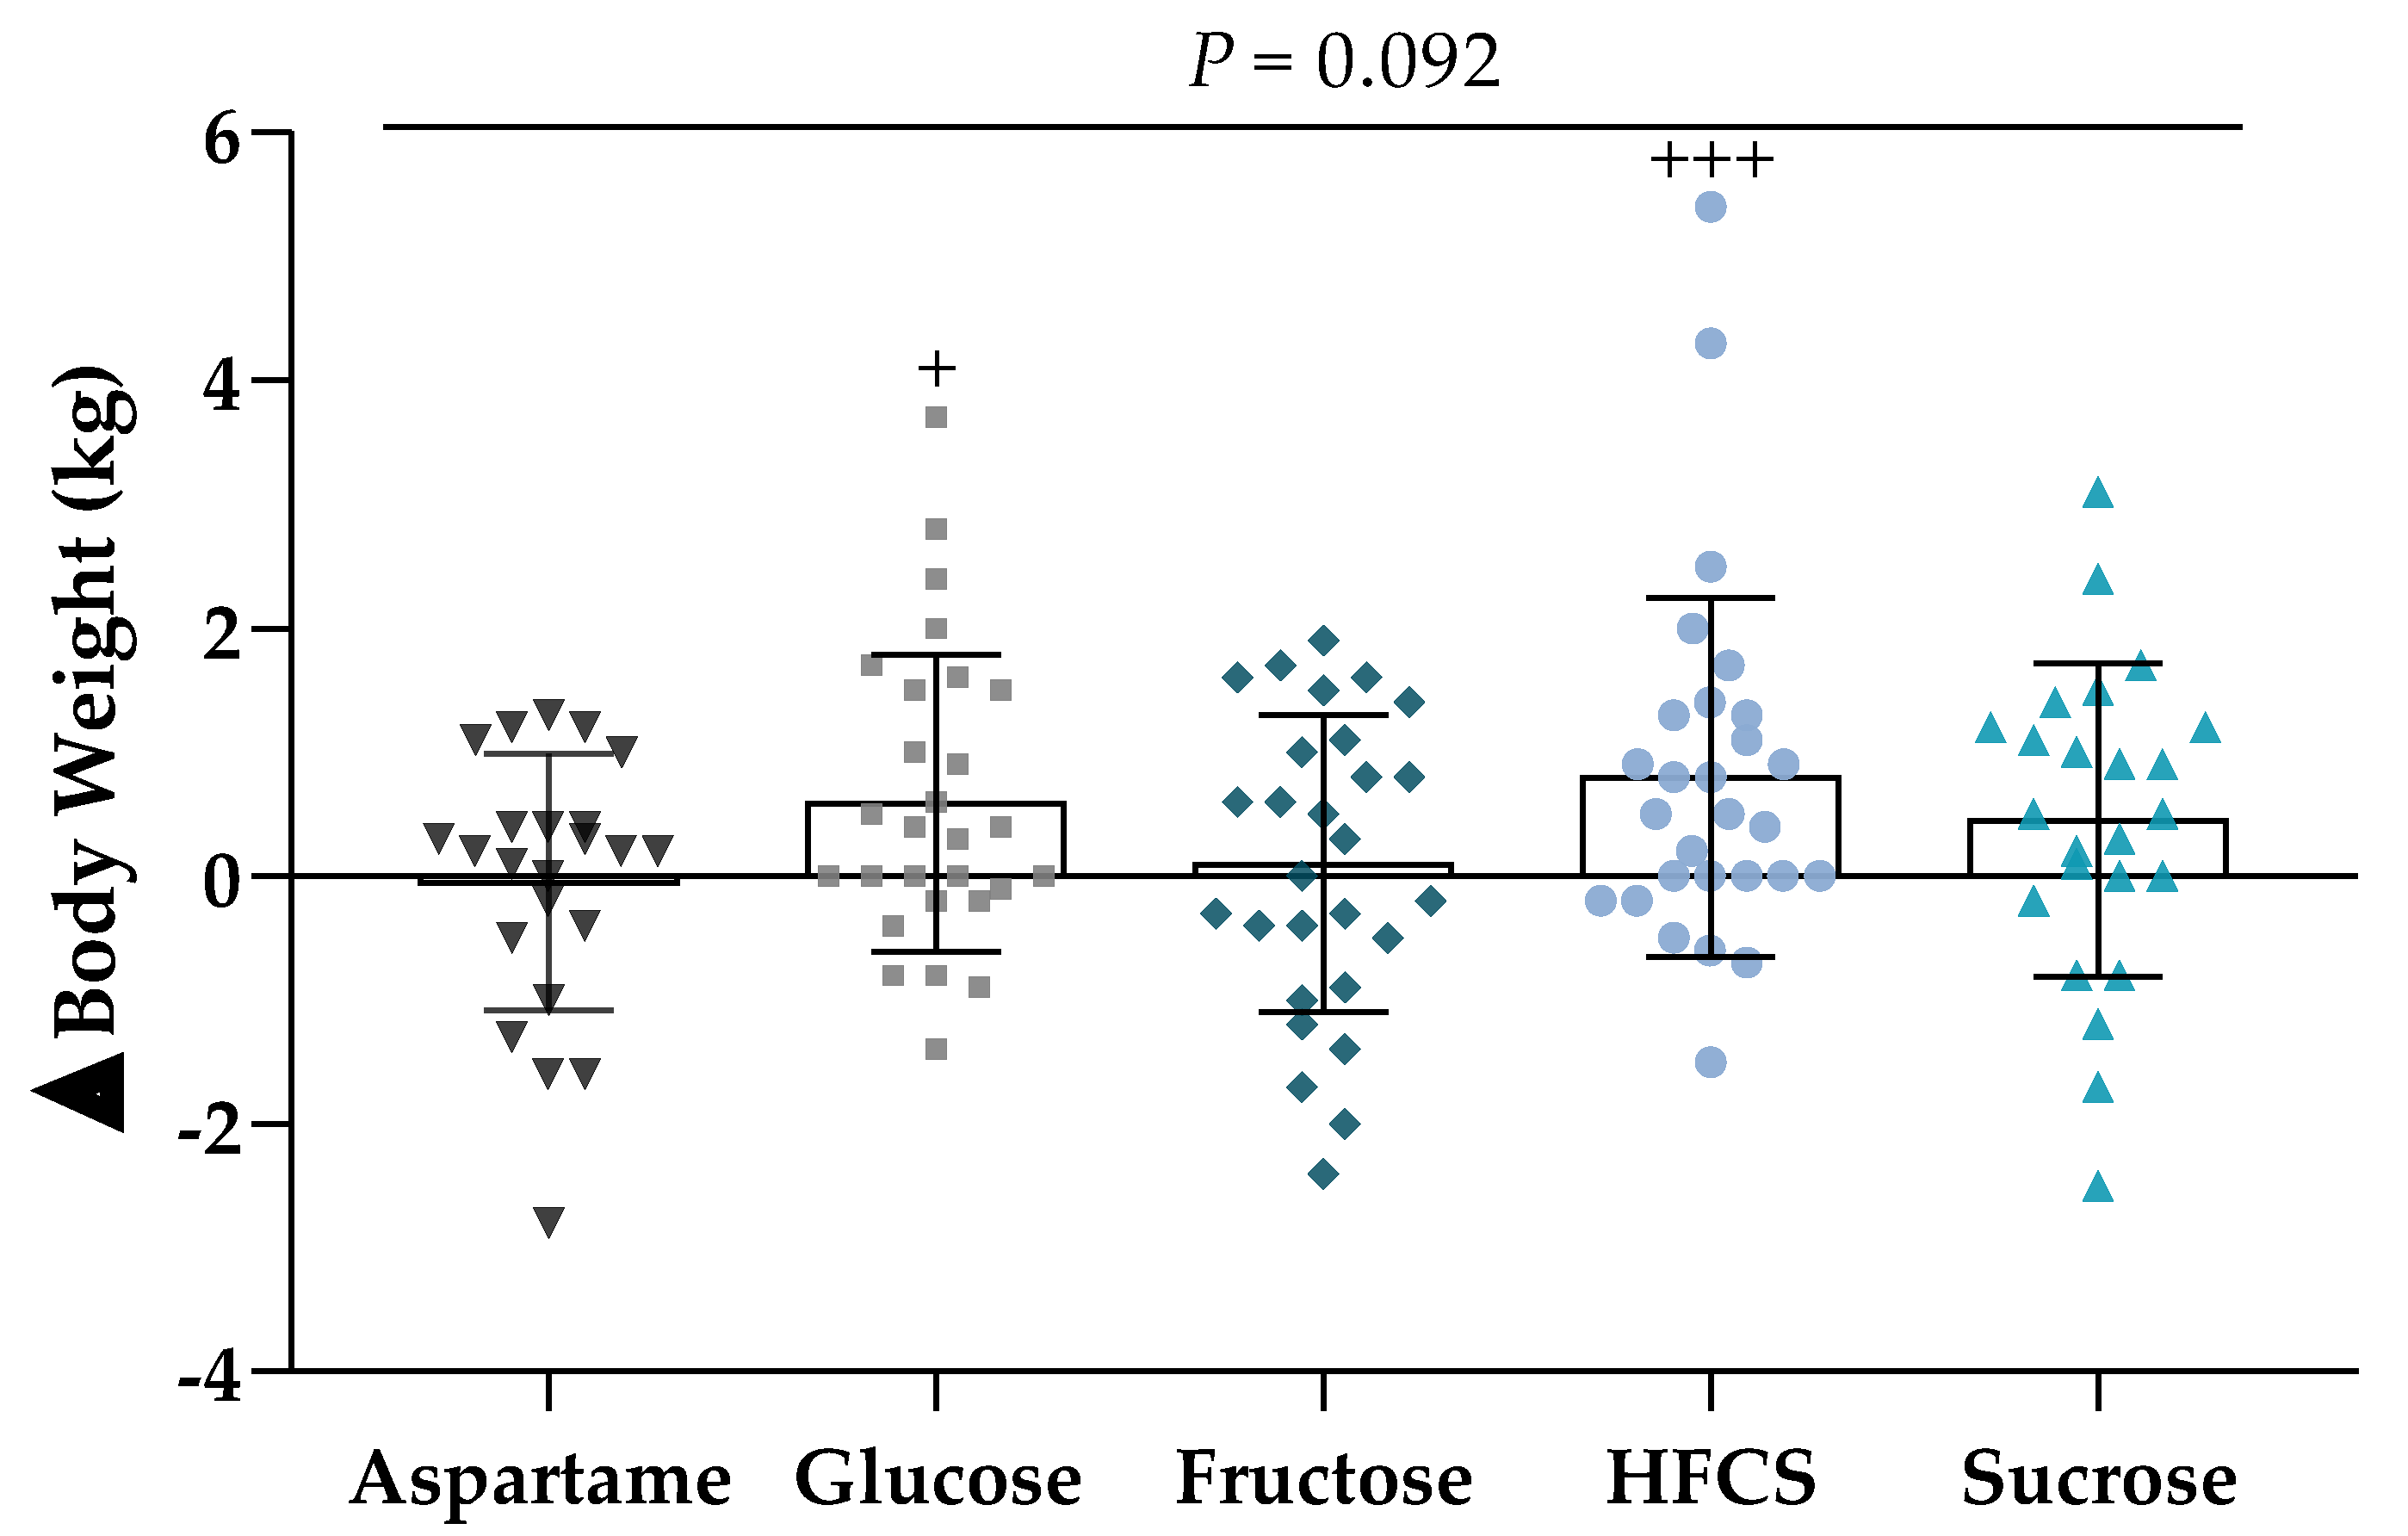
3.1. Body Weight
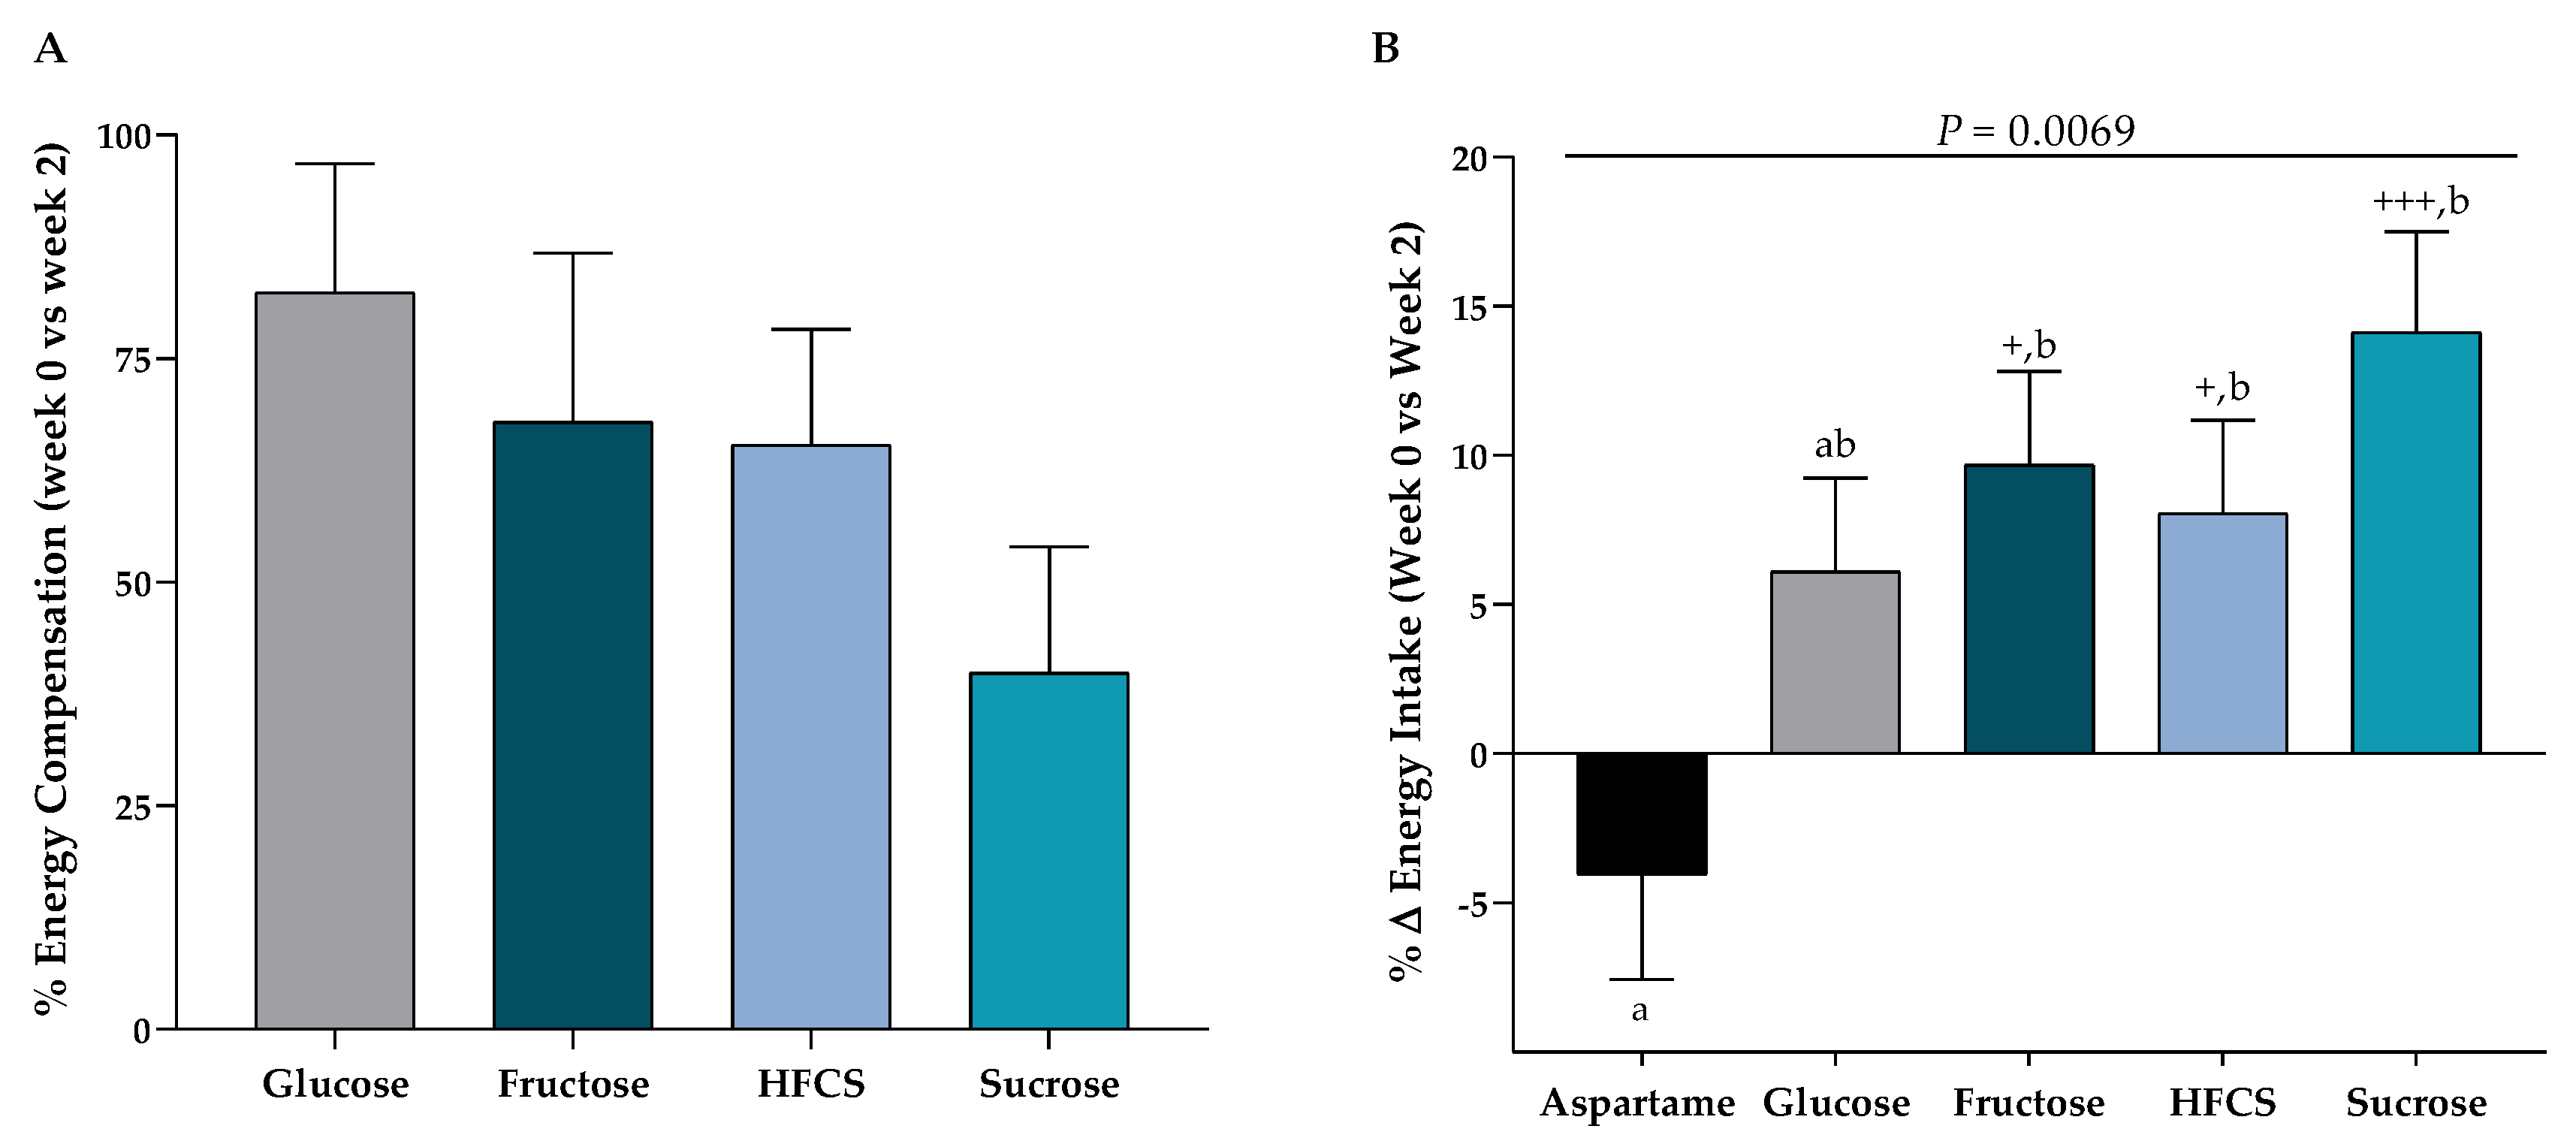
3.2. Ad Libitum Food Intake Trials
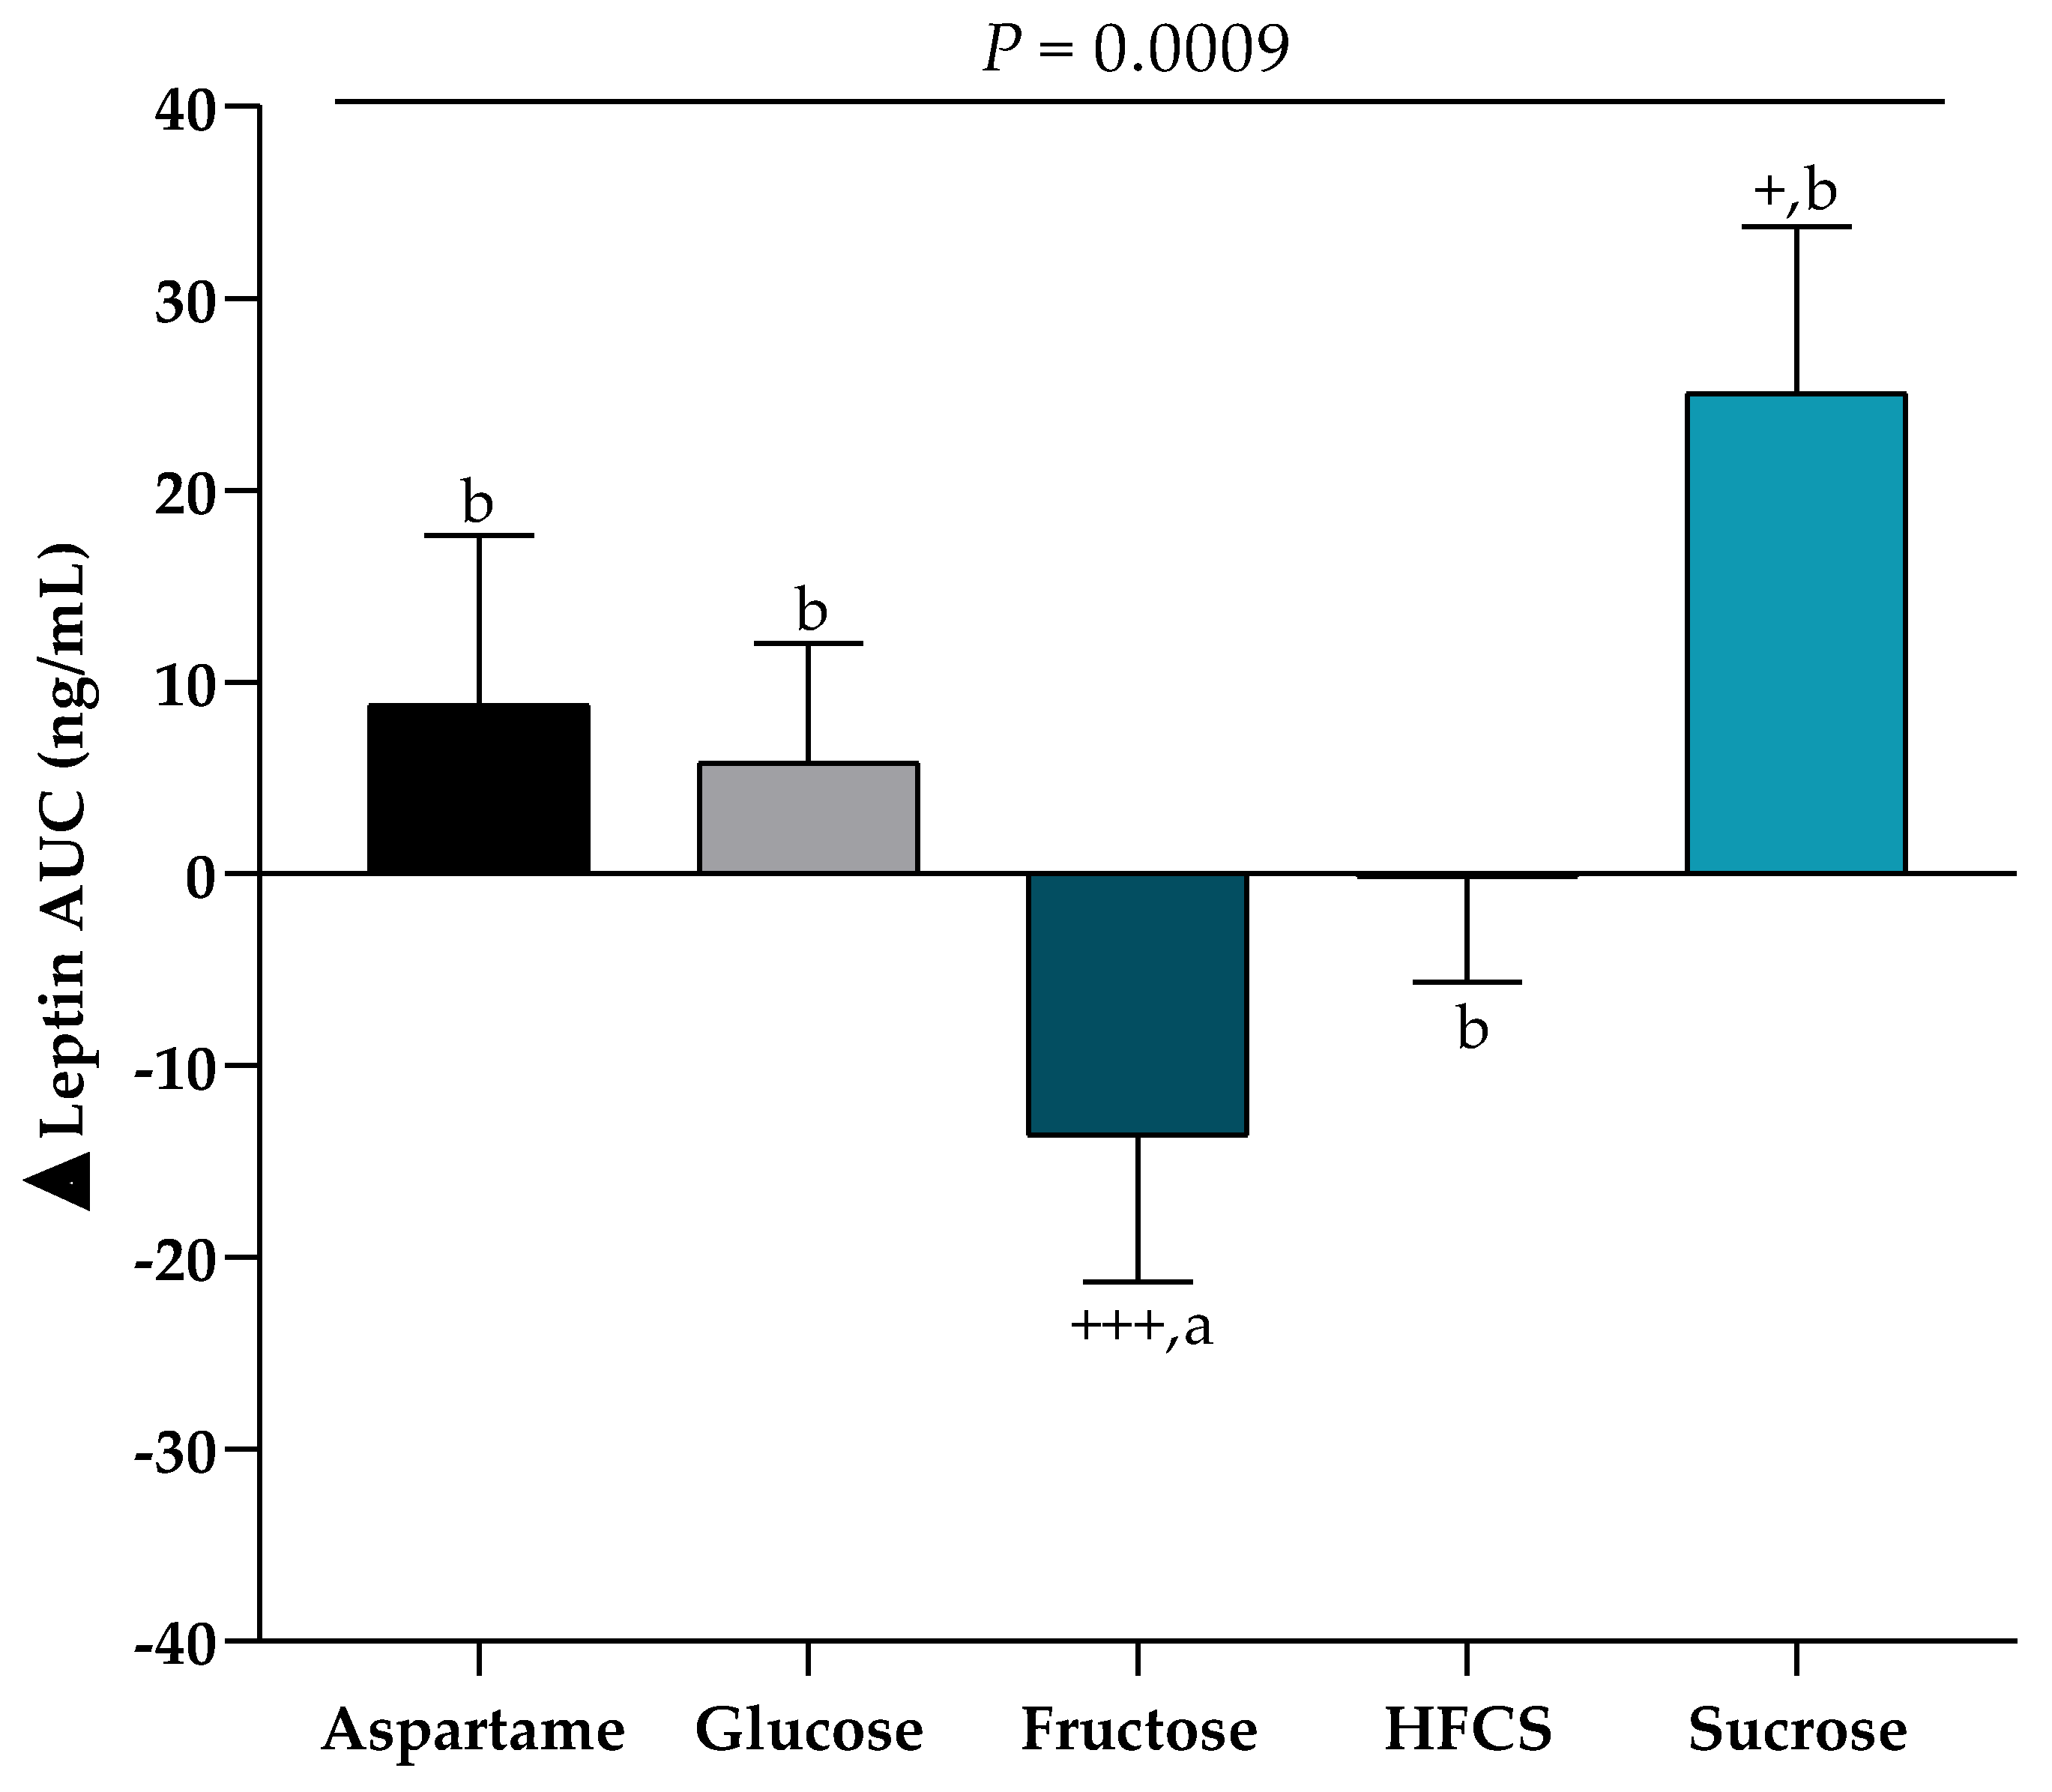
3.3. Leptin
3.4. Glucose and Insulin
3.5. Hydrogen Malabsorption
3.6. Outpatient 24-h Dietary Intake and Physical Activity
4. Discussion
Strengths and Limitations
5. Conclusions
Author Contributions
Funding
Acknowledgments
Conflicts of Interest
References
- Wang, Y.; Beydoun, M.A.; Liang, L.; Caballero, B.; Kumanyika, S.K. Will all Americans become overweight or obese? Estimating the progression and cost of the US obesity epidemic. Obesity 2008, 16, 2323–2330. [Google Scholar] [CrossRef] [PubMed]
- Malik, V.S.; Pan, A.; Willett, W.C.; Hu, F.B. Sugar-sweetened beverages and weight gain in children and adults. Am. J. Clin. Nutr. 2013, 98, 1084–1102. [Google Scholar] [CrossRef] [PubMed] [Green Version]
- Luger, M.; Lafontan, M.; Bes-Rastrollo, M.; Winzer, E.; Yumuk, V.; Farpour-Lambert, N. Sugar-Sweetened Beverages and Weight Gain in Children and Adults: A Systematic Review from 2013 to 2015 and a Comparison with Previous Studies. Obes. Facts 2018, 10, 674–693. [Google Scholar] [CrossRef] [PubMed]
- Rosinger, A.; Herrick, K.; Gahche, J.; Park, S. Sugar-Sweetened Beverage Consumption Among U.S. Youth, 2011-2014. NCHS Data Brief, No 271; National Center for Health Statistics: Hyattsville, MD, USA, 2017.
- Rosinger, A.; Herrick, K.; Gahche, J.; Park, S. Sugar-Sweetened Beverage Consumption Among U.S. Adults, 2011–2014. NCHS Data Brief, No 270; National Center for Health Sciences: Hyattsville, MD, USA, 2017.
- DiMeglio, D.P.; Mattes, R.D. Liquid Versus Solid Carbohydrate: Effects on Food Intake and Body Weight. Int. J. Obes. Relat. Metab. Disord. 2000, 24, 794–800. [Google Scholar] [CrossRef] [PubMed] [Green Version]
- Ludwig, D.S.; Peterson, K.E.; Gortmaker, S.L. Relation between consumption of sugar-sweetened drinks and childhood obesity: A prospective, observational analysis. Lancet 2001, 357, 505–508. [Google Scholar] [CrossRef]
- Murphy, G.K.; Bloom, R.S. Gut hormones and the regulation of energy homeostasis. Nature 2006, 444, 854–859. [Google Scholar] [CrossRef]
- Stanhope, K.L.; Havel, P.J. Endocrine and metabolic effects of consuming beverages sweetened with fructose, glucose, sucrose, or high-fructose corn syrup. Am. J. Clin. Nutr. 2008, 88, 1733S–1737S. [Google Scholar]
- Considine, R.V. Regulation of Leptin Production. Rev. Endocr. Metab. Disord. 2001, 2, 357–363. [Google Scholar] [CrossRef]
- Mueller, W.M.; Gregoire, F.M.; Stanhope, K.L.; Mobbs, C.V.; Mizuno, T.M.; Warden, C.H.; Stern, J.S.; Havel, P.J. Secretion from Cultured Rat Adipocytes. Endocr. Soc. 1998, 139, 551–558. [Google Scholar] [CrossRef]
- Havel, P.J. Control of energy homeostasis and insulin action by adipocyte hormones: Leptin, acylation stimulating protein, and adiponectin. Curr. Opin. Lipidol. 2002, 13, 51–59. [Google Scholar] [CrossRef]
- Park, H.K.; Ahima, R.S. Physiology of leptin: Energy homeostasis, neuroendocrine function and metabolism. Metabolism 2015, 64, 24–34. [Google Scholar] [CrossRef] [PubMed] [Green Version]
- Weigle, D.S.; Cummings, D.E.; Newby, P.D.; Breen, P.A.; Frayo, R.S.; Matthys, C.C.; Callahan, H.S.; Purnell, J.Q. Roles of leptin and ghrelin in the loss of body weight caused by a low fat, high carbohydrate diet. J. Clin. Endocrinol. Metab. 2003, 88, 1577–1586. [Google Scholar] [CrossRef] [PubMed]
- Teff, K.L.; Elliott, S.S.; Tschöp, M.; Kieffer, T.J.; Rader, D.; Heiman, M.; Townsend, R.R.; Keim, N.L.; D’Alessio, D.; Havel, P.J. Dietary fructose reduces circulating insulin and leptin, attenuates postprandial suppression of ghrelin, and increases triglycerides in women. J. Clin. Endocrinol. Metab. 2004, 89, 2963–2972. [Google Scholar] [CrossRef] [PubMed]
- Teff, K.L.; Grudziak, J.; Townsend, R.R.; Dunn, T.N.; Grant, R.W.; Adams, S.H.; Keim, N.L.; Cummings, B.P.; Stanhope, K.L.; Havel, P.J. Endocrine and metabolic effects of consuming fructose- and glucose-sweetened beverages with meals in obese men and women: Influence of insulin resistance on plasma triglyceride responses. J. Clin. Endocrinol. Metab. 2009, 94, 1562–1569. [Google Scholar] [CrossRef] [PubMed]
- Rezvani, R.; Cianflone, K.; McGahan, J.P.; Berglund, L.; Bremer, A.A.; Keim, N.L.; Griffen, S.C.; Havel, P.J.; Stanhope, K.L. Effects of sugar-sweetened beverages on plasma acylation stimulating protein, leptin and adiponectin: Relationships with Metabolic Outcomes. Obesity 2013, 21, 2471–2480. [Google Scholar] [PubMed] [Green Version]
- Stanhope, K.; Schwarz, J.M.; Keim, N.; Griffen, S.; Bremer, A.; Graham, J.; Hatcher, B.; Cox, C.; Dyachenko, A.; Zhang, W.; et al. Consuming fructose-sweetened, not glucose-sweetened, beverages increases visceral adiposity and lipids and decreases insulin sensitivity in overweight/obese humans. J. Clin. Investig. 2009, 119, 1322–1334. [Google Scholar] [CrossRef] [PubMed] [Green Version]
- Stanhope, K.L.; Bremer, A.A.; Medici, V.; Nakajima, K.; Ito, Y.; Nakano, T.; Chen, G.; Fong, T.H.; Lee, V.; Menorca, R.I.; et al. Consumption of fructose and high fructose corn syrup increase postprandial triglycerides, LDL-cholesterol, and apolipoprotein-B in young men and women. J. Clin. Endocrinol. Metab. 2011, 96, 1596–1605. [Google Scholar] [CrossRef]
- Stanhope, K.L.; Medici, V.; Bremer, A.A.; Lee, V.; Lam, H.D.; Nunez, M.V.; Chen, G.X.; Keim, N.L. A dose-response study of consuming high-fructose corn syrup–sweetened beverages on lipid/lipoprotein risk factors for cardiovascular disease in young adults. Am. J. Clin. Nutr. 2015, 101, 1144–1154. [Google Scholar] [CrossRef] [Green Version]
- Tryon, M.S.; Stanhope, K.L.; Epel, E.S.; Mason, A.E.; Brown, R.; Medici, V.; Havel, P.J.; Laugero, K.D. Excessive sugar consumption may be a difficult habit to break: A view from the brain and body. J. Clin. Endocrinol. Metab. 2015, 100, 2239–2247. [Google Scholar]
- Hieronimus, B.; Medici, V.; Bremer, A.A.; Lee, V.; Nunez, M.V.; Sigala, D.M.; Keim, N.L.; Havel, P.J.; Stanhope, K.L. Synergistic effects of fructose and glucose on lipoprotein risk factors for cardiovascular disease in young adults. Metabolism 2020, 112, 154356. [Google Scholar] [CrossRef]
- Harder, N.H.O.; Hieronimus, B.; Stanhope, K.L.; Shibata, N.M.; Lee, V.; Nunez, M.V.; Keim, N.L.; Bremer, A.; Havel, P.J.; Heffern, M.C.; et al. Effects of dietary glucose and fructose on copper, iron, and zinc metabolism parameters in humans. Nutrients 2020, 12, 2581. [Google Scholar] [CrossRef] [PubMed]
- Mifflin, M.D.; St Jeor, S.T.; Hill, L.A.; Scott, B.J.; Daugherty, S.A.; Koh, Y.O. A new predictive equation for resting energy expenditure in healthy individuals. Am. J. Clin. Nutr. 1990, 51, 241–247. [Google Scholar] [CrossRef] [PubMed]
- Rao, S.S.C.; Attaluri, A.; Anderson, L.; Stumbo, P. Ability of the Normal Human Small Intestine to Absorb Fructose: Evaluation by Breath Testing. Clin. Gastroenterol. Hepatol. 2007, 5, 959–963. [Google Scholar] [CrossRef] [PubMed] [Green Version]
- Stanhope, K.L. Role of Fructose-Containing Sugars in the Epidemics of Obesity and Metabolic Syndrome. Annu. Rev. Med. 2012, 63, 329–343. [Google Scholar] [CrossRef] [PubMed]
- Levitt, M.D.; Donaldson, R.M. Use of Respiratory Hydrogen (H2) Excretion to Detect Carbohydrate Malabsorption. J. Lab. Clin. Med. 1970, 75, 937–945. [Google Scholar] [PubMed]
- Automated Self-Administered 24-Hour (ASA24®) Dietary Assessment Tool. Available online: https://epi.grants.cancer.gov/asa24/ (accessed on 9 January 2020).
- Baecke, J.A.; Burema, J.; Frijters, J.E. A short questionnaire for the measurement of habitual physical activity in epidemiological studies. Am. J. Clin. Nutr. 1982, 36, 936–942. [Google Scholar] [CrossRef] [PubMed]
- Almiron-Roig, E.; Palla, L.; Guest, K.; Ricchiuti, C.; Vint, N.; Jebb, S.A.; Drewnowski, A. Factors that determine energy compensation: A Systematic review of preload studies. Nutr. Rev. 2013, 71, 458–473. [Google Scholar] [CrossRef] [Green Version]
- Kirkpatrick, S.I.; Subar, A.F.; Douglass, D.; Zimmerman, T.P.; Thompson, F.E.; Kahle, L.L.; George, S.M.; Dodd, K.W.; Potischman, N. Performance of the Automated Self-Administered 24-hour Recall relative to a measure of true intakes and to an interviewer-administered 24-h recall. Am. J. Clin. Nutr. 2014, 100, 233–240. [Google Scholar]
- Livesey, G.; Taylor, R. Fructose consumption and consequences for glycation, plasma triacylglycerol, and body weight: Meta-analyses and meta-regression models of intervention studies. Am. J. Clin. Nutr. 2008, 88, 1419–1437. [Google Scholar]
- Sievenpiper, J.L.; de Souza, R.J.; Mirrahimi, A.; Yu, M.E.; Carleton, A.J.; Beyene, J.; Chiavaroli, L.; Di Buono, M.; Jenkins, A.L.; Leiter, L.A.; et al. Annals of Internal Medicine Review Effect of Fructose on Body Weight in Controlled Feeding Trials. Ann. Intern. Med. 2012, 156, 291–304. [Google Scholar] [CrossRef]
- Te Morenga, L.; Mallard, S.; Mann, J. Dietary sugars and body weight: Systematic review and meta-analyses of randomised controlled trials and cohort studies. BMJ 2013, 345, 1–25. [Google Scholar] [CrossRef] [PubMed] [Green Version]
- Jequier, E. Leptin Signaling, Adiposity, and Energy Balance. Ann. N. Y. Acad. Sci. 2002, 967, 379–388. [Google Scholar] [CrossRef] [PubMed]
- Ferraris, R.P.; Choe, J.; Patel, C.R. Intestinal Absorption of Fructose. Annu. Rev. Nutr. 2018, 38, 41–67. [Google Scholar] [CrossRef] [PubMed]
- Zhang, Y.; Chua, S. Leptin function and regulation. Compr. Physiol. 2018, 8, 351–369. [Google Scholar]
- DiNicolantonio, J.J.; O’Keefe, J.H.; Lucan, S.C. Added fructose: A principal driver of type 2 diabetes mellitus and its consequences. Mayo Clin. Proc. 2015, 90, 372–381. [Google Scholar] [CrossRef] [Green Version]
- Kuzma, J.N.; Cromer, G.; Hagman, D.K.; Breymeyer, K.L.; Roth, C.L.; Foster-Schubert, K.E.; Holte, S.E.; Callahan, H.S.; Weigle, D.S.; Kratz, M. No difference in ad libitum energy intake in healthy men and women consuming beverages sweetened with fructose, glucose, or high-fructose corn syrup: A randomized trial. Am. J. Clin. Nutr. 2015, 102, 1373–1380. [Google Scholar] [CrossRef]
- Pepino, M.Y. Metabolic effects of non-nutritive sweeteners. Physiol. Behav. 2015, 152, 450–455. [Google Scholar]
- Shearer, J.; Swithers, S.E. Artificial sweeteners and metabolic dysregulation: Lessons learned from agriculture and the laboratory. Rev. Endocr. Metab. Disord. 2016, 17, 179–186. [Google Scholar] [CrossRef]
- Fowler, S.P.G. Low-calorie sweetener use and energy balance: Results from experimental studies in animals, and large-scale prospective studies in humans. Physiol. Behav. 2016, 164, 517–523. [Google Scholar] [CrossRef] [Green Version]
- Sylvetsky, A.C.; Jin, Y.; Clark, E.J.; Welsh, J.A.; Rother, K.I.; Talegawkar, S.A. Consumption of Low-Calorie Sweeteners among Children and Adults in the United States. J. Acad. Nutr. Diet. 2017, 117, 441–448.e2. [Google Scholar] [CrossRef]
- Rogers, P.J.; Hogenkamp, P.S.; De Graaf, C.; Higgs, S.; Lluch, A.; Ness, A.R.; Penfold, C.; Perry, R.; Putz, P.; Yeomans, M.R.; et al. Does low-energy sweetener consumption affect energy intake and body weight? A systematic review, including meta-analyses, of the evidence from human and animal studies. Int. J. Obes. 2016, 40, 381–394. [Google Scholar] [CrossRef] [PubMed] [Green Version]
- Stanhope, K.L.; Goran, M.I.; Bosy-Westphal, A.; King, J.C.; Schmidt, L.A.; Schwarz, J.M.; Stice, E.; Sylvetsky, A.C.; Turnbaugh, P.J.; Bray, G.A.; et al. Pathways and mechanisms linking dietary components to cardiometabolic disease: Thinking beyond calories. Obes. Rev. 2018, 19, 1205–1235. [Google Scholar] [CrossRef] [PubMed]
- Dunford, E.K.; Miles, D.R.; Ng, S.W.; Popkin, B. Types and Amounts of Nonnutritive Sweeteners Purchased by US Households: A Comparison of 2002 and 2018 Nielsen Homescan Purchases. J. Acad. Nutr. Diet. 2020, 120, 1662–1671. [Google Scholar] [CrossRef] [PubMed]
- What Are Consumers’ Attitudes Toward Sweeteners. Available online: https://www.globalfoodforums.com/what-are-consumers-attitudes-toward-sweeteners/ (accessed on 9 January 2020).
- Aspartame is Tied to Weight Gain, Increased Appetite and Obesity. Available online: https://usrtk.org/sweeteners/aspartame-weight-gain/#:~:text=Aspartame%2C (accessed on 9 January 2020).
- What Happens To Your Body When You Drink Diet Coke? Available online: https://www.mindfood.com/article/what-happens-to-your-body-when-you-drink-diet-coke/ (accessed on 9 January 2020).
- Dhurandhar, N.V.; Schoeller, D.; Brown, A.W.; Heymsfield, S.B.; Thomas, D.; Sørensen, T.I.; Speakman, J.R.; Jeansonne, M.; Allison, D.B. Energy Balance Measurement: When Something is Not Better than Nothing. Int. J. Obes. 2015, 39, 1109–1113. [Google Scholar] [CrossRef] [Green Version]


| Parameter | Aspartame | Glucose | Fructose | HFCS | Sucrose |
|---|---|---|---|---|---|
| Age (year) | 25.4 ± 6.2 | 26.0 ± 5.74 | 26.8 ± 6.2 | 26.8 ± 6.6 | 25.9 ± 6.3 |
| Sex (M/F) | 11/12 | 15/13 | 15/13 | 15/13 | 12/12 |
| Weight (kg) | 71.8 ± 10.6 | 75.5 ± 12.8 | 75.7 ± 12.9 | 72.8 ± 14.5 | 71.9 ± 12.1 |
| BMI (kg/m2) | 24.8 ± 3.3 | 25.8 ± 3.5 | 25.4 ± 3.7 | 24.9 ± 3.9 | 25.3 ± 3.4 |
| Waist circumference (cm) | 75.2 ± 6.4 | 79.0 ± 9.3 | 77.8 ± 10.5 | 76.9 ± 10.1 | 75.4 ± 7.2 |
| Body fat (%) | 27.1 ± 9.6 | 28.9 ± 8.4 | 28.9 ± 10.3 | 26.0 ± 9.7 | 29.1 ± 11.6 |
| TG (mg/dL) | 100.5 ± 52.6 | 101.6 ± 47.2 | 99.3 ± 34.9 | 107.8 ± 50.1 | 113.6 ± 48.4 |
| Total cholesterol (mg/dL) | 148.9 ± 25.5 | 161.8 ± 31.1 | 150.6 ± 24.8 | 157.6 ± 34.3 | 159.1 ± 23.1 |
| HDL (mg/dL) | 39.4 ± 7.4 | 45.6 ± 14.9 | 44.4 ± 9.4 | 45.6 ± 13.7 | 42.9 ± 6.6 |
| Blood pressure (mm Hg) | 69.2 ± 8.6/112.3 ± 11.5 | 73.8 ± 8.3/118.9 ± 11.2 | 71.5 ± 6.5/117 ± 9.8 | 72.2 ± 7.2/117.1 ± 9.9 | 72.2 ± 5.5/114.3 ± 8.4 |
| Aspartame | Glucose | Fructose | HFCS | Sucrose | p Value Effect of SB | ||||||
|---|---|---|---|---|---|---|---|---|---|---|---|
| Week 0 | Week 2 | Week 0 | Week 2 | Week 0 | Week 2 | Week 0 | Week 2 | Week 0 | Week 2 | ||
| Body Weight (kg) 1 | 71.8 ± 2.2 | 71.7 ± 2.2 | 75.5 ± 2.4 | 76.1 ± 2.5 | 75.7 ± 2.4 | 75.8 ± 2.4 | 72.9 ± 2.7 | 73.7 ± 2.8 | 71.9 ± 2.5 | 72.4 ± 2.6 | 0.092 * |
| Ad Lib Meal Energy Intake w/SB (kcal) 2 | 2900 ± 151 | 2727 ± 129 | 2910 ± 127 | 3034 ± 105 | 2816 ± 155 | 3005 ± 163 | 3089 ± 141 | 3304 ± 155 | 2793 ± 160 | 3155 ±178 | 0.0069 † |
| Ad Lib Meal Energy Intake w/o SB (kcal) | 2900 ± 151 | 2727 ± 129 | 2910 ± 127 | 2426 ± 97 | 2816 ± 155 | 2393 ± 161 | 3089 ± 141 | 2706 ± 144 | 2793 ± 160 | 2567 ± 170 | - |
| Sugar-SB (kcal) | - | - | - | 608 ± 15 | - | 612 ± 15 | - | 598 ± 17 | - | 588 ± 17 | - |
| Leptin AUC (ng/mL × 24-h) 3 | 76.0 ± 13.7 | 84.7 ± 16.4 | 76.2 ± 9.5 | 82.0 ± 11.1 | 77.4 ± 11.2 | 63.7 ± 9.9 | 84.3 ± 14.7 | 83.7 ± 14.9 | 92.2 ± 17.8 | 117.3 ± 23.8 | 0.0009 * |
| Leptin Amplitude (ng/mL) 4 | 7.1 ± 1.1 | 7.2 ± 1.3 | 8.1 ± 2.0 | 8.3 ± 2.1 | 8.1 ± 2.0 | 7.2 ± 2.1 | 8.1 ± 2.0 | 8.1 ± 2.1 | 9.7 ± 2.0 | 11.2 ± 2.4 | 0.0035 * |
| Insulin AUC (pmol/L × 24-h) 5 | 513.4 ± 91.2 | 484.8 ± 78.4 | 474.9 ± 52.2 | 650.2 ± 83.7 | 568.6 ± 128.8 | 400.6 ± 65.3 | 449.1 ± 47.6 | 429.6 ± 42.7 | 447.9 ± 55.8 | 512.8 ± 48.2 | <0.0001 * |
| Glucose AUC (mmol/L × 24-h) 6 | 171.1 ± 27.6 | 182.7 ± 25.1 | 155.6 ± 21.1 | 269.2 ± 20.1 | 183.6 ± 34.1 | 93.7 ± 20.2 | 195.0 ± 23.5 | 173.8 ± 25.5 | 144.0 ± 25.5 | 178.4 ± 27.7 | <0.0001 * |
| Aspartame | Glucose | Fructose | HFCS | Sucrose | |
|---|---|---|---|---|---|
| Breakfast (kcals) | −2 ± 62 ab | −13 ± 48 b | 58 ± 57 ab | 87 ± 42 ab | 236 ± 108 a |
| Fat (g) | −0.2 ± 4.0 | −11.9 ± 2.8 | −8.0 ± 3.8 | −5.8 ± 2.9 | −1.5 ± 4.6 |
| CHO (g) | 0.8 ± 5.7 ab | −18.7 ± 5.0 a | −13.3 ± 5.5 a | −8.8 ± 3.4 ab | 21.3 ± 16.3 b |
| Fiber (g) | −0.2 ± 0.3 | −1.8 ± 0.6 | 1.9 ± 0.6 | 0.4 ± 0.4 | 1.1 ± 1.2 |
| Protein (g) | −0.1 ± 2.6 | −9.1 ± 2.3 | −6.4 ± 2.9 | −7.4 ± 2.4 | −4.2 ± 4.2 |
| Sugar-SB (g) | - | 55.0 ± 1.3 | 55.5 ± 1.4 | 54.1 ± 1.5 | 53.2 ± 1.5 |
| Lunch (kcals) | −47 ± 58 | 74 ± 61 | 51 ± 53 | 45 ± 40 | 30 ± 61 |
| Fat (g) | 0.1 ± 3.3 | −5.8 ± 3.2 | −5.8 ± 3.2 | −5.8 ± 2.1 | −6.3 ± 3.1 |
| CHO (g) | −10.7 ± 6.1 | −10.4 ± 5.7 | −15.7 ± 4.5 | −19.7 ± 4.2 | −18.0 ± 6.6 |
| Fiber (g) | −0.3 ± 0.5 | −0.7 ± 0.4 | −0.3 ± 0.4 | −1.2 ± 0.4 | −0.2 ± 0.6 |
| Protein (g) | −5.4 ± 2.9 | −9.6 ± 2.7 | −8.8 ± 2.6 | −7.7 ± 2.2 | −9.4 ± 2.8 |
| Sugar-SB (g) | - | 55.0 ± 1.3 | 55.5 ± 1.4 | 54.1 ± 1.5 | 53.2 ± 1.5 |
| Dinner (kcals) | −64 ± 56 | 63 ± 58 | 81 ± 50 | 77 ± 53 | 145 ± 37 |
| Fat (g) | −1.0 ± 3.2 | −4.8 ± 2.8 | −6.3 ± 2.7 | −4.5 ± 2.8 | −1.4 ± 1.8 |
| CHO (g) | −10.8 ± 4.9 | −18.3 ± 7.2 | −13.4 ± 5.2 | −13.6 ± 6.1 | −7.0 ± 4.0 |
| Fiber (g) | −0.8 ± 0.4 | −2.8 ± 1.7 | −0.9 ± 0.5 | −1.4 ± 0.5 | 0.4 ± 0.6 |
| Protein (g) | −2.3 ± 3.3 | −4.2 ± 2.1 | −3.4 ± 2.2 | −5.3 ± 2.0 | −2.0 ± 1.5 |
| Sugar-SB (g) | - | 55.0 ± 1.3 | 55.5 ± 1.4 | 54.1 ± 1.5 | 53.2 ± 1.5 |
Publisher’s Note: MDPI stays neutral with regard to jurisdictional claims in published maps and institutional affiliations. |
© 2020 by the authors. Licensee MDPI, Basel, Switzerland. This article is an open access article distributed under the terms and conditions of the Creative Commons Attribution (CC BY) license (http://creativecommons.org/licenses/by/4.0/).
Share and Cite
Sigala, D.M.; Widaman, A.M.; Hieronimus, B.; Nunez, M.V.; Lee, V.; Benyam, Y.; Bremer, A.A.; Medici, V.; Havel, P.J.; Stanhope, K.L.; et al. Effects of Consuming Sugar-Sweetened Beverages for 2 Weeks on 24-h Circulating Leptin Profiles, Ad Libitum Food Intake and Body Weight in Young Adults. Nutrients 2020, 12, 3893. https://0-doi-org.brum.beds.ac.uk/10.3390/nu12123893
Sigala DM, Widaman AM, Hieronimus B, Nunez MV, Lee V, Benyam Y, Bremer AA, Medici V, Havel PJ, Stanhope KL, et al. Effects of Consuming Sugar-Sweetened Beverages for 2 Weeks on 24-h Circulating Leptin Profiles, Ad Libitum Food Intake and Body Weight in Young Adults. Nutrients. 2020; 12(12):3893. https://0-doi-org.brum.beds.ac.uk/10.3390/nu12123893
Chicago/Turabian StyleSigala, Desiree M., Adrianne M. Widaman, Bettina Hieronimus, Marinelle V. Nunez, Vivien Lee, Yanet Benyam, Andrew A. Bremer, Valentina Medici, Peter J. Havel, Kimber L. Stanhope, and et al. 2020. "Effects of Consuming Sugar-Sweetened Beverages for 2 Weeks on 24-h Circulating Leptin Profiles, Ad Libitum Food Intake and Body Weight in Young Adults" Nutrients 12, no. 12: 3893. https://0-doi-org.brum.beds.ac.uk/10.3390/nu12123893