Combination Antioxidant/NSAID Therapies and Oral/Topical Ocular Delivery Modes for Prevention of Oxygen-Induced Retinopathy in a Rat Model

 ,
,
Abstract
:1. Introduction
2. Materials and Methods
2.1. Animals
2.2. Experimental Design
2.3. Neonatal Intermittent Hypoxia (IH) Profile
2.4. Sample Collection & Processing
2.5. Assay of Growth Factors
2.6. Total Cellular Protein Levels
2.7. Western Blots
2.8. Retinal Flatmounts
2.9. ADPase Staining of the Retinas
2.10. GFAP and Isolectin B4 staining
2.11. Retinal Angiogenesis and Morphometric Analyses
2.12. Histopathology
2.13. Immunohistochemistry
2.14. Statistical Analysis
3. Results
3.1. Growth
3.2. Organ/Body Weight Ratios
3.3. Eye Opening
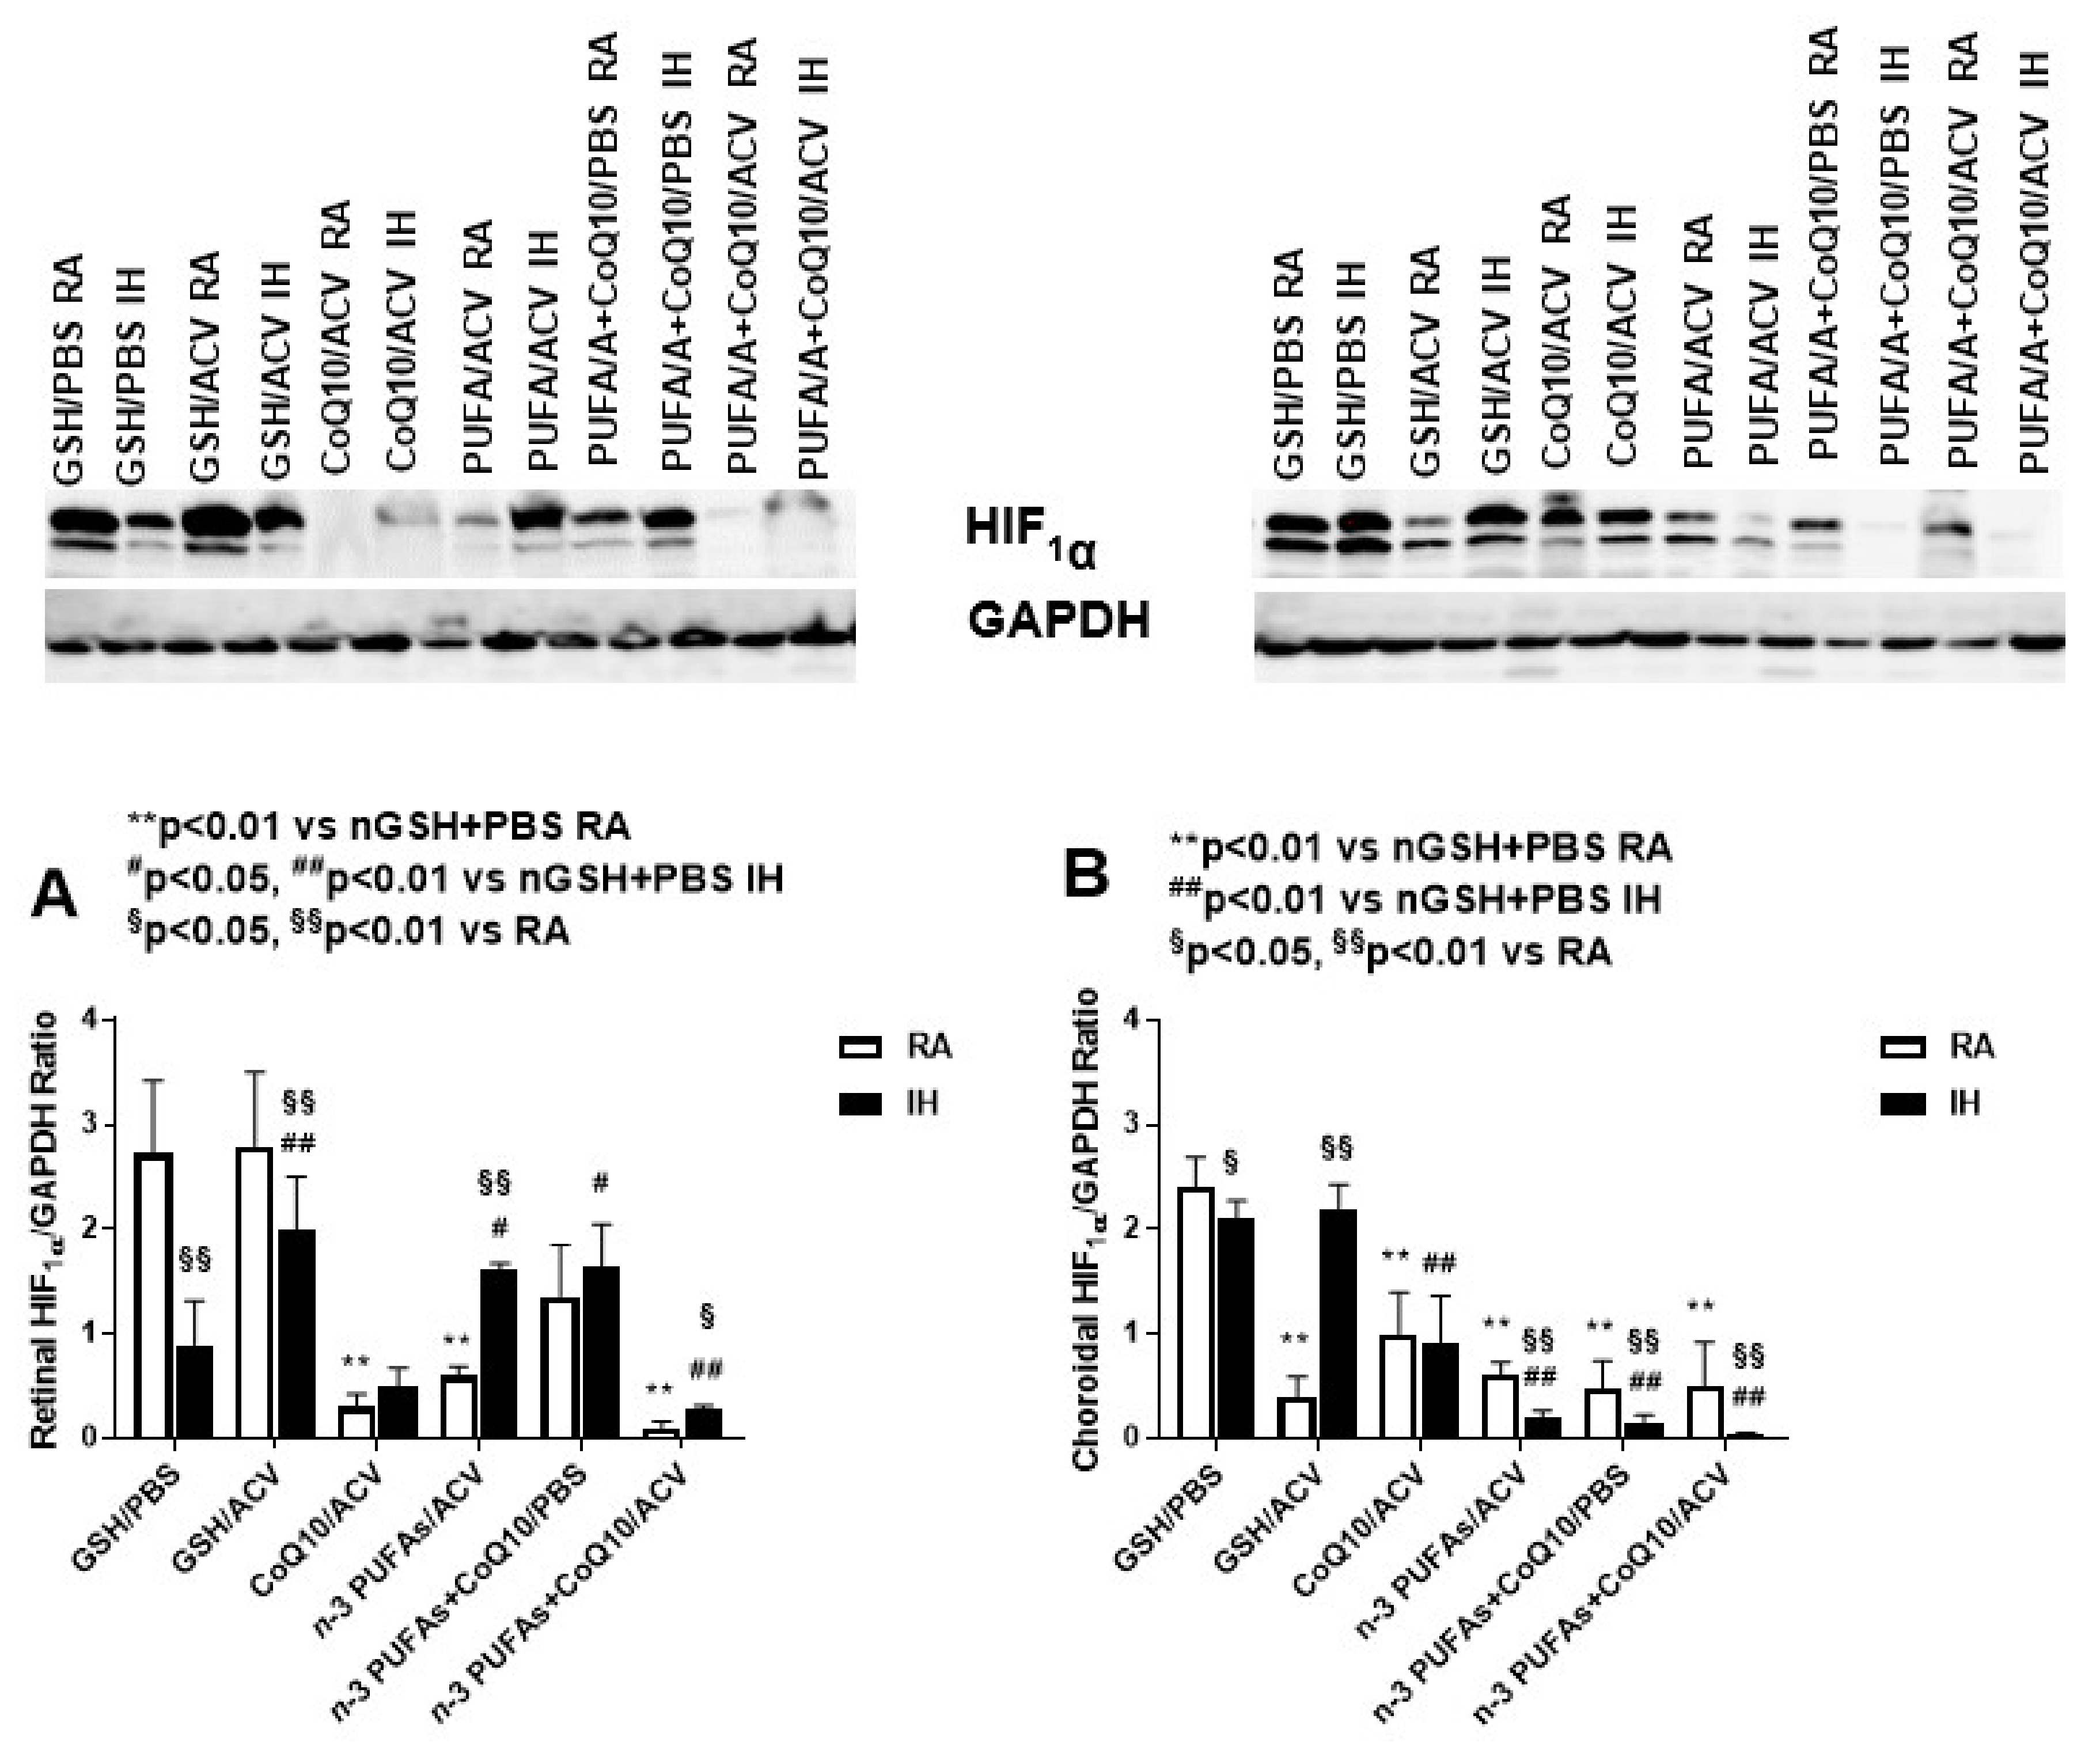
3.4. Ocular HIF1α Levels
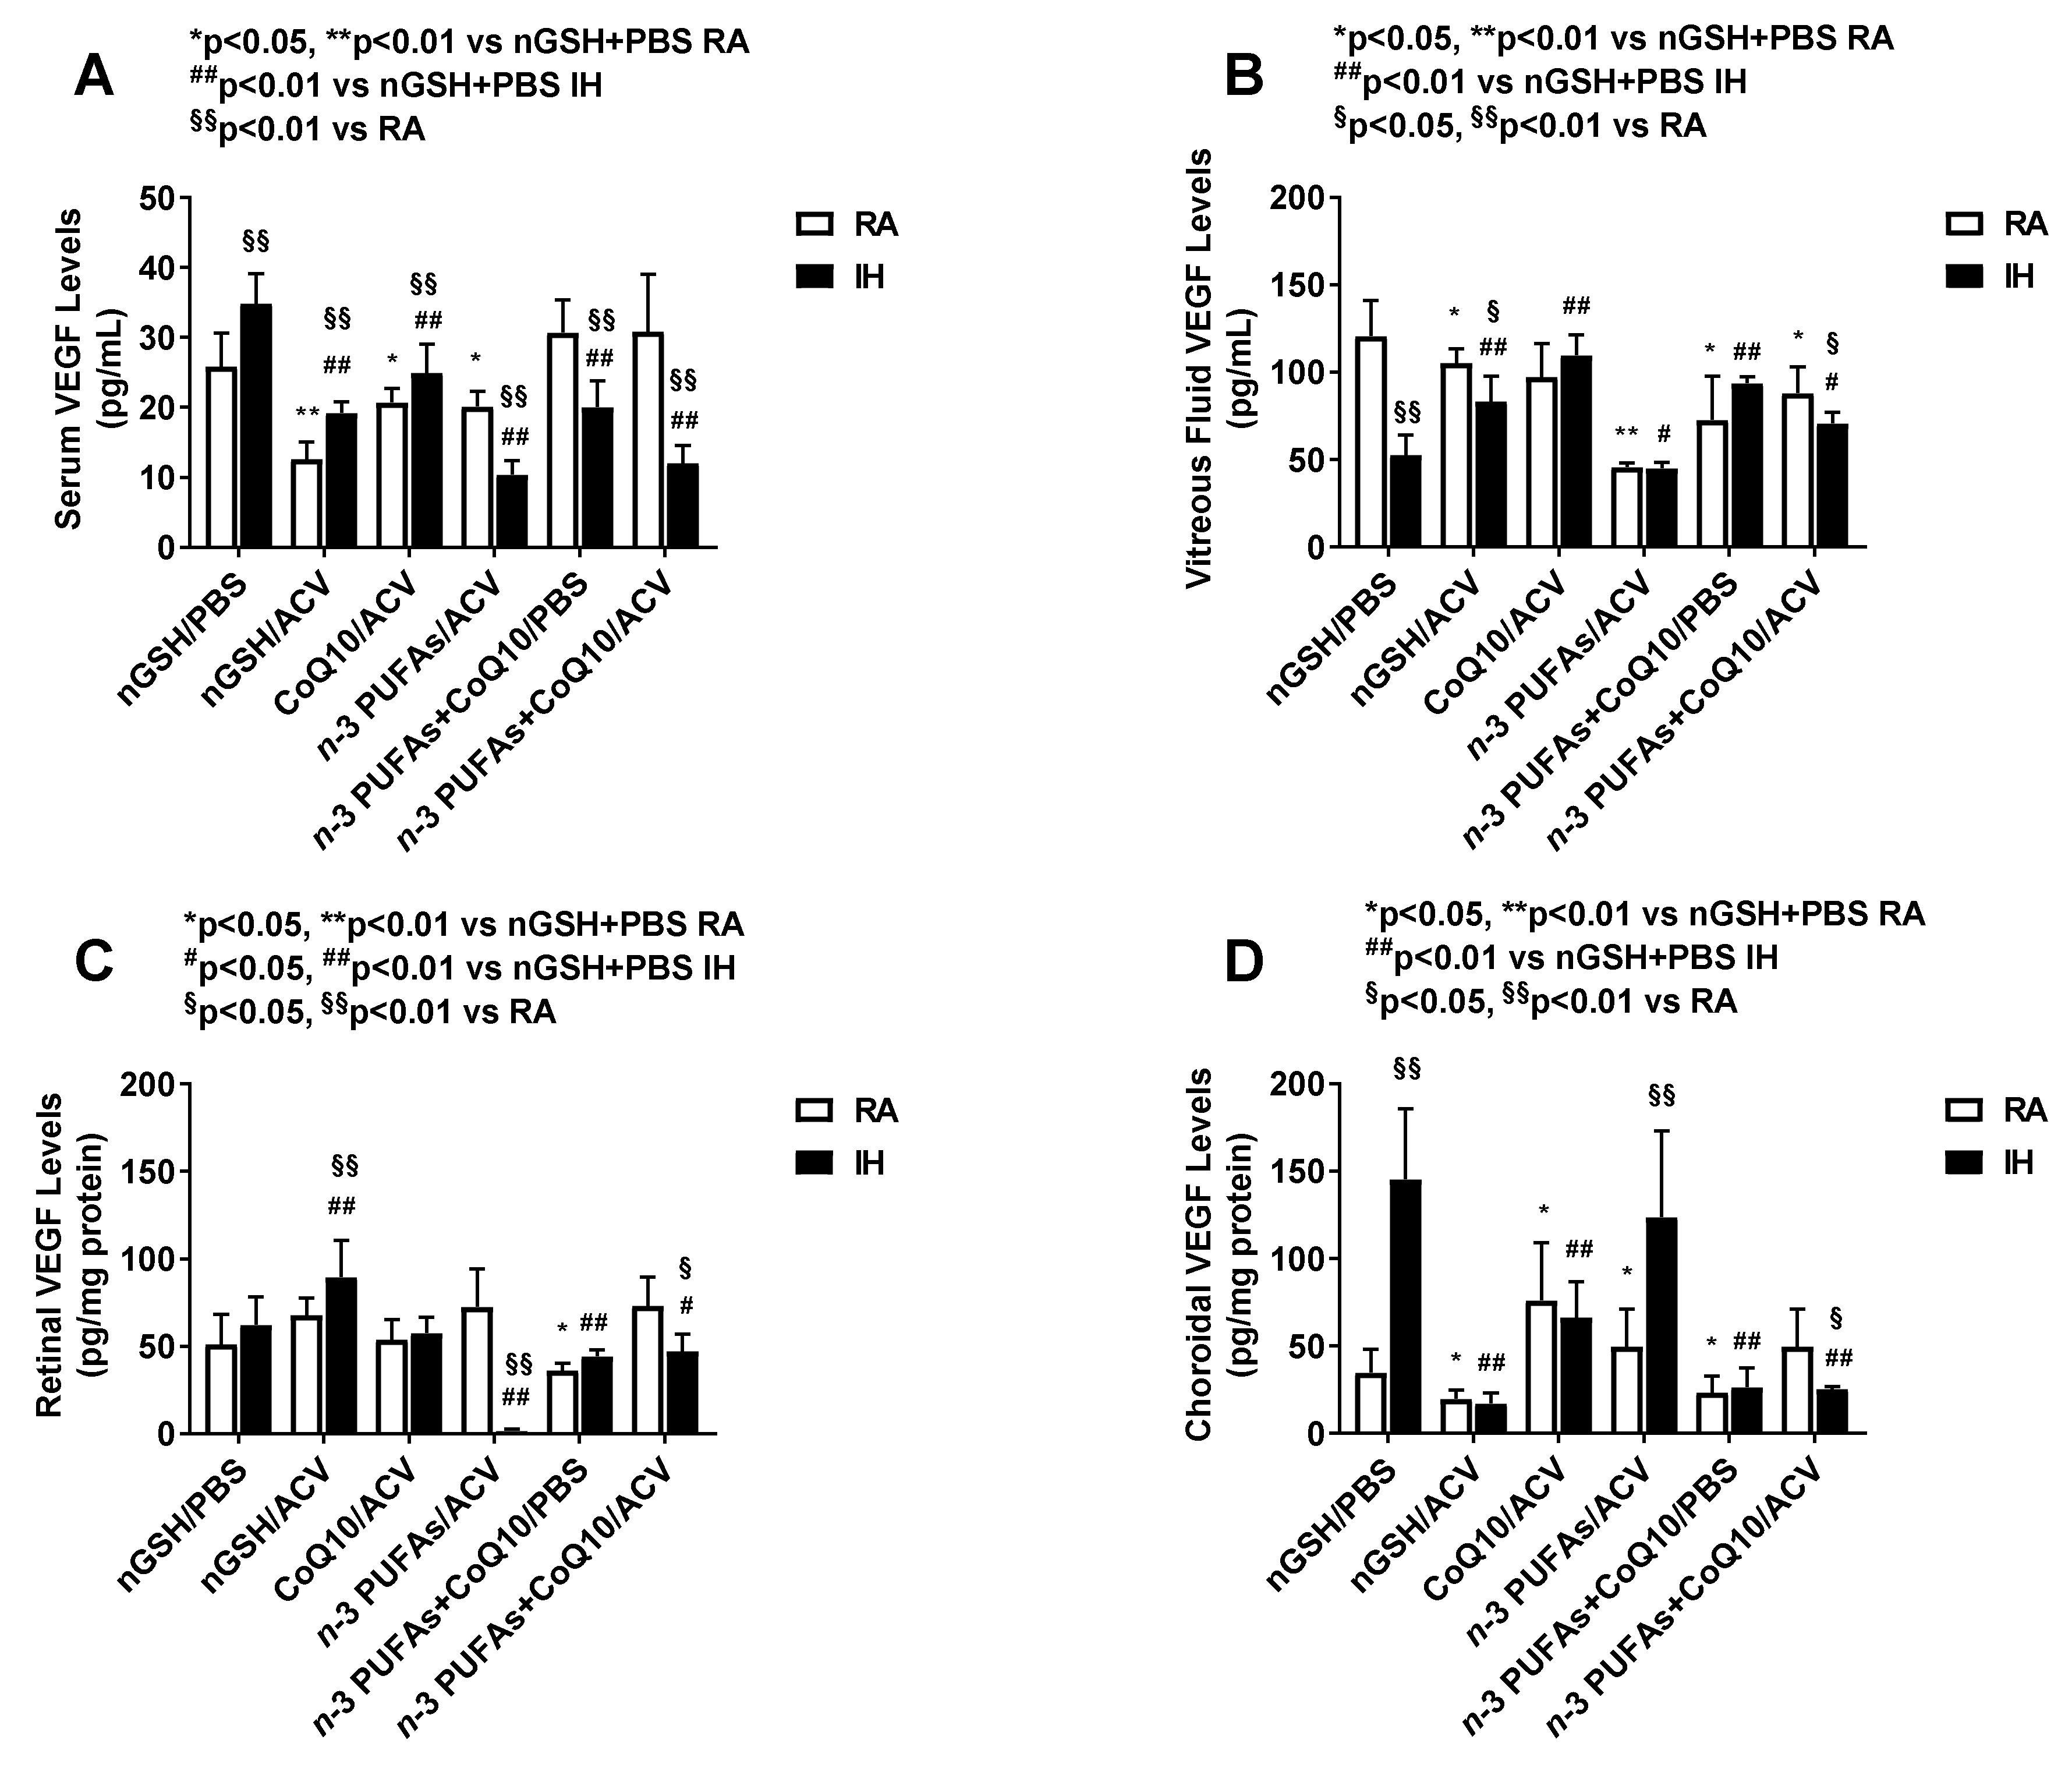
3.5. Systemic and Ocular VEGF
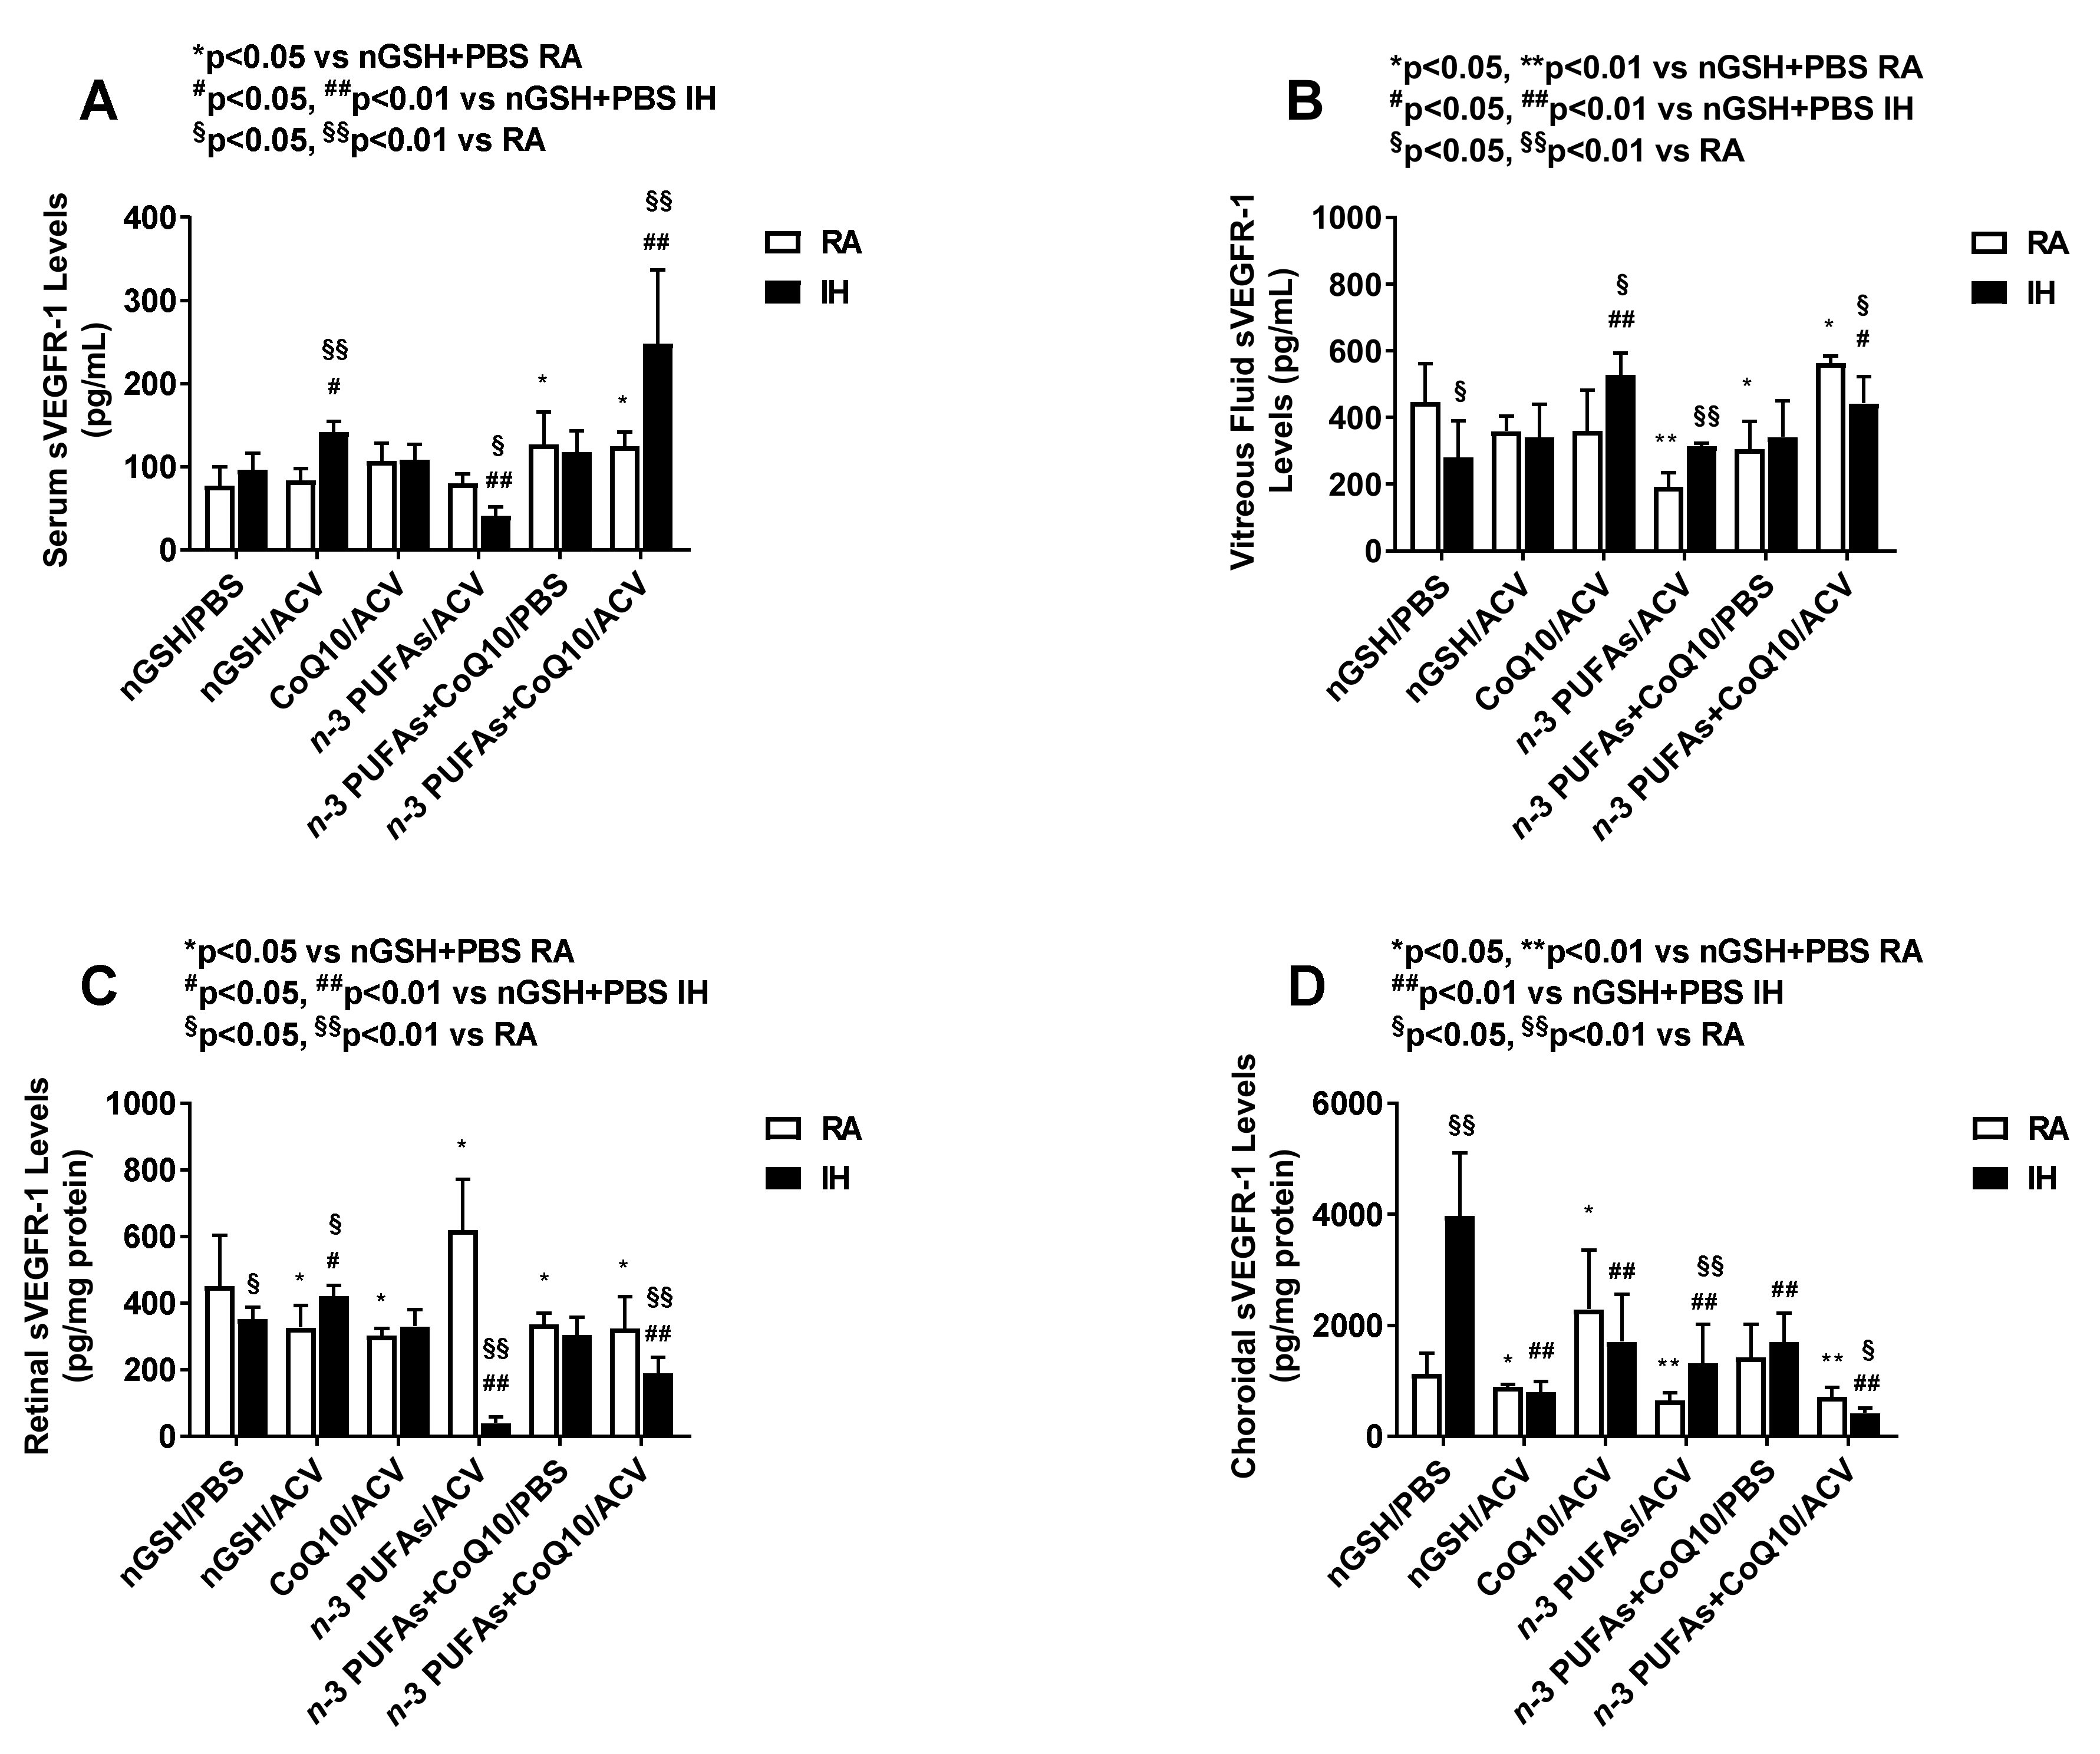
3.6. Systemic and Ocular sVEGFR-1
3.7. Systemic and Ocular sVEGFR-2
3.8. Systemic and Ocular IGF-I
3.9. Corneal Thickness and Histopathology
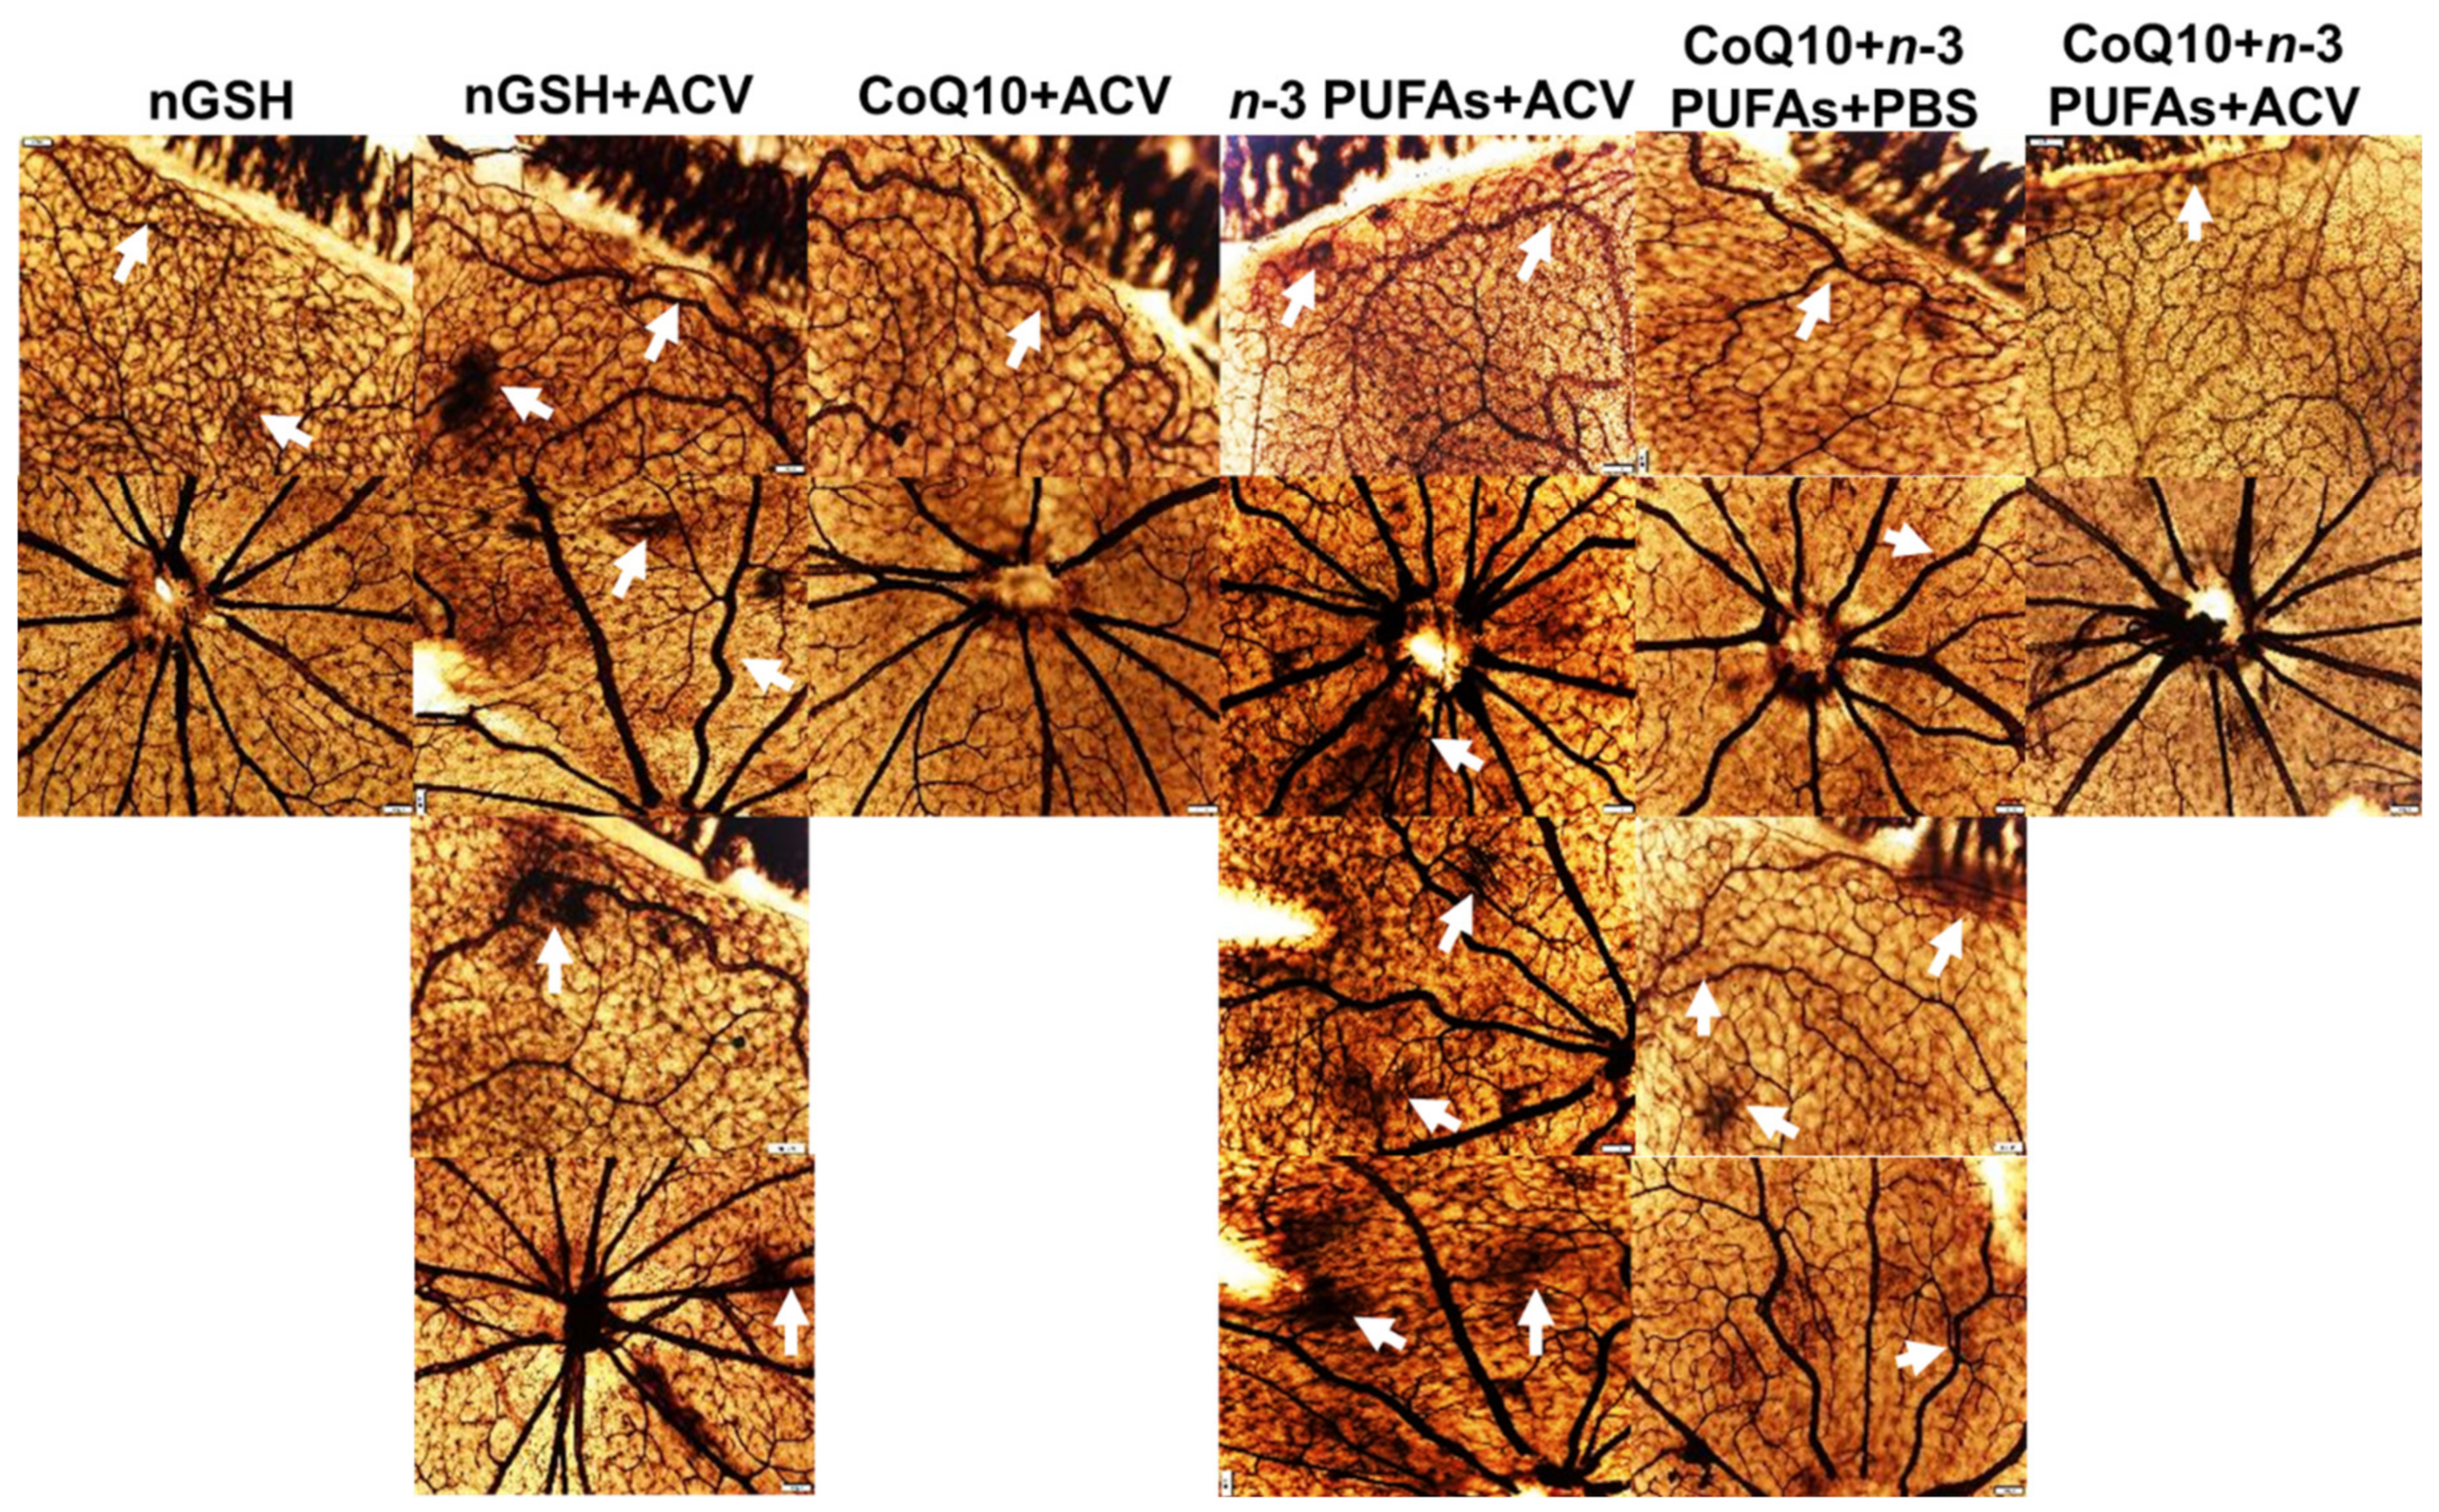
3.10. Retinal Vasculature
3.11. Retinal Astrocytes
3.12. Retinal Layers
4. Discussion
5. Conclusions
Author Contributions
Funding
Conflicts of Interest
References
- Smith, L.E. Pathogenesis of Retinopathy of Prematurity. Growth Horm. IGF Res. 2004, 14, S140–S144. [Google Scholar] [CrossRef] [PubMed]
- Cringle, S.J.; Yu, D.Y. Oxygen supply and consumption in the retina: Implications for studies of retinopathy of prematurity. Doc. Ophthalmol. 2010, 120, 99–109. [Google Scholar] [CrossRef] [PubMed]
- Phelps, D.L. Retinopathy of prematurity: History, classification, and pathophysiology. Neoreviews 2001, 2, e153–e166. [Google Scholar] [CrossRef] [Green Version]
- Phelps, D.L. Retinopathy of prematurity. In Neonatal Perinatal Medicine: Diseases of the Fetus and Infant, 7th ed.; Fanaroff, A.A., Martin, R.J., Eds.; Mosby: St. Louis, MO, USA, 2002; Volume 2, pp. 1595–1599. [Google Scholar]
- Aranda, J.V.; Cai, C.L.; Ahmad, T.; Bronshtein, V.; Sadeh, J.; Valencia, G.B.; Lazzaro, D.R.; Beharry, K.D. Pharmacologic synergism of ocular ketorolac and systemic caffeine citrate in rat oxygen-induced retinopathy. Pediatr. Res. 2016, 80, 554–565. [Google Scholar] [CrossRef] [PubMed] [Green Version]
- Tu, C.; Beharry, K.D.; Shen, X.; Li, J.; Wang, L.; Aranda, J.V.; Qu, J. Proteomic profiling of the retinas in a neonatal rat model of oxygen-induced retinopathy with a reproducible ion-current-based MS1 approach. J. Proteome Res. 2015, 14, 2109–2120. [Google Scholar] [CrossRef] [Green Version]
- Aranda, J.V.; Qu, J.; Valencia, G.B.; Beharry, K.D. Pharmacologic interventions for the prevention and treatment of retinopathy of prematurity. Semin. Perinatol. 2019, 43, 360–366. [Google Scholar] [CrossRef] [Green Version]
- Beharry, K.D.; Cai, C.L.; Siddiqui, F.; Chowdhury, S.; D’Agrosa, C.; Valencia, G.B.; Aranda, J.V. Comparative Effects of Coenzyme Q10 or n-3 Polyunsaturated Fatty Acid Supplementation on Retinal Angiogenesis in a Rat Model of Oxygen-Induced Retinopathy. Antioxidants 2018, 7, 160. [Google Scholar] [CrossRef] [Green Version]
- Lefnesky, E.J. Tissue iron overload and mechanisms of iron-catalyzed oxidative injury. Adv. Exp. Med. Biol. 1994, 366, 129–146. [Google Scholar]
- Winterbourn, C.C. The toxicity of iron and hydrogen peroxide: The Fenton reaction. Toxicol. Lett. 1995, 82–83, 969–974. [Google Scholar] [CrossRef]
- Hirano, K.; Morinobu, T.; Kim, H.; Hiroi, M.; Ban, R.; Ogawa, S.; Ogihara, H.; Tamai, H.; Ogihara, T. Blood transfusion increases radical promoting non-transferrin bound iron in preterm infants. Arch. Dis. Child Fetal. Neonatal. Ed. 2001, 84, F188–F193. [Google Scholar] [CrossRef] [Green Version]
- Berger, H.M.; Mumby, S.; Gutteridge, J.M.C. Ferrous ions detected in iron-overloaded cord blood plasma from preterm and term babies: Implications for oxidative stress. Free Radic. Res. 1995, 22, 555–559. [Google Scholar] [CrossRef]
- Mäkelä, E.; Takala, T.I.; Suominen, P.; Matomäki, J.; Salmi, T.T.; Rajamäki, A.; Lapinleimu, H.; Lehtonen, L.; Irjala, K.; Lähteenmäki, P.M. Hematological parameters in preterm infants from birth to 16 weeks of age with reference to iron balance. Clin. Chem. Lab. Med. 2008, 46, 551–557. [Google Scholar] [CrossRef] [PubMed]
- Pitkänen, O.M.; Hallman, M.; Andersson, S.M. Correlation of free oxygen radical-induced lipid peroxidation with outcome in very low birth weight infants. J. Pediatr. 1990, 116, 760–764. [Google Scholar] [CrossRef]
- Mansfield, K.D.; Guzy, R.D.; Pan, Y.; Young, R.M.; Cash, T.P.; Schumacker, P.T.; Simon, M.C. Mitochondrial dysfunction resulting from loss of cytochrome c impairs cellular oxygen sensing and hypoxic HIF-alpha activation. Cell Metab. 2005, 1, 393–399. [Google Scholar] [CrossRef] [PubMed] [Green Version]
- Semenza, G.L. Oxygen-dependent regulation of mitochondrial respiration by hypoxia-inducible factor 1. Biochem. J. 2007, 405, 1–9. [Google Scholar] [CrossRef] [Green Version]
- Yu, D.Y.; Cringle, S.J. Oxygen distribution and consumption within the retina in vascularised and avascular retinas and in animal models of retinal disease. Prog. Retin. Eye Res. 2001, 20, 175–208. [Google Scholar] [CrossRef]
- Aberg, F.; Appelkvist, E.L.; Dallner, G.; Ernster, L. Distribution and redox state of ubiquinones in rat and human tissues. Arch. Biochem. Biophys. 1992, 295, 230–234. [Google Scholar] [CrossRef]
- Sarmiento, A.; Diaz-Castro, J.; Pulido-Moran, M.; Kajarabille, N.; Guisado, R.; Ochoa, J.J. Coenzyme Q10 supplementation and exercise in healthy humans: A systematic review. Curr. Drug. Metab. 2016, 17, 345–358. [Google Scholar] [CrossRef]
- Fitch, C.D.; Folkers, K. Coenzyme Q and the stability of biological membranes. Biochem. Biophys. Res. Commun. 1967, 26, 128–231. [Google Scholar] [CrossRef]
- Garrido-Maraver, J.; Cordero, M.D.; Oropesa-Avila, M.; Vega, A.F.; de la Mata, M.; Pavon, A.D.; Alcocer-Gomez, E.; Calero, C.P.; Paz, M.V.; Alanis, M.; et al. Clinical applications of coenzyme Q10. Front. Biosci. 2014, 19, 619–633. [Google Scholar] [CrossRef] [Green Version]
- Lee, D.; Kim, K.Y.; Shim, M.S.; Kim, S.Y.; Ellisman, M.H.; Weinreb, R.N.; Ju, W.K. Coenzyme Q10 ameliorates oxidative stress and prevents mitochondrial alteration in ischemic retinal injury. Apoptosis 2014, 19, 603–614. [Google Scholar] [CrossRef] [PubMed] [Green Version]
- Bergamini, C.; Moruzzi, N.; Sblendido, A.; Lenaz, G.; Fato, R. A water soluble CoQ10 formulation improves intracellular distribution and promotes mitochondrial respiration in cultured cells. PLoS ONE 2012, 7, e33712. [Google Scholar] [CrossRef] [PubMed] [Green Version]
- Lisanti, M.P.; Martinez-Outschoorn, U.E.; Lin, Z.; Pavlides, S.; Whitaker-Menezes, D.; Pestell, R.G.; Howell, A.; Sotgia, F. Hydrogen peroxide fuels aging, inflammation, cancer metabolism and metastasis: The seed and soil also needs “fertilizer”. Cell Cycle 2011, 10, 2440–2449. [Google Scholar] [CrossRef] [PubMed] [Green Version]
- Friedmann Angeli, J.P.; Schneider, M.; Proneth, B.; Tyurina, Y.Y.; Tyurin, V.A.; Hammond, V.J.; Herbach, N.; Aichler, M.; Walch, A.; Eggenhofer, E.; et al. Inactivation of the ferroptosis regulator Gpx4 triggers acute renal failure in mice. Nat. Cell. Biol. 2014, 16, 1180–1191. [Google Scholar] [CrossRef] [Green Version]
- Yang, W.S.; SriRamaratnam, R.; Welsch, M.E.; Shimada, K.; Skouta, R.; Viswanathan, V.S.; Cheah, J.H.; Clemons, P.A.; Shamji, A.F.; Clish, C.B.; et al. Regulation of ferroptotic cancer cell death by GPX4. Cell 2014, 156, 317–331. [Google Scholar] [CrossRef] [Green Version]
- Phelps, D.L. Current perspectives on vitamin E in infant nutrition. Am. J. Clin. Nutr. 1987, 46, 187–191. [Google Scholar] [CrossRef] [PubMed] [Green Version]
- Davis, J.M.; Rosenfeld, W.N.; Richter, S.E.; Parad, M.R.; Gewolb, I.H.; Spitzer, A.R.; Carlo, W.A.; Couser, R.J.; Price, A.; Flaster, E.; et al. Safety and pharmacokinetics of multiple doses of recombinant human CuZn superoxide dismutase administered intratracheally to premature neonates with respiratory distress syndrome. Pediatrics 1997, 100, 24–30. [Google Scholar] [CrossRef]
- Steinhubl, S.R. Why have antioxidants failed in clinical trials? Am. J. Cardiol. 2008, 101, S14–S19. [Google Scholar] [CrossRef] [PubMed]
- Vlaardingerbroek, H.; Veldhorst, M.A.; Spronk, S.; van den Akker, C.H.; van Goudoever, J.B. Parenteral lipid administration to very-low-birth-weight infants—Early introduction of lipids and use of new lipid emulsions: A systematic review and meta-analysis. Am. J. Clin. Nutr. 2012, 96, 255–268. [Google Scholar] [CrossRef] [Green Version]
- Lee, E.J.; Simmer, K.; Gibson, R.A. Essential fatty acid deficiency in parenterally fed preterm infants. J. Paediatr. Child Health 1993, 29, 51–55. [Google Scholar] [CrossRef]
- Calder, P.C. Omega-3 fatty acids and inflammatory processes: From molecules to man. Biochem. Soc. Trans. 2017, 45, 1105–1115. [Google Scholar] [CrossRef] [PubMed] [Green Version]
- SanGiovanni, J.P.; Chew, E.Y. The role of omega-3 long-chain polyunsaturated fatty acids in health and disease of the retina. Prog. Retin. Eye Res. 2005, 24, 87–138. [Google Scholar] [CrossRef] [PubMed]
- Smithers, L.G.; Gibson, R.A.; McPhee, A.; Makrides, M. Effect of long-chain polyunsaturated fatty acid supplementation of preterm infants on disease risk and neurodevelopment: A systematic review of randomized controlled trials. Am. J. Clin. Nutr. 2008, 87, 912–920. [Google Scholar] [CrossRef] [PubMed] [Green Version]
- Pawlik, D.; Lauterbach, R.; Walczak, M.; Hurkala, J.; Sherman, M.P. Fish-oil fat emulsion supplementation reduces the risk of retinopathy in very low birth weight infants: A prospective, randomized study. J. Parenter. Enteral. Nutr. 2014, 38, 711–716. [Google Scholar] [CrossRef]
- Beken, S.; Dilli, D.; Fettah, N.D.; Kabatas, E.U.; Zenciroglu, A.; Okumus, N. The influence of fish-oil lipid emulsions on retinopathy of prematurity in very low birth weight infants: A randomized controlled trial. Early Hum. Dev. 2014, 90, 27–31. [Google Scholar] [CrossRef] [PubMed]
- D’Ascenzo, R.; Savini, S.; Biagetti, C.; Bellagamba, M.P.; Marchionni, P.; Pompilio, A.; Cogo, P.E.; Carnielli, V.P. Higher docosahexaenoic acid, lower arachidonic acid and reduced lipid tolerance with high doses of a lipid emulsion containing 15% fish oil: A randomized clinical trial. Clin. Nutr. 2014, 33, 1002–1009. [Google Scholar] [CrossRef]
- Vlaardingerbroek, H.; Vermeulen, M.J.; Carnielli, V.P.; Vaz, F.M.; van den Akker, C.H.; van Goudoever, J.B. Growth and fatty acid profiles of VLBW infants receiving a multicomponent lipid emulsion from birth. J. Pediatr. Gastroenterol. Nutr. 2014, 58, 417–427. [Google Scholar] [CrossRef]
- Tanito, M.; Brush, R.S.; Elliott, M.H.; Wicker, L.D.; Henry, K.R.; Anderson, R.E. High levels of retinal membrane docosahexaenoic acid increase susceptibility to stress-induced degeneration. J. Lipid. Res. 2009, 50, 807–819. [Google Scholar] [CrossRef] [Green Version]
- Garrel, C.; Alessandri, J.-M.; Guesnet, P.; Al-Gubory, K.H. Omega-3 fatty acids enhance mitochondrial superoxide dismutase activity in rat organs during post-natal development. Int. J. Biochem. Cell Biol. 2012, 44, 123–131. [Google Scholar] [CrossRef]
- Song, J.H.; Fujimoto, K.; Miyazawa, T. Polyunsaturated (n-3) fatty acids susceptible to peroxidation are increased in plasma and tissue lipids of rats fed docosahexaenoic acid-containing oils. J. Nutr. 2000, 130, 3028–3033. [Google Scholar] [CrossRef] [Green Version]
- Laneuville, O.; Breuer, D.K.; Xu, N.; Huang, Z.H.; Gage, D.A.; Watson, J.T.; Lagarde, M.; DeWitt, D.L.; Smith, W.L. Fatty acid substrate specificities of human prostaglandin-endoperoxide H synthase-1 and -2. Formation of 12-hydroxy-(9Z, 13E/Z, 15Z)-octadecatrienoic acids from alpha-linolenic acid. J. Biol. Chem. 1995, 270, 19330–19336. [Google Scholar] [CrossRef] [PubMed] [Green Version]
- Gaschler, M.M.; Stockwell, B.R. Lipid peroxidation in cell death. Biochem. Biophys. Res. Commun. 2017, 482, 419–425. [Google Scholar] [CrossRef] [PubMed]
- Phillis, J.W.; Horrocks, L.A.; Farooqui, A.A. Cyclooxygenases, lipoxygenases, and epoxygenases in CNS: Their role and involvement in neurological disorders. Brain. Res. Rev. 2006, 52, 201–243. [Google Scholar] [CrossRef] [PubMed]
- Rink, C.; Khanna, S. Significance of brain tissue oxygenation and the arachidonic acid cascade in stroke. Antioxid. Redox Signal. 2011, 14, 1889–1903. [Google Scholar] [CrossRef] [Green Version]
- Beauchamp, M.H.; Martinez-Bermudez, A.K.; Gobeil, F., Jr.; Marrache, A.M.; Hou, X.; Speranza, G.; Abran, D.; Quiniou, C.; Lachapelle, P.; Roberts, J., 2nd; et al. Role of thromboxane in retinal microvascular degeneration in oxygen-induced retinopathy. J. Appl. Physiol. 2001, 90, 2279–2288. [Google Scholar] [CrossRef]
- Flower, R.W.; McLeod, D.S.; Wajer, S.D.; Sendi, G.S.; Egner, P.G.; Dubin, N.H. Prostaglandins as mediators of vasotonia in the immature retina. Pediatrics 1984, 73, 440–444. [Google Scholar]
- Zhu, Y.; Park, T.S.; Gidday, J.M. Mechanisms of hyperoxia-induced reductions in retinal blood flow in newborn pig. Exp. Eye Res. 1998, 67, 357–369. [Google Scholar] [CrossRef]
- Hardy, P.; Beauchamp, M.; Sennlaub, F.; Gobeil, F., Jr.; Mwaikambo, B.; Lachapelle, P.; Chemtob, S. Inflammatory lipid mediators in ischemic retinopathy. Pharmacol. Rep. 2005, 57, 169–190. [Google Scholar]
- Barnett, J.M.; McCollum, G.W.; Penn, J.S. Role of cytosolic phospholipase A (2) in retinal neovascularization. Investig. Ophthalmol. Vis. Sci. 2010, 51, 1136–1142. [Google Scholar] [CrossRef]
- Sennlaub, F.; Valamanesh, F.; Vazquez-Tello, A.; El-Asrar, A.M.; Checchin, D.; Brault, S.; Gobeil, F.; Beauchamp, M.H.; Mwaikambo, B.; Courtois, Y.; et al. Cyclooxygenase-2 in human and experimental ischemic proliferative retinopathy. Circulation 2003, 108, 198–204. [Google Scholar] [CrossRef] [Green Version]
- Yanni, S.E.; McCollum, G.W.; Penn, J.S. Genetic deletion of COX-2 diminishes VEGF production in mouse retinal Müller cells. Exp. Eye Res. 2010, 91, 34–41. [Google Scholar] [CrossRef] [PubMed] [Green Version]
- Ahuja, M.; Dhake, A.S.; Sharma, S.K.; Majumdar, D.K. Topical ocular delivery of NSAIDs. AAPS 2008, 10, 229–241. [Google Scholar] [CrossRef] [PubMed] [Green Version]
- Kim, S.J.; Toma, H.S.; Barnett, J.M.; Penn, J.S. Ketorolac inhibits choroidal neovascularization by suppression of retinal VEGF. Exp. Eye Res. 2010, 91, 537–543. [Google Scholar] [CrossRef] [PubMed] [Green Version]
- Avila-Vazquez, M.; Maffrand, R.; Sosa, M.; Franco, M.; De Alvarez, B.V.; Cafferata, M.L.; Bergel, E. Treatment of retinopathy of prematurity with topical ketorolac tromethamine: A preliminary study. BMC Pediatr. 2004, 7, 415. [Google Scholar] [CrossRef] [PubMed] [Green Version]
- Beharry, K.D.; Cai, C.L.; Sharma, P.; Bronshtein, V.; Valencia, G.B.; Lazzaro, D.R.; Aranda, J.V. Hydrogen peroxide accumulation in the choroid during intermittent hypoxia increases risk of severe oxygen-induced retinopathy in neonatal rats. Investig. Ophthalmol. Vis. Sci. 2013, 54, 7644–7657. [Google Scholar] [CrossRef] [Green Version]
- Beharry, K.D.; Cai, C.L.; Skelton, J.; Siddiqui, F.; D’Agrosa, C.; Calo, J.; Valencia, G.B.; Aranda, J.V. Oxygen-induced retinopathy from recurrent intermittent hypoxia is not dependent on resolution with room air or oxygen, in neonatal rats. Int. J. Mol. Sci. 2018, 19, 1337. [Google Scholar] [CrossRef] [Green Version]
- Beharry, K.D.; Cai, C.L.; Ahmad, T.; Guzel, S.; Valencia, G.B.; Aranda, J.V. Impact of chronic neonatal intermittent hypoxia on severity of retinal damage in a rat model of oxygen-induced retinopathy. J. Nat. Sci. 2018, 4, e488. [Google Scholar]
- Jones, M.K.; Szabó, I.L.; Kawanaka, H.; Husain, S.S.; Tarnawski, A.S. von Hippel Lindau tumor suppressor and HIF-1alpha: New targets of NSAIDs inhibition of hypoxia-induced angiogenesis. FASEB J. 2002, 16, 264–266. [Google Scholar] [CrossRef]
- Giurdanella, G.; Anfuso, C.D.; Olivieri, M.; Lupo, G.; Caporarello, N.; Eandi, C.M.; Drago, F.; Bucolo, C.; Salomone, S. Aflibercept, bevacizumab and ranibizumab prevent glucose-induced damage in human retinal pericytes in vitro, through a PLA2/COX-2/VEGF-A pathway. Biochem. Pharmacol. 2015, 96, 278–287. [Google Scholar] [CrossRef]
- Bailey, S.A.; Zidell, R.H.; Perry, R.W. Relationships between organ weight and body/brain weight in the rat: What is the best analytical endpoint? Toxicol. Pathol. 2004, 32, 448–466. [Google Scholar] [CrossRef] [PubMed]
- Löfqvist, C.; Hansen-Pupp, I.; Andersson, E.; Holm, K.; Smith, L.E.; Ley, D.; Hellström, A. Validation of a new retinopathy of prematurity screening method monitoring longitudinal postnatal weight and insulin like growth factor I. Arch. Ophthalmol. 2009, 127, 622–627. [Google Scholar] [CrossRef] [PubMed]
- Visca, A.; Bishop, C.T.; Hilton, S.; Hudson, V.M. Oral reduced L-glutathione improves growth in pediatric cystic fibrosis patients. J. Pediatr. Gastroenterol. Nutr. 2015, 60, 802–810. [Google Scholar] [CrossRef] [PubMed] [Green Version]
- Vij, A.G.; Kishore, K.; Dey, J. Effect of intermittent hypobaric hypoxia on efficacy & clearance of drugs. Indian J. Med. Res. 2012, 135, 211–216. [Google Scholar] [PubMed]
- Zhou, X.; Nian, Y.; Qiao, Y.; Yang, M.; Xin, Y.; Li, X. Hypoxia Plays a Key Role in the Pharmacokinetic Changes of Drugs at High Altitude. Curr. Drug Metab. 2018, 19, 960–969. [Google Scholar] [CrossRef]
- Cai, C.; Aranda, J.V.; Valencia, G.B.; Xu, J.; Beharry, K.D. Chronic Intermittent Hypoxia Causes Lipid Peroxidation and Altered Phase 1 Drug Metabolizing Enzymes in the Neonatal Rat Liver. React. Oxyg. Species 2017, 3, 218–236. [Google Scholar] [CrossRef]
- Dorfman, A.L.; Joly, S.; Hardy, P.; Chemtob, S.; Lachapelle, P. The effect of oxygen and light on the structure and function of the neonatal rat retina. Doc. Ophthalmol. 2009, 118, 37–54. [Google Scholar] [CrossRef] [PubMed]
- Binns, K.E.; Salt, T.E. Post eye-opening maturation of visual receptive field diameters in superior colliculus of normal- and dark-reared rats. Dev. Brain Res. 1997, 99, 263–266. [Google Scholar] [CrossRef]
- Zieske, J.D. Corneal Development associated with eyelid opening. Int. J. Dev. Biol. 2004, 48, 903–911. [Google Scholar] [CrossRef] [Green Version]
- Furman, M.; Crair, M.C. Synapse maturation is enhanced in the binocular region of the retinocollicular map prior to eye opening. J. Comp. Neurol. 2014, 522, 900–920. [Google Scholar] [CrossRef] [Green Version]
- Trachsel-Moncho, L.; Benlloch-Navarro, S.; Fernández-Carbonell, Á.; Ramírez-Lamelas, D.T.; Olivar, T.; Silvestre, D.; Poch, E.; Miranda, M. Oxidative stress and autophagy-related changes during retinal degeneration and development. Cell Death Dis. 2018, 9, 812. [Google Scholar] [CrossRef] [Green Version]
- Gaudana, R.; Ananthula, H.K.; Parenky, A.; Mitra, A.K. Ocular drug delivery. AAPS J. 2010, 12, 348–360. [Google Scholar] [CrossRef] [PubMed]
- Quaggin, S.E. Turning a blind eye to anti-VEGF toxicities. J. Clin. Investig. 2012, 122, 3849–3851. [Google Scholar] [CrossRef] [PubMed] [Green Version]
- Del Amo, E.M.; Rimpelä, A.K.; Heikkinen, E.; Kari, O.K.; Ramsay, E.; Lajunen, T.; Schmitt, M.; Pelkonen, L.; Bhattacharya, M.; Richardson, D.; et al. Pharmacokinetic aspects of retinal drug delivery. Prog. Ret. Eye Res. 2017, 57, 137–185. [Google Scholar] [CrossRef] [PubMed]
- Waltenberger, J.; Claesson-Welsh, L.; Siegbahn, A.; Shibuya, M.; Heldin, C.H. Different signal transduction properties of KDR and Flt1, two receptors for vascular endothelial growth factor. J. Biol. Chem. 1994, 269, 26988–26995. [Google Scholar]
- Gille, H.; Kowalski, J.; Li, B.; LeCouter, J.; Moffat, B.; Zioncheck, T.F.; Pelletier, N.; Ferrara, N. Analysis of biological effects and signaling properties of Flt-1 (VEGFR-1) and KDR (VEGFR-2). A reassessment using novel receptor-specific vascular endothelial growth factor mutants. J. Biol. Chem. 2001, 276, 3222–3230. [Google Scholar] [CrossRef] [PubMed] [Green Version]
- Shibuya, M. Vascular endothelial growth factor and its receptor system: Physiological functions in angiogenesis and pathological roles in various diseases. J. Biochem. 2013, 153, 13–19. [Google Scholar] [CrossRef] [PubMed] [Green Version]


| Weight P7 | Length P7 | Weight P14 | Length P14 | Weight P21 | Length P21 | |
|---|---|---|---|---|---|---|
| nGSH + PBS: | ||||||
| RA | 127.0 ± 8.4 | 29.0 ± 1.9 | 296.7 ± 19.2 | 92.6 ± 1.8 | 563.6 ± 17.1 | 114.2 ± 3.8 |
| IH | 78.9 ± 5.3 ## | 27.4 ± 1.3 | 190.5 ± 9.7 ## | 68.9 ± 3.4 ## | 390.8 ± 18.6 ## | 97.6 ± 1.8 ## |
| nGSH + ACV: | ||||||
| RA | 77.9 ± 2.8 ** | 28.0 ± 0.98 | 187.7 ± 4.6 ** | 56.6 ± 1.2 ** | 387.3 ± 9.7 ** | 93.0 ± 2.0 ** |
| IH | 92.0 ± 4.4 # | 26.5 ± 1.0 | 196.9 ± 10.4 | 51.7 ± 2.5 §§ | 390.0 ± 16.8 | 88.5 ± 2.4 |
| CoQ10 + ACV: | ||||||
| RA | 89.9 ± 5.8 ** | 33.3 ± 1.4 | 243.1 ± 9.9 ** | 61.2 ± 2.1 ** | 516.3 ± 18.2 | 104.3 ± 1.5 |
| IH | 94.7 ± 4.4 # | 27.3 ± 1.9 | 205.4 ± 6.9 ## | 49.4 ± 2.6 §§,## | 424.0 ± 15.6 ## | 87.6 ± 3.5 ## |
| n-3 PUFAs+ ACV: | ||||||
| RA | 63.2 ± 4.1 ** | 24.0 ± 1.1 | 191.8 ± 6.2 ** | 54.9 ± 1.1 ** | 418.1 ± 15.4 ** | 90.0 ± 2.0 ** |
| IH | 73.5 ± 6.4 | 23.1 ± 1.1 | 183.7 ± 10.5 | 45.0 ± 2.0 §§,## | 328.2 ± 17.4 ## | 83.1 ± 1.8 §§,# |
| CoQ10 + n-3 PUFAs+ PBS: | ||||||
| RA | 92.2 ± 4.2 ** | 34.3 ± 1.0 * | 222.7 ± 9.3 ** | 59.2 ± 2.4 ** | 456.2 ± 21.2 ** | 93.8 ± 2.7 ** |
| IH | 88.9 ± 4.1 ## | 24.0 ± 1.1 ## | 213.9 ± 6.5 | 47.6 ± 1.0 §§,## | 398.9 ± 13.1# | 84.9 ± 1.7 §§,## |
| CoQ10 + n-3 PUFAs + ACV: | ||||||
| RA | 80.2 ± 5.5 ** | 35.2 ± 1.5 * | 209.7 ± 8.8 ** | 60.4 ± 1.9 ** | 451.5 ± 17.9 ** | 97.7 ± 2.2 ** |
| IH | 83.3 ± 4.0 | 22.7 ± 0.94 ## | 219.7 ± 8.6 | 56.9 ± 2.3 §§ | 438.7 ± 16.1 | 95.7 ± 2.9 |
| RA | IH | |||||
|---|---|---|---|---|---|---|
| Left Eye | Right Eye | Both Eyes | Left Eye | Right Eye | Both Eyes | |
| nGSH + PBS | 17 (94%) | 17 (94%) | 17 (94%) | 7 (39%) ** | 8 (44%) ** | 6 (33%) ** |
| nGSH + ACV | 18 (100%) | 18 (100%) | 18 (100%) | 12 (67%) ** | 12 (67%) ** | 11 (61%) ** |
| CoQ10 + ACV | 15 (83%) | 15 (83%) | 14 (78%) | 15 (83%) | 13 (72%) | 13 (72%) |
| n-3 PUFAs + ACV | 14 (78%) | 14 (78%) | 14 (78%) | 8 (47%) | 8 (47%) | 8 (47%) |
| CoQ10 + n-3 PUFAs + PBS | 18 (100%) | 17 (94%) | 17 (94%) | 10 (56%) ** | 8 (44%) ** | 8 (44%) ** |
| CoQ10 + n-3 PUFAs + ACV | 17 (94%) | 17 (94%) | 17 (94%) | 18 (100%) | 16 (89%) | 16 (89%) |
| Group | Tortuosity Index | Artery Diameter (µm) | Vein Diameter (µm) | No. Cells in NFL/GCL | Total Retinal Thickness (µm) | NFL/GCL Thickness (µm) | IPL Thickness (µm) | INL Thickness (µm) | ONL Thickness (µm) |
|---|---|---|---|---|---|---|---|---|---|
| 1: | |||||||||
| RA | 1.01 ± 0.002 | 27.6 ± 0.69 | 40.6 ± 1.5 | 129.3 ± 13.4 | 289.5 ± 7.2 | 33.5 ± 1.4 | 54.0 ± 1.8 | 54.0 ± 1.5 | 91.5 ± 3.4 |
| IH | 1.03 ± 0.003 ## | 29.5 ± 0.57 # | 41.6 ± 0.95 | 273.7 ± 20.0 ## | 290.9 ± 8.5 | 48.8 ± 2.3 ## | 59.6 ± 2.1 # | 57.8 ± 2.1 | 83.7 ± 2.9 |
| 2: | |||||||||
| RA | 1.02 ± 0.003 | 28.4 ± 0.63 | 41.9 ± 1.08 | 194.4 ± 14.0 ** | 308.9 ± 8.3 | 41.2 ± 2.1 | 53.4 ± 2.0 | 61.4 ± 2.7 | 91.5 ± 2.3 |
| IH | 1.03 ± 0.003 # | 28.7 ± 0.61 | 39.6 ± 1.1 ## | 304.3 ± 14.8 ## | 319.5 ± 11.3 | 51.9 ± 2.2 ## | 71.8 ± 3.8 §,## | 83.6 ± 3.8 §§,## | 112.1 ± 4.6 §§,## |
| 3: | |||||||||
| RA | 1.02 ± 0.004 | 32.9 ± 0.88 ** | 45.3 ± 1.2 | 219.3 ± 7.8 ** | 313.1 ± 12.1 | 40.8 ± 1.7 | 54.7 ± 2.5 | 63.3 ± 3.5 | 93.5 ± 2.5 |
| IH | 1.05 ± 0.014 ## | 28.9 ± 0.62 # | 42.8 ± 1.1 | 296.8 ± 11.0 ## | 319.9 ± 11.4 | 52.8 ± 3.2 ## | 59.6 ± 3.4 | 66.1 ± 3.3 | 95.0 ± 2.9 |
| 4: | |||||||||
| RA | 1.03 ± 0.006 * | 27.8 ± 0.59 | 47.9 ± 1.3 ** | 213.6 ± 8.1 ** | 255.3 ± 5.5 | 37.6 ± 1.7 | 48.9 ± 1.8 | 45.9 ± 1.8 | 77.9 ± 1.6 * |
| IH | 1.07 ± 0.015 §§,## | 29.1 ± 0.63 §§ | 38.2 ± 0.78 ## | 275.7 ± 10.8 ## | 301.7 ± 8.3 ## | 49.9 ± 1.7 ## | 56.1 ± 1.9 ## | 57.9 ± 2.6 ## | 89.5 ± 2.7 ## |
| 5: | |||||||||
| RA | 1.03 ± 0.003 * | 26.6 ± 0.63 | 43.8 ± 1.2 | 223.6 ± 16.9 ** | 318.1 ± 8.9 | 46.3 ± 3.2 ** | 62.2 ± 3.6 | 62.0 ± 3.3 | 93.9 ± 2.9 |
| IH | 1.08 ± 0.008 §§,## | 29.2 ± 0.65 ## | 44.2 ± 1.03 | 265.2 ± 8.4 §§,## | 272.2 ± 5.8 ## | 45.6 ± 1.5 | 47.0 ± 1.4 ## | 51.6 ± 1.4 ## | 97.7 ± 3.6 § |
| 6: | |||||||||
| RA | 1.02 ± 0.004 | 29.4 ± 0.64 | 44.4 ± 1.2 | 187.9 ± 13.8 ** | 313.0 ± 13.2 | 47.9 ± 2.8 ** | 57.5 ± 1.9 | 64.9 ± 3.3 | 89.6 ± 4.4 |
| IH | 1.03 ± 0.004 ## | 27.7 ± 0.71 | 43.8 ± 1.4 | 204.8 ± 13.3 §§,## | 309.4 ± 5.9 | 40.3 ± 1.9 | 59.7 ± 1.8 | 57.3 ± 1.5# | 83.4 ± 2.2 |
© 2020 by the authors. Licensee MDPI, Basel, Switzerland. This article is an open access article distributed under the terms and conditions of the Creative Commons Attribution (CC BY) license (http://creativecommons.org/licenses/by/4.0/).
Share and Cite
Beharry, K.D.; Cai, C.L.; Siddiqui, F.; D’Agrosa, C.; Zangaladze, A.; Mustafa, G.; Qadri, A.; Duggan, T.J.; Aranda, J.V. Combination Antioxidant/NSAID Therapies and Oral/Topical Ocular Delivery Modes for Prevention of Oxygen-Induced Retinopathy in a Rat Model. Nutrients 2020, 12, 1980. https://0-doi-org.brum.beds.ac.uk/10.3390/nu12071980
Beharry KD, Cai CL, Siddiqui F, D’Agrosa C, Zangaladze A, Mustafa G, Qadri A, Duggan TJ, Aranda JV. Combination Antioxidant/NSAID Therapies and Oral/Topical Ocular Delivery Modes for Prevention of Oxygen-Induced Retinopathy in a Rat Model. Nutrients. 2020; 12(7):1980. https://0-doi-org.brum.beds.ac.uk/10.3390/nu12071980
Chicago/Turabian StyleBeharry, Kay D., Charles L. Cai, Faisal Siddiqui, Christina D’Agrosa, Anano Zangaladze, Ghassan Mustafa, Areej Qadri, Thomas J. Duggan, and Jacob V. Aranda. 2020. "Combination Antioxidant/NSAID Therapies and Oral/Topical Ocular Delivery Modes for Prevention of Oxygen-Induced Retinopathy in a Rat Model" Nutrients 12, no. 7: 1980. https://0-doi-org.brum.beds.ac.uk/10.3390/nu12071980