Effect of Choline Forms and Gut Microbiota Composition on Trimethylamine-N-Oxide Response in Healthy Men

 and
and
Abstract
: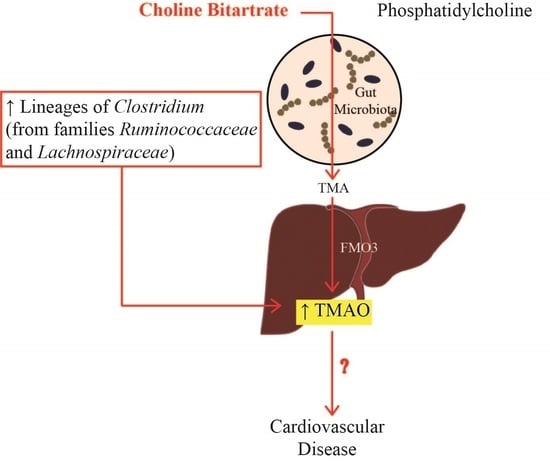
1. Introduction
2. Materials and Methods
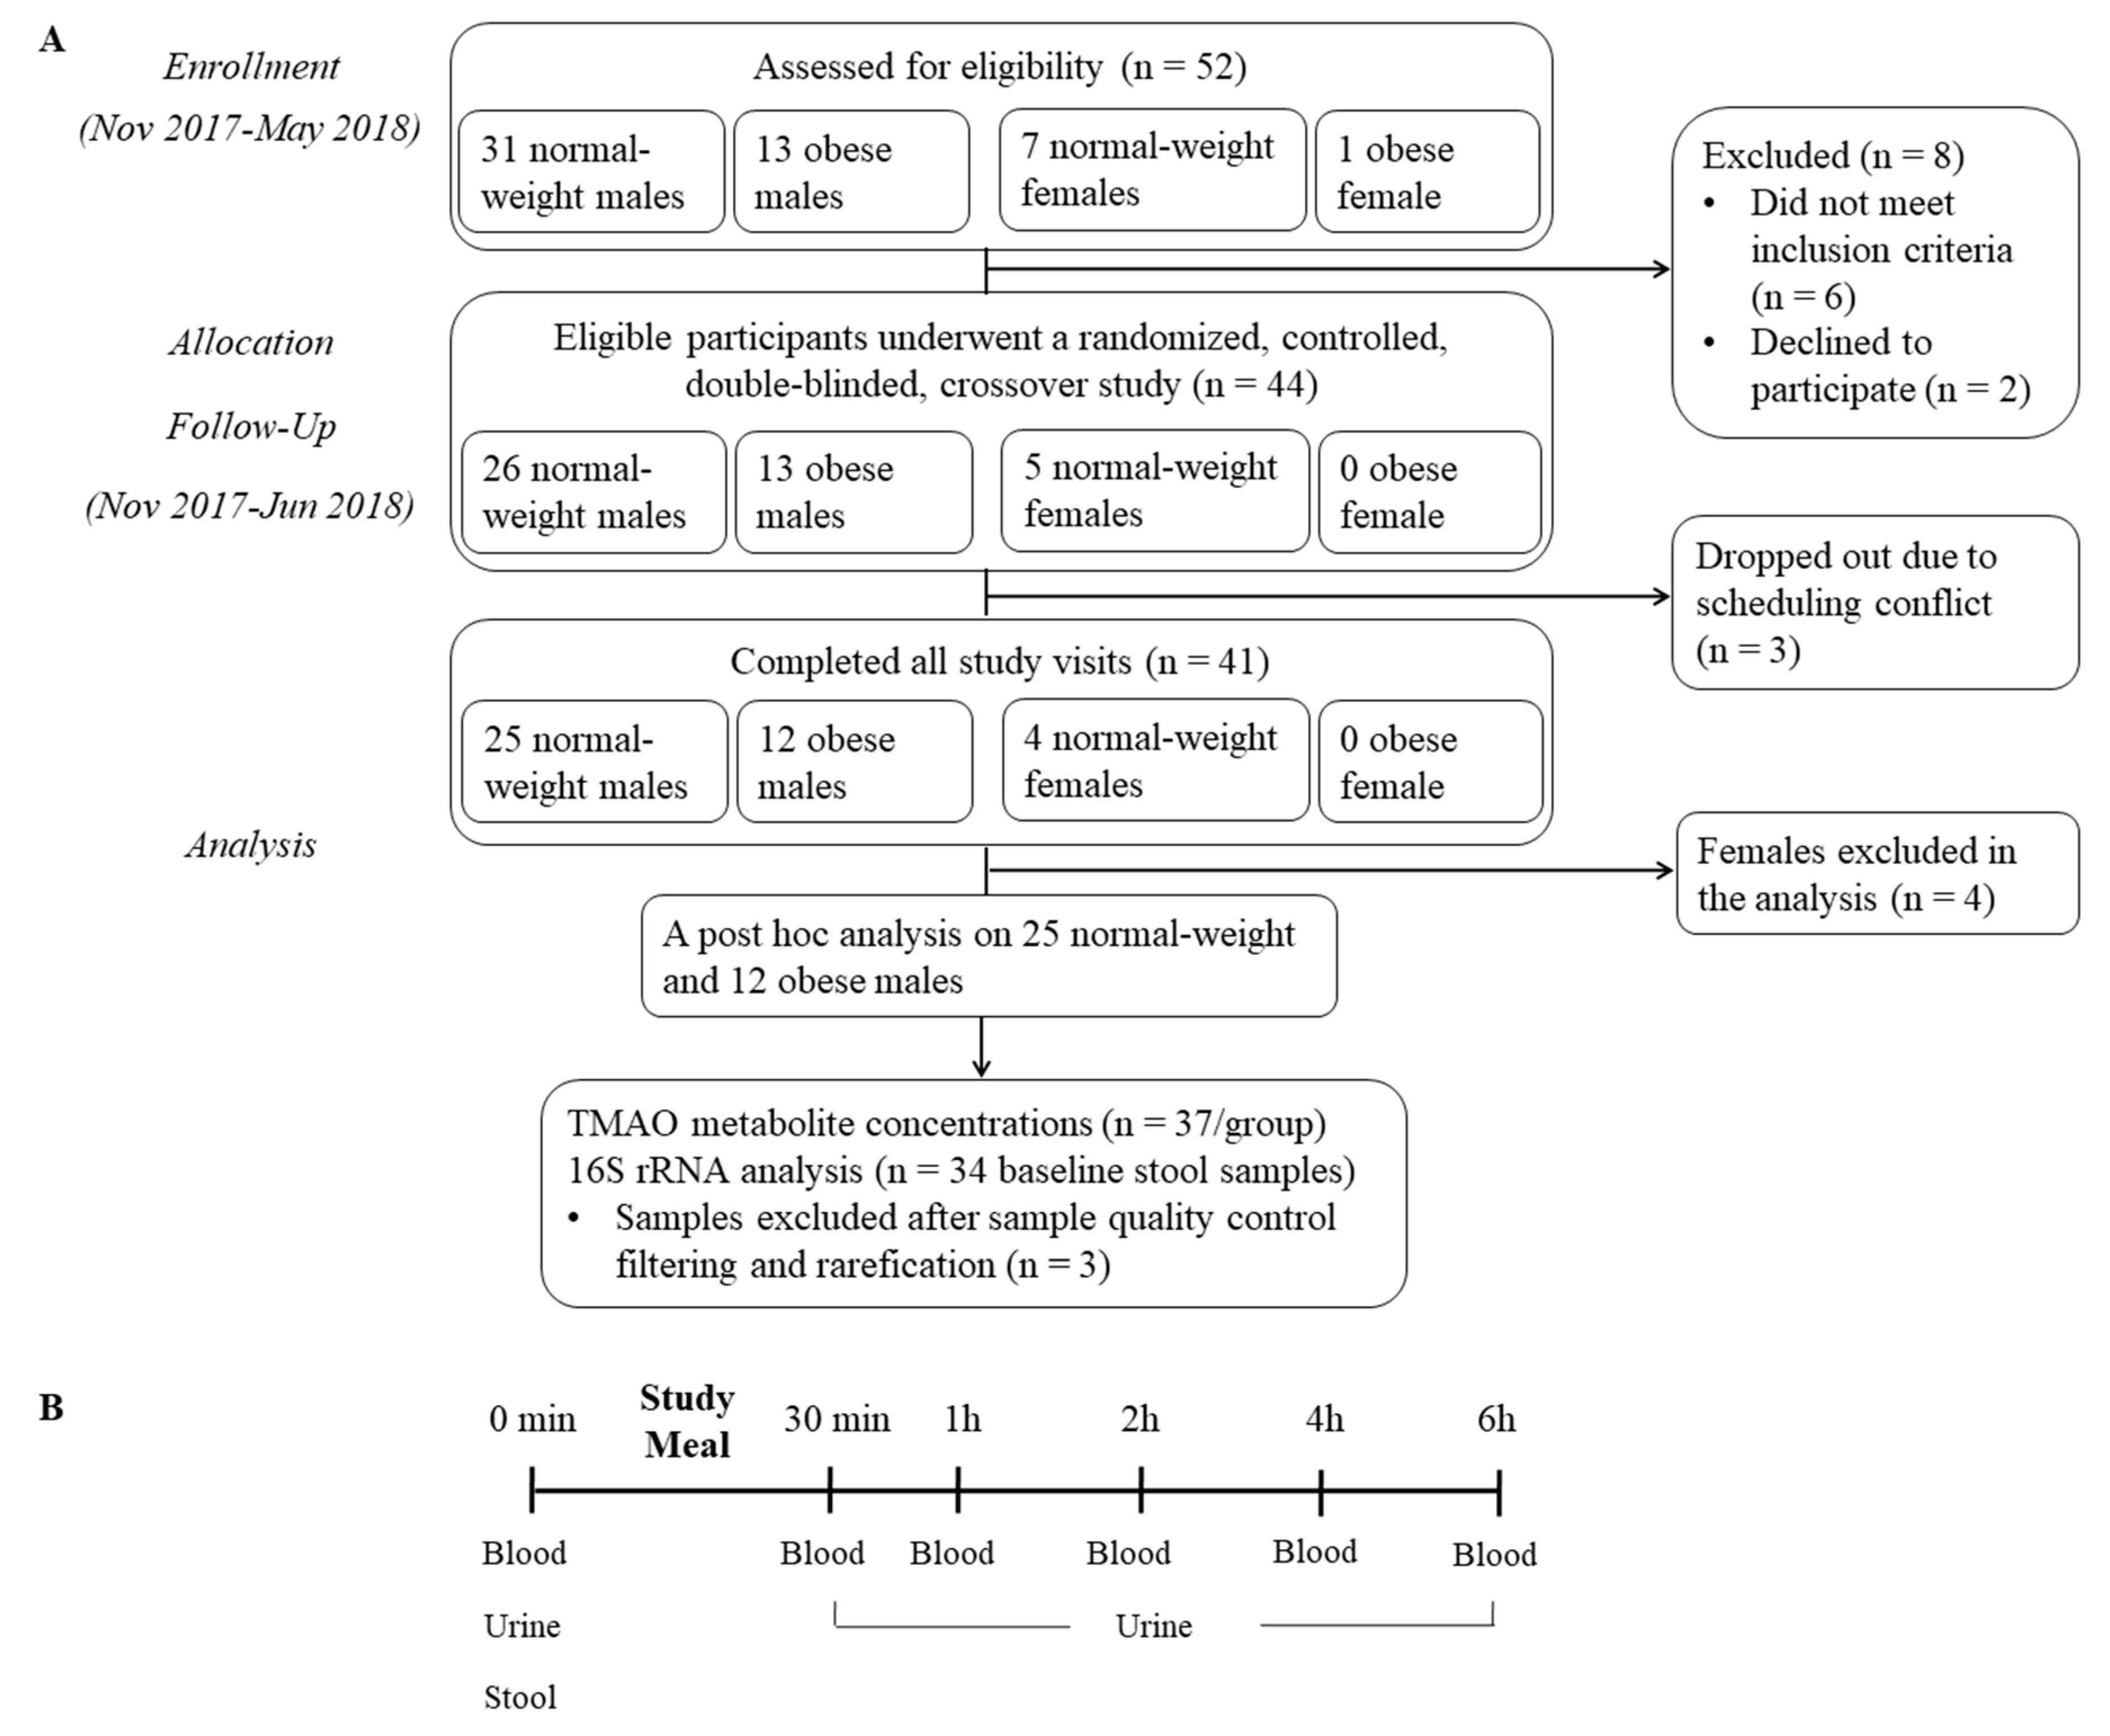
2.1. Subjects
2.2. Design
2.3. Protocol
2.4. Sample Collection
2.4.1. Serum and Whole Blood
2.4.2. Plasma and Buffy Coat
2.4.3. Urine
2.4.4. Stool
2.4.5. Study Meal Homogenate
2.5. Analytical Methodology
2.5.1. Screening Blood Chemistry and Complete Cell Counts
2.5.2. TMAO and Choline Measurements in Study Meal, Plasma and Urine
2.5.3. 16S rRNA Gene Sequencing
2.5.4. FMO3 Genotype
2.6. Statistical Analyses
3. Results
3.1. Participant Characteristics
3.2. Food Choline, Betaine and TMAO Content
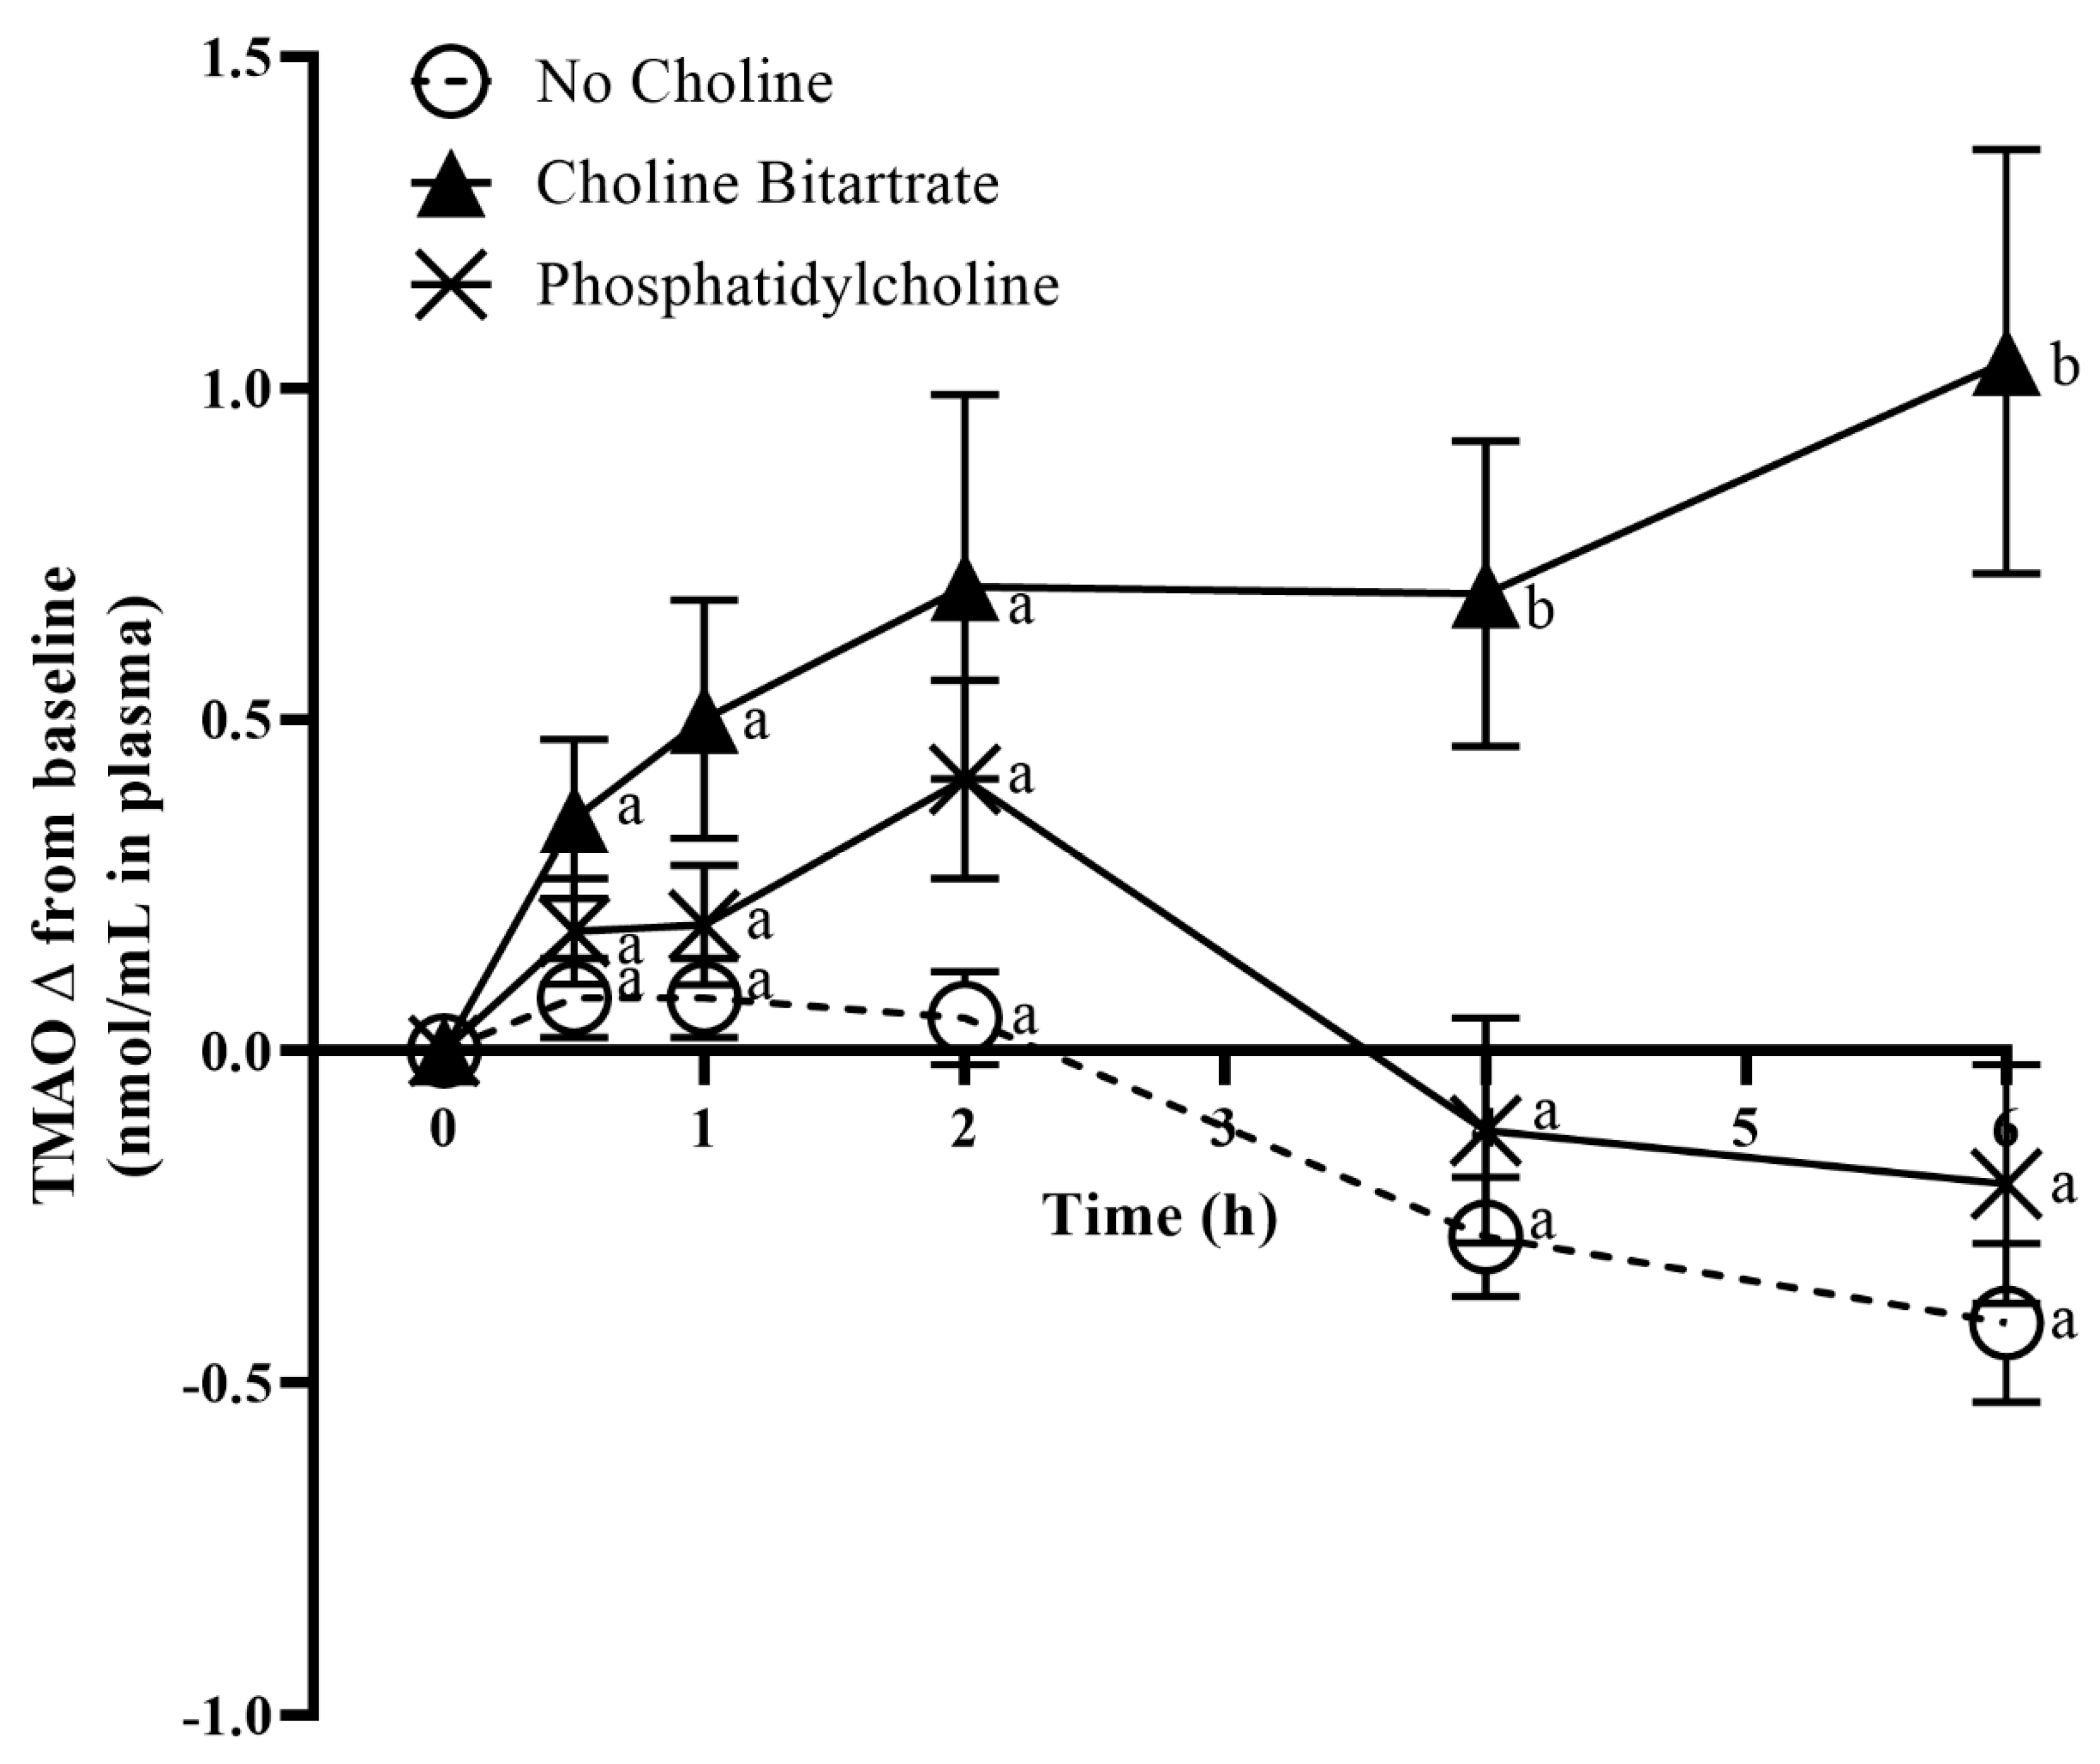
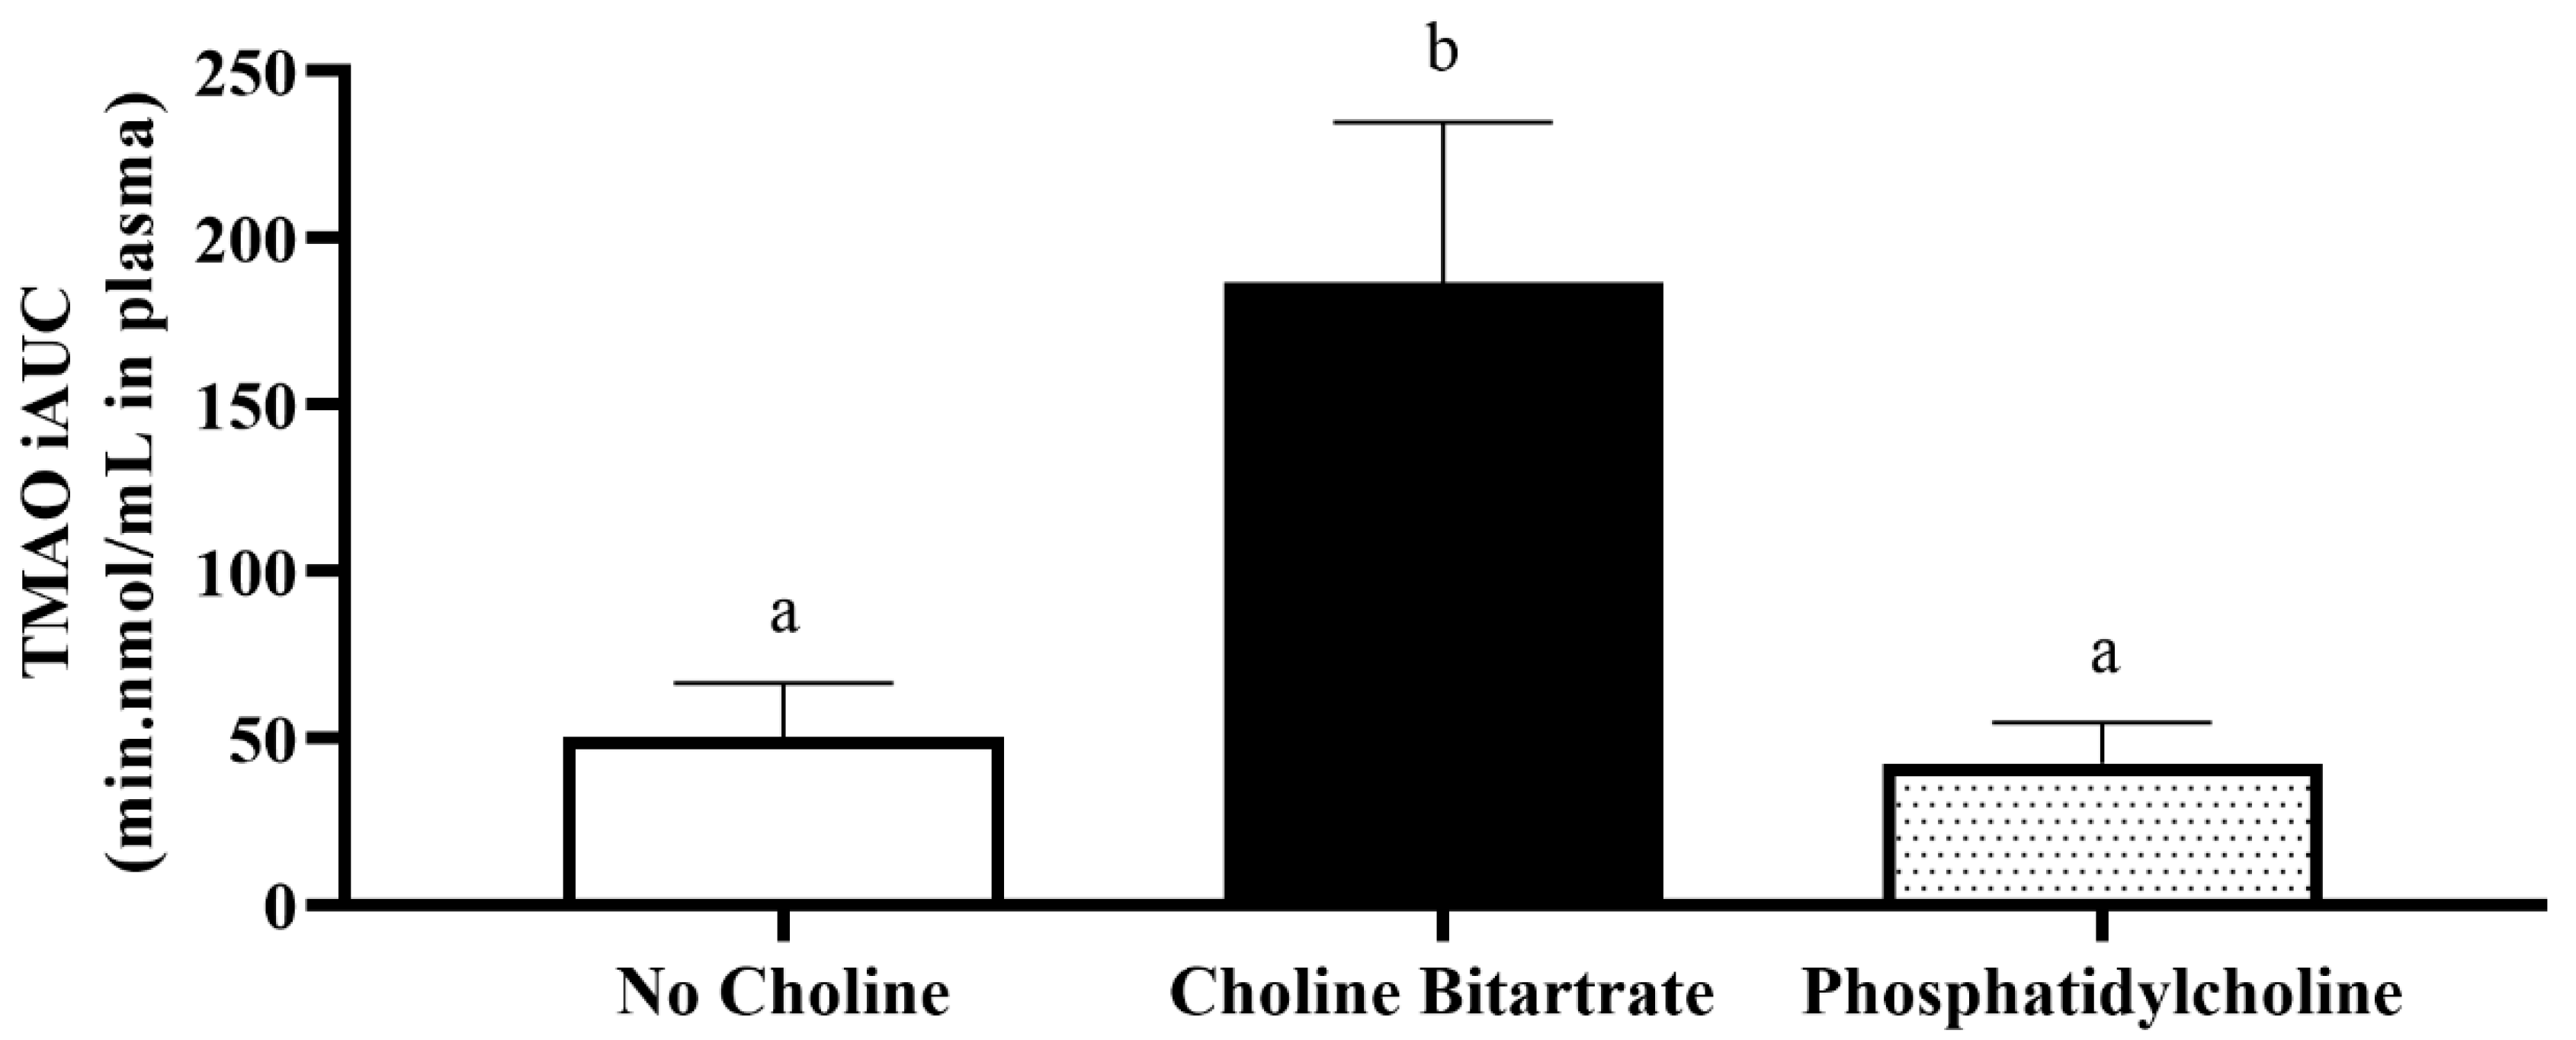
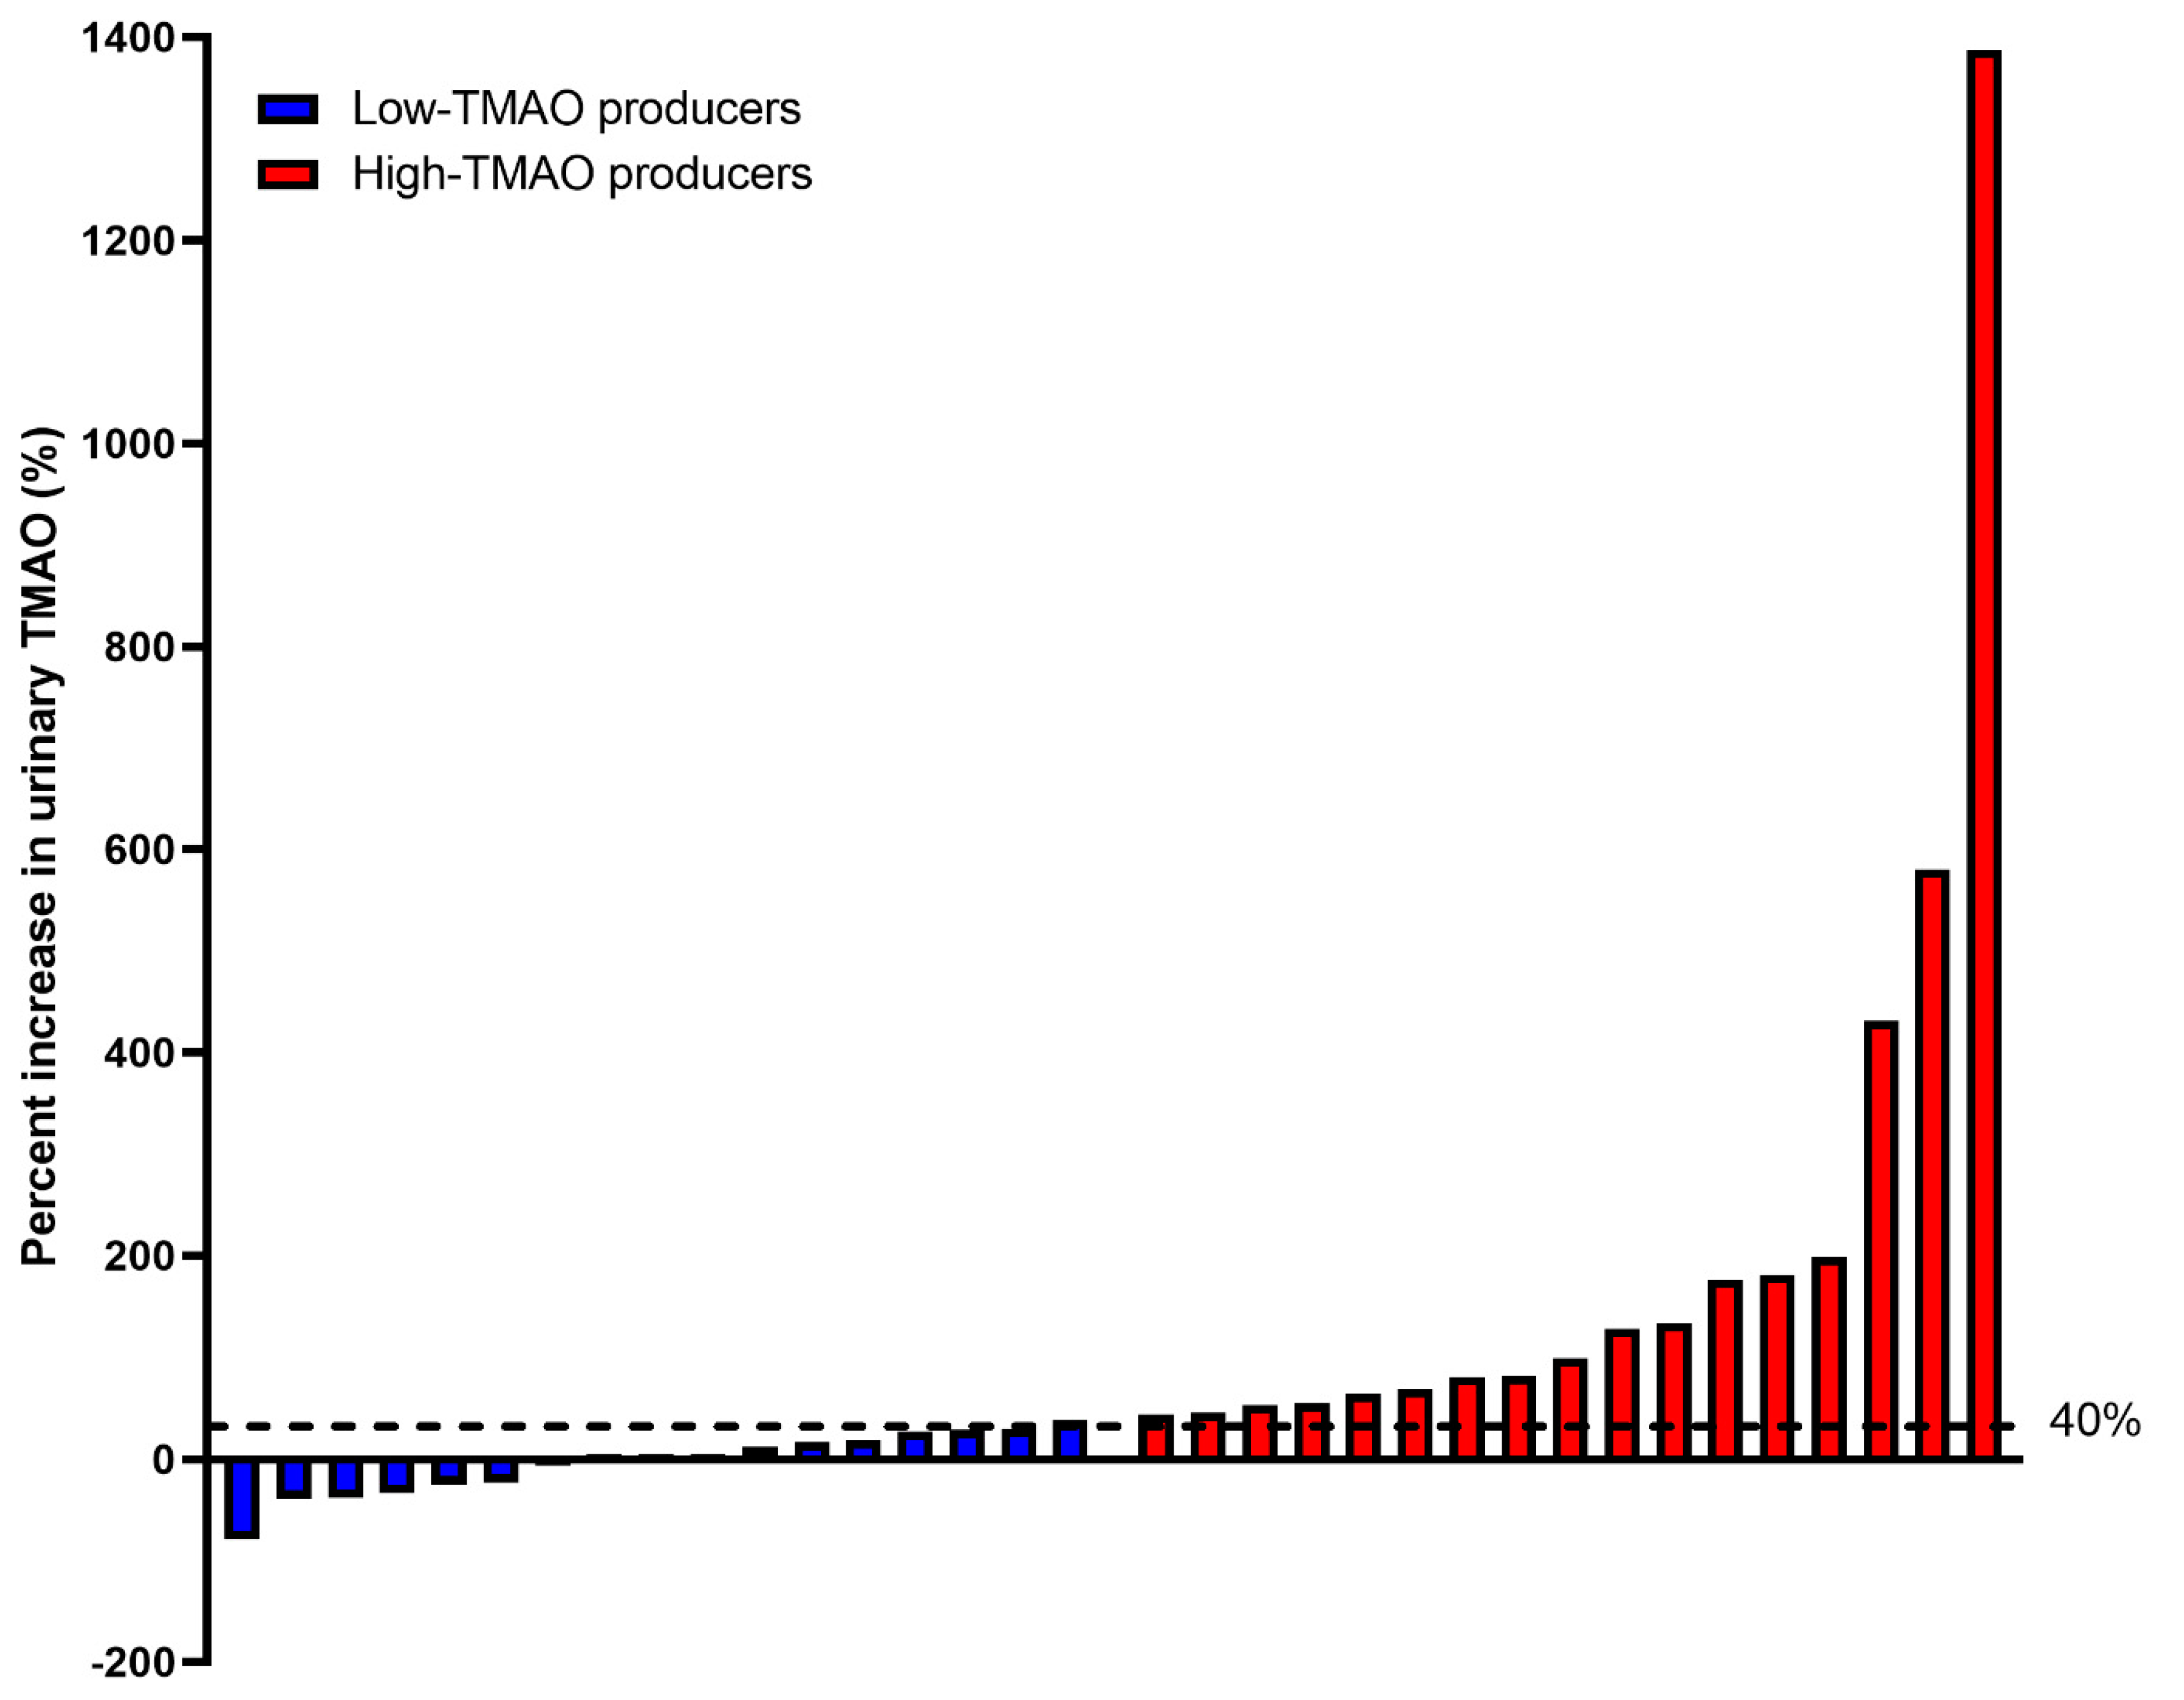
3.3. TMAO Response to Choline Bitartrate and Phosphatidylcholine
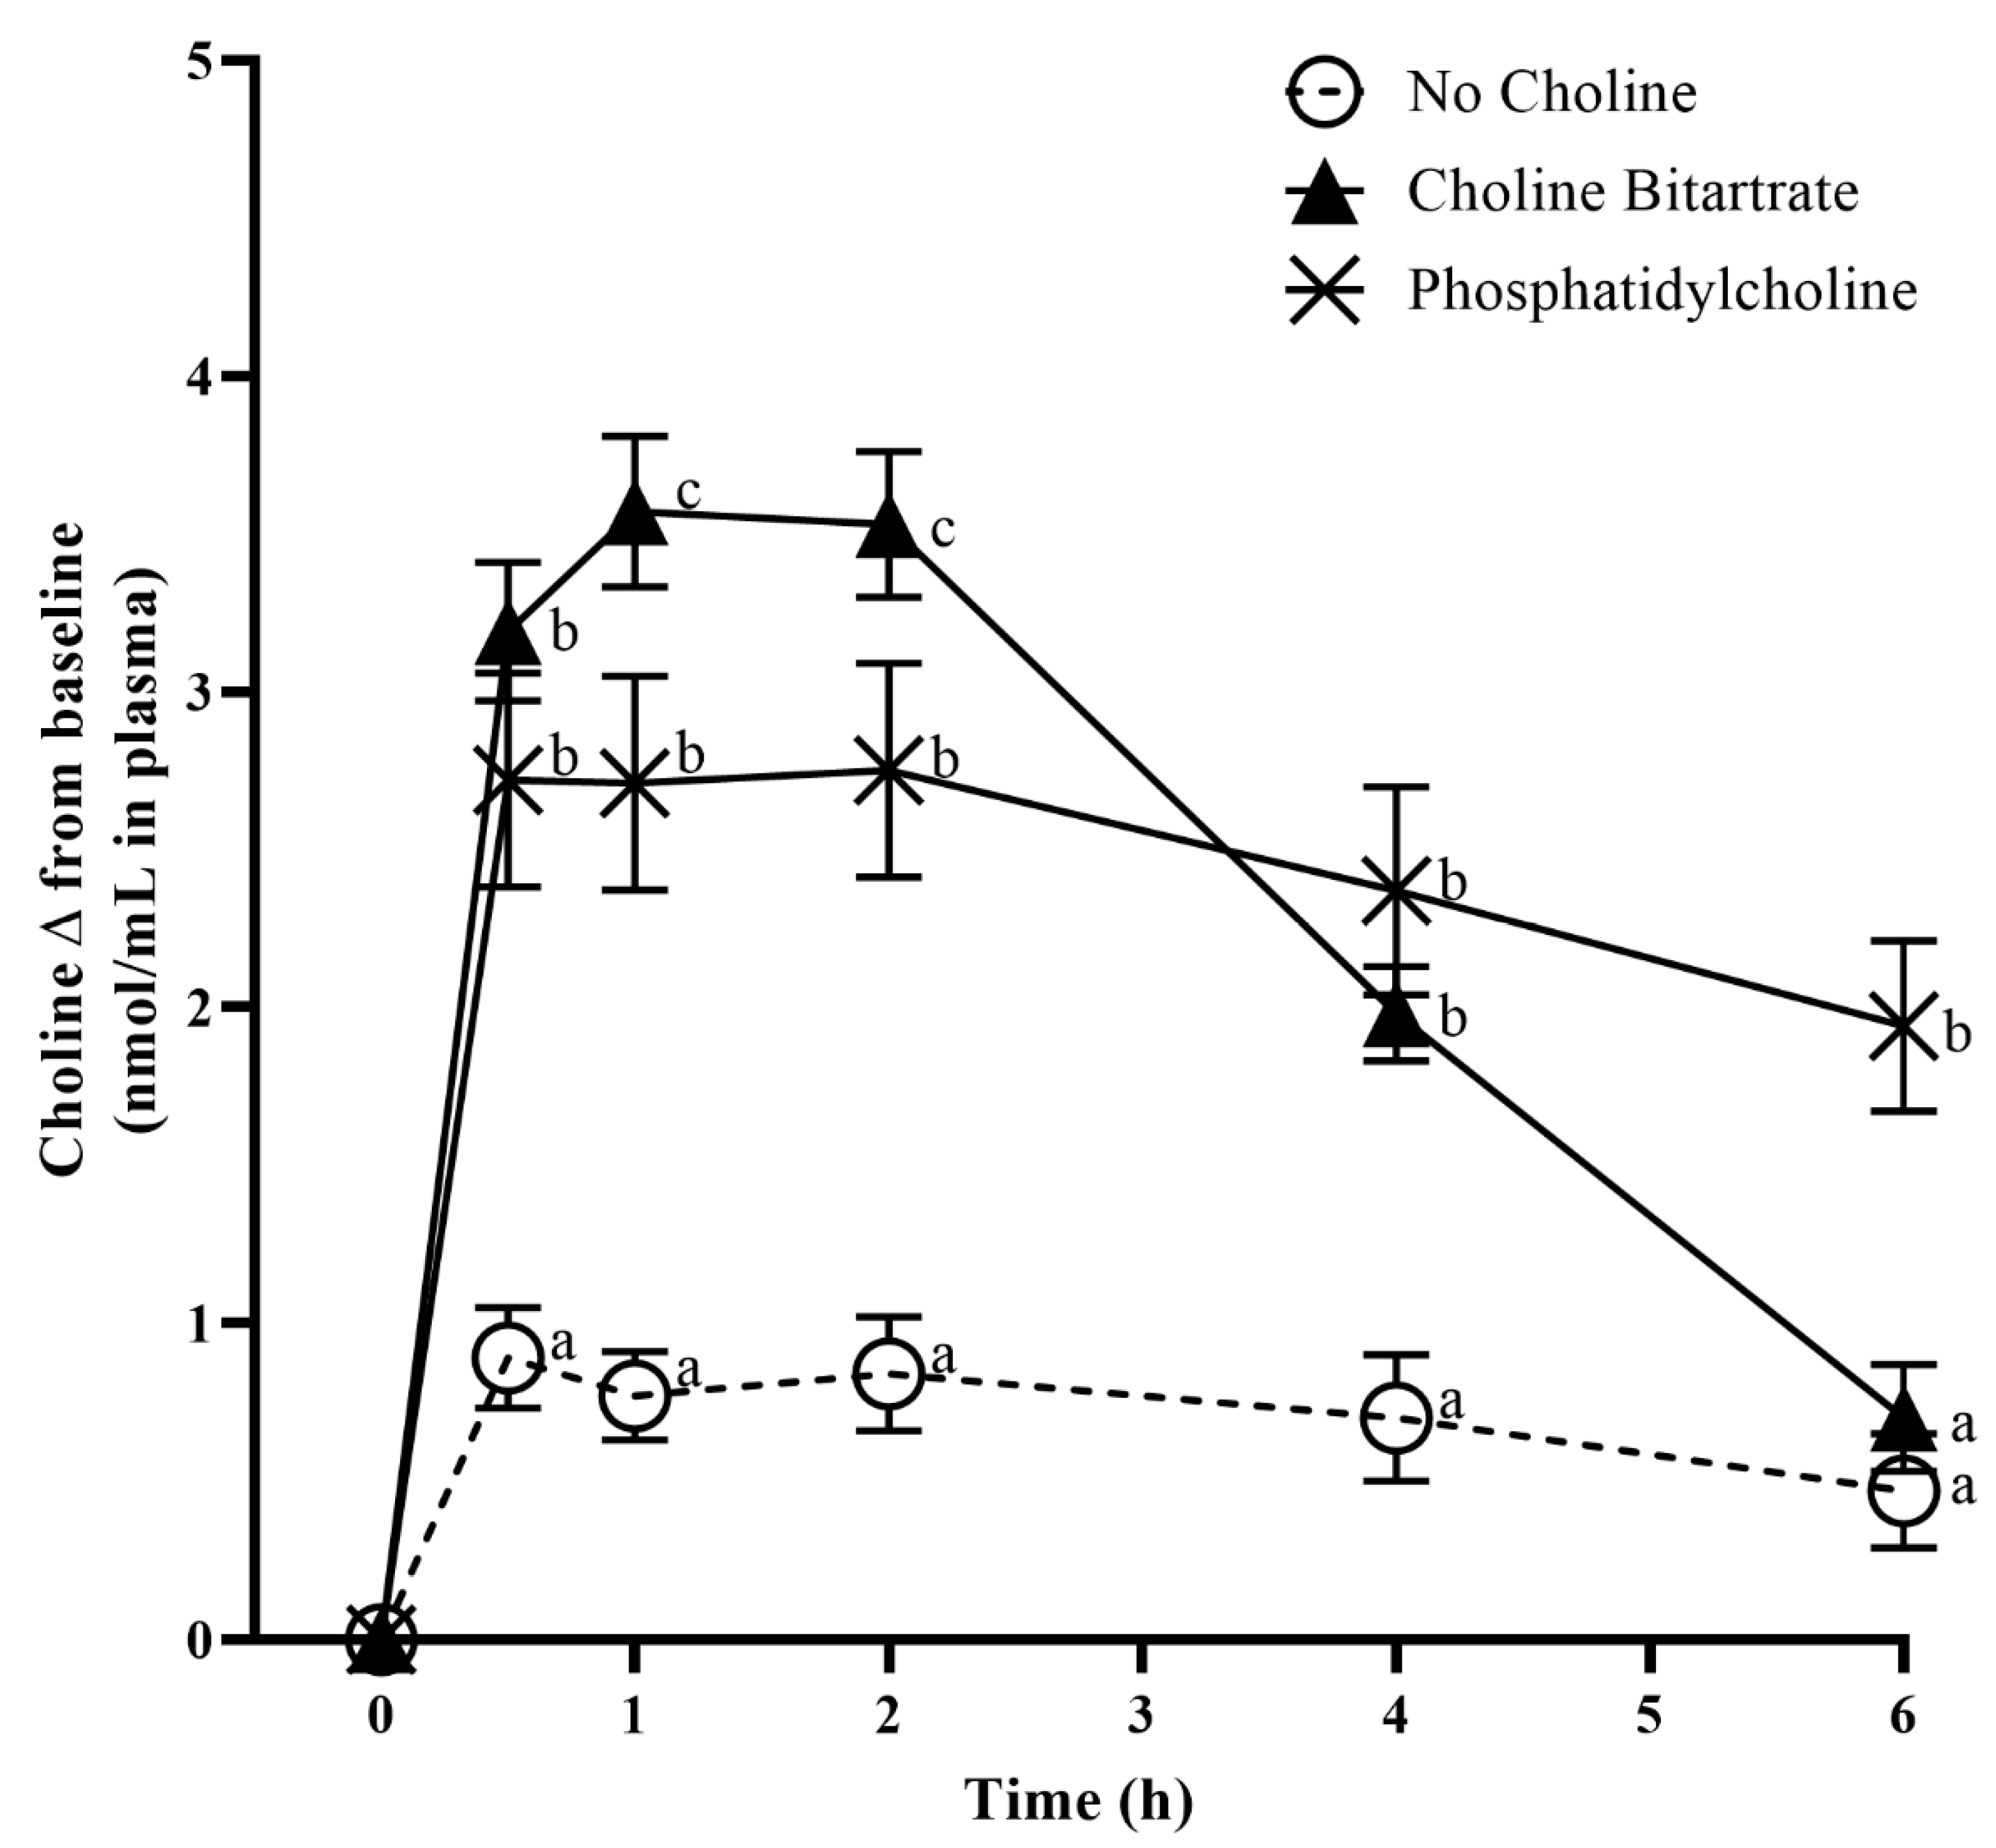
3.4. Choline Response to Choline Bitartrate and Phosphatidylcholine
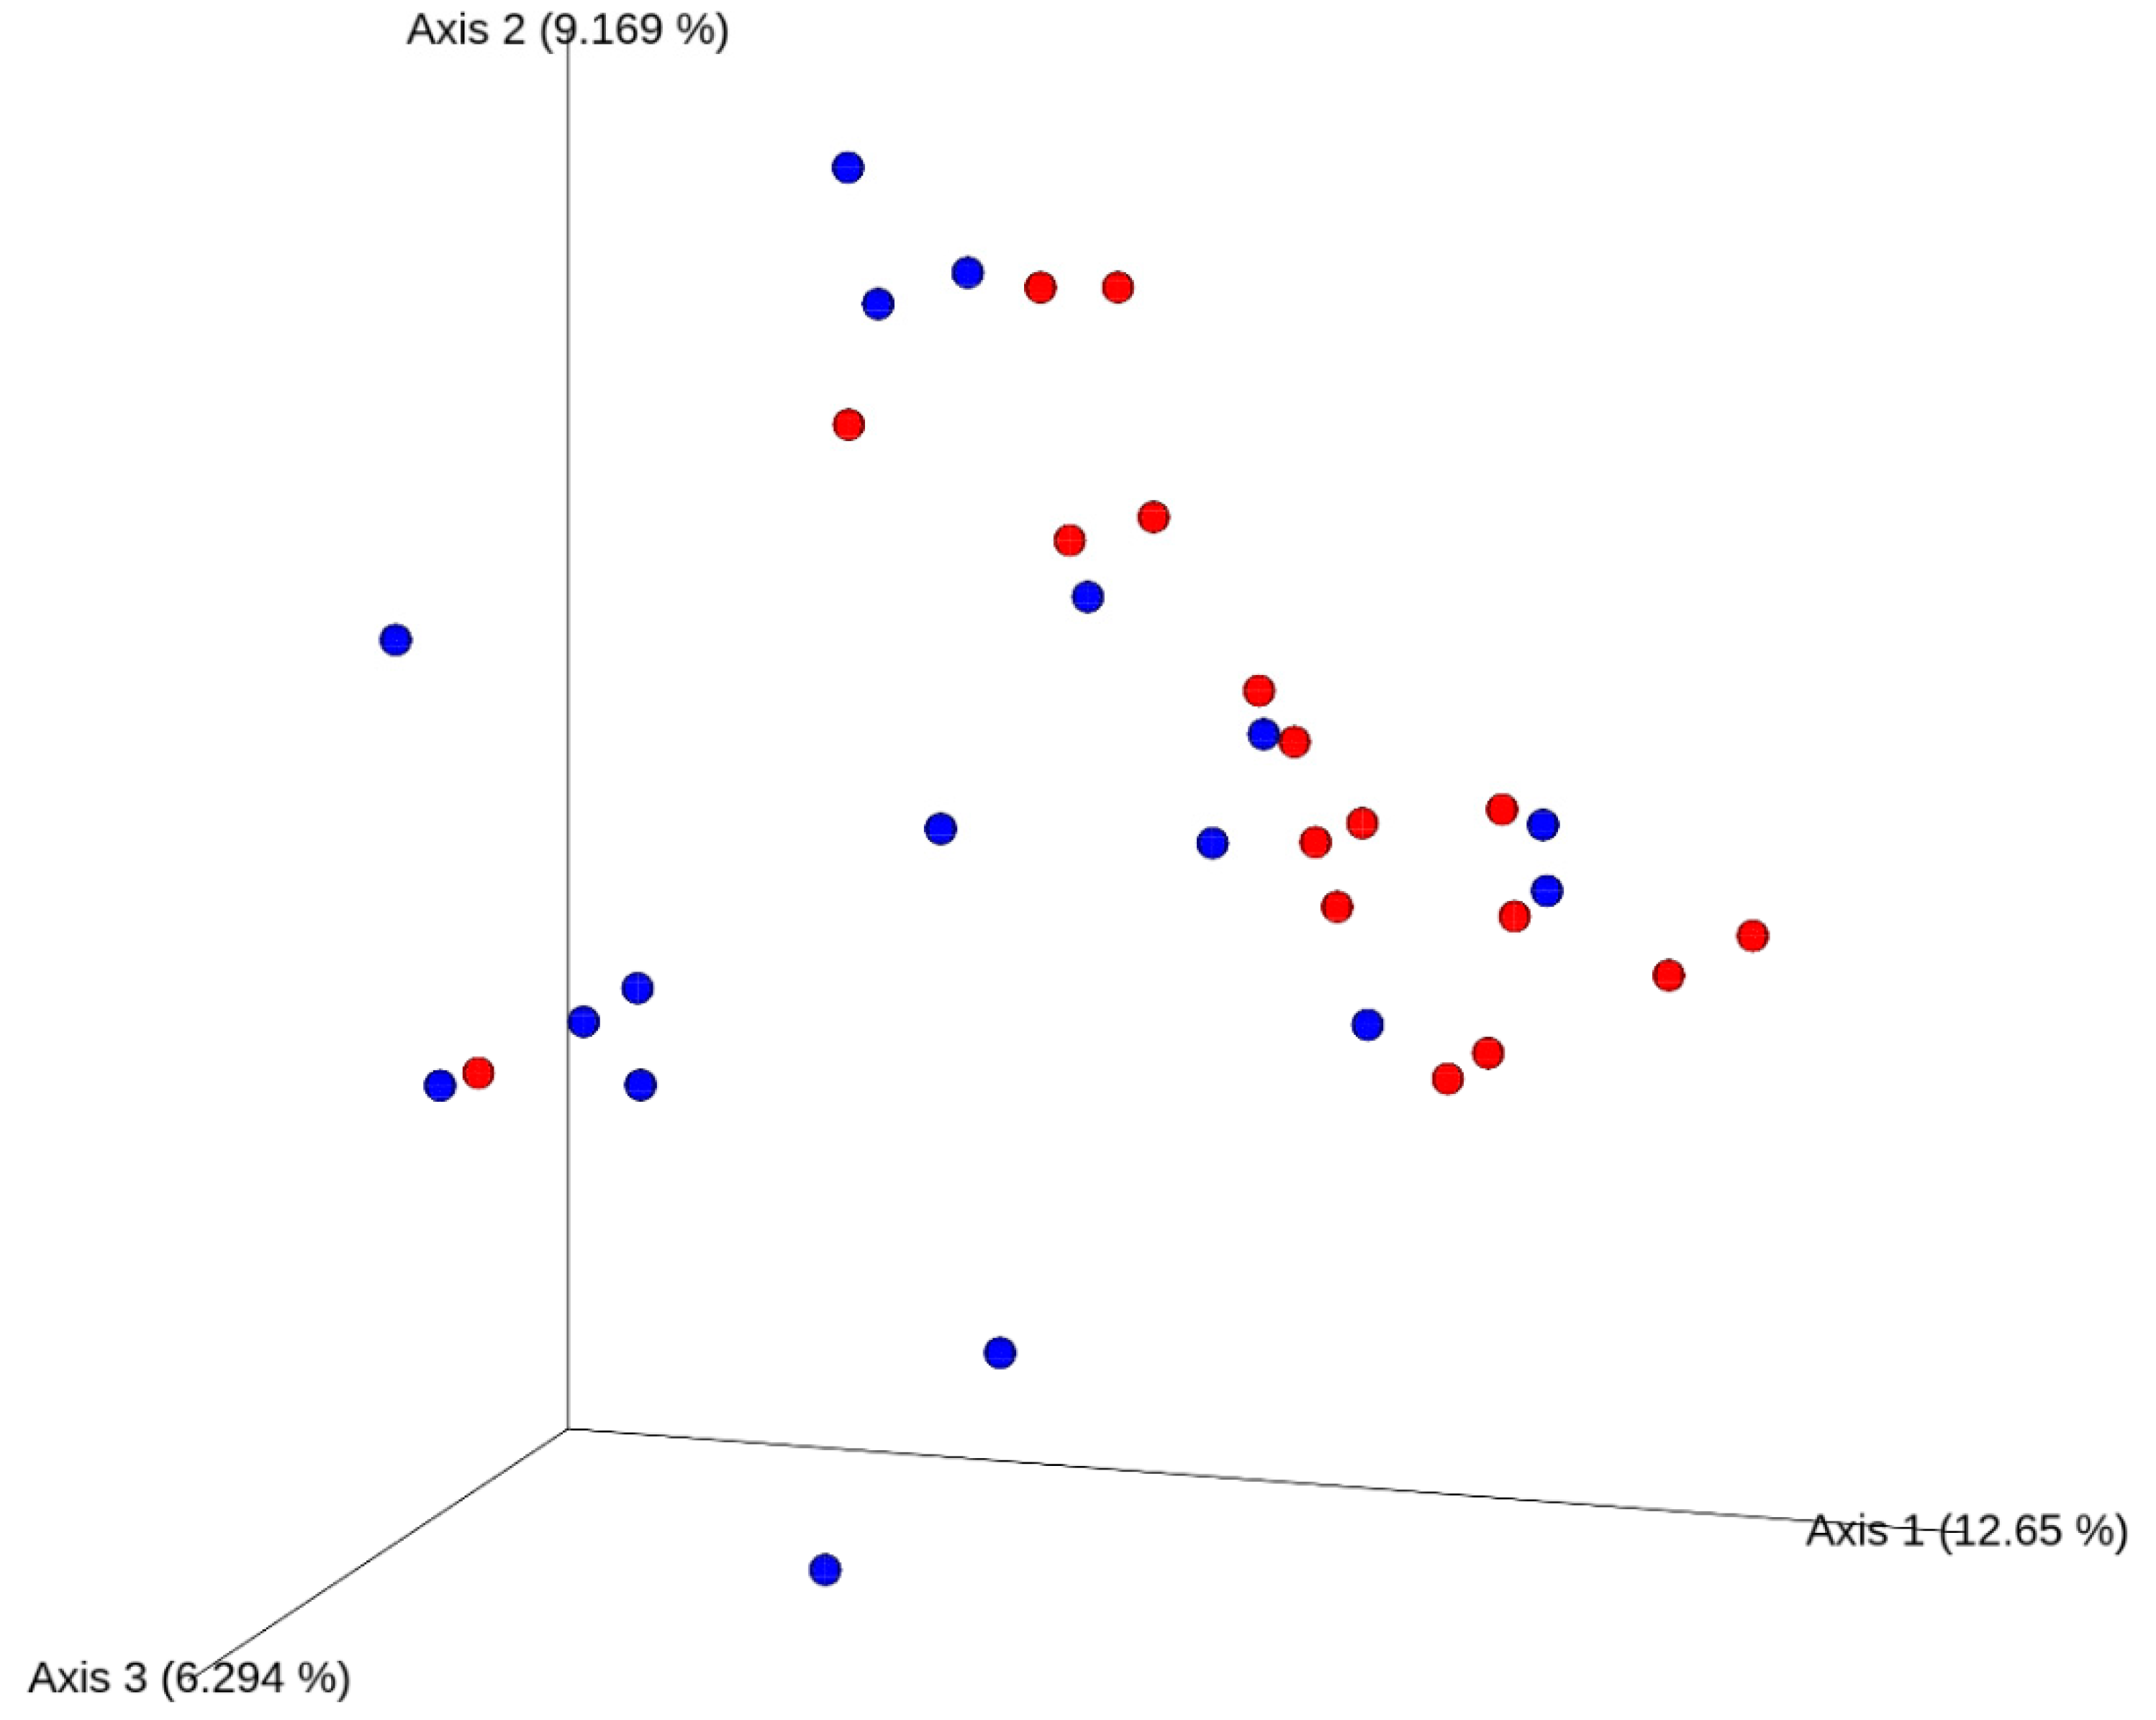
3.5. Gut Microbiota Composition
4. Discussion
Supplementary Materials
Author Contributions
Funding
Acknowledgments
Conflicts of Interest
Abbreviations
| Cr | creatinine |
| FMO3 | Flavin-containing monooxygenase 3 |
| iAUC | incremental area under the curve |
| LC-MS/MS | liquid chromatography-tandem mass spectrometry |
| PCoA | principal coordinate analysis |
| TMA | trimethylamine |
| TMAO | trimethylamine-N-oxide |
References
- Tang, W.H.; Wang, Z.; Levison, B.S.; Koeth, R.A.; Britt, E.B.; Fu, X.; Wu, Y.; Hazen, S.L. Intestinal microbial metabolism of phosphatidylcholine and cardiovascular risk. N. Engl. J. Med. 2013, 368, 1575–1584. [Google Scholar] [CrossRef] [PubMed] [Green Version]
- Wang, Z.; Klipfell, E.; Bennett, B.J.; Koeth, R.; Levison, B.S.; Dugar, B.; Feldstein, A.E.; Britt, E.B.; Fu, X.; Chung, Y.M.; et al. Gut flora metabolism of phosphatidylcholine promotes cardiovascular disease. Nature 2011, 472, 57–63. [Google Scholar] [CrossRef] [PubMed] [Green Version]
- Zeisel, S.H.; Mar, M.H.; Howe, J.C.; Holden, J.M. Concentrations of choline-containing compounds and betaine in common foods. J. Nutr. 2003, 133, 1302–1307. [Google Scholar] [CrossRef] [PubMed]
- Caudill, M.A.; Miller, J.W.; Gregory, J.F.; Shane, B. Folate, Choline, Vitamin B-12 and Vitamin B-6. In Biochemical, Physiological, & Molecular Aspects of Human Nutrition, 3rd ed.; Stipanuk, M.H., Caudill, M.A., Eds.; Elsevier Saunders: St. Louis, MO, USA, 2012; pp. 565–608. [Google Scholar]
- Zeisel, S.H.; Wishnok, J.S.; Blusztajn, J.K. Formation of methylamines from ingested choline and lecithin. J. Pharmacol. Exp. Ther. 1983, 225, 320–324. [Google Scholar] [PubMed]
- Growdon, J.H.; Cohen, E.L.; Wurtman, R.J. Effects of oral choline administration on serum and CSF choline levels in patients with Huntington’s disease. J. Neurochem. 1977, 28, 229–231. [Google Scholar] [CrossRef]
- Miller, C.A.; Corbin, K.D.; da Costa, K.A.; Zhang, S.; Zhao, X.; Galanko, J.A.; Blevins, T.; Bennett, B.J.; O’Connor, A.; Zeisel, S.H. Effect of egg ingestion on trimethylamine-N-oxide production in humans: A randomized, controlled, dose-response study. Am. J. Clin. Nutr. 2014, 100, 778–786. [Google Scholar] [CrossRef] [Green Version]
- Yan, J.; Jiang, X.; West, A.A.; Perry, C.A.; Malysheva, O.V.; Devapatla, S.; Pressman, E.; Vermeylen, F.; Stabler, S.P.; Allen, R.H.; et al. Maternal choline intake modulates maternal and fetal biomarkers of choline metabolism in humans. Am. J. Clin. Nutr. 2012, 95, 1060–1071. [Google Scholar] [CrossRef] [Green Version]
- Cho, C.E.; Taesuwan, S.; Malysheva, O.V.; Bender, E.; Tulchinsky, N.F.; Yan, J.; Sutter, J.L.; Caudill, M.A. Trimethylamine-N-oxide (TMAO) response to animal source foods varies among healthy young men and is influenced by their gut microbiota composition: A randomized controlled trial. Mol. Nutr. Food Res. 2017, 61. [Google Scholar] [CrossRef]
- Ley, R.E.; Backhed, F.; Turnbaugh, P.; Lozupone, C.A.; Knight, R.D.; Gordon, J.I. Obesity alters gut microbial ecology. Proc. Natl. Acad. Sci. USA 2005, 102, 11070–11075. [Google Scholar] [CrossRef] [Green Version]
- Bain, M.A.; Fornasini, G.; Evans, A.M. Trimethylamine: Metabolic, pharmacokinetic and safety aspects. Curr. Drug Metab. 2005, 6, 227–240. [Google Scholar] [CrossRef]
- Taesuwan, S.; Cho, C.E.; Malysheva, O.V.; Bender, E.; King, J.H.; Yan, J.; Thalacker-Mercer, A.E.; Caudill, M.A. The metabolic fate of isotopically labeled trimethylamine-N-oxide (TMAO) in humans. J. Nutr. Biochem. 2017, 45, 77–82. [Google Scholar] [CrossRef] [PubMed]
- Levey, A.S.; Stevens, L.A.; Schmid, C.H.; Zhang, Y.L.; Castro, A.F., 3rd; Feldman, H.I.; Kusek, J.W.; Eggers, P.; Van Lente, F.; Greene, T.; et al. A new equation to estimate glomerular filtration rate. Ann. Intern. Med. 2009, 150, 604–612. [Google Scholar] [CrossRef] [PubMed]
- Cho, C.E.; Taesuwan, S.; Malysheva, O.V.; Bender, E.; Yan, J.; Caudill, M.A. Choline and one-carbon metabolite response to egg, beef and fish among healthy young men: A short-term randomized clinical study. Clin. Nutr. Exper. 2016, 10, 1–11. [Google Scholar] [CrossRef] [Green Version]
- Johnson, D.W. A flow injection electrospray ionization tandem mass spectrometric method for the simultaneous measurement of trimethylamine and trimethylamine N-oxide in urine. J. Mass Spectrom. 2008, 43, 495–499. [Google Scholar] [CrossRef] [PubMed]
- Koc, H.; Mar, M.H.; Ranasinghe, A.; Swenberg, J.A.; Zeisel, S.H. Quantitation of choline and its metabolites in tissues and foods by liquid chromatography/electrospray ionization-isotope dilution mass spectrometry. Anal. Chem. 2002, 74, 4734–4740. [Google Scholar] [CrossRef]
- Holm, P.I.; Ueland, P.M.; Kvalheim, G.; Lien, E.A. Determination of choline, betaine, and dimethylglycine in plasma by a high-throughput method based on normal-phase chromatography-tandem mass spectrometry. Clin. Chem. 2003, 49, 286–294. [Google Scholar] [CrossRef]
- Yan, J.; Wang, W.; Gregory, J.F., 3rd; Malysheva, O.; Brenna, J.T.; Stabler, S.P.; Allen, R.H.; Caudill, M.A. MTHFR C677T genotype influences the isotopic enrichment of one-carbon metabolites in folate-compromised men consuming d9-choline. Am. J. Clin. Nutr. 2011, 93, 348–355. [Google Scholar] [CrossRef] [Green Version]
- Illumina. 16S Metagenomic Sequencing Library Preparation. 2013. Available online: https://support.illumina.com/content/dam/illumina-support/documents/documentation/chemistry_documentation/16s/16s-metagenomic-library-prep-guide-15044223-b.pdf (accessed on 8 April 2019).
- Kozich, J.J.; Westcott, S.L.; Baxter, N.T.; Highlander, S.K.; Schloss, P.D. Development of a dual-index sequencing strategy and curation pipeline for analyzing amplicon sequence data on the MiSeq Illumina sequencing platform. Appl. Environ. Microbiol. 2013, 79, 5112–5120. [Google Scholar] [CrossRef] [Green Version]
- Callahan, B.J.; McMurdie, P.J.; Rosen, M.J.; Han, A.W.; Johnson, A.J.; Holmes, S.P. DADA2: High-resolution sample inference from Illumina amplicon data. Nat. Methods 2016, 13, 581–583. [Google Scholar] [CrossRef] [Green Version]
- DeSantis, T.Z.; Hugenholtz, P.; Larsen, N.; Rojas, M.; Brodie, E.L.; Keller, K.; Huber, T.; Dalevi, D.; Hu, P.; Andersen, G.L. Greengenes, a chimera-checked 16S rRNA gene database and workbench compatible with ARB. Appl. Environ. Microbiol. 2006, 72, 5069–5072. [Google Scholar] [CrossRef] [Green Version]
- Katoh, K.; Standley, D.M. MAFFT multiple sequence alignment software version 7: Improvements in performance and usability. Mol. Biol. Evol. 2013, 30, 772–780. [Google Scholar] [CrossRef] [PubMed] [Green Version]
- Vazquez-Baeza, Y.; Pirrung, M.; Gonzalez, A.; Knight, R. EMPeror: A tool for visualizing high-throughput microbial community data. Gigascience 2013, 2, 16. [Google Scholar] [CrossRef] [PubMed] [Green Version]
- Lozupone, C.; Knight, R. UniFrac: A new phylogenetic method for comparing microbial communities. Appl. Environ. Microbiol. 2005, 71, 8228–8235. [Google Scholar] [CrossRef] [PubMed] [Green Version]
- Yamazaki, H.; Shimizu, M. Survey of variants of human flavin-containing monooxygenase 3 (FMO3) and their drug oxidation activities. Biochem. Pharmacol. 2013, 85, 1588–1593. [Google Scholar] [CrossRef] [PubMed]
- Turkanoglu Ozcelik, A.; Can Demirdogen, B.; Demirkaya, S.; Adali, O. Flavin containing monooxygenase 3 genetic polymorphisms Glu158Lys and Glu308Gly and their relation to ischemic stroke. Gene 2013, 521, 116–121. [Google Scholar] [CrossRef] [PubMed]
- Oksanen, J.; Blanchet, F.G.; Friendly, M.; Kindt, R.; Legendre, P.; McGlinn, D.; Minchin, P.R.; O’Hara, R.B.; Simpson, G.L.; Solymos, P.; et al. Vegan: Community Ecology Package. 2018. R package Version 2012. 2015–2013. Available online: https://CRAN.R-project.org/package=vegan (accessed on 8 January 2020).
- Mandal, S.; Van Treuren, W.; White, R.A.; Eggesbo, M.; Knight, R.; Peddada, S.D. Analysis of composition of microbiomes: A novel method for studying microbial composition. Microb. Ecol. Health Dis. 2015, 26, 27663. [Google Scholar] [CrossRef] [Green Version]
- Cashman, J.R.; Zhang, J.; Leushner, J.; Braun, A. Population distribution of human flavin-containing monooxygenase form 3: Gene polymorphisms. Drug Metab. Dispos. 2001, 29, 1629–1637. [Google Scholar]
- Modinger, Y.; Schon, C.; Wilhelm, M.; Hals, P.A. Plasma kinetics of choline and choline metabolites after a single dose of superbaboost(tm) krill oil or choline bitartrate in healthy volunteers. Nutrients 2019, 11. [Google Scholar] [CrossRef] [Green Version]
- Zeisel, S.H. Dietary choline: Biochemistry, physiology, and pharmacology. Annu. Rev. Nutr. 1981, 1, 95–121. [Google Scholar] [CrossRef]
- Lemos, B.S.; Medina-Vera, I.; Malysheva, O.V.; Caudill, M.A.; Fernandez, M.L. Effects of Egg Consumption and Choline Supplementation on Plasma Choline and Trimethylamine-N-Oxide in a Young Population. J. Am. Coll. Nutr. 2018, 1–8. [Google Scholar] [CrossRef]
- Missimer, A.; Fernandez, M.L.; DiMarco, D.M.; Norris, G.H.; Blesso, C.N.; Murillo, A.G.; Vergara-Jimenez, M.; Lemos, B.S.; Medina-Vera, I.; Malysheva, O.V.; et al. Compared to an oatmeal breakfast, two eggs/day increased plasma carotenoids and choline without increasing trimethyl amine n-oxide concentrations. J. Am. Coll. Nutr. 2018, 37, 140–148. [Google Scholar] [CrossRef] [PubMed]
- Craciun, S.; Balskus, E.P. Microbial conversion of choline to trimethylamine requires a glycyl radical enzyme. Proc. Natl. Acad. Sci. USA 2012, 109, 21307–21312. [Google Scholar] [CrossRef] [PubMed] [Green Version]
- Romano, K.A.; Vivas, E.I.; Amador-Noguez, D.; Rey, F.E. Intestinal microbiota composition modulates choline bioavailability from diet and accumulation of the proatherogenic metabolite trimethylamine-N-oxide. mBio 2015, 6. [Google Scholar] [CrossRef] [PubMed] [Green Version]
- Barrea, L.; Annunziata, G.; Muscogiuri, G.; Di Somma, C.; Laudisio, D.; Maisto, M.; de Alteriis, G.; Tenore, G.C.; Colao, A.; Savastano, S. Trimethylamine-N-oxide (TMAO) as Novel Potential Biomarker of Early Predictors of Metabolic Syndrome. Nutrients 2018, 10. [Google Scholar] [CrossRef] [PubMed] [Green Version]
- Schugar, R.C.; Shih, D.M.; Warrier, M.; Helsley, R.N.; Burrows, A.; Ferguson, D.; Brown, A.L.; Gromovsky, A.D.; Heine, M.; Chatterjee, A.; et al. The TMAO-producing enzyme flavin-containing monooxygenase 3 regulates obesity and the beiging of white adipose tissue. Cell Rep. 2017, 20, 279. [Google Scholar] [CrossRef]
- Koeth, R.A.; Wang, Z.; Levison, B.S.; Buffa, J.A.; Org, E.; Sheehy, B.T.; Britt, E.B.; Fu, X.; Wu, Y.; Li, L.; et al. Intestinal microbiota metabolism of L-carnitine, a nutrient in red meat, promotes atherosclerosis. Nat. Med. 2013, 19, 576–585. [Google Scholar] [CrossRef] [Green Version]
- Zeisel, S.H.; da Costa, K.A. Choline: An essential nutrient for public health. Nutr. Rev. 2009, 67, 615–623. [Google Scholar] [CrossRef] [Green Version]
- Zeisel, S.H. Choline: Critical role during fetal development and dietary requirements in adults. Annu. Rev. Nutr. 2006, 26, 229–250. [Google Scholar] [CrossRef] [Green Version]
- Jiang, X.; Yan, J.; West, A.A.; Perry, C.A.; Malysheva, O.V.; Devapatla, S.; Pressman, E.; Vermeylen, F.; Caudill, M.A. Maternal choline intake alters the epigenetic state of fetal cortisol-regulating genes in humans. FASEB J. 2012, 26, 3563–3574. [Google Scholar] [CrossRef] [Green Version]
- Jiang, X.; Bar, H.Y.; Yan, J.; Jones, S.; Brannon, P.M.; West, A.A.; Perry, C.A.; Ganti, A.; Pressman, E.; Devapatla, S.; et al. A higher maternal choline intake among third-trimester pregnant women lowers placental and circulating concentrations of the antiangiogenic factor fms-like tyrosine kinase-1 (sFLT1). FASEB J. 2013, 27, 1245–1253. [Google Scholar] [CrossRef]
- Caudill, M.A.; Strupp, B.J.; Muscalu, L.; Nevins, J.E.H.; Canfield, R.L. Maternal choline supplementation during the third trimester of pregnancy improves infant information processing speed: A randomized, double-blind, controlled feeding study. FASEB J. 2018, 32, 2172–2180. [Google Scholar] [CrossRef] [PubMed] [Green Version]


| Participant Characteristics | Normal-Weight (n = 25) | Obese (n = 12) | |
|---|---|---|---|
| Age | y | 25.3 ± 0.6 | 28.3 ± 2.0 |
| BMI | kg/m2 | 23.3 ± 0.3 | 32.8 ± 0.7 |
| Genotype FMO3 G472A rs 226678 | GG% | 48 | 58 |
| GA% | 36 | 25 | |
| AA% | 16 | 17 | |
| Serum Blood Chemistry | |||
| Glucose | mg/dL | 87 ± 1 | 90 ± 2 |
| BUN | mg/dL | 16 ± 1 | 15 ± 1 |
| Cr | mg/dL | 1.0 ± 0.0 | 0.9 ± 0.0 |
| Total bilirubin | mg/dL | 0.9 ± 0.1 | 0.9 ± 0.3 |
| Total protein | g/dL | 7.1 ± 0.1 | 7.3 ± 0.3 |
| ALP | IU/L | 68 ± 3 | 74 ± 5 |
| AST | IU/L | 21 ± 1 | 23 ± 1 |
| ALT | IU/L | 21 ± 1 | 26 ± 2 |
| eGFR | mL/min/1.73 m2 | 106 ± 3 | 109 ± 4 |
| Blood Cell Counts | |||
| RBC | ×106/µL | 5.2 ± 0.1 | 5.4 ± 0.1 |
| WBC | ×103/µL | 5.9 ± 0.4 | 6.9 ± 0.4 |
| Lymphocytes | ×103/µL | 1.9 ± 0.1 | 2.3 ± 0.2 |
| Monocytes | ×103/µL | 0.5 ± 0.0 | 0.6 ± 0.0 |
| Neutrophils | ×103/µL | 3.2 ± 0.3 | 3.5 ± 0.3 |
| Tomato Soup with No Choline | Tomato Soup with 600 mg Choline as Choline Bitartrate | Tomato Soup with 600 mg Choline as Phosphatidylcholine | ||
|---|---|---|---|---|
| Food Amount | mL | 237 | 237 | 237 |
| Food metabolite content | ||||
| TMAO | mg | ND | ND | ND |
| Total choline 1 | mg | 42 | 619 | 623 |
| Free choline | mg | 17 | 590 | 19 |
| Phosphatidylcholine | mg | 11 | 14 | 588 |
| Betaine | mg | 7 | 7 | 7 |
| (nmol/mmol Cr in Urine) | No Choline | Choline Bitartrate | Phosphatidylcholine | p Value |
|---|---|---|---|---|
| TMAO | 2.3 ± 1.4 a | 9.6 ± 2.2 b | 2.9 ± 1.7 a | p = 0.01 |
| Free choline | 0.5 ± 0.1 a | 1.3 ± 0.2 b | 0.9 ± 0.1 b | p = 0.0005 |
| High-TMAO Producers | Low-TMAO Producers | |||||||||||
|---|---|---|---|---|---|---|---|---|---|---|---|---|
| Taxa | 0% | 25% | 50% | 75% | 100% | 0% | 25% | 50% | 75% | 100% | W | Reject Null Hypothesis |
| k__Bacteria; p__Firmicutes; c__Clostridia; o__Clostridiales; f__Ruminococcaceae; g__Clostridium | 1 | 1 | 1 | 78 | 158 | 1 | 1 | 1 | 1 | 1 | 11 | TRUE |
| k__Bacteria; p__Firmicutes; c__Clostridia; o__Clostridiales; f__Lachnospiraceae; g__Clostridium | 87 | 152 | 263 | 385 | 1138 | 1 | 37 | 96 | 194 | 340 | 8 | TRUE |
| k__Bacteria; p__Bacteroidetes; c__Bacteroidia; o__Bacteroidales; f__S24-7; g__ | 1 | 1 | 1 | 1 | 5 | 1 | 1 | 1 | 49 | 100 | 2 | TRUE |
| k__Bacteria; p__Firmicutes; c__Bacilli; o__Lactobacillales; f__Streptococcaceae; g__Lactococcus | 1 | 1 | 1 | 1 | 1 | 1 | 1 | 1 | 1 | 68 | 2 | TRUE |
| k__Bacteria; p__Firmicutes; c__Clostridia; o__Clostridiales; f__Christensenellaceae; g__ | 1 | 1 | 1 | 1 | 125 | 1 | 1 | 8 | 90 | 420 | 2 | TRUE |
| k__Bacteria; p__Firmicutes; c__Clostridia; o__Clostridiales; f__Clostridiaceae; g__ | 1 | 1 | 1 | 1 | 1 | 1 | 1 | 1 | 1 | 67 | 2 | TRUE |
| k__Bacteria; p__Bacteroidetes; c__Bacteroidia; o__Bacteroidales; f__; g__ | 1 | 1 | 1 | 1 | 9 | 1 | 1 | 1 | 1 | 1876 | 2 | TRUE |
| k__Bacteria; p__Cyanobacteria; c__4C0d-2; o__YS2; f__; g__ | 1 | 1 | 1 | 1 | 1 | 1 | 1 | 1 | 1 | 126 | 2 | TRUE |
| k__Bacteria; p__Firmicutes; c__Erysipelotrichi; o__Erysipelotrichales; f__Erysipelotrichaceae; g__Catenibacterium | 1 | 1 | 1 | 1 | 1 | 1 | 1 | 1 | 1 | 83 | 2 | TRUE |
| k__Bacteria; p__Firmicutes; c__Clostridia; o__Clostridiales; f__Ruminococcaceae; g__Oscillospira | 1 | 80 | 143 | 354 | 1359 | 53 | 124 | 162 | 264 | 432 | 1 | TRUE |
| k__Bacteria; p__Firmicutes; c__Bacilli; o__Gemellales; f__Gemellaceae; g__Gemella | 1 | 1 | 1 | 1 | 5 | 1 | 1 | 1 | 1 | 10 | 1 | TRUE |
| k__Bacteria; p__Bacteroidetes; c__Bacteroidia; o__Bacteroidales; f__Rikenellaceae; g__Alistipes | 1 | 90 | 167 | 485 | 6008 | 90 | 150 | 154 | 233 | 478 | 1 | TRUE |
| k__Bacteria; p__Firmicutes; c__Clostridia; o__Clostridiales; f__Ruminococcaceae; g__Butyricicoccus | 1 | 1 | 1 | 56 | 166 | 1 | 1 | 36 | 85 | 175 | 1 | TRUE |
| k__Bacteria; p__Firmicutes; c__Clostridia; o__Clostridiales; f__Ruminococcaceae; g__ | 1 | 85 | 254 | 661 | 1205 | 1 | 196 | 340 | 653 | 2396 | 1 | TRUE |
© 2020 by the authors. Licensee MDPI, Basel, Switzerland. This article is an open access article distributed under the terms and conditions of the Creative Commons Attribution (CC BY) license (http://creativecommons.org/licenses/by/4.0/).
Share and Cite
Cho, C.E.; Aardema, N.D.J.; Bunnell, M.L.; Larson, D.P.; Aguilar, S.S.; Bergeson, J.R.; Malysheva, O.V.; Caudill, M.A.; Lefevre, M. Effect of Choline Forms and Gut Microbiota Composition on Trimethylamine-N-Oxide Response in Healthy Men. Nutrients 2020, 12, 2220. https://0-doi-org.brum.beds.ac.uk/10.3390/nu12082220
Cho CE, Aardema NDJ, Bunnell ML, Larson DP, Aguilar SS, Bergeson JR, Malysheva OV, Caudill MA, Lefevre M. Effect of Choline Forms and Gut Microbiota Composition on Trimethylamine-N-Oxide Response in Healthy Men. Nutrients. 2020; 12(8):2220. https://0-doi-org.brum.beds.ac.uk/10.3390/nu12082220
Chicago/Turabian StyleCho, Clara E., Niklas D. J. Aardema, Madison L. Bunnell, Deanna P. Larson, Sheryl S. Aguilar, Janet R. Bergeson, Olga V. Malysheva, Marie A. Caudill, and Michael Lefevre. 2020. "Effect of Choline Forms and Gut Microbiota Composition on Trimethylamine-N-Oxide Response in Healthy Men" Nutrients 12, no. 8: 2220. https://0-doi-org.brum.beds.ac.uk/10.3390/nu12082220