Hospital Malnutrition, Nutritional Risk Factors, and Elements of Nutritional Care in Europe: Comparison of Polish Results with All European Countries Participating in the nDay Survey

 ,
,  , and
, and
Abstract
:1. Introduction
2. Materials and Methods
2.1. Study Participants
2.2. Study Design and Processes
2.3. Nutritional Risk Factors
2.4. Diagnose of Malnutrition
| Algorithm 1. Criteria used to diagnose malnutrition based on European Society for Clinical Nutrition and Metabolism (ESPEN) criteria established in 2015 [13]. |
| Step 1 Diagnosis of risk of malnutrition |
| Malnutrition Screening Tool (MST) [16] ≥ 2 points |
| Questions and score: |
| Have you recently lost weight without trying? |
| no 0/unsure 2 |
| If yes, how much weight have you lost? |
| 2–13 lb 1/14–23 lb 2/24–33 lb 3/34 lb or more 4/unsure 2 |
| Have you been eating poorly because of a decreased appetite? |
| no 0/ yes 1 |
| Step 2 Diagnosis of malnutrition |
| Alternative 1 |
| BMI < 18.5 kg/m² |
| or |
| Alternative 2 |
| Unintended body weight loss (>5% within the last 3 months or >10% within an unspecified time frame) |
| and |
| BMI < 20 kg/m² for subjects < 70 years |
| BMI < 22 kg/m² for subjects > 70 years |
2.5. Statistical Analysis
3. Results
3.1. Subjects’ Characteristics and Demographics
3.2. Subjects’ Nutritional Status
3.2.1. Prevalence of Nutritional Risk Factors
3.2.2. Prevalence of Malnutrition
3.3. Elements of Nutritional Care Process
3.3.1. Food Provision/Nutrition Support Offered to Patients
3.3.2. Nutrition Staffing in the Hospital/Ward
3.3.3. Nutrition Guidelines/Screening Structures
3.3.4. Structures in the Wards Managing Malnourished/at Risk of Malnutrition Patients
4. Discussion
5. Conclusions
Author Contributions
Funding
Institutional Review Board Statement
Informed Consent Statement
Data Availability Statement
Acknowledgments
Conflicts of Interest
References
- Correia, M.I.; Waitzberg, D.L. The impact of malnutrition on morbidity, mortality, length of hospital stay and costs evaluated through a multivariate model analysis. Clin. Nutr. 2003, 22, 235–239. [Google Scholar] [CrossRef]
- Norman, K.; Pichard, C.; Lochs, H.; Pirlich, M. Prognostic impact of disease-related malnutrition. Clin. Nutr. 2008, 27, 5–15. [Google Scholar] [CrossRef] [PubMed]
- Reber, E.; Strahm, R.; Bally, L.; Schuetz, P.; Stanga, Z. Efficacy and Efficiency of Nutritional Support Teams. J. Clin. Med. 2019, 22, 1281. [Google Scholar] [CrossRef] [PubMed] [Green Version]
- Theilla, M.; Grinev, M.; Kosak, S.; Hiesmayr, M.; Singer, P.; nutritionDay Israel Working Group. Fight against malnutrition: The results of a 2006–2012 prospective national and global nutritionDay survey. Clin. Nutr. ESPEN 2015, 10, e77–e82. [Google Scholar] [CrossRef]
- Volkert, D.; Kiesswetter, E.; Cederholm, T.; Donini, L.M.; Eglseer, D.; Norman, K.; Schneider, S.M.; Ströbele-Benschop, N.; Torbahn, G.; Wirth, R.; et al. Development of a Model on Determinants of Malnutrition in Aged Persons: A MaNuEL Project. Gerontol. Geriatr. Med. 2019, 21, 2333721419858438. [Google Scholar] [CrossRef]
- Jyrkkä, J.; Enlund, H.; Lavikainen, P.; Sulkava, R.; Hartikainen, S. Association of polypharmacy with nutritional status, functional ability and cognitive capacity over a three-year period in an elderly population. Pharmacoepidemiol. Drug Saf. 2011, 20, 514–522. [Google Scholar] [CrossRef]
- Fávaro-Moreira, N.C.; Krausch-Hofmann, S.; Matthys, C.; Vereecken, C.; Vanhauwaert, E.; Declercq, A.; Bekkering, G.E.; Duyck, J. Risk Factors for Malnutrition in Older Adults: A Systematic Review of the Literature Based on Longitudinal Data. Adv. Nutr. 2016, 16, 507–522. [Google Scholar] [CrossRef]
- International Statistical Classification of Diseases and Related Health Problems 11th Revision (ICD-11). Available online: https://icd.who.int/browse11/l-m/en (accessed on 22 November 2020).
- Saunders, J.; Smith, T.; Stroud, M. Malnutrition and undernutrition. Medicine 2011, 391, 45–50. [Google Scholar] [CrossRef]
- Jeznach-Steinhagen, A.; Ostrowska, J.; Czerwonogrodzka-Senczyna, A. Evaluation of conducting a screening assessment of nutritional status of hospitalized patients. Presentation of main goals and objectives of the global health project “NutritionDay”. Przegl. Epidemiol. 2016, 70, 71–75. [Google Scholar]
- Ahmed, T.; Haboubi, N. Assessment and management of nutrition in older people and its importance to health. Clin. Interv. Aging 2010, 5, 207–216. [Google Scholar]
- Schuetz, P.; Fehr, R.; Baechli, V.; Geiser, M.; Deiss, M.; Gomes, F.; Kutz, A.; Tribolet, P.; Bregenzer, T.; Braun, N.; et al. Individualised nutritional support in medical inpatients at nutritional risk: A randomised clinical trial. Lancet 2019, 8, 2312–2321. [Google Scholar] [CrossRef]
- Cederholm, T.; Bosaeus, I.; Barazzoni, R.; Bauer, J.; Van Gossum, A.; Klek, S.; Muscaritoli, M.; Nyulasi, I.; Ockenga, I.; Schneider, S.M.; et al. Diagnostic criteria for malnutrition—An ESPEN consensus statement. Clin. Nutr. 2015, 34, 335–340. [Google Scholar] [CrossRef]
- NutritionDay Worldwide. Available online: www.nutritionday.org (accessed on 22 November 2020).
- Questionnaires Used in the nDay Study. Available online: https://www.nutritionday.org/en/-30.languages/languages.html (accessed on 22 November 2020).
- Malnutrition Screening Tool (MST). Available online: https://static.abbottnutrition.com/cms-prod/abbottnutrition-2016.com/img/Malnutrition%20Screening%20Tool_FINAL_tcm1226-57900.pdf (accessed on 22 November 2020).
- Poulia, K.A.; Klek, S.; Doundoulakis, I.; Bouras, E.; Karayiannis, D.; Baschali, A.; Passakiotou, M.; Chourdakis, M. The two most popular malnutrition screening tools in the light of the new ESPEN consensus definition of the diagnostic criteria for malnutrition. Clin. Nutr. 2017, 36, 1130–1135. [Google Scholar] [CrossRef] [PubMed]
- Guerra, R.S.; Fonseca, I.; Sousa, A.S.; Jesus, A.; Pichel, F.; Amaral, T.F. ESPEN diagnostic criteria for malnutrition—A validation study in hospitalized patients. Clin. Nutr. 2017, 36, 1326–1332. [Google Scholar] [CrossRef] [PubMed]
- Orlandoni, P.; Venturini, C.; Jukic Peladic, N.; Costantini, A.; Di Rosa, M.; Cola, C.; Giorgini, N.; Basile, R.; Fagnani, D.; Sparvoli, D.; et al. Malnutrition upon Hospital Admission in Geriatric Patients: Why Assess It? Front. Nutr. 2017, 30, 50. [Google Scholar] [CrossRef] [Green Version]
- Roubenoff, R. Sarcopenia: Effects on body composition and function. J. Gerontol. Biol. Sci. Med. Sci. 2003, 58, M1012–M1017. [Google Scholar] [CrossRef] [PubMed]
- Von Haehling, S.; Morley, J.E.; Anker, S.D. An overview of sarcopenia: Facts and numbers on prevalence and clinical impact. J. Cachexia Sarcopenia Muscle 2010, 2, 129–133. [Google Scholar] [CrossRef]
- Ostrowska, J.; Szostak-Węgierek, D.; Jeznach-Steinhagen, A. Nutritional status in patients aged over 65 years and its influence on the quantity and type of complications occurring 3, 6 and 12 months after hospitalisation: A clinical prospective study. J. Hum. Nutr. Diet. 2019, 32, 119–127. [Google Scholar] [CrossRef] [Green Version]
- Hiesmayr, M.; Schindler, K.; Pernicka, E.; Schuh, C.; Schoeniger-Hekele, A.; Bauer, P.; Laviano, A.; Lovell, A.D.; Mouhieddine, M.; Schuetz, T.; et al. Decreased food intake is a risk factor for mortality in hospitalised patients: The NutritionDay survey 2006. Clin. Nutr. 2009, 28, 484–491. [Google Scholar] [CrossRef]
- Hiesmayr, M.; Frantal, S.; Schindler, K.; Themessl-Huber, M.; Mouhieddine, M.; Schuh, C.; Pernicka, E.; Schneider, S.; Singer, P.; Ljunqvist, O.; et al. The Patient- and Nutrition-Derived Outcome Risk Assessment Score (PANDORA): Development of a Simple Predictive Risk Score for 30-Day In-Hospital Mortality Based on Demographics, Clinical Observation, and Nutrition. PLoS ONE 2015, 22, 0127316. [Google Scholar] [CrossRef] [Green Version]
- Hiesmayr, M.; Tarantino, S.; Moick, S.; Laviano, A.; Sulz, I.; Mouhieddine, M.; Schuh, C.; Volkert, D.; Simon, J.; Schindler, K. Hospital Malnutrition, a Call for Political Action: A Public Health and NutritionDay Perspective. J. Clin. Med. 2019, 22, 2048. [Google Scholar] [CrossRef] [PubMed] [Green Version]
- Amarya, S.; Singh, K.; Sabharwal, M. Changes during aging and their association with malnutrition. J. Clin. Gerontol. Geriatr. 2015, 6, 78–84. [Google Scholar] [CrossRef] [Green Version]
- Cardenas, D.; Bermúdez, C.; Pérez, A.; Diaz, G.; Cortes, L.Y.; Contreras, C.P.; Pinzón-Espitia, O.L.; Gomez, G.; Gonzalez, M.C.; Fantin, R.; et al. Nutritional risk is associated with an increase of in-hospital mortality and a reduction of being discharged home: Results of the 2009-2015 nutritionDay survey. Clin. Nutr. ESPEN 2020, 38, 138–145. [Google Scholar] [CrossRef] [PubMed]
- Ardito, F.; Lai, Q.; Rinninella, E.; Mimmo, A.; Vellone, M.; Panettieri, E.; Adducci, E.; Cintoni, M.; Mele, M.C.; Gasbarrini, A.; et al. The impact of personalized nutritional support on postoperative outcome within the enhanced recovery after surgery (ERAS) program for liver resections: Results from the NutriCatt protocol. Updates Surg. 2020, 72, 681–691. [Google Scholar] [CrossRef] [PubMed]
- Melloul, E.; Hübner, M.; Scott, M.; Snowden, C.; Prentis, J.; Dejong, C.H.; Garden, O.J.; Farges, O.; Kokudo, N.; Vauthey, J.N.; et al. Guidelines for Perioperative Care for Liver Surgery: Enhanced Recovery After Surgery (ERAS) Society Recommendations. World J. Surg. 2016, 40, 2425–2440. [Google Scholar] [CrossRef] [Green Version]
- Melloul, E.; Lassen, K.; Roulin, D.; Grass, F.; Perinel, J.; Adham, M.; Wellge, E.B.; Kunzler, F.; Besselink, M.G.; Asbun, H.; et al. Guidelines for Perioperative Care for Pancreatoduodenectomy: Enhanced Recovery After Surgery (ERAS) Recommendations 2019. World J. Surg. 2020, 44, 2056–2084. [Google Scholar] [CrossRef]
- Gustafsson, U.O.; Scott, M.J.; Hubner, M.; Nygren, J.; Demartines, N.; Francis, N.; Rockall, T.A.; Young-Fadok, T.M.; Hill, A.G.; Soop, M.; et al. Guidelines for Perioperative Care in Elective Colorectal Surgery: Enhanced Recovery After Surgery (ERAS®) Society Recommendations: 2018. World J. Surg. 2019, 43, 659–695. [Google Scholar] [CrossRef] [Green Version]
- Notice of the Minister of Health Dated 21 December 2020 on the List of Reimbursed Medicines, Foodstuffs for Special Nutritional Purposes and Medical Devices as of 1 January 2021. Available online: https://www.gov.pl/web/zdrowie/obwieszczenie-ministra-zdrowia-z-dnia-21-grudnia-2020-r-w-sprawie-wykazu-refundowanych-lekow-srodkow-spozywczych-specjalnego-przeznaczenia-zywieniowego-oraz-wyrobow-medycznych-na-1-stycznia-2021-r (accessed on 8 January 2021).
- Ordinance of Minister of Health Dated 15 September 2011 Amending Ordinance on Guaranteed Benefits in the Field of Hospital Treatment, Journal of Laws 2011, No. 202, Item 1191. Available online: http://isap.sejm.gov.pl/isap.nsf/download.xsp/WDU20112021191/O/D20111191.pdf (accessed on 22 November 2020).


| Nutritional Risk Factor | Malnutrition Risk Criteria |
|---|---|
| Body mass index (BMI) | <18.5 kg/m² |
| Unintentional body weight loss within the last 3 months | any body weight loss |
| Insufficient food intake during the week preceding the study | less than ½ of normal food intake |
| Insufficient food intake at the day of study | less than ½ of typical portion |
| Malnutrition Screening Tool (MST) [16]—described below | Score ≥ 2 |
| Decreased appetite | Declared |
| Number of drugs and liquid medications | >5 |
| Unable to walk without assistance | Declared |
| Poor self-reported health status | Declared |
| Characteristic | Poland | European Reference Group | p-Value | |
|---|---|---|---|---|
| n = 498 | n = 10,863 | |||
| Mean (SD)/Median [IQR] | Mean (SD)/Median [IQR] | |||
| Age | Years | 64 (52–76) | 70 (56–80) | <0.0001 |
| Weight | Kg | 73.8 (18.4) | 73.3 (18.9) | Ns |
| Height | Cm | 167 (10.5) | 167 (12) | Ns |
| BMI | Kg/m² | 26.3 (5.8) | 26.1 (5.9) | Ns |
| Weight 5 years ago (typical weight) | Kg | 76.7 (18.4) | 78.1 (18.9) | Ns |
| Duration after hospital admission | Days | 4 (2–10) | 6 (3–12) | <0.001 |
| n (%) | n (%) | |||
| Gender | Female | 253 (50.8%) | 5662 (52.1%) | Ns |
| Male | 245 (49.2%) | 5201 (47.9%) | Ns | |
| Affected organs (multiple answers possible) | Brain, nerves | 53 (10.6%) | 1678 (15.4%) | <0.01 |
| Eye, ear | 13 (2.6%) | 264 (2.4%) | Ns | |
| Nose, throat | 15 (3%) | 313 (2.9%) | Ns | |
| Heart, circulation system | 132 (26.5%) | 2440 (22.5%) | <0.05 | |
| Lung | 70 (14.1%) | 1552 (14.3%) | Ns | |
| Liver | 16 (3.2%) | 681 (6.3%) | <0.01 | |
| Gastrointestinal tract | 103 (20.7%) | 2481 (22.8%) | Ns | |
| Kidney/urinary tract | 60 (12%) | 1526 (14%) | Ns | |
| Endocrine system | 78 (15.7%) | 958 (8.8%) | <0.0001 | |
| Skeleton/bone/muscle | 55 (11%) | 2234 (20.6%) | <0.0001 | |
| Skin | 5 (1%) | 406 (3.7%) | <0.01 | |
| Ischaemia | 5 (1%) | 242 (2.2%) | Ns | |
| Cancer | 87 (17,5%) | 2036 (18.7%) | <0.0001 | |
| Infection | 3 (0.6%) | 654 (6%) | <0.0001 | |
| Pregnancy | 0 (0%) | 20 (0.2%) | - | |
| Others | 39 (7.8%) | 699 (6.4%) | Ns | |
| Poland | European Reference Group | p-Value * | |
|---|---|---|---|
| Medical speciality | n = 25 | n = 649 | |
| n (%) | n (%) | ||
| General internal medicine | 3 (12%) | 93 (14.3%) | Ns |
| General surgery | 6 (24%) | 90 (13.9%) | Ns |
| Cardiology | 0 (0%) | 21 (3.2%) | Ns |
| Gastroenterology/Hepatology | 2 (8%) | 61 (9.4%) | Ns |
| Neurology | 1 (4%) | 31 (4.8%) | Ns |
| Infectiology | 0 (0%) | 5 (0.8%) | Ns |
| Nephrology | 1 (4%) | 15 (2.3%) | Ns |
| Oncology | 0 (0%) | 63 (9.7%) | Ns |
| Cardiothoracic surgery | 0 (0%) | 8 (1.2%) | Ns |
| Psychiatry | 0 (0%) | 11 (1.7%) | Ns |
| Ear Nose Throat (ENT) | 1 (4%) | 21 (3.2%) | Ns |
| Characteristics | n (%) | n (%) | |
| Geriatrics | 1 (4%) | 63 (9.7%) | Ns |
| Long term care | 0 (0%) | 13 (2%) | Ns |
| Trauma | 0 (0%) | 13 (2%) | Ns |
| Orthopaedic surgery | 2 (8%) | 37 (5.7%) | Ns |
| Gynaecology | 0 (0%) | 9 (1.4%) | Ns |
| Paediatrics | 1 (4%) | 16 (2.5%) | Ns |
| Neurosurgery | 0 (0%) | 3 (0.5%) | Ns |
| Others | 7 (28%) | 76 (11.7%) | Ns |
| Poland | European Reference Group | p-Value | |
|---|---|---|---|
| Nutritional risk factor | n = 498 | n = 10,863 | |
| n (%) | n (%) | ||
| MST score ≥ 2 points | 122 (24.5%) | 3249 (29.9%) | <0.01 |
| BMI < 18.5 kg/m² | 31 (6.2%) | 677 (6.2%) | Ns |
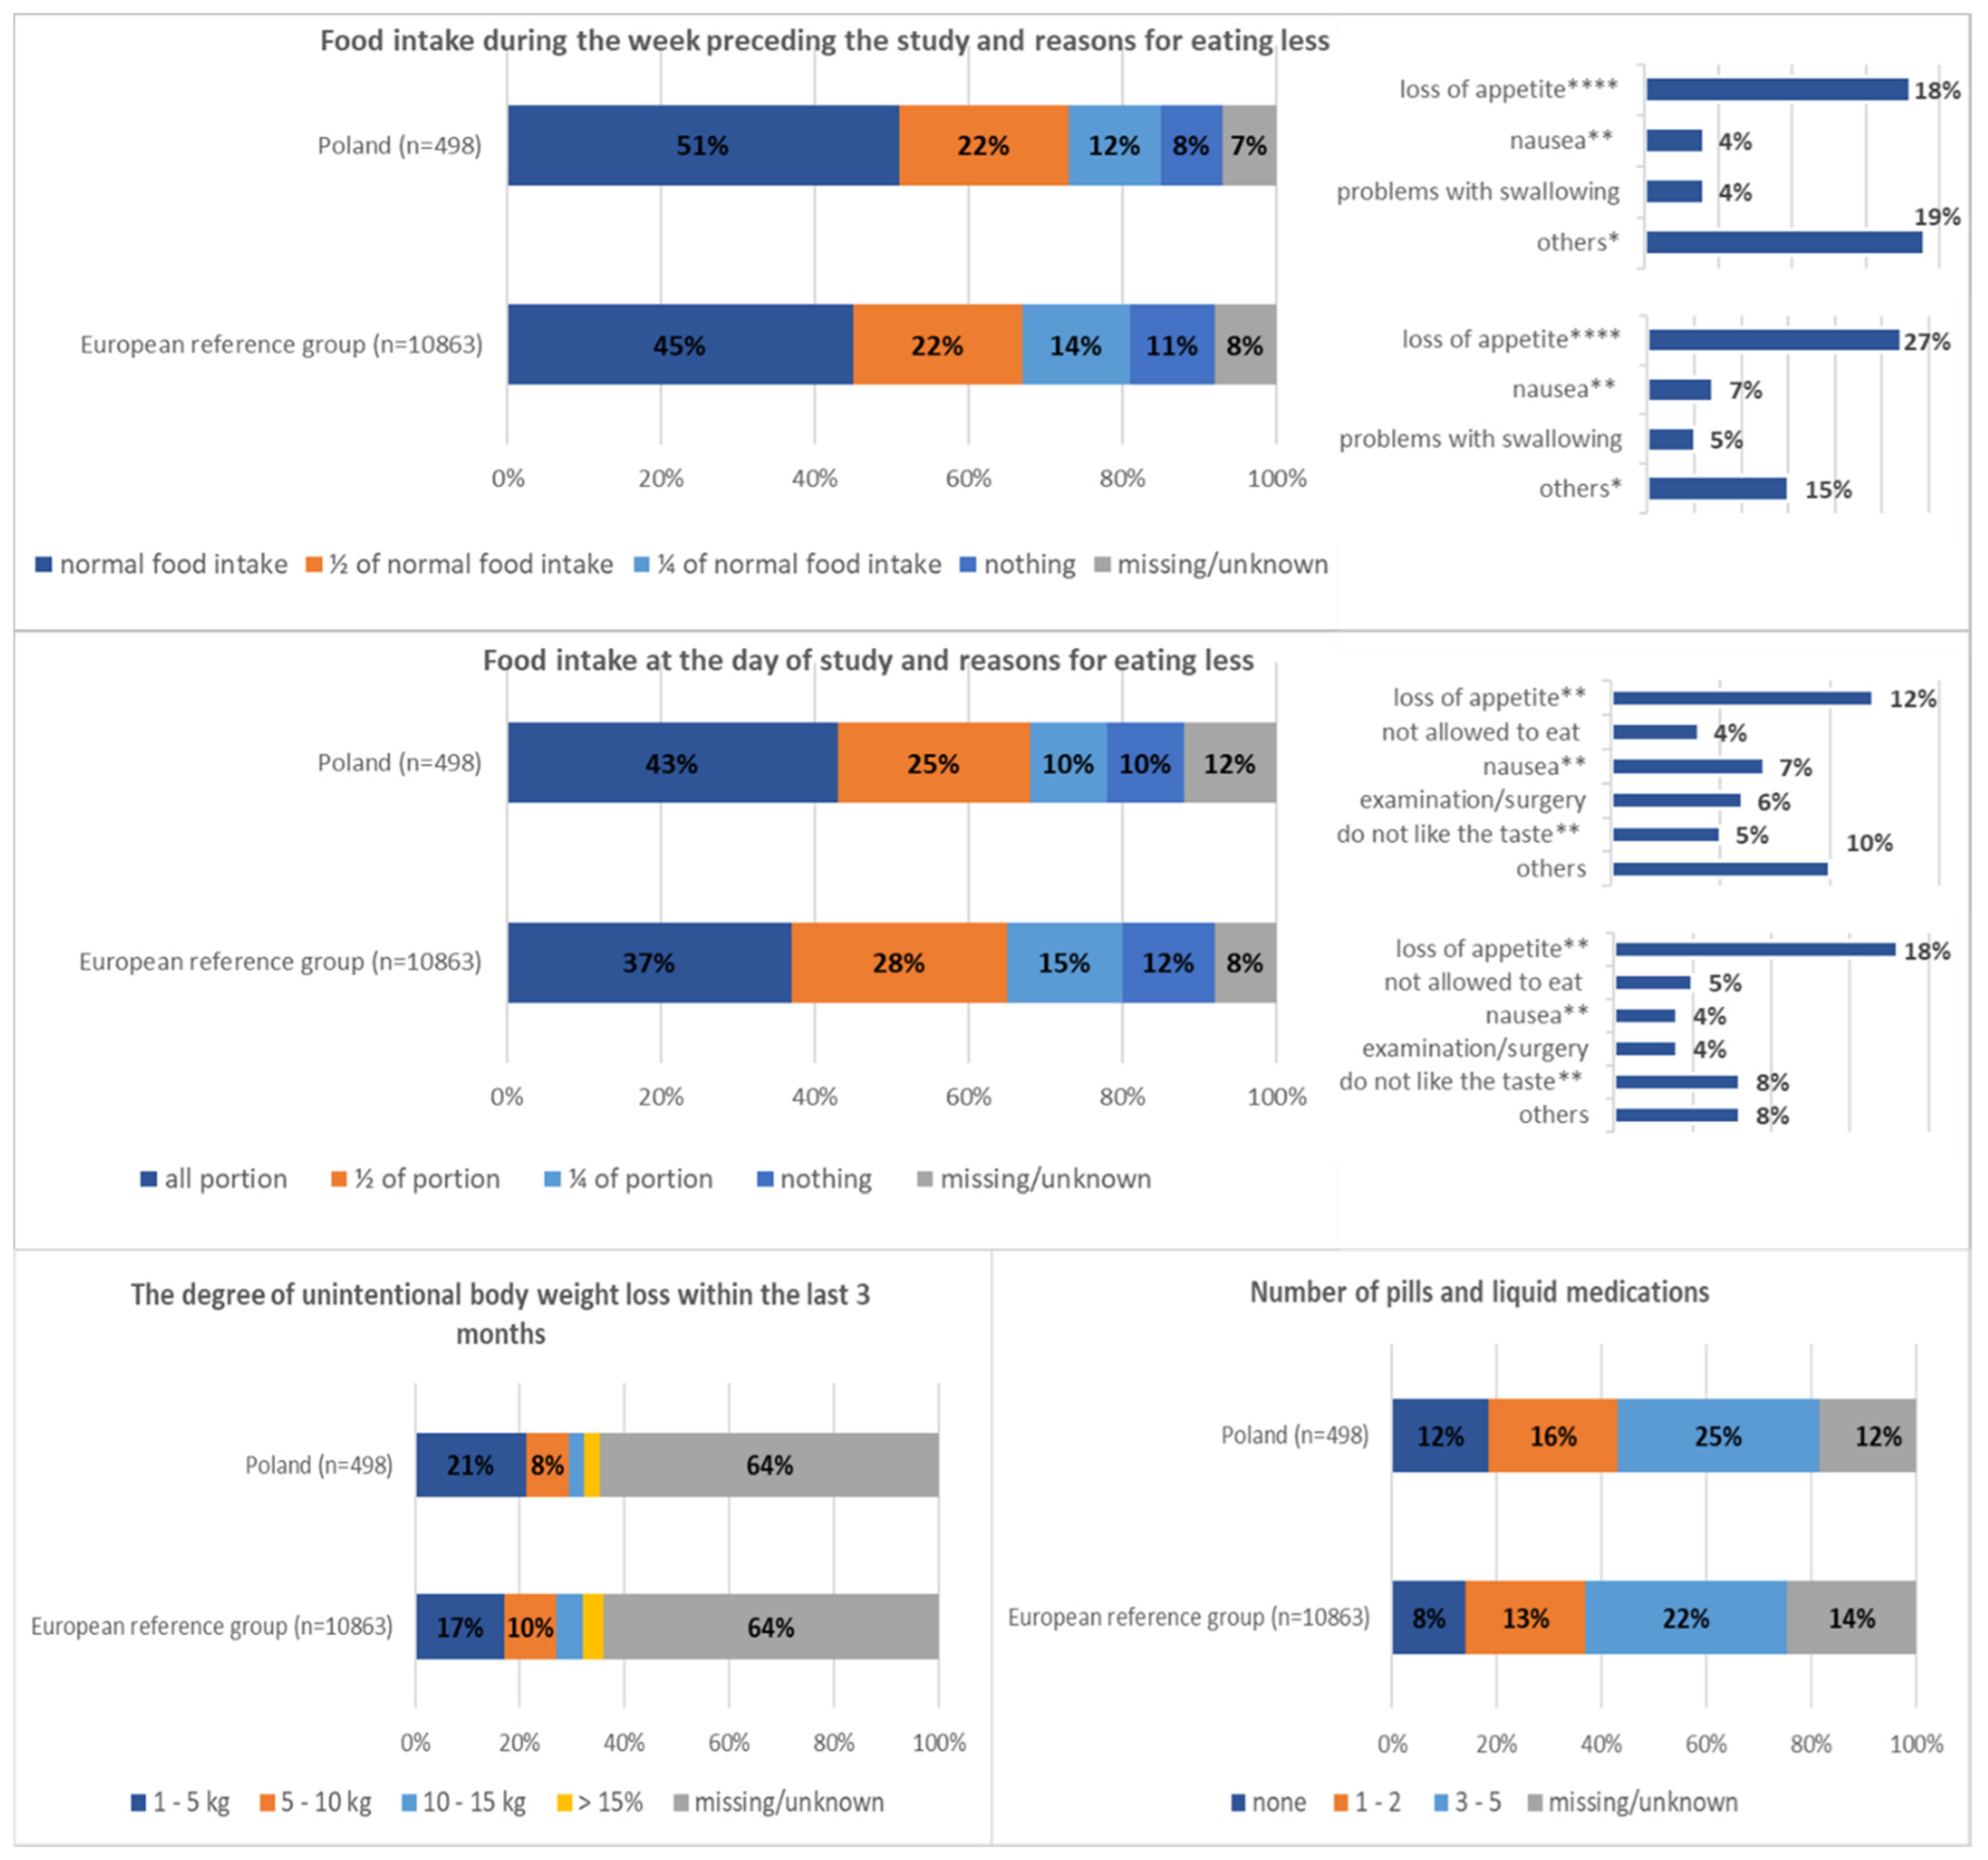
| Insufficient food intake during the week preceding the study (less than ½ of normal food intake) | 204 (41.0%) | 5036 (46.4%) | <0.05 |
| Insufficient food intake at the day of study (less than ½ of typical portion) | 227 (45.6%) | 5845 (53.8%) | <0.01 |
| Unintentional body weight loss within the last 3 months | 196 (39.4%) | 4400 (40.5%) | Ns |
| Decreased appetite | 120 (24.1%) | 3032 (27.9%) | <0.01 |
| Number of drugs and liquid medications (more than 5) | 178 (35.7%) | 4752 (43.7%) | <0.01 |
| Unable to walk without assistance | 112 (22.5%) | 3685 (33.9%) | <0.01 |
| Poor self-reported health status | 129 (25.9%) | 2202 (20.3%) | Ns |
| Poland | European Reference Group | p-Value | |
|---|---|---|---|
| Diagnostic criteria | n = 498 | n = 10,863 | |
| n (%) | n (%) | ||
| Alt. 1 (MST ≥ 2 points + BMI < 18.5 kg/m²) | 11 (2.2%) | 305 (2.8%) | Ns |
| Alt. 2 (MST ≥ 2 points + unintended weight loss + BMI < 20 kg/m² or < 22 kg/m²) | 36 (8.6%) | 1101 (10.1%) | <0.05 |
| Alt. 1 + Alt. 2—Total malnourished patients according to ESPEN diagnostic criteria. | 47 (9.4%) | 1406 (12.9%) | <0.05 |
| Impossible to verify (missing data) | 66 (13.2%) | 1704 (15.7%) | - |
| Nutrition Care Indicators | Poland | European Reference Group | p-Value | |
| n = 498 | n = 10,863 | |||
| Food provision/nutrition support offered to patients (multiple answers possible) n (%) | ||||
| Oral diet | normal hospital food | 363 (72.9%) | 7386 (68%) | <0.05 |
| special diets | 40 (8%) | 1745 (16.1%) | <0.0001 | |
| Provision of ONS | 19 (3.8%) | 1325 (12.2%) | <0.0001 | |
| Prescription of EN/PN/EN + PN | 41 (8.2%) | 1276 (11.7%) | <0.001 | |
| Number of nutrition supports chosen by caregivers | 1 | 402 (80.7%) | 8999 (82.8%) | - |
| 2 | 47 (9.5%) | 1383 (12.7%) | - | |
| 3 | 0 (0%) | 162 (1.5%) | - | |
| 4 | 0 (0%) | 9 (0.1%) | - | |
| not answered | 49 (9.8%) | 310 (2.9%) | - | |
| Poland | European reference group | |||
| n = 25 | n = 649 | |||
| Nutrition staffing in the hospital/ward (morning shift) n (%)/median + [IQR] | ||||
| Nutrition support team in the hospital | 25 (100%) | 542 (83.5%) | <0.05 | |
| Nutritional care person in the ward | 21 (84%) | 502 (77.3%) | Ns | |
| Number of physicians in the ward | 4 (2–6) | 2 (1–4) | <0.01 | |
| Number of nurses in the ward | 5 (3–7) | 4 (3–5) | Ns | |
| Number of nursing aides in the ward | 2 (0–2) | 2 (1–2) | Ns | |
| Number of dieticians in the ward | 0 (0–1) | 1 (0–1) | Ns | |
| Number of physiotherapists in the ward | 1 (1–1) | 1 (0–2) | Ns | |
| Nutrition guidelines/screening structures n (%) | ||||
| Routine screening at admission | 25 (100%) | 473 (72.9%) | <0.0001 | |
| Screening using validated screening tool | 24 (96%) | 550 (84.7%) | <0.001 | |
| Screening using NRS 2002 | 23 (92%) | 285 (43.9%) | <0.0001 | |
| Screening using MUST | 1 (4%) | 41 (6.3%) | Ns | |
| Screening using local screening tool | 0 | 176 (27.1%) | - | |
| Screening using professional experience | 2 (8%) | 235 (36.2%) | <0.05 | |
| Routine weighing at admission | 25 (100%) | 473 (72.9%) | <0.0001 | |
| Routine weighing every week | 5 (20%) | 269 (41.4%) | <0.05 | |
| Weighing occasionally | 0 | 60 (9.2%) | - | |
| Weighing when requested | 14 (56%) | 340 (52.4%) | Ns | |
| Nutrition guidelines/screening structures n (%) | ||||
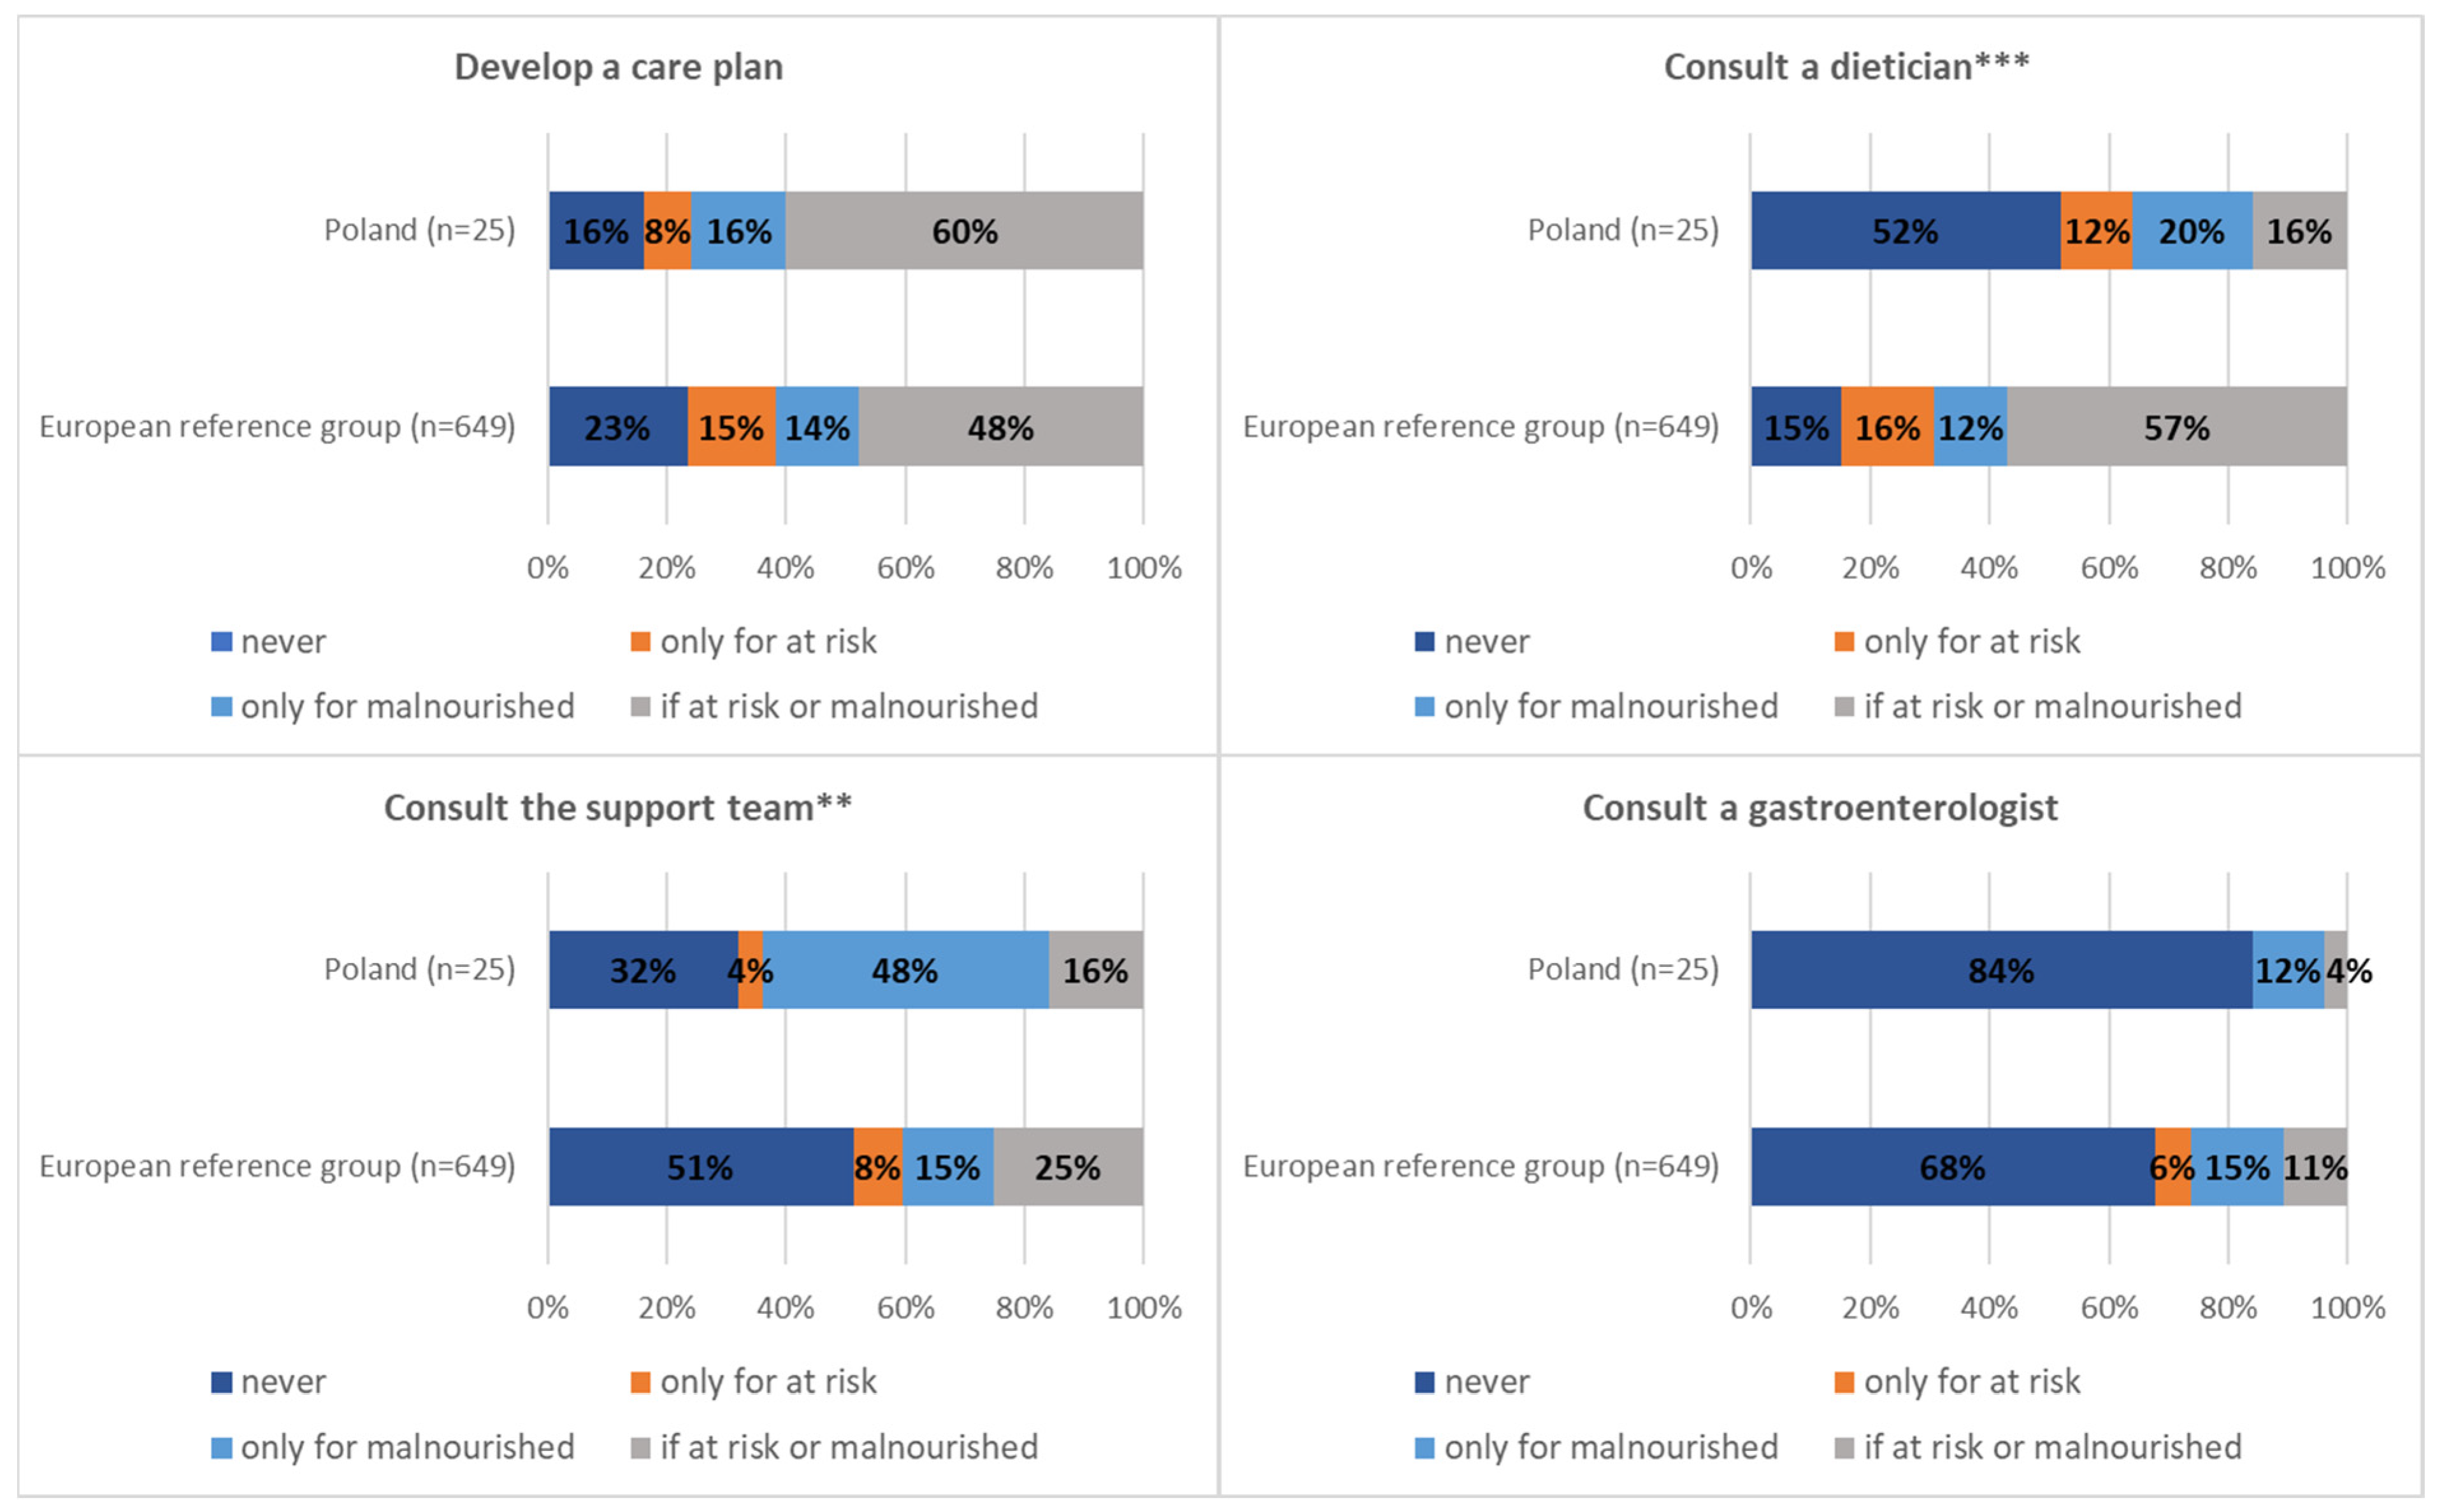
| Develop an individual nutrition care plan | 15 (60%) | 310 (47.8%) | Ns | |
| Dietician consult in case of malnutrition/risk of malnutrition | 4 (16%) | 371 (57.2%) | <0.001 | |
| Support team consult in case of malnutrition/risk of malnutrition | 4 (16%) | 164 (25.3%) | <0.01 | |
| Gastroenterologist consult in case of malnutrition/risk of malnutrition | 1 (4%) | 70 (10.8%) | Ns | |
Publisher’s Note: MDPI stays neutral with regard to jurisdictional claims in published maps and institutional affiliations. |
© 2021 by the authors. Licensee MDPI, Basel, Switzerland. This article is an open access article distributed under the terms and conditions of the Creative Commons Attribution (CC BY) license (http://creativecommons.org/licenses/by/4.0/).
Share and Cite
Ostrowska, J.; Sulz, I.; Tarantino, S.; Hiesmayr, M.; Szostak-Węgierek, D. Hospital Malnutrition, Nutritional Risk Factors, and Elements of Nutritional Care in Europe: Comparison of Polish Results with All European Countries Participating in the nDay Survey. Nutrients 2021, 13, 263. https://0-doi-org.brum.beds.ac.uk/10.3390/nu13010263
Ostrowska J, Sulz I, Tarantino S, Hiesmayr M, Szostak-Węgierek D. Hospital Malnutrition, Nutritional Risk Factors, and Elements of Nutritional Care in Europe: Comparison of Polish Results with All European Countries Participating in the nDay Survey. Nutrients. 2021; 13(1):263. https://0-doi-org.brum.beds.ac.uk/10.3390/nu13010263
Chicago/Turabian StyleOstrowska, Joanna, Isabella Sulz, Silvia Tarantino, Michael Hiesmayr, and Dorota Szostak-Węgierek. 2021. "Hospital Malnutrition, Nutritional Risk Factors, and Elements of Nutritional Care in Europe: Comparison of Polish Results with All European Countries Participating in the nDay Survey" Nutrients 13, no. 1: 263. https://0-doi-org.brum.beds.ac.uk/10.3390/nu13010263