
Protective Effects of Individual and Combined Low Dose Beta-Carotene and Metformin Treatments against High-Fat Diet-Induced Responses in Mice

 , and
, and 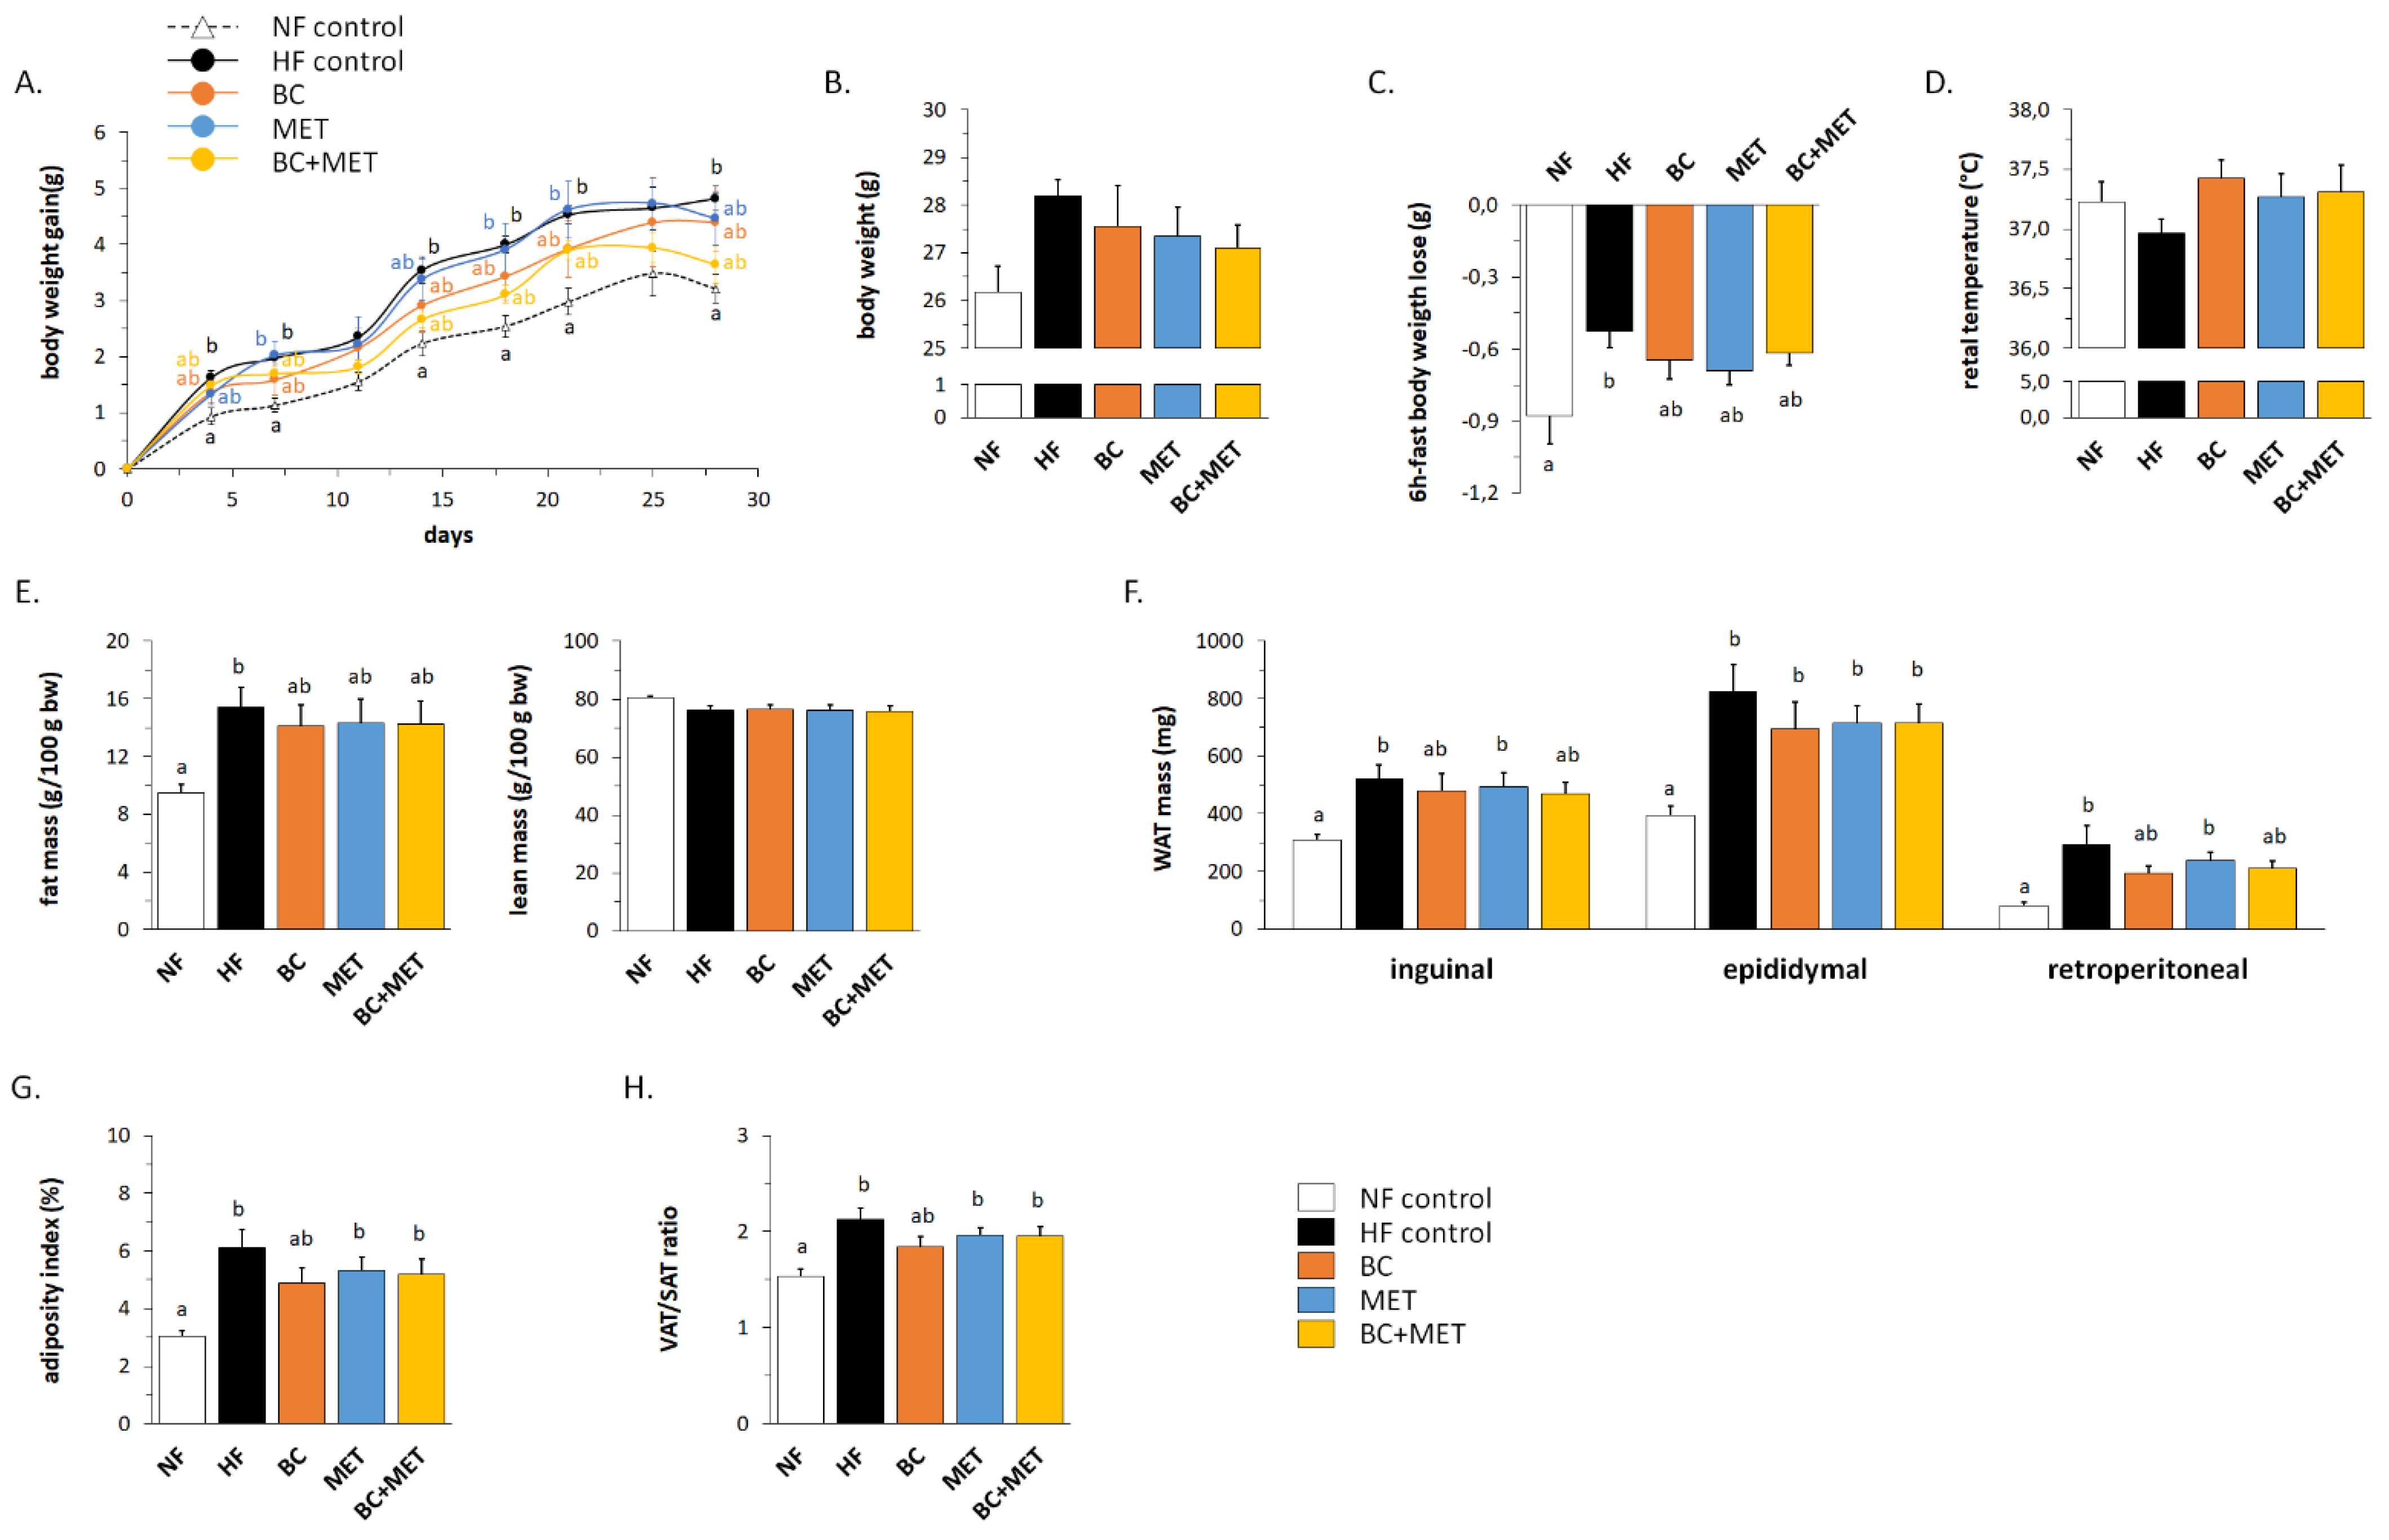
Abstract
:1. Introduction
2. Materials and Methods
2.1. Animal Experiment
2.2. Blood Parameters and Surrogate Indexes of Insulin Resistance and Sensitivity
2.3. Liver Total Lipid Content
2.4. RNA Isolation, Retrotranscription and Real-Time PCR Amplification
2.5. Immunoblotting
2.6. Histology and Immunohistochemistry
2.7. Statistical Analysis
3. Results
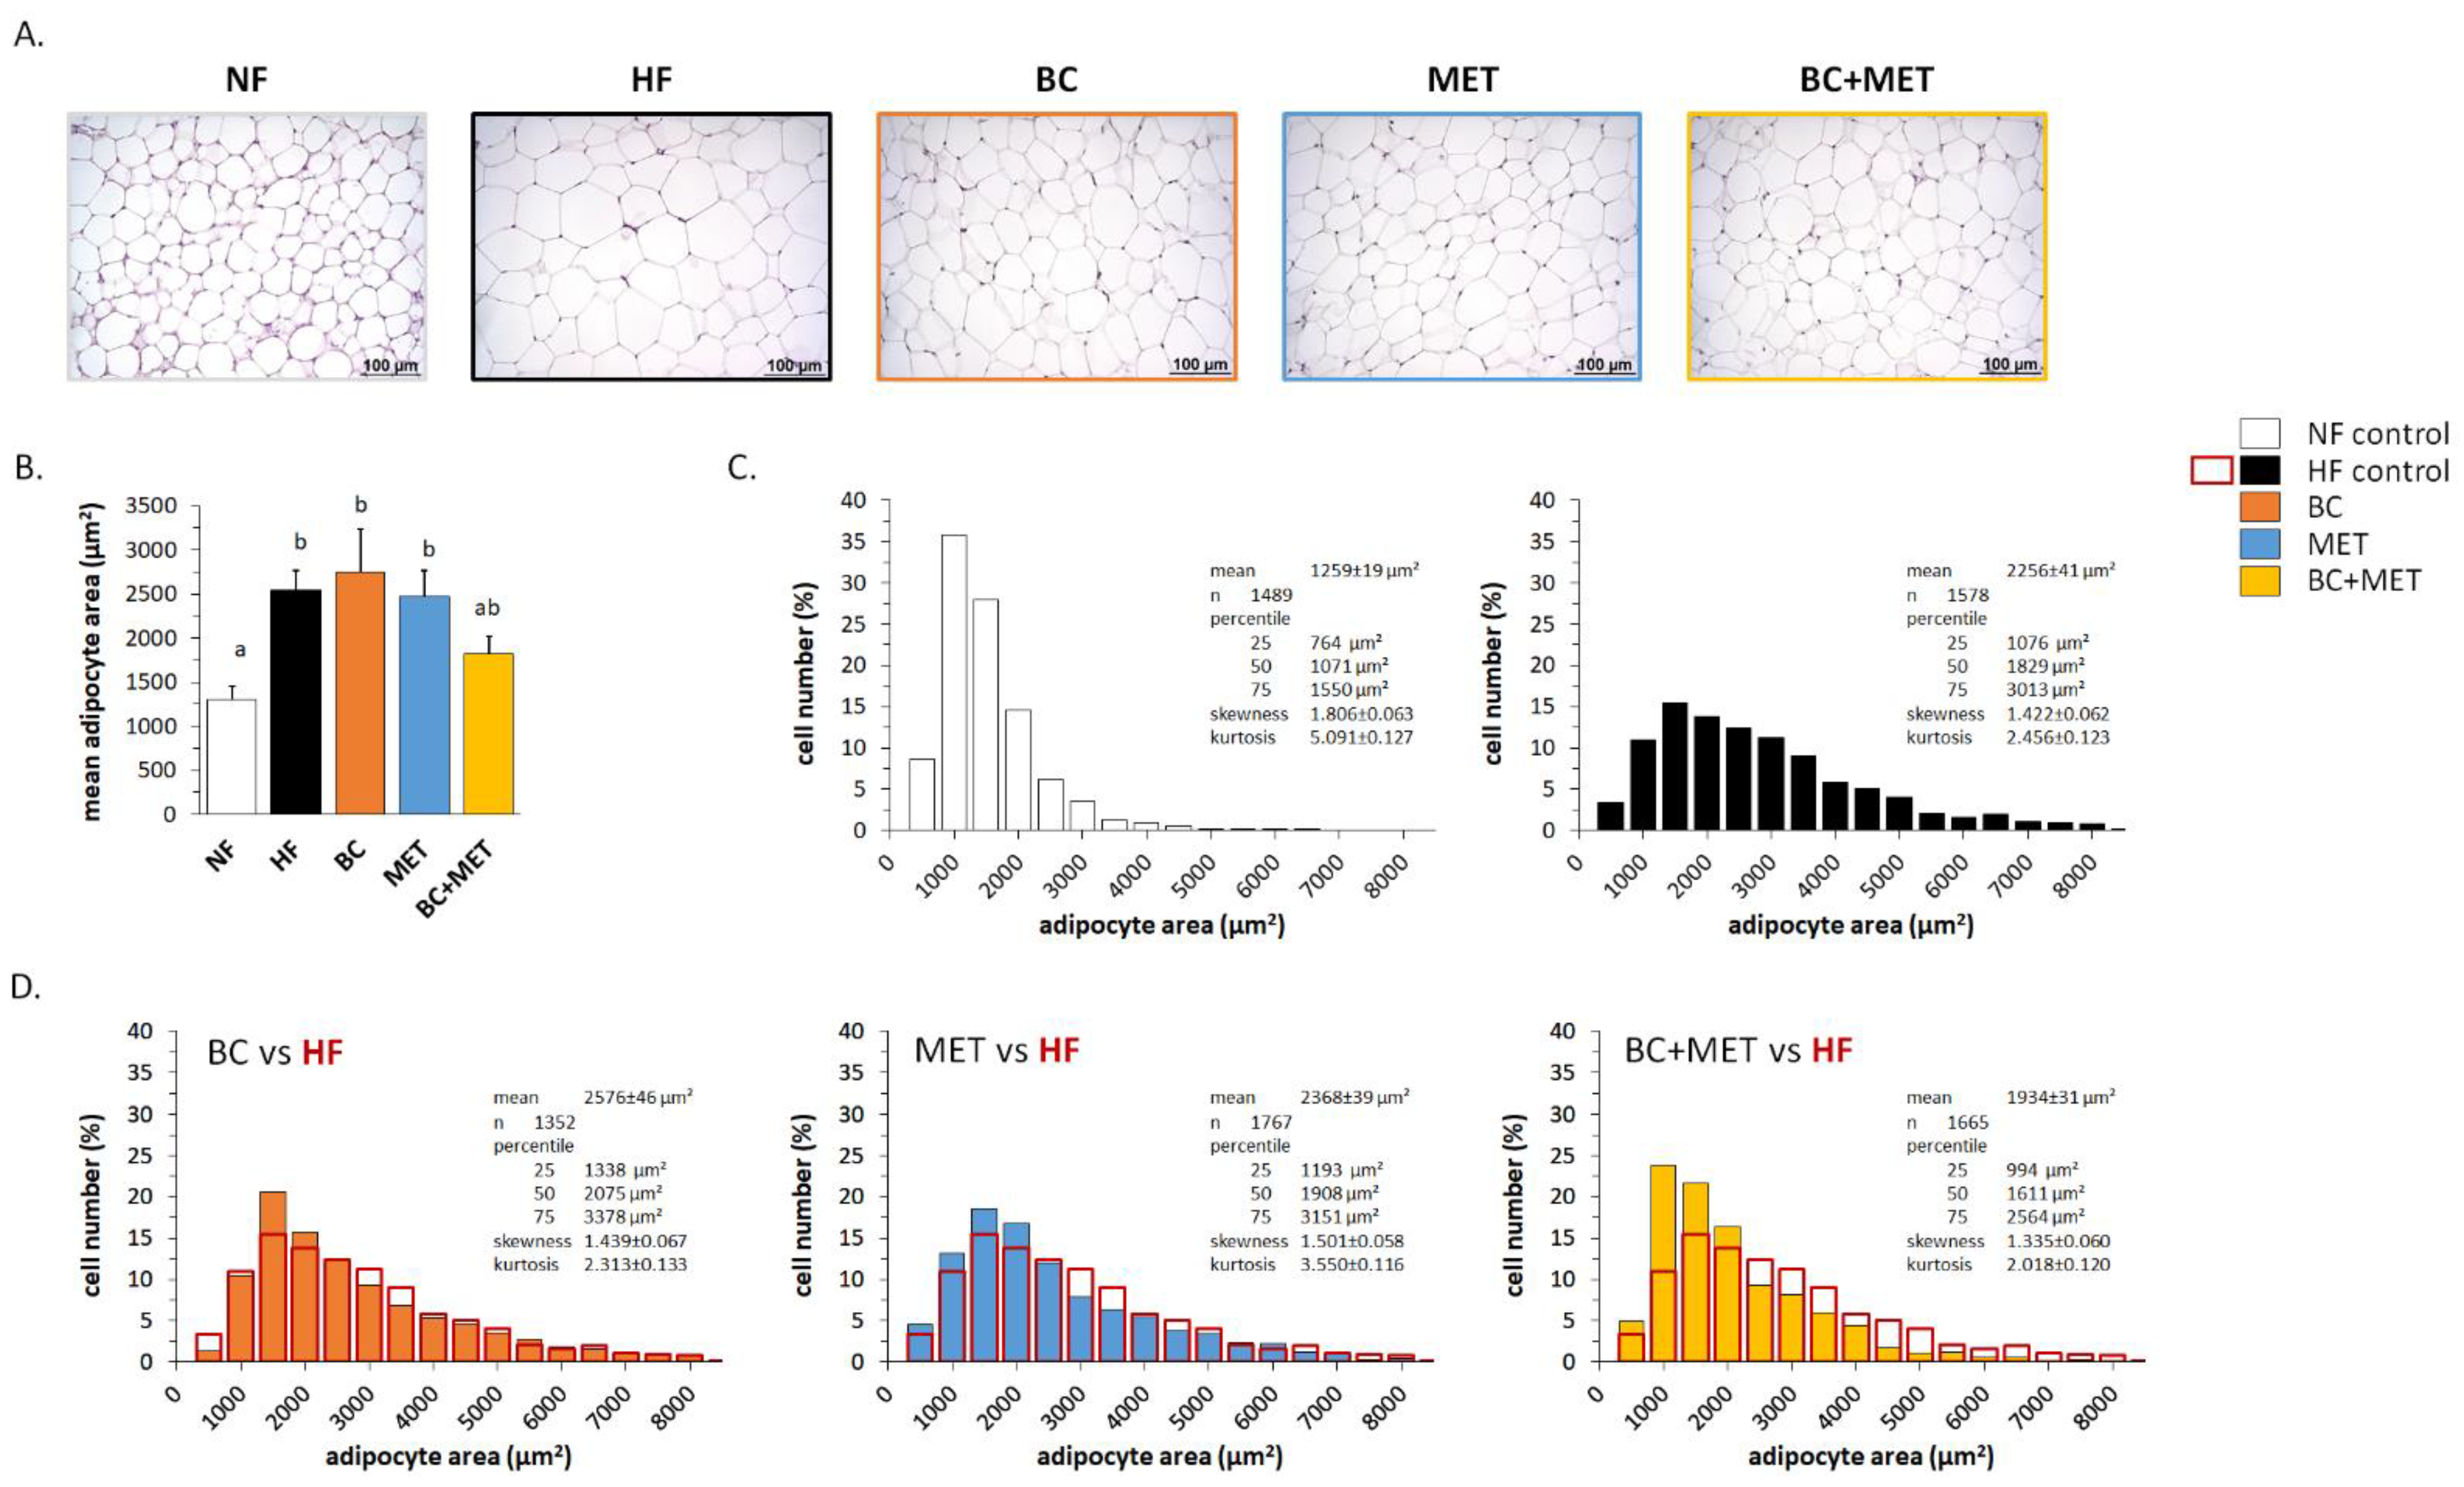
3.1. Biometric and Adiposity Parameters
3.2. Glucose Control-Related Parameters
3.3. Energy Metabolism-Related Gene Expression in Brown Adipose Tissue
3.4. Energy Metabolism-Related Gene Expression in White Adipose Tissue Depots
3.5. Liver Parameters
3.6. Gene Expression in Skeletal Muscle
4. Discussion
Author Contributions
Funding
Institutional Review Board Statement
Informed Consent Statement
Data Availability Statement
Acknowledgments
Conflicts of Interest
References
- Scolaro, B.; Soo Jin Kim, H.; de Castro, I.A. Bioactive compounds as an alternative for drug co-therapy: Overcoming challenges in cardiovascular disease prevention. Crit. Rev. Food Sci. Nutr. 2018, 58, 958–971. [Google Scholar] [CrossRef]
- Rodriguez-Concepcion, M.; Avalos, J.; Bonet, M.L.; Boronat, A.; Gomez-Gomez, L.; Hornero-Mendez, D.; Limon, M.C.; Melendez-Martinez, A.J.; Olmedilla-Alonso, B.; Palou, A.; et al. A global perspective on carotenoids: Metabolism, biotechnology, and benefits for nutrition and health. Prog. Lipid. Res. 2018, 70, 62–93. [Google Scholar] [CrossRef] [Green Version]
- Seif El-Din, S.H.; El-Lakkany, N.M.; El-Naggar, A.A.; Hammam, O.A.; Abd El-Latif, H.A.; Ain-Shoka, A.A.; Ebeid, F.A. Effects of rosuvastatin and/or beta-carotene on non-alcoholic fatty liver in rats. Res. Pharm. Sci. 2015, 10, 275–287. [Google Scholar]
- Bonet, M.L.; Canas, J.A.; Ribot, J.; Palou, A. Carotenoids and their conversion products in the control of adipocyte function, adiposity and obesity. Arch. Biochem. Biophys. 2015, 572, 112–125. [Google Scholar] [CrossRef] [PubMed] [Green Version]
- Canas, J.A.; Lochrie, A.; McGowan, A.G.; Hossain, J.; Schettino, C.; Balagopal, P.B. Effects of Mixed Carotenoids on Adipokines and Abdominal Adiposity in Children: A Pilot Study. J. Clin. Endocrinol. Metab. 2017, 102, 1983–1990. [Google Scholar] [CrossRef] [PubMed] [Green Version]
- Coronel, J.; Pinos, I.; Amengual, J. beta-carotene in Obesity Research: Technical Considerations and Current Status of the Field. Nutrients 2019, 11, 842. [Google Scholar] [CrossRef] [Green Version]
- Bonet, M.L.; Ribot, J.; Galmes, S.; Serra, F.; Palou, A. Carotenoids and carotenoid conversion products in adipose tissue biology and obesity: Pre-clinical and human studies. Biochim. Biophys. Acta Mol. Cell Biol. Lipids 2020, 1865, 158676. [Google Scholar] [CrossRef]
- Csepanyi, E.; Czompa, A.; Szabados-Furjesi, P.; Lekli, I.; Balla, J.; Balla, G.; Tosaki, A.; Bak, I. The Effects of Long-Term, Low- and High-Dose Beta-Carotene Treatment in Zucker Diabetic Fatty Rats: The Role of HO-1. Int. J. Mol. Sci. 2018, 19, 1132. [Google Scholar] [CrossRef] [Green Version]
- Amengual, J.; Coronel, J.; Marques, C.; Aradillas-Garcia, C.; Morales, J.M.V.; Andrade, F.C.D.; Erdman, J.W.; Teran-Garcia, M. beta-Carotene Oxygenase 1 Activity Modulates Circulating Cholesterol Concentrations in Mice and Humans. J. Nutr. 2020, 150, 2023–2030. [Google Scholar] [CrossRef]
- Zhou, F.; Wu, X.; Pinos, I.; Abraham, B.M.; Barrett, T.J.; von Lintig, J.; Fisher, E.A.; Amengual, J. beta-Carotene conversion to vitamin A delays atherosclerosis progression by decreasing hepatic lipid secretion in mice. J. Lipid Res. 2020, 61, 1491–1503. [Google Scholar] [CrossRef]
- Lobo, G.P.; Amengual, J.; Li, H.N.; Golczak, M.; Bonet, M.L.; Palczewski, K.; von Lintig, J. Beta, beta-carotene decreases peroxisome proliferator receptor gamma activity and reduces lipid storage capacity of adipocytes in a beta, beta-carotene oxygenase 1-dependent manner. J. Biol. Chem. 2010, 285, 27891–27899. [Google Scholar] [CrossRef] [Green Version]
- Amengual, J.; Gouranton, E.; van Helden, Y.G.; Hessel, S.; Ribot, J.; Kramer, E.; Kiec-Wilk, B.; Razny, U.; Lietz, G.; Wyss, A.; et al. Beta-carotene reduces body adiposity of mice via BCMO1. PLoS ONE 2011, 6, e20644. [Google Scholar] [CrossRef] [PubMed]
- Puigserver, P.; Vazquez, F.; Bonet, M.L.; Pico, C.; Palou, A. In vitro and in vivo induction of brown adipocyte uncoupling protein (thermogenin) by retinoic acid. Biochem. J. 1996, 317 (Pt 3), 827–833. [Google Scholar] [CrossRef] [Green Version]
- Bonet, M.L.; Oliver, J.; Pico, C.; Felipe, F.; Ribot, J.; Cinti, S.; Palou, A. Opposite effects of feeding a vitamin A-deficient diet and retinoic acid treatment on brown adipose tissue uncoupling protein 1 (UCP1), UCP2 and leptin expression. J. Endocrinol. 2000, 166, 511–517. [Google Scholar] [CrossRef] [PubMed] [Green Version]
- Mercader, J.; Ribot, J.; Murano, I.; Felipe, F.; Cinti, S.; Bonet, M.L.; Palou, A. Remodeling of white adipose tissue after retinoic acid administration in mice. Endocrinology 2006, 147, 5325–5332. [Google Scholar] [CrossRef] [PubMed] [Green Version]
- Amengual, J.; Ribot, J.; Bonet, M.L.; Palou, A. Retinoic acid treatment increases lipid oxidation capacity in skeletal muscle of mice. Obesity (Silver Spring) 2008, 16, 585–591. [Google Scholar] [CrossRef]
- Amengual, J.; Ribot, J.; Bonet, M.L.; Palou, A. Retinoic acid treatment enhances lipid oxidation and inhibits lipid biosynthesis capacities in the liver of mice. Cell. Physiol. Biochem. 2010, 25, 657–666. [Google Scholar] [CrossRef]
- Murano, I.; Morroni, M.; Zingaretti, M.C.; Oliver, P.; Sanchez, J.; Fuster, A.; Pico, C.; Palou, A.; Cinti, S. Morphology of ferret subcutaneous adipose tissue after 6-month daily supplementation with oral beta-carotene. Biochim. Biophys. Acta 2005, 1740, 305–312. [Google Scholar] [CrossRef] [Green Version]
- Sanchez, J.; Fuster, A.; Oliver, P.; Palou, A.; Pico, C. Effects of beta-carotene supplementation on adipose tissue thermogenic capacity in ferrets (Mustela putorius furo). Br. J. Nutr. 2009, 102, 1686–1694. [Google Scholar] [CrossRef] [Green Version]
- Bailey, C.J. Metformin: Historical overview. Diabetologia 2017, 60, 1566–1576. [Google Scholar] [CrossRef] [Green Version]
- Garber, A.J.; Duncan, T.G.; Goodman, A.M.; Mills, D.J.; Rohlf, J.L. Efficacy of metformin in type II diabetes: Results of a double-blind, placebo-controlled, dose-response trial. Am. J. Med. 1997, 103, 491–497. [Google Scholar] [CrossRef]
- Astiz, S.; Gonzalez-Bulnes, A.; Astiz, I.; Barbero, A.; Pesantez-Pacheco, J.L.; Garcia-Contreras, C.; Vazquez-Gomez, M.; Heras-Molina, A. Metformin Alleviates Obesity and Systemic Oxidative Stress in Obese Young Swine. Pharmaceuticals 2020, 13, 142. [Google Scholar] [CrossRef] [PubMed]
- Masarwa, R.; Brunetti, V.C.; Aloe, S.; Henderson, M.; Platt, R.W.; Filion, K.B. Efficacy and Safety of Metformin for Obesity: A Systematic Review. Pediatrics 2021, 147, e20201610. [Google Scholar] [CrossRef] [PubMed]
- Sadeghi, A.; Mousavi, S.M.; Mokhtari, T.; Parohan, M.; Milajerdi, A. Metformin Therapy Reduces Obesity Indices in Children and Adolescents: A Systematic Review and Meta-Analysis of Randomized Clinical Trials. Child. Obes. 2020, 16, 174–191. [Google Scholar] [CrossRef] [Green Version]
- Yerevanian, A.; Soukas, A.A. Metformin: Mechanisms in Human Obesity and Weight Loss. Curr. Obes. Rep. 2019, 8, 156–164. [Google Scholar] [CrossRef]
- Tokubuchi, I.; Tajiri, Y.; Iwata, S.; Hara, K.; Wada, N.; Hashinaga, T.; Nakayama, H.; Mifune, H.; Yamada, K. Beneficial effects of metformin on energy metabolism and visceral fat volume through a possible mechanism of fatty acid oxidation in human subjects and rats. PLoS ONE 2017, 12, e0171293. [Google Scholar] [CrossRef]
- Coll, A.P.; Chen, M.; Taskar, P.; Rimmington, D.; Patel, S.; Tadross, J.A.; Cimino, I.; Yang, M.; Welsh, P.; Virtue, S.; et al. GDF15 mediates the effects of metformin on body weight and energy balance. Nature 2020, 578, 444–448. [Google Scholar] [CrossRef]
- Reagan-Shaw, S.; Nihal, M.; Ahmad, N. Dose translation from animal to human studies revisited. FASEB J. 2008, 22, 659–661. [Google Scholar] [CrossRef] [Green Version]
- Matthews, D.R.; Hosker, J.P.; Rudenski, A.S.; Naylor, B.A.; Treacher, D.F.; Turner, R.C. Homeostasis model assessment: Insulin resistance and beta-cell function from fasting plasma glucose and insulin concentrations in man. Diabetologia 1985, 28, 412–419. [Google Scholar] [CrossRef] [Green Version]
- Perseghin, G.; Caumo, A.; Caloni, M.; Testolin, G.; Luzi, L. Incorporation of the fasting plasma FFA concentration into QUICKI improves its association with insulin sensitivity in nonobese individuals. J. Clin. Endocrinol. Metab. 2001, 86, 4776–4781. [Google Scholar] [CrossRef]
- Serrano, A.; Ribot, J.; Palou, A.; Bonet, M.L. Long-term programming of skeletal muscle and liver lipid and energy metabolism by resveratrol supplementation to suckling mice. J. Nutr. Biochem. 2021, 95, 108770. [Google Scholar] [CrossRef]
- Petrov, P.D.; Ribot, J.; Palou, A.; Bonet, M.L. Improved metabolic regulation is associated with retinoblastoma protein gene haploinsufficiency in mice. Am. J. Physiol. Endocrinol. Metab. 2015, 308, E172–E183. [Google Scholar] [CrossRef] [Green Version]
- Fromme, T.; Klingenspor, M. Uncoupling protein 1 expression and high-fat diets. Am. J. Physiol. Regul. Integr. Comp. Physiol. 2011, 300, R1–R8. [Google Scholar] [CrossRef]
- McNeill, B.T.; Morton, N.M.; Stimson, R.H. Substrate Utilization by Brown Adipose Tissue: What’s Hot and What’s Not? Front. Endocrinol (Lausanne) 2020, 11, 571659. [Google Scholar] [CrossRef]
- Boutant, M.; Kulkarni, S.S.; Joffraud, M.; Ratajczak, J.; Valera-Alberni, M.; Combe, R.; Zorzano, A.; Canto, C. Mfn2 is critical for brown adipose tissue thermogenic function. EMBO J. 2017, 36, 1543–1558. [Google Scholar] [CrossRef] [Green Version]
- Voigt, A.; Ribot, J.; Sabater, A.G.; Palou, A.; Bonet, M.L.; Klaus, S. Identification of Mest/Peg1 gene expression as a predictive biomarker of adipose tissue expansion sensitive to dietary anti-obesity interventions. Genes Nutr. 2015, 10, 477. [Google Scholar] [CrossRef] [Green Version]
- Mancini, G.; Pirruccio, K.; Yang, X.; Bluher, M.; Rodeheffer, M.; Horvath, T.L. Mitofusin 2 in Mature Adipocytes Controls Adiposity and Body Weight. Cell Rep. 2019, 26, 2849–2858.e2844. [Google Scholar] [CrossRef] [Green Version]
- Choi, M.S.; Kim, Y.J.; Kwon, E.Y.; Ryoo, J.Y.; Kim, S.R.; Jung, U.J. High-fat diet decreases energy expenditure and expression of genes controlling lipid metabolism, mitochondrial function and skeletal system development in the adipose tissue, along with increased expression of extracellular matrix remodelling- and inflammation-related genes. Br. J. Nutr. 2015, 113, 867–877. [Google Scholar] [CrossRef] [Green Version]
- Grefhorst, A.; van de Peppel, I.P.; Larsen, L.E.; Jonker, J.W.; Holleboom, A.G. The Role of Lipophagy in the Development and Treatment of Non-Alcoholic Fatty Liver Disease. Front. Endocrinol. (Lausanne) 2020, 11, 601627. [Google Scholar] [CrossRef]
- Hepler, C.; Gupta, R.K. The expanding problem of adipose depot remodeling and postnatal adipocyte progenitor recruitment. Mol. Cell. Endocrinol. 2017, 445, 95–108. [Google Scholar] [CrossRef] [Green Version]
- Longo, M.; Zatterale, F.; Naderi, J.; Parrillo, L.; Formisano, P.; Raciti, G.A.; Beguinot, F.; Miele, C. Adipose Tissue Dysfunction as Determinant of Obesity-Associated Metabolic Complications. Int. J. Mol. Sci. 2019, 20, 2358. [Google Scholar] [CrossRef] [Green Version]
- Lin, S.; Thomas, T.C.; Storlien, L.H.; Huang, X.F. Development of high fat diet-induced obesity and leptin resistance in C57Bl/6J mice. Int. J. Obes. Relat. Metab. Disord. 2000, 24, 639–646. [Google Scholar] [CrossRef] [Green Version]
- Seale, P.; Conroe, H.M.; Estall, J.; Kajimura, S.; Frontini, A.; Ishibashi, J.; Cohen, P.; Cinti, S.; Spiegelman, B.M. Prdm16 determines the thermogenic program of subcutaneous white adipose tissue in mice. J. Clin. Investig. 2011, 121, 96–105. [Google Scholar] [CrossRef] [PubMed] [Green Version]
- Voigt, A.; Agnew, K.; van Schothorst, E.M.; Keijer, J.; Klaus, S. Short-term, high fat feeding-induced changes in white adipose tissue gene expression are highly predictive for long-term changes. Mol. Nutr. Food Res. 2013, 57, 1423–1434. [Google Scholar] [CrossRef] [PubMed]
- Rouru, J.; Isaksson, K.; Santti, E.; Huupponen, R.; Koulu, M. Metformin and brown adipose tissue thermogenetic activity in genetically obese Zucker rats. Eur. J. Pharmacol. 1993, 246, 67–71. [Google Scholar] [CrossRef]
- Keates, A.C.; Bailey, C.J. Metformin does not increase energy expenditure of brown fat. Biochem. Pharmacol. 1993, 45, 971–973. [Google Scholar] [CrossRef]
- Breining, P.; Jensen, J.B.; Sundelin, E.I.; Gormsen, L.C.; Jakobsen, S.; Busk, M.; Rolighed, L.; Bross, P.; Fernandez-Guerra, P.; Markussen, L.K.; et al. Metformin targets brown adipose tissue in vivo and reduces oxygen consumption in vitro. Diabetes Obes. Metab. 2018, 20, 2264–2273. [Google Scholar] [CrossRef] [PubMed]
- Geerling, J.J.; Boon, M.R.; van der Zon, G.C.; van den Berg, S.A.; van den Hoek, A.M.; Lombes, M.; Princen, H.M.; Havekes, L.M.; Rensen, P.C.; Guigas, B. Metformin lowers plasma triglycerides by promoting VLDL-triglyceride clearance by brown adipose tissue in mice. Diabetes 2014, 63, 880–891. [Google Scholar] [CrossRef] [Green Version]
- Karise, I.; Bargut, T.C.; Del Sol, M.; Aguila, M.B.; Mandarim-de-Lacerda, C.A. Metformin enhances mitochondrial biogenesis and thermogenesis in brown adipocytes of mice. Biomed. Pharmacother. 2019, 111, 1156–1165. [Google Scholar] [CrossRef]
- Kim, E.K.; Lee, S.H.; Lee, S.Y.; Kim, J.K.; Jhun, J.Y.; Na, H.S.; Kim, S.Y.; Choi, J.Y.; Yang, C.W.; Park, S.H.; et al. Metformin ameliorates experimental-obesity-associated autoimmune arthritis by inducing FGF21 expression and brown adipocyte differentiation. Exp. Mol. Med. 2018, 50, e432. [Google Scholar] [CrossRef]
- Flachs, P.; Rossmeisl, M.; Kuda, O.; Kopecky, J. Stimulation of mitochondrial oxidative capacity in white fat independent of UCP1: A key to lean phenotype. Biochim. Biophys. Acta 2013, 1831, 986–1003. [Google Scholar] [CrossRef] [PubMed] [Green Version]
- Harari, A.; Harats, D.; Marko, D.; Cohen, H.; Barshack, I.; Kamari, Y.; Gonen, A.; Gerber, Y.; Ben-Amotz, A.; Shaish, A. A 9-cis beta-carotene-enriched diet inhibits atherogenesis and fatty liver formation in LDL receptor knockout mice. J. Nutr. 2008, 138, 1923–1930. [Google Scholar] [CrossRef] [PubMed] [Green Version]
- Clugston, R.D. Carotenoids and fatty liver disease: Current knowledge and research gaps. Biochim. Biophys. Acta Mol. Cell Biol. Lipids 2020, 1865, 158597. [Google Scholar] [CrossRef] [PubMed]
- LaMoia, T.E.; Shulman, G.I. Cellular and Molecular Mechanisms of Metformin Action. Endocr. Rev. 2021, 42, 77–96. [Google Scholar] [CrossRef] [PubMed]
- Collier, C.A.; Bruce, C.R.; Smith, A.C.; Lopaschuk, G.; Dyck, D.J. Metformin counters the insulin-induced suppression of fatty acid oxidation and stimulation of triacylglycerol storage in rodent skeletal muscle. Am. J. Physiol. Endocrinol. Metab. 2006, 291, E182–E189. [Google Scholar] [CrossRef]
- Wang, C.; Liu, F.; Yuan, Y.; Wu, J.; Wang, H.; Zhang, L.; Hu, P.; Li, Z.; Li, Q.; Ye, J. Metformin suppresses lipid accumulation in skeletal muscle by promoting fatty acid oxidation. Clin. Lab. 2014, 60, 887–896. [Google Scholar] [CrossRef] [PubMed]
- Zabielski, P.; Chacinska, M.; Charkiewicz, K.; Baranowski, M.; Gorski, J.; Blachnio-Zabielska, A.U. Effect of metformin on bioactive lipid metabolism in insulin-resistant muscle. J. Endocrinol. 2017, 233, 329–340. [Google Scholar] [CrossRef] [Green Version]
- Ribaya-Mercado, J.D.; Holmgren, S.C.; Fox, J.G.; Russell, R.M. Dietary beta-carotene absorption and metabolism in ferrets and rats. J. Nutr. 1989, 119, 665–668. [Google Scholar] [CrossRef]
- Lee, C.M.; Boileau, A.C.; Boileau, T.W.; Williams, A.W.; Swanson, K.S.; Heintz, K.A.; Erdman, J.W., Jr. Review of animal models in carotenoid research. J. Nutr. 1999, 129, 2271–2277. [Google Scholar] [CrossRef]
- Burkle, A.; Moreno-Villanueva, M.; Bernhard, J.; Blasco, M.; Zondag, G.; Hoeijmakers, J.H.; Toussaint, O.; Grubeck-Loebenstein, B.; Mocchegiani, E.; Collino, S.; et al. MARK-AGE biomarkers of ageing. Mech. Ageing Dev. 2015, 151, 2–12. [Google Scholar] [CrossRef]


Publisher’s Note: MDPI stays neutral with regard to jurisdictional claims in published maps and institutional affiliations. |
© 2021 by the authors. Licensee MDPI, Basel, Switzerland. This article is an open access article distributed under the terms and conditions of the Creative Commons Attribution (CC BY) license (https://creativecommons.org/licenses/by/4.0/).
Share and Cite
Stojnić, B.; Serrano, A.; Sušak, L.; Palou, A.; Bonet, M.L.; Ribot, J. Protective Effects of Individual and Combined Low Dose Beta-Carotene and Metformin Treatments against High-Fat Diet-Induced Responses in Mice. Nutrients 2021, 13, 3607. https://0-doi-org.brum.beds.ac.uk/10.3390/nu13103607
Stojnić B, Serrano A, Sušak L, Palou A, Bonet ML, Ribot J. Protective Effects of Individual and Combined Low Dose Beta-Carotene and Metformin Treatments against High-Fat Diet-Induced Responses in Mice. Nutrients. 2021; 13(10):3607. https://0-doi-org.brum.beds.ac.uk/10.3390/nu13103607
Chicago/Turabian StyleStojnić, Bojan, Alba Serrano, Lana Sušak, Andreu Palou, M. Luisa Bonet, and Joan Ribot. 2021. "Protective Effects of Individual and Combined Low Dose Beta-Carotene and Metformin Treatments against High-Fat Diet-Induced Responses in Mice" Nutrients 13, no. 10: 3607. https://0-doi-org.brum.beds.ac.uk/10.3390/nu13103607