Article

Peripancreatic Adipose Tissue Remodeling and Inflammation during High Fat Intake of Palm Oils or Lard in Rats

1
RD-Néphrologie, 34090 Montpellier, France
2
BC2M, UR-UM 101, UFR Pharmacie, Université de Montpellier, 34090 Montpellier, France
3
PHYMEDEXP, INSERM, CNRS, Université de Montpellier, 34090 Montpellier, France
4
DMEM, EMN, UMR 866, INRAe, Université de Montpellier, 34090 Montpellier, France
5
IBMM, UMR 5247, CNRS, Université de Montpellier, ENSCM, 34090 Montpellier, France
*
Author to whom correspondence should be addressed.
Submission received: 17 February 2021 / Revised: 19 March 2021 / Accepted: 25 March 2021 / Published: 30 March 2021
(This article belongs to the Special Issue Diet and Adipose Tissue)

Abstract

:
Excessive fat consumption leads to the development of ectopic adipose tissues, affecting the organs they surround. Peripancreatic adipose tissue is implicated in glucose homeostasis regulation and can be impaired in obesity. High palm oil consumption’s effects on health are still debated. We hypothesised that crude and refined palm oil high-fat feeding may have contrasting effects on peripancreatic adipocyte hypertrophy, inflammation and lipid oxidation compound production in obese rats. In Wistar rats, morphological changes, inflammation and isoprostanoid production following oxidative stress were assessed in peripancreatic adipose tissue after 12 weeks of diets enriched in crude or refined palm oil or lard (56% energy from fat in each case) versus a standard chow diet (11% energy from fat). Epididymal white and periaortic brown adipose tissues were also included in the study. A refined palm oil diet disturbed glucose homeostasis and promoted lipid deposition in periaortic locations, as well as adipocyte hypertrophy, macrophage infiltration and isoprostanoid (5-F2c-isoprostane and 7(RS)-ST-Δ8-11-dihomo-isofuran) production in peripancreatic adipose tissue. Crude palm oil induced a lower impact on adipose deposits than its refined form and lard. Our results show that the antioxidant composition of crude palm oil may have a protective effect on ectopic adipose tissues under the condition of excessive fat intake.

1. Introduction

High fat intake, associated with a sedentary lifestyle, contributes to the development of obesity and obesity-related disorders. Yet, the type of fatty acids provided may result in different levels of metabolic alterations. Palm oil is available in different forms, which include crude or red palm oil (crude PO) and refined palm olein (refined PO) [1]. Despite a known beneficial influence of crude PO in cardiovascular disease and its many nutritional qualities and benefits [2,3], the presence of palmitic acid in palm oil is an argument to avoid palm oil consumption (see [4] for a review), on top of questions about the sustainability of its production [5]. However, crude PO contains compounds such as carotenoids and tocopherols which may provide health benefits [1,6,7]. Yet, the evaluation of PO effects on health has mainly focused on blood lipids, cardiovascular diseases, cancer and type 2 diabetes, with mixed results [8,9].
When over-consumed, a fat-rich diet leads to lipid accumulation in various adipose tissues (ATs). No longer regarded as a storage depot only, fat is an endocrine organ producing adipokines that act locally and systemically to modulate energy homeostasis, insulin resistance and inflammatory status [10,11]. Specific structural and functional changes are observed in obese visceral adipose tissue, together with local inflammation and adipokine production, promoting metabolic disturbances [12,13]. Obesity leads to the presence of ectopic fat surrounding organs and to the accumulation of lipids in tissues themselves. In the liver, short-term feeding with an enriched palm oil diet was associated with a more marked hepatic lipid accumulation compared to a sunflower oil-enriched diet. It was concluded that palm oil further altered liver lipid metabolism [14]. However, we previously reported that excessive and long-term intake of crude or refined PO had no significant effect on liver steatosis, while it did affect glucose tolerance [15]. Adipose tissue’s association with various organs suggests local interactions. In the heart, epicardial adipose tissue may increase pro-inflammatory cytokine production, such as IL-6, which affects local endothelium [16]. Recently, Al-Dibouni et al. [17] showed that both TNF-α and IL-6 mRNA levels were enhanced specifically in pericardial adipose tissue in mice. On the other hand, local biocommunication between the pancreas and the surrounding adipose tissue occurs and is altered during obesity [18,19]. Secreted factors from peripancreatic white adipose tissue (pWAT) of Zucker diabetic fatty (ZDF) rats were reported to impair insulin secretion, cellular proliferation and apoptosis of INS-1 cells [20]. Moreover, in insulin-resistant patients, pancreatic fat content could favour a local pro-inflammatory environment and was negatively associated with insulin secretion [21]. Adipose tissue remodelling and inflammatory status following high fat intake are dependent on the lipid [22] and antioxidant [23,24] composition of the diets. In this context, specific local pro-inflammatory changes in pWAT after PO-rich diets may have systemic consequences regarding insulin resistance and glucose homeostasis.
On a different note, high reactive oxygen species (ROS) production can appear in AT during obesity and AT accumulation correlates with an increase in systemic oxidative stress [25]. Oxidative stress regulation is of major concern for adipose tissue metabolism since it influences its inflammation [26] and can protect it from insulin resistance [27]. Free radical production in AT may lead to an increase in local isoprostanoid formation and release. Isoprostanoids are a family of oxidised lipids produced by the non-enzymatic oxidation of fatty acids, mainly arachidonic acid, from membrane phospholipids. Since the discovery of isoprostanoid formation in vivo [28], they have been widely studied to assess circulating or tissue oxidative stress in numerous pathologies [29]. Moreover, isoprostanoids are bioactive compounds that can influence many processes such as angiogenesis, macrophage migration and inflammation, thus participating in adipose tissue physiology [30,31].
In the present study, we hypothesised that high-fat feeding induces ectopic lipid deposition in peripancreatic adipose tissue, affecting inflammation and lipid oxidation compound production locally. The effect of refined PO was compared to crude PO and to a diet enriched with lard. Our results indicate that unlike crude PO, a refined PO diet induces specific changes in pWAT in terms of adipocyte hypertrophy, inflammation and oxidative stress.

2. Materials and Methods

2.1. Animals and Diets

Twenty-eight male Wistar rats (Charles River, L’Arbresle, France) aged 6 weeks at the beginning of experiments were housed under conditions of constant temperature (20–22 °C), humidity (45–50%) and a standard dark cycle (20.00–08.00 h) with free access to food and water. Rats were assigned to four groups of seven animals and fed for 12 weeks either a standard rat chow diet (control group) or one of the three high-fat (HF) diets. In the control diet, 11% of the energy was given by fat (5% soybean oil) whereas in enriched diets, 56% of the energy was provided by fat intake [15]. The fat-enriched diets consisted in 2.5% (w/w) of soybean oil and 30% (w/w) of crude PO, refined PO (Elaeis guineensis tenera, Sanya Cie, Abidjan, Côte d’Ivoire) or lard (Alva, Rezé, France). The fatty acid composition of oils is reported in Supplementary Table S1. Typical amounts of vitamin E, carotenoids and polyphenols in the crude and refined PO are shown in Supplementary Table S2. The experiments complied with the guidelines for the care and use of laboratory animals (National Academies Press US, 8th edition, 2011) and all procedures were approved by the local ethical committee (reference CEEA-LR-12002, Montpellier, France).

2.2. Tissue Sampling and Blood Parameters

Rats were fasted overnight, and blood was sampled via the abdominal artery under pentobarbital anaesthesia (55 mg/kg ip). After centrifugation at 1000× g for 10 min at 4 °C, plasma was collected and stored at −80 °C for glucose and insulin measurement.
Then, epididymal (eWAT), periaortic brown (AoBAT) and peripancreatic adipose tissue (pWAT) were removed, rinsed in PBS and flash frozen in liquid nitrogen. One piece of each was also fixed in 10% formalin before paraffin embedding for histological studies.
Plasma glucose, blood triglycerides and cholesterol were determined on a COBAS automated analyser (Roche Diagnostics, France) and insulin was quantified by an immunoassay kit (Mercodia Rat Insulin ELISA). The homeostasis model assessment of insulin resistance (HOMA-IR) was calculated using the follow equation: HOMA-IR = (fasting blood glucose in mM x fasting plasma insulin in mUI/L)/22.5.

2.3. Isoprostanoid Quantification

Isoprostanoids were extracted from peripancreatic adipose tissue according to the protocol described by Lee et al. [32]. Briefly, 200 mg of frozen samples were homogenised using Fast-Prep 24 (MP Biomedical, Santa Ana, CA, USA) in the presence of butylated hydroxytoluene (BHT), methanol and ethylene glycol-bis(2-aminoethyl- ether)-N,N,N′,N′-tetraacetic acid (EGTA). After the addition of internal standards into samples, the lipid fraction was recovered with Folch extraction. Then, alkaline hydrolysis was performed and total isoprostanoids were included in the analysis (esterified and free forms). They were purified using solid phase extraction (SPE) anion exchange cartridge separation (Waters, Milford, MA, USA) by a succession of washings and finally eluted in a mixture of hexane, ethanol and acetic acid. The elution solvent was evaporated under a nitrogen stream and concentrated residue was then solubilised. Isoprostanoid concentration was determined by liquid chromatography (LC)–mass spectrometry (MS), as recently described [33]. Note that for 5(RS)-5-F2t-IsoPs, 5(RS)-5-F2c-IsoPs and 7(RS)-ST-Δ8-11-dihomo-isofurans, the assay could not differentiate between the R/S isomers. Whatever the conditions used, each dosage was performed in duplicate.
Isoprostanoid concentrations were obtained in picograms (pg) of isoprostanoids per gram of adipose tissue and we chose to convert this value to pg per adipocyte. The average surface (cross-sectional area in µm2) of the adipocytes for each histological sample was determined as described in the next section. Assuming that fat cells were spherical, their average radius was calculated and we deduced their volume in cm3. Then, to determine adipocyte number per gram of TA, we considered an approximate density of pWAT of 0.94 (based on measurements of eWAT in the study of Rotondo et al. [34]), so 1 g of pWAT represented 1.064 cm3 ( = 1 0.94 ). The calculations steps were realised as follows:
Adipocyte   radius   =   a r e a ,
Adipocyte   volume   =   4 3   ×     ×   r a d i u s   3 ,
Adipocytes   number   per   gram   of   TA   =   V o l u m e   o f   1   g   o f   T A A d i p o c y t e   V o l u m e   =     1.064 A d i p o c y t e   V o l u m e   ( c m   3 )
Isoprostanoid amount per adipocyte was deduced and expressed as femtograms (fg) of isoprostanoids per adipocyte, for convenience.

2.4. Immunohistochemistry and Haematoxylin Staining

Adipose tissue samples were fixed in 10% formalin solution (Sigma-Aldrich, Saint-Quentin Fallavier, France) for at least 24 h, and embedded in paraffin. Sections of 5 µm were cut on a Leica RM2145 microtome. After deparaffinisation, antigen retrieval was performed in citrate buffer and endogenous peroxidases were blocked in H2O2. Immunochemistry staining was carried out using an avidin–biotin-based protocol (Vectastain ABC kit, Vector Laboratories, Burlingame, USA). As a primary antibody, we used an anti-CD68 antibody (diluted 1/100) (BioRad Laboratories, Hercules, CA, USA). A negative control was performed in the absence of the primary antibody. Images were acquired using an Eclipse TE300 inverted microscope (Nikon). Results were expressed as macrophages number per mm2 of tissue after analysis of 10–20 fields per sample.
For adipocyte size measurement, adipose tissue sections were stained with Hematoxylin QS (H-3404, Vector Laboratories) for 1 min. Adipocyte size was then determined in µm2 using ImageJ analysis software (http://rsbweb.nih.gov/ij/, 29 March 2021), with each cell being individually identified and measured. About 150–300 adipocytes were analysed for each sample according to Parlee et al. [35]. A frequency function was used in Excel software to assess the effects of each diet on adipocyte size repartition. For periaortic brown adipose tissue, lipid inclusions (empty fields) in the tissue were quantified using ImageJ software.

2.5. Statistical Analysis

Results are expressed as means ± SEM, n = 4–7 animals per group. The statistical analysis was performed using one-factor analysis of variance (ANOVA) and post hoc comparisons were performed with Fisher’s protected least significant difference (PLSD) test using STATVIEW software (SAS Institute Inc., Cary, NC, USA). Unless indicated, p-values given account for the PLSD test. Differences were considered significant when the p-value was under 0.05.

3. Results

3.1. Body Weight, Glucose Homeostasis and Blood Lipids

As expected, body weight and body weight gain were higher in all groups fed a high-fat diet when compared to the control group (Table 1). A non-significant increase (ANOVA: p = 0.11) in eWAT weight was also observed with the obesogenic diets, the trend being the strongest for the lard group and the weakest for the refined PO group.
Glucose homeostasis was assessed by measuring fasting blood glucose and insulin levels. An increase in blood glucose was observed with the crude (p < 0.05) and refined (p < 0.01) PO diets compared to controls. Fasting insulinemia increased with the three HF diets, and especially with the refined PO, almost reaching the significance level (ANOVA: p = 0.065). An enhancement in the HOMA-IR index was observed in all high-fat groups, and significance was only achieved with the refined PO diet (p < 0.01).
Blood triglycerides and total cholesterol were not significantly different between controls and HF diets groups while the highest values are observed after the refined PO diet. High-density lipoprotein (HDL) cholesterol was the lowest for the lard group (p < 0.05).

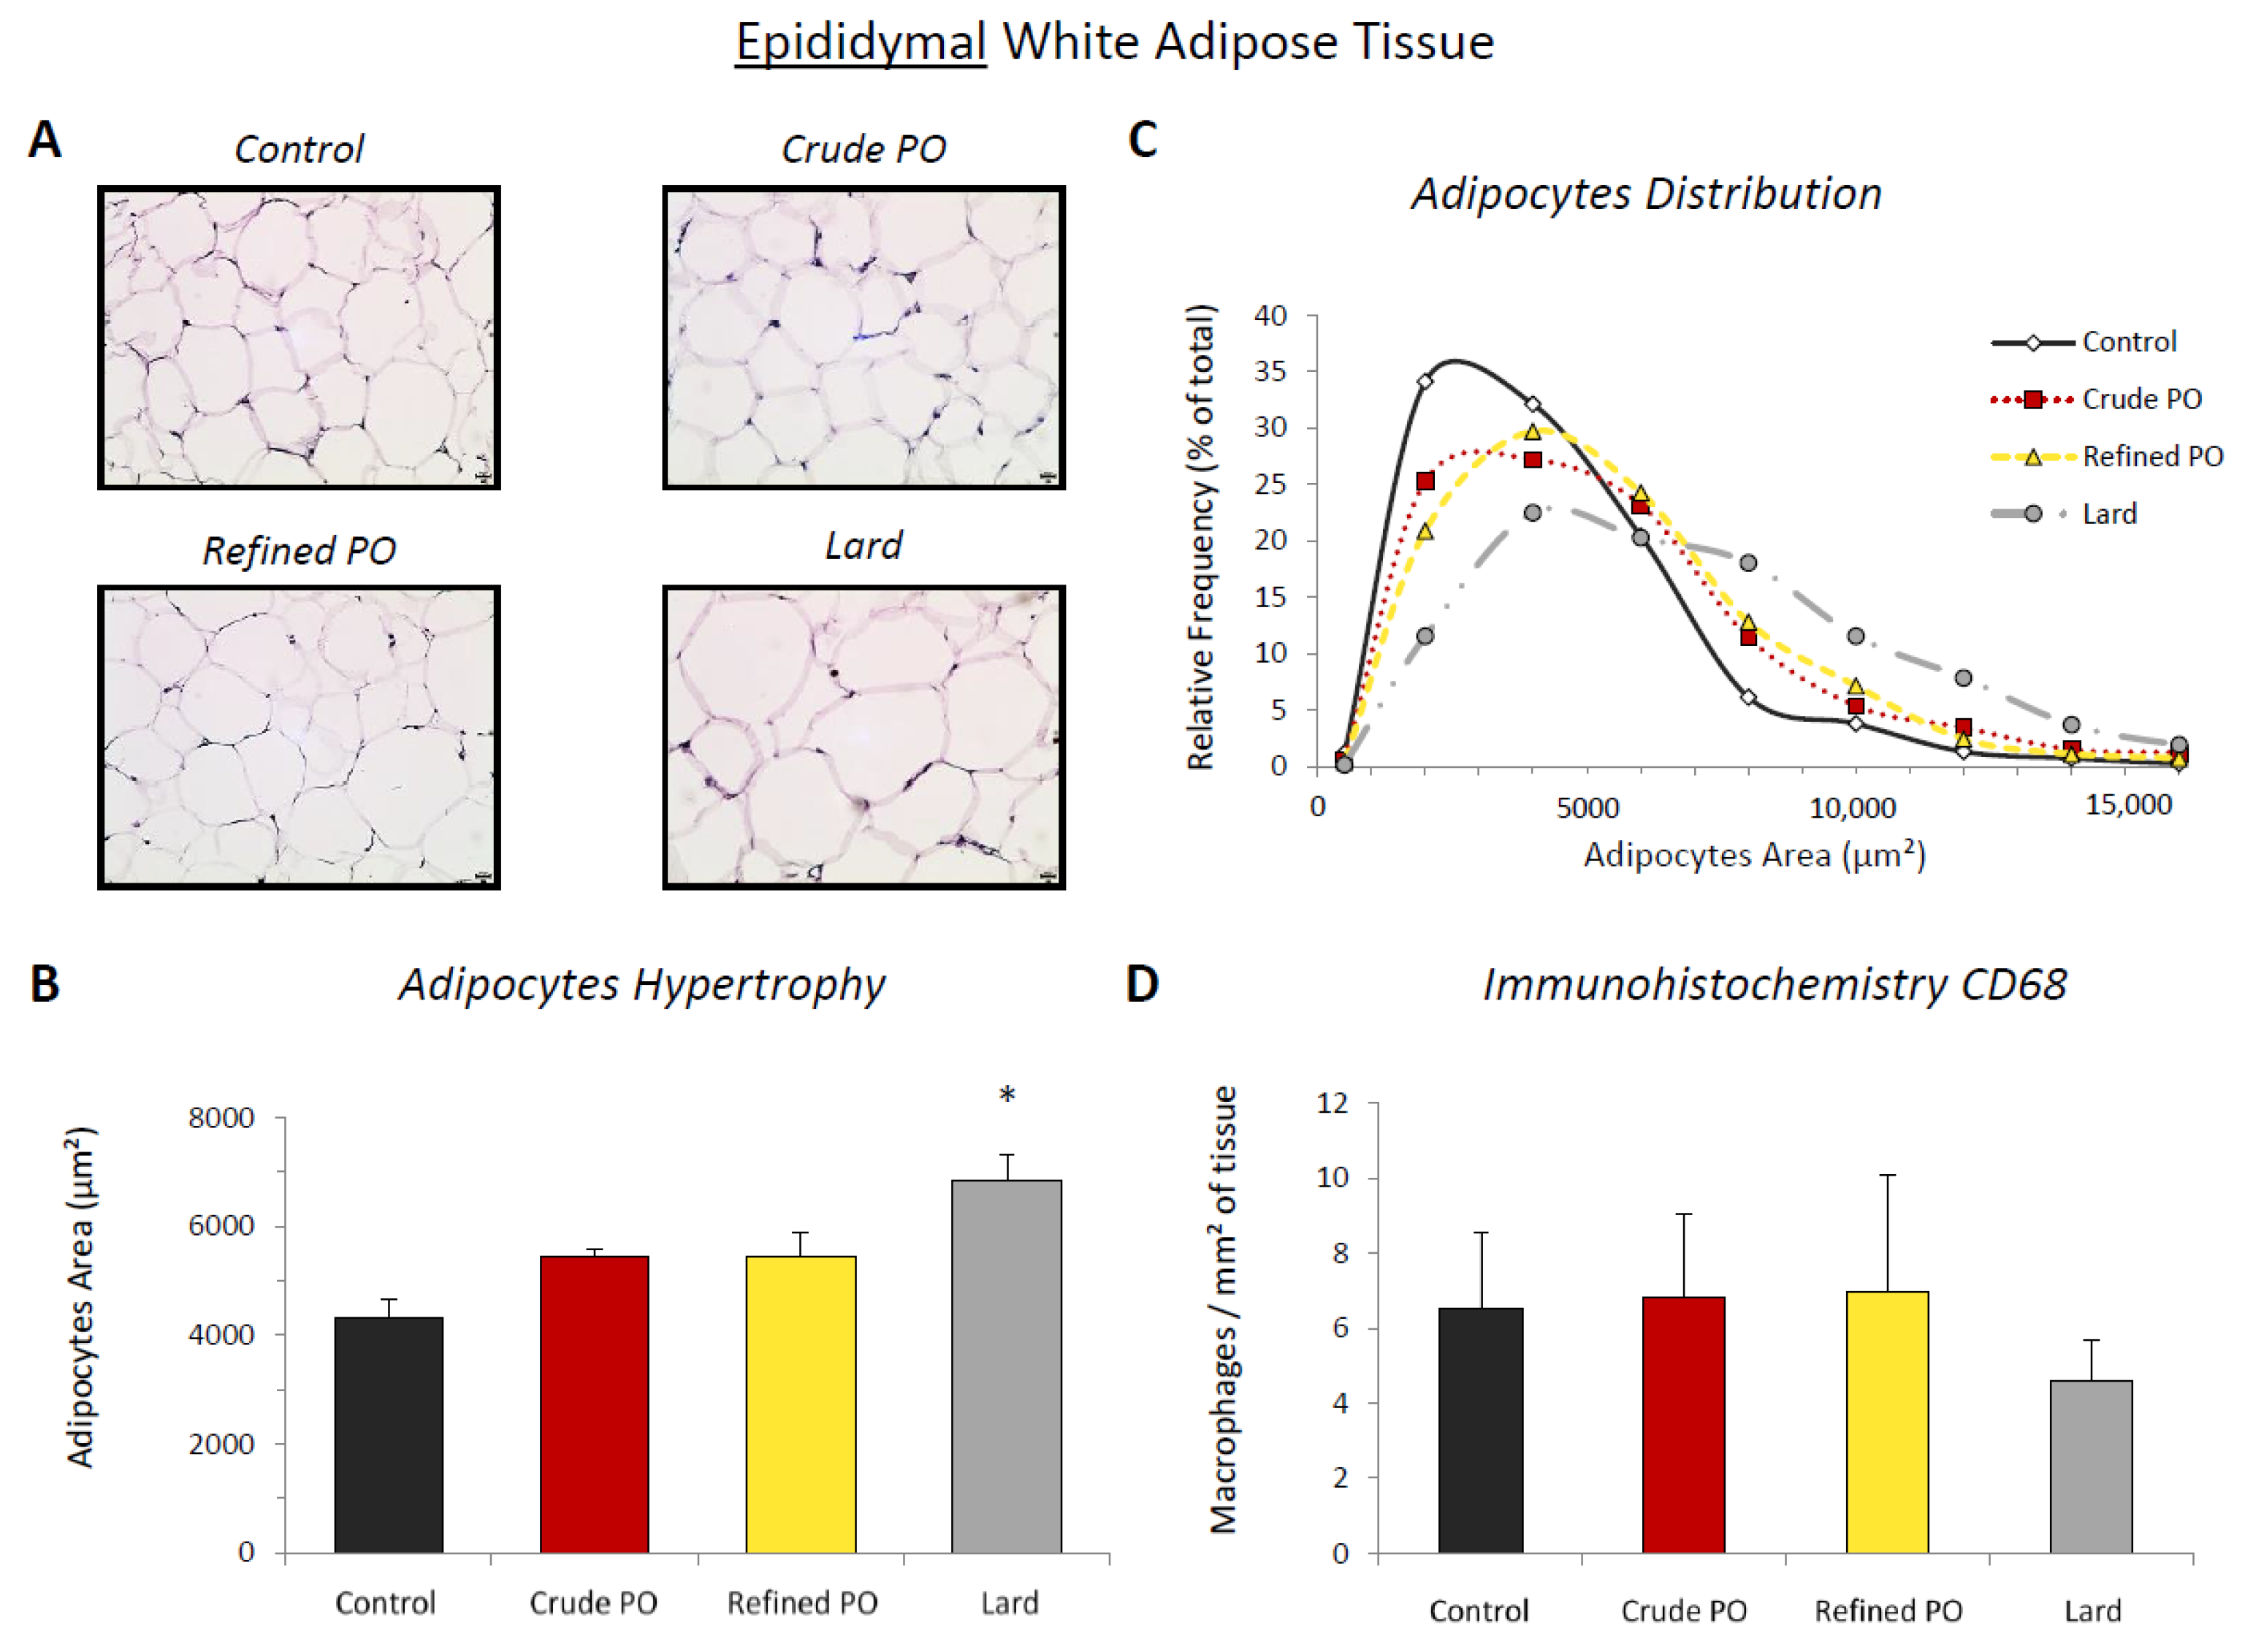
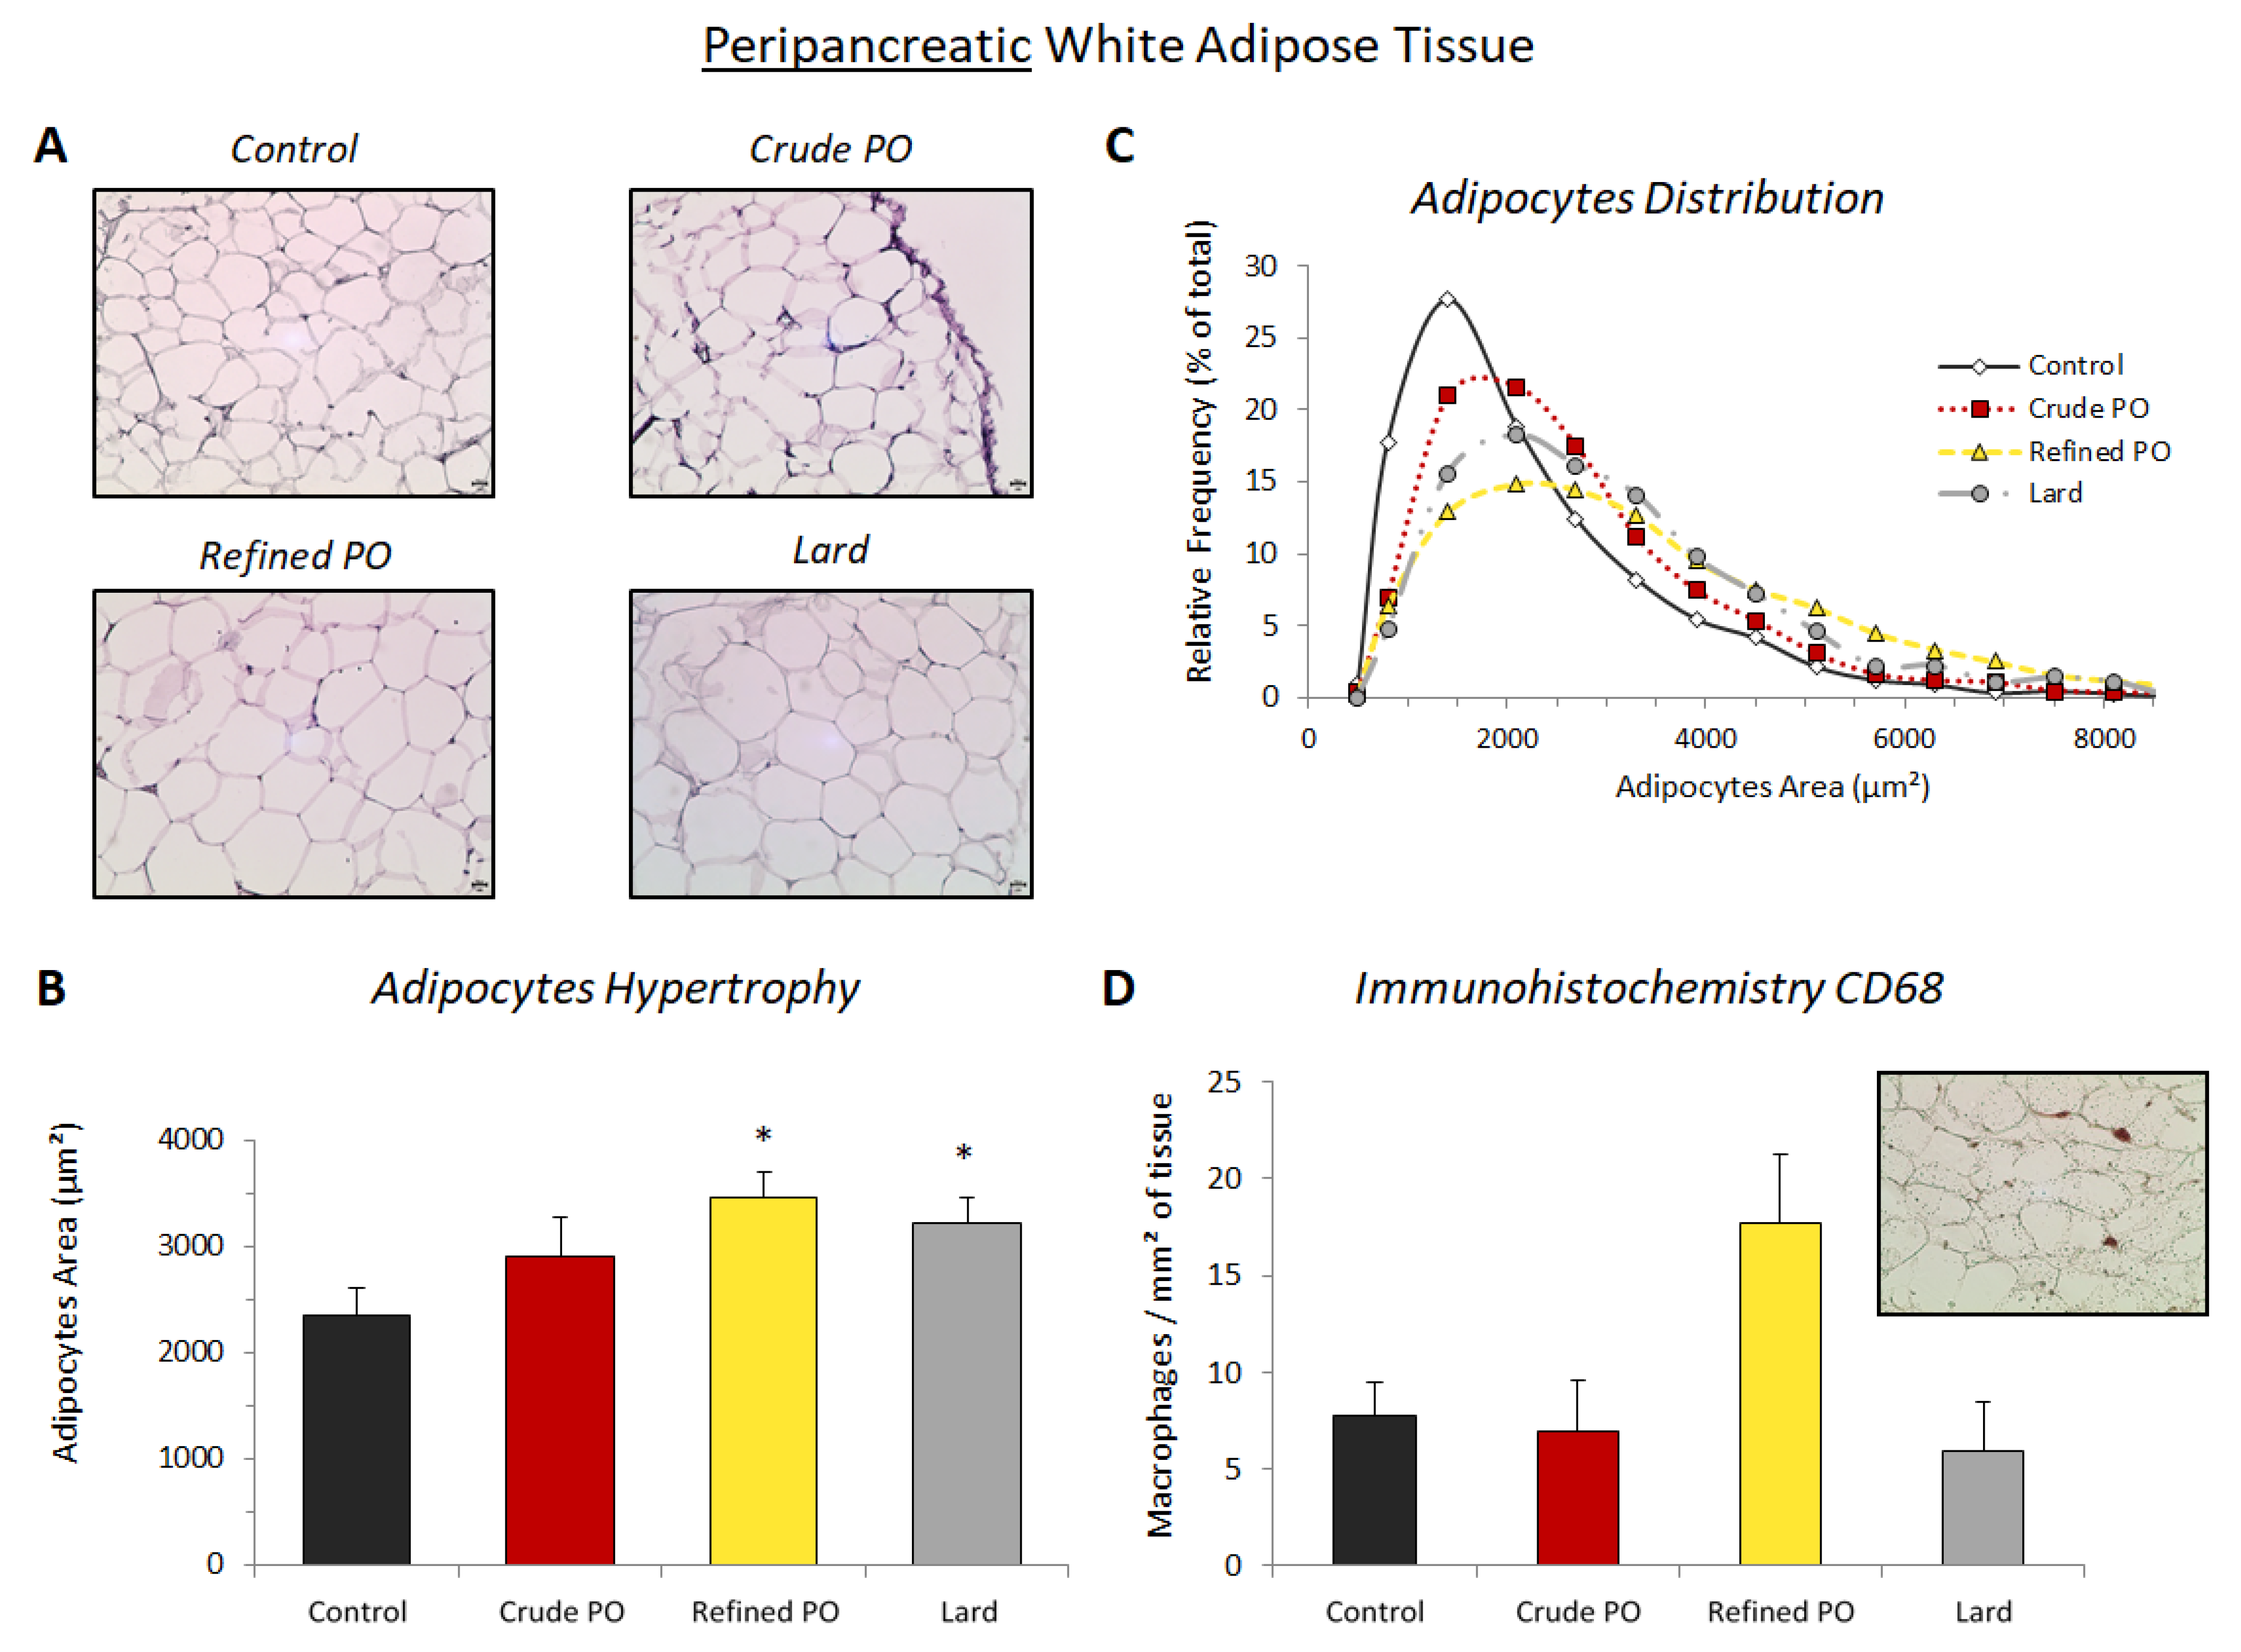
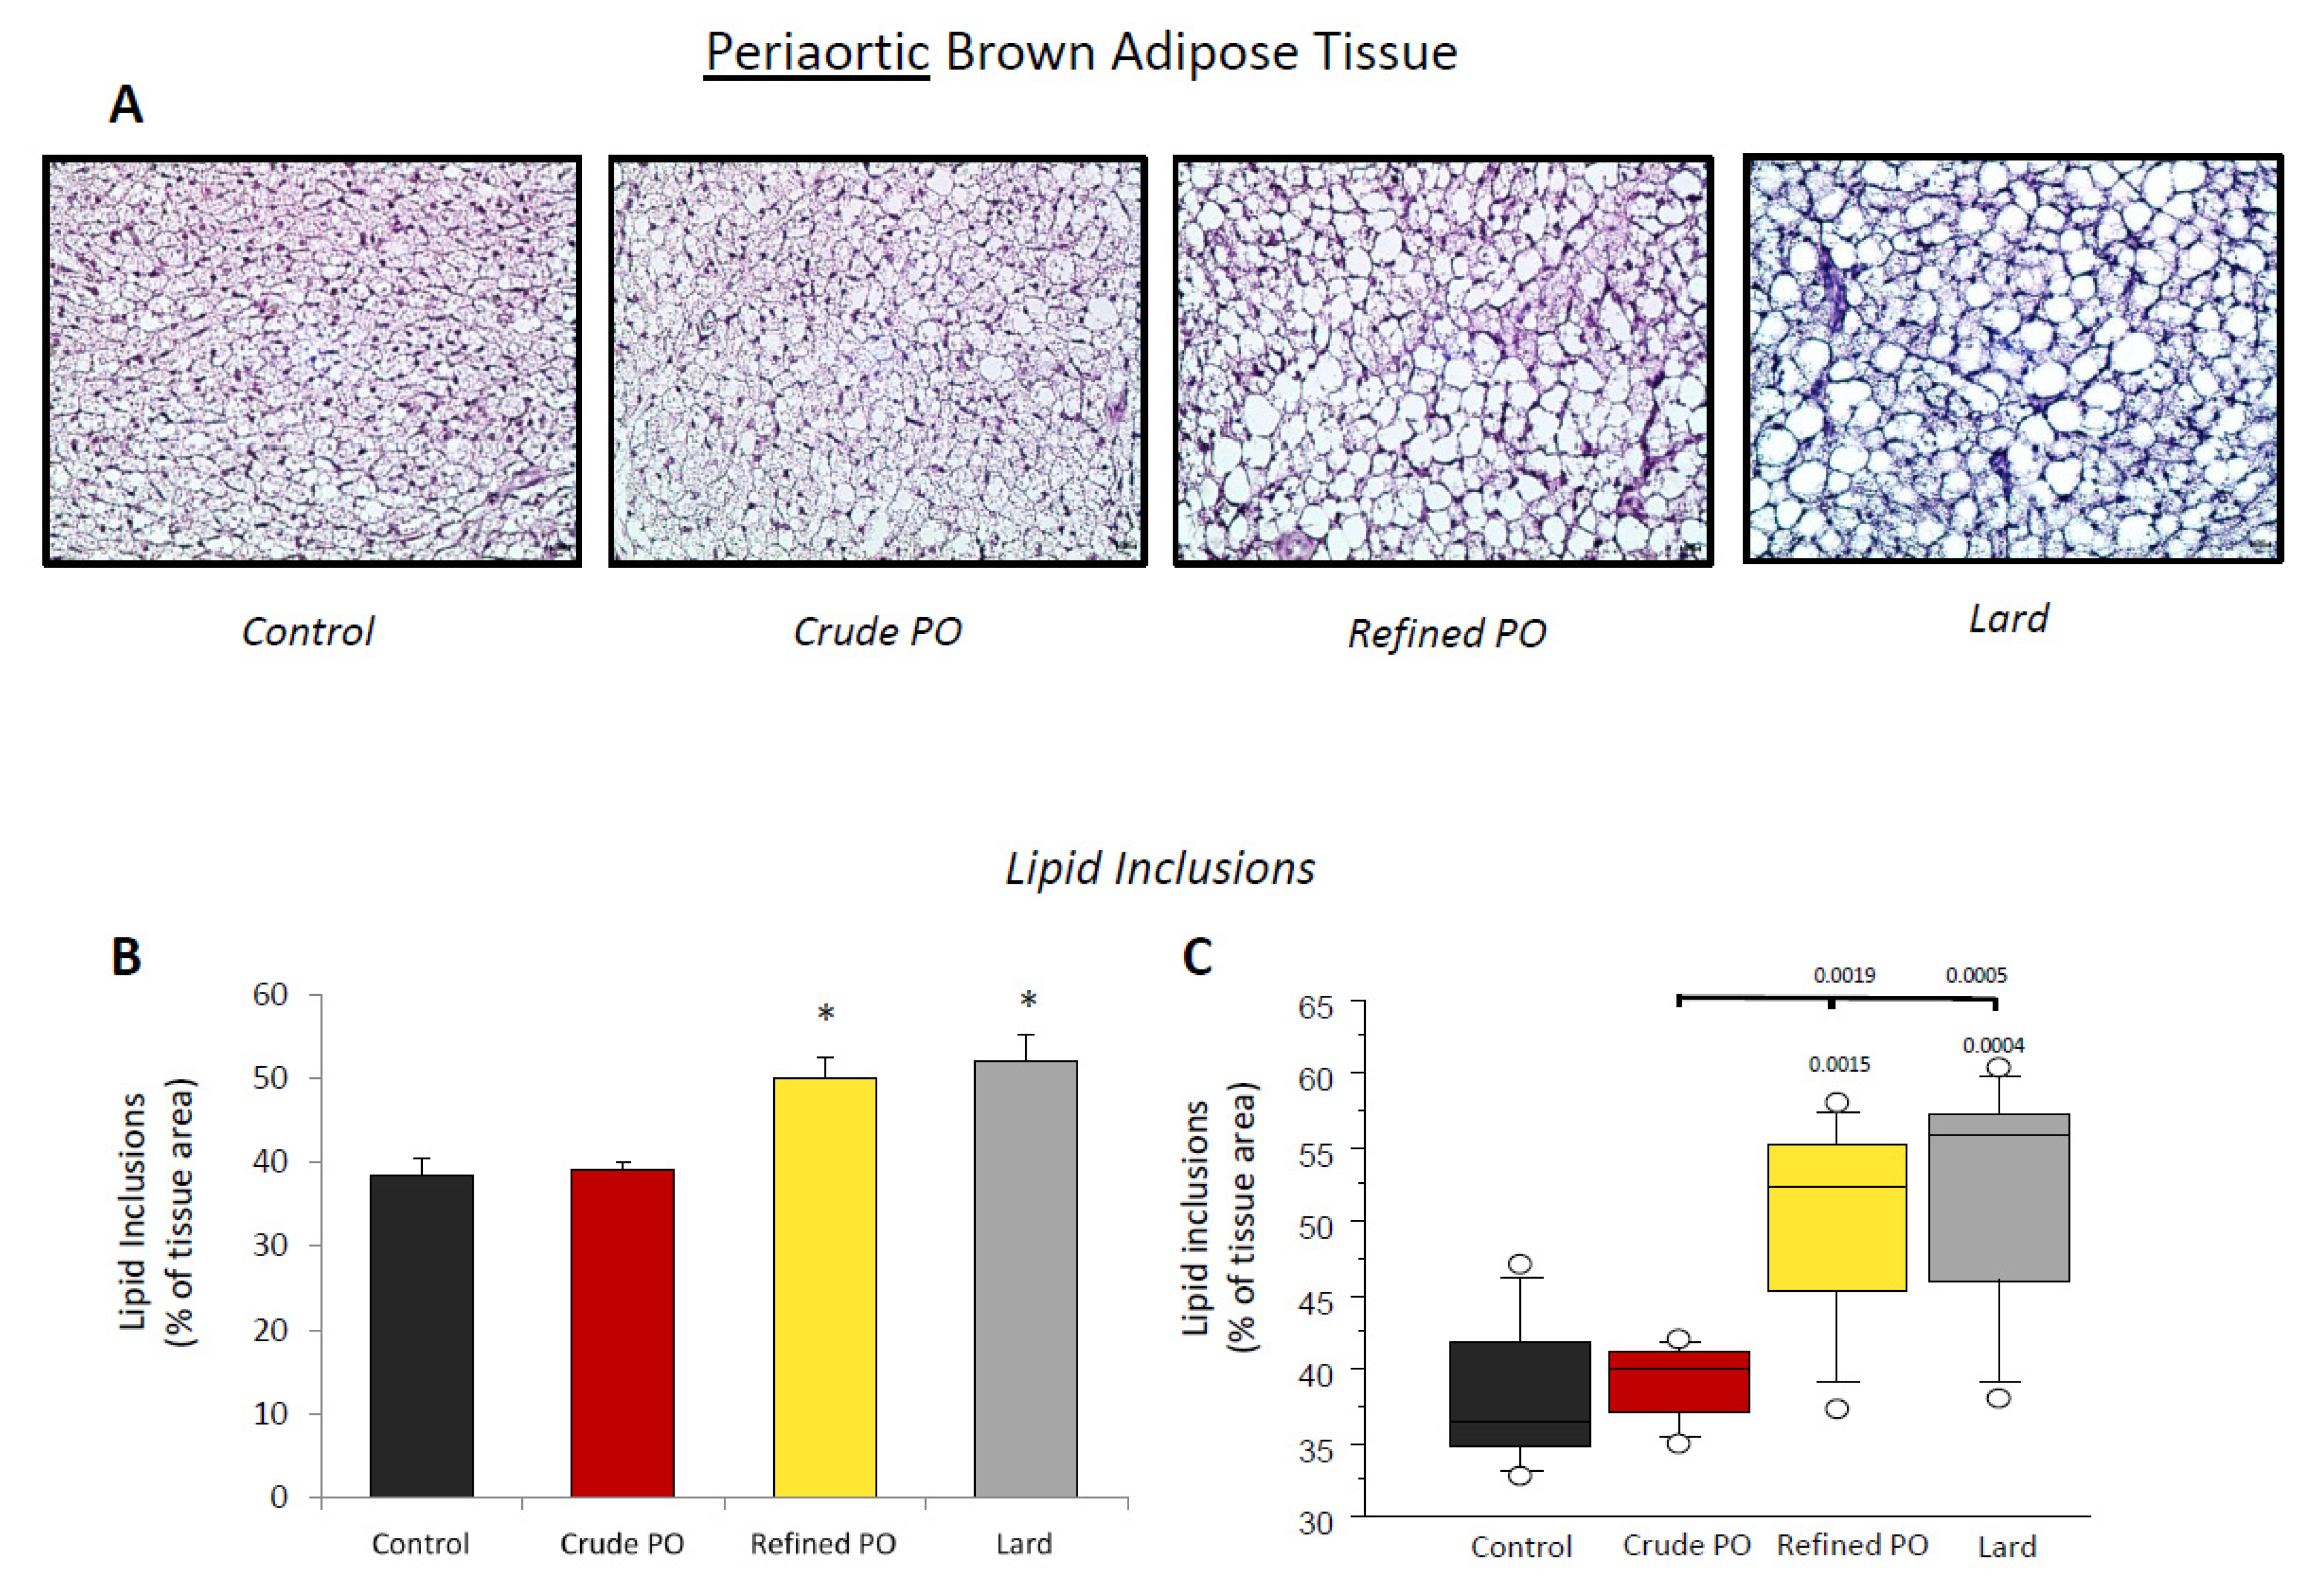
3.2. Lipid Storage in Adipose Tissues

We quantified lipid deposition in pWAT and eWAT by measuring adipocyte size (area in µm2) following the 12 weeks of nutritional intervention.
In eWAT, adipocyte size rose following diet supplementation with lard. The mean adipocyte surface in this group was 6829 ± 491 µm2 compared to 4312 ± 335 µm2 (p < 0.01) for control rats (Figure 1B). A non-significant increase in adipocyte size was also observed in rats that consumed crude (5434 ± 155 µm2) and refined palm oil (5461 ± 421 µm2) (p = 0.2816 and p = 0.1902, respectively). Concerning the adipocyte size distribution, we observed a flattening and a shift to the right of the curves following the obesogenic diets compared to the controls, and especially for the lard group (Figure 1C). This is typical of adipocyte hypertrophy in WAT. Nevertheless, distribution curves for the crude PO and refined PO groups showed an intermediate profile, whereas a second population of large adipocytes (≈8000 µm2) appeared to be present in the lard group.
Adipocytes were also enlarged in the pWAT of the lard group compared to control rats (3213 ± 250 μm2 versus 2352 ± 255 μm2, respectively, p < 0.05, Figure 2B). In contrast with eWAT, the increase in cell size in pWAT was the highest for the refined PO group (3452 ± 248 µm2, p < 0.01) with a more spread out size distribution than for other groups (Figure 2C). In addition, large (around 5000 µm2) adipocyte populations were observed in this group. Interestingly, the lowest adipocyte size enhancement was for the crude PO group (2905 ± 372 µm2, non-significant difference versus controls). For this group, the cell size distribution profile was intermediate and closer to that of control rats compared to lard and refined PO groups (Figure 2C).
Lipid storage in AoBAT was evaluated by the quantification of lipid inclusions in the tissue and expressed as the percentage represented by these areas reported for the total area of the tissue (Figure 3). A significant increase in lipid inclusions in AoBAT was observed for the refined PO (50.1 ± 2.5%, p < 0.01) and lard (50.2 ± 3.3%, p < 0.01) groups compared to controls (38.5 ± 5.2%) (Figure 3B). Interestingly, this increase was also significant (p < 0.01) for both when compared to the crude PO group in which lipid inclusions (39.2 ± 0.9%) were similar to control rats. In addition, dispersion of the values for lipid inclusions was low for this group in contrast to the other HF diets, as described in the box plot (Figure 3C).

3.3. Macrophage Recruitment in White Adipose Tissue

Macrophage number (CD68-positive cells) in eWAT was not influenced by the obesogenic diets (Figure 1D). In the control rats, we observed 6.5 ± 2.0 macrophages/mm2 of tissue. This number remained statistically unchanged (ANOVA: p = 0.6043) for the crude PO (6.8 ± 2.2 macrophages/mm2 of tissue) and refined PO (7.0 ± 1.5 macrophages/mm2 of tissue) groups and slightly lower for the lard group (4.6 ± 1.1 macrophages/mm2 of tissue).
Almost significantly (ANOVA: p = 0.0886), a tendency of macrophage infiltration in pWAT was present in the refined PO group compared to control rats (17.7 ± 3.6 vs. 7.7 ± 1.8 macrophages/mm2 of tissue, respectively) (Figure 2D). Conversely, few macrophages were observed in pWAT of the crude PO and lard groups (6.9 ± 2.6 and 6.0 ± 2.4 macrophages/mm2 of tissue, respectively).

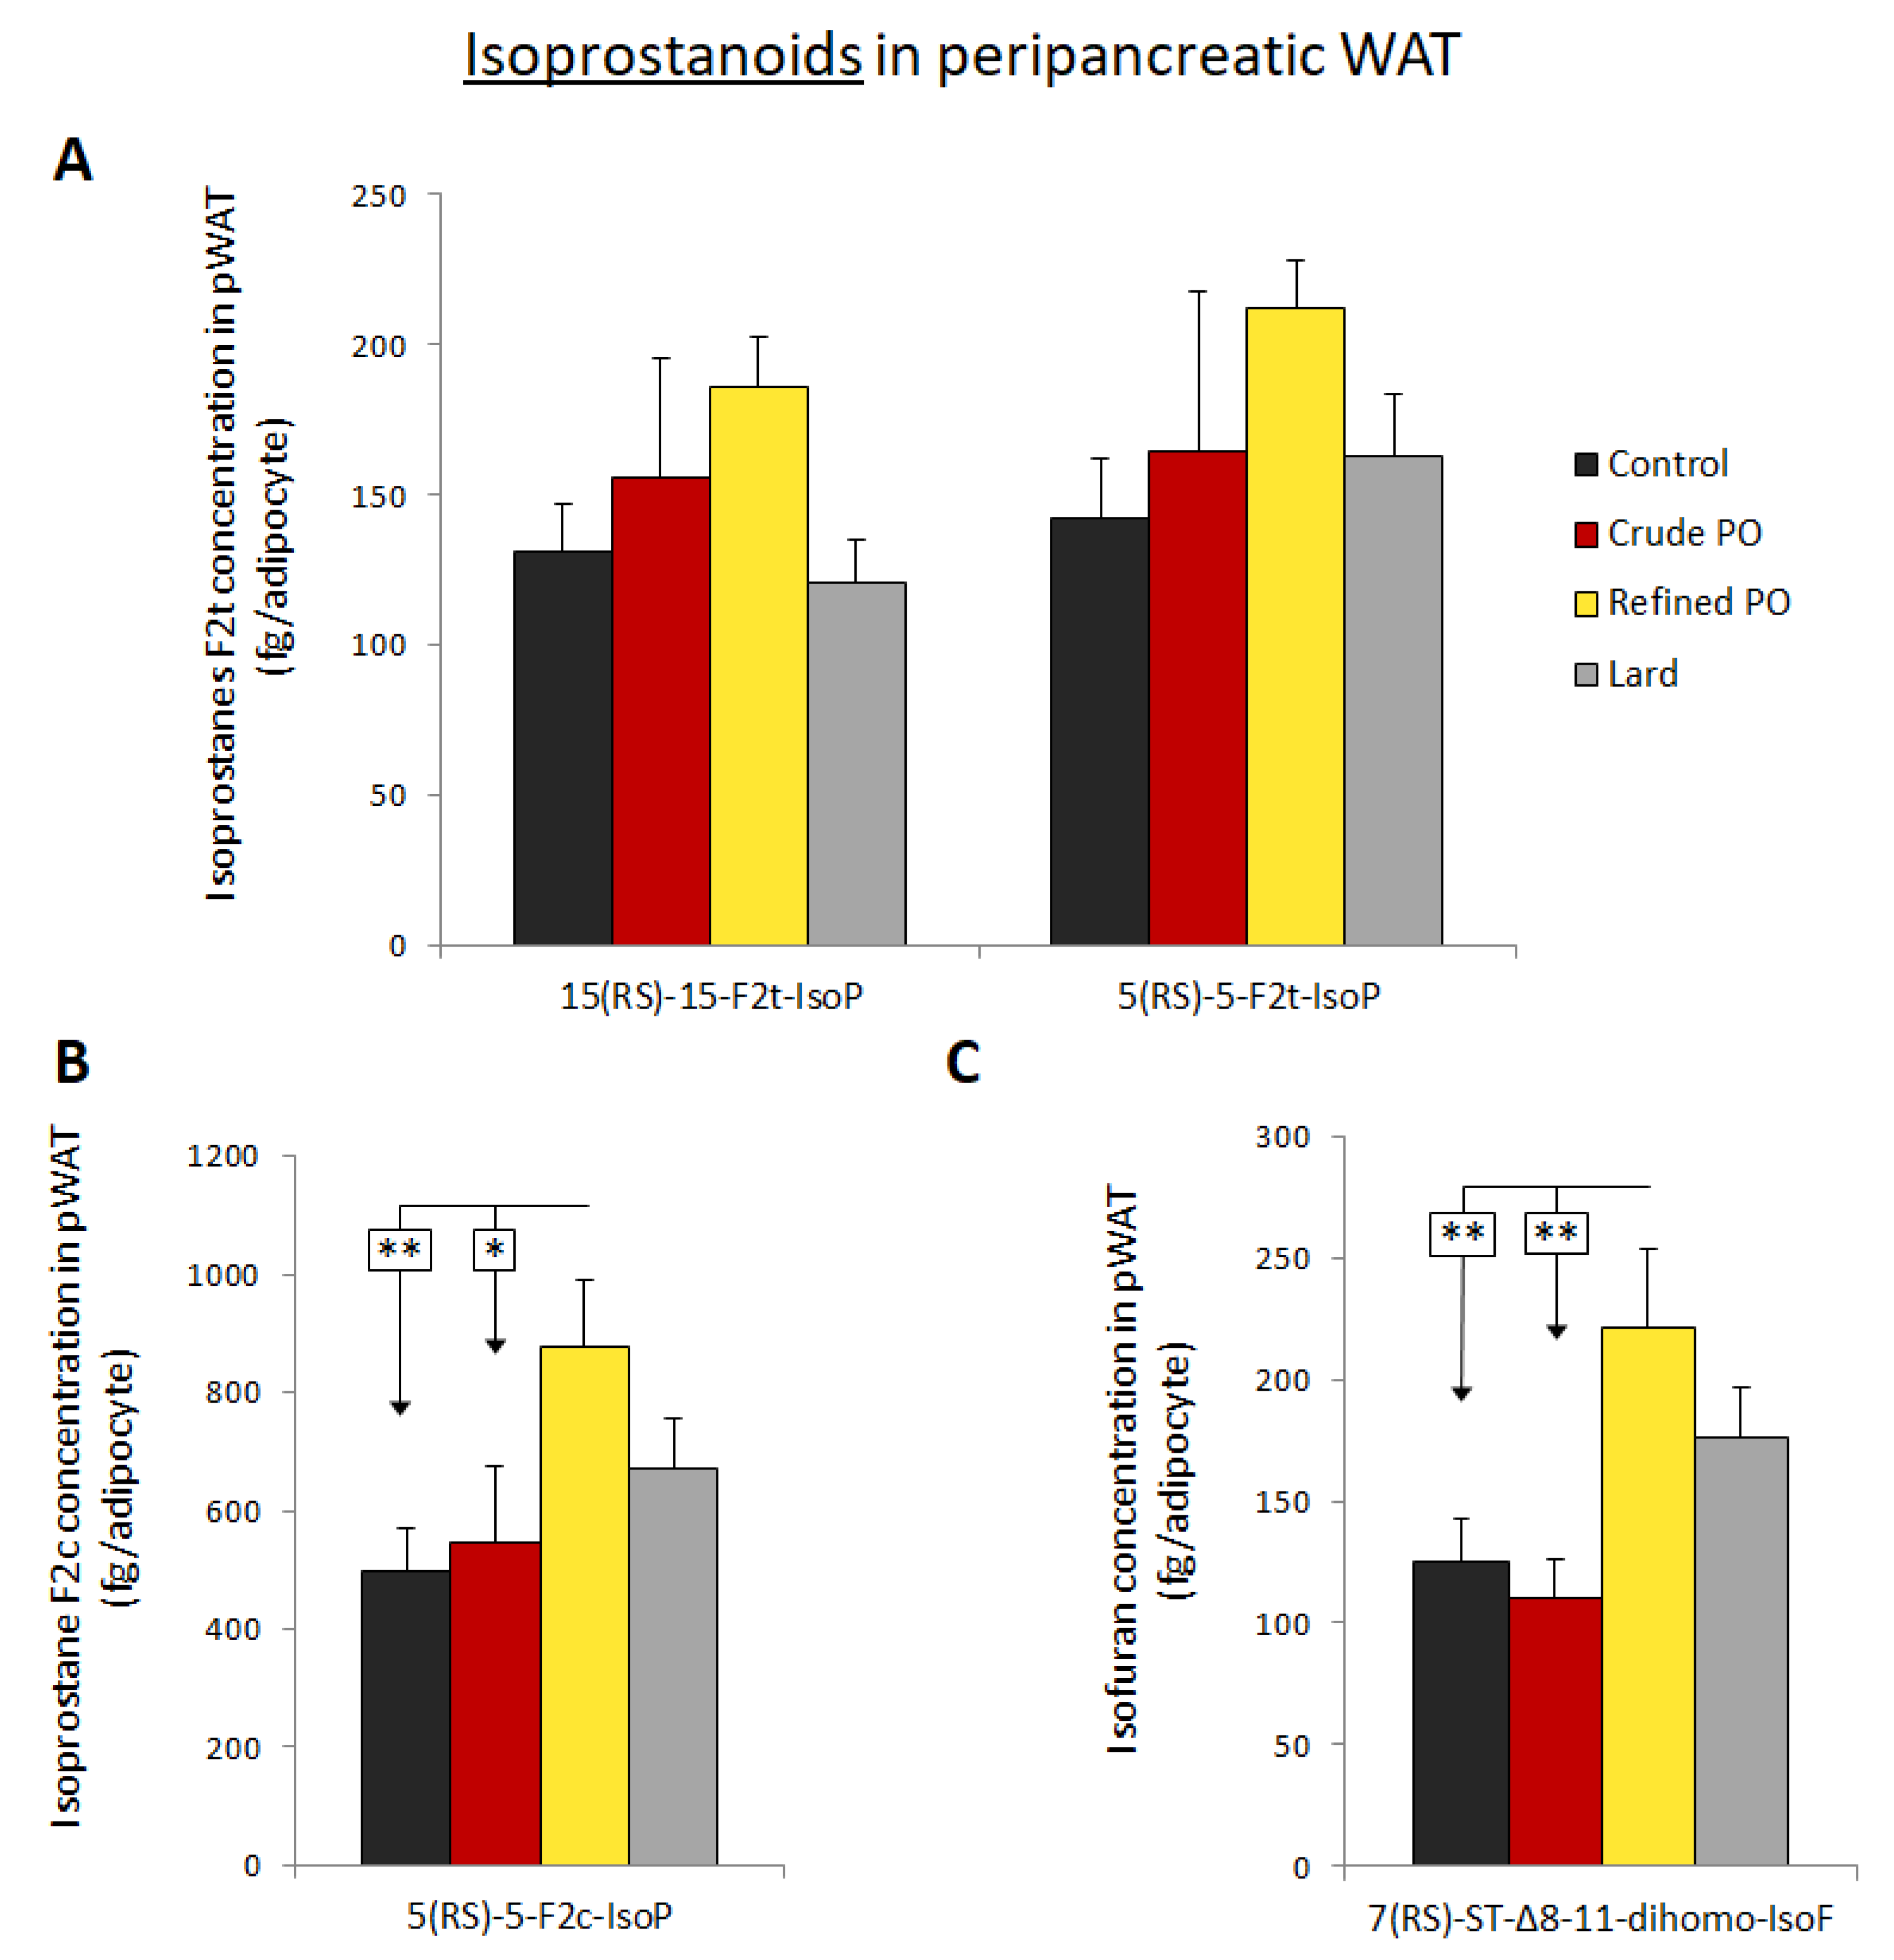
3.4. Isoprostanoid Formation in pWAT

Several isoprostanoids were studied in pWAT as markers of oxidative stress and potential biological mediators. Total isoprostanoids (free and esterified forms) were assayed for the analytes 15(RS)15-F2t-IsoP, 5(RS)-5-F2t-IsoP, 5(RS)-5-F2c-IsoP and 7(RS)-ST-Δ8-11-dihomo-IsoF (this latter molecule being an isofuran form derived from adrenic acid) [36]. Along with adipose tissue hypertrophy, lipid droplet content increased and membrane proportion decreased (as exemplified in Figure 2). This could affect isoprostane measurement considering a given weight of adipose tissue, as isoprostanoids are mainly derived from membrane phospholipids [37] and are less likely to be present within lipid droplets. Since adipocyte size was determined, we chose to express the isoprostanoid amount per adipocyte.
According to ANOVA, no significant change was observed regarding the amount of 15(RS)-15-F2t-IsoP and 5(RS)-5-F2t-IsoP in pWAT following the four different diets (Figure 4A). However, the production of 15(RS)-15-F2t-IsoP tended to be higher in the refined PO group (186 ± 17 fg/adipocyte) compared to the control (131 ± 16 fg/adipocyte) and lard (121 ± 14 fg/adipocyte) groups (ANOVA: p = 0.1653; Fisher’s PLSD: p = 0.0804 and p = 0.0397, respectively). Likewise, the amount of 5(RS)-5-F2t-IsoP seemed higher in the pWAT with the refined PO diet compared to the control, crude PO and lard groups, even if non-significant (ANOVA: p = 0.3428).
The concentration of 5(RS)-5-F2c-IsoP derived from arachidonic acid rose in the refined PO group versus controls (p < 0.01) and the crude PO group (p < 0.05) (Figure 4B). Similarly, the concentration of 7(RS)-ST-Δ8-11-dihomo-IsoF was markedly enhanced with the refined PO diet as compared to control and crude PO groups (p < 0.01) (Figure 4C). A non-significant increase in the amount of this oxidised lipid was also noticed with the lard group.

4. Discussion

Our results demonstrate that 12 weeks of palm oil-based HF diets led to specific morphologic and functional changes in pWAT compared to eWAT and AoBAT. Our main finding is that crude and refined PO induce contrasting effects on ectopic pWAT and AoBAT, although these two oils present a very similar fatty acid composition. After a refined PO diet, but not crude PO, we observed adipocyte hypertrophy, the presence of macrophages and signs of oxidative stress in pWAT.
Differences between groups in adipocytes hypertrophy and AoBAT “whitening” [38] were unlikely to be related to body weight gain, which was equivalent for all obese groups. Adipocyte hypertrophy in pWAT and lipid deposition in AoBAT were evident for lard and the refined PO groups. Conversely, for the crude PO-fed rats, hypertrophy in pWAT was moderate and AoBAT was histologically unchanged compared to control animals. We observed that eWAT mass was slightly lower, though non-significantly, in the refined PO compared to crude PO group. Less storage in eWAT could have favoured ectopic lipid deposition in pWAT and AoBAT with the refined PO diet. This is of major concern because localisation of AT is closely related to obesity-associated complications. Fat storage in subcutaneous AT rather than visceral AT limits metabolic disorders during obesity in humans [39,40] and rats [41]. In addition, preferential lipid storage in epididymal WAT could have protective effects against glucose intolerance, as reported in mice after intraperitoneal transplantation of eWAT [42].
These observations are in line with the fact that crude PO seems to have a lower impact on insulin resistance than refined PO and HOMA-IR was significantly enhanced only in the refined PO group. Nonetheless, the two PO diets affected fasting glucose, whereas no change was observed in the lard group compared to controls. This may be surprising as some previous studies concluded that there is a deleterious effect of lard on systemic and liver glucose tolerance [43]. On the other hand, the enhancement of fasting glucose observed for the crude PO group without a clear increase in HOMA-IR is quite intriguing, as insulin resistance classically precedes glucose intolerance.
We can assume that for some compounds affecting AT metabolism, the concentration changed during the PO refining process. Although fatty acid proportions were comparable for the three fats used in the present experiments, refined palm oil had a higher omega-6 to omega-3 fatty acid ratio (see Supplementary Table S1) [15]. Consumption of PUFA (polyunsaturated fatty acids) omega-3 has induced anti-inflammatory properties in AT of obese patients [44,45], and prevented or reversed insulin resistance in obese rats [46]. Contrary to omega-3, omega-6 fatty acids were unable to downregulate maternal dyslipidaemia-induced oxidative stress [47].
Another dietary factor that may have a role in the smaller alterations induced by the crude PO is its higher content in polyphenols and carotenoids compared to refined PO and lard [15,48]. Indeed, less than 1% of the carotenoid content is preserved and PO antioxidant capacity is reduced by 80% during PO refining steps (Supplementary Table S2). Increased carotenoid consumption is associated with a reduction in visceral adiposity in humans and rodents [23], while carotenoid serum and AT concentrations are inversely correlated with insulin resistance of adipose tissue and liver [24,49]. Additionally, numerous studies have shown that polyphenols such as resveratrol, curcumin or gingerenone A were able to inhibit adipogenesis and AT mass in rodent models [24,50]. Indeed, olive oil extracts rich in oleuropein, hydroxytyrosol and triterpenic acids present protective effects against adipose tissue damage and obesity-associated metabolic disorders in HF diet rodent models [51,52]. Of note, the latter studies were interested in WAT from various origins (epididymal, mesenteric, retroperitoneal, perirenal and inguinal AT) but not peripancreatic WAT. Although no direct causal effect is demonstrated, our present findings suggest that the high content in polyphenols and carotenoids of crude palm oil could have contributed to moderate adipocyte hypertrophy (or lipid inclusions for AoBAT) and, above all, to limiting inflammation and macrophage infiltration in peripancreatic WAT.
Macrophage infiltration was absent in epididymal WAT whatever the high fat diet used. In obesity, inflammation and macrophage infiltration usually develop in AT following adipocyte hypertrophy [11,53,54]. Nevertheless, the recruitment of macrophages into eWAT during a high-fat diet is not always observed [55,56], even in the presence of an overexpression of pro-inflammatory cytokines [57]. Here, we postulate that the diet (composition, duration) was not harmful enough to induce macrophage infiltration in eWAT. However, macrophage infiltration was observed in the pWAT of the refined PO group, demonstrating inflammatory adaptation in this ectopic WAT. This is consistent with the study of Laugerette and colleagues [22], in which, among four oil-enriched diets, PO induced the highest levels of IL-6 in plasma and expression of IL-1β and TLR4 in WAT. Recently, a pWAT-focused study in mice found that this AT depot is highly metabolically active and that its surgical removal worsened obesity-related hyperinsulinemia [58]. This adipose deposit appeared to play an important role in the regulation of basal and glucose-stimulated insulin levels. Interestingly, Rebuffat et al. [20,59] have reported that modified cytokine production in pWAT can affect pancreatic beta cell plasticity and function. Although cytokine production was not measured, the macrophage infiltration observed suggests that inflammation is present in peripancreatic AT with a refined PO diet. Alterations of peripancreatic WAT secretion were potentially involved in insulin secretion modifications, disruption of glucose homeostasis and the increase in HOMA-IR observed with this palm oil diet.
An in-depth characterisation of the AoBAT was not within the scope of this study but the restricted lipid deposition in AoBAT following a crude PO diet should be underlined and could have health benefits. Indeed, AoBAT is a relevant AT for cardiovascular risk in obese patients [60,61]. Some HF-based animal studies also identified that this AT as of major concern for vascular disease development [62]. It is noteworthy that Yuriko Oi-Kano et al. demonstrated in a rat HF diet model (30% palm oil) that supplementation with the olive oil phenolic extract oleuropein enhanced BAT activity, with protective effects on visceral AT [63]. Moreover, AoBAT vascularisation seems to be involved in its “whitening” and can impact whole-body glucose metabolism [38].
Inflammation, macrophage recruitment, adipocyte metabolic activity and oxidative stress generation are closely related in AT, and could increase isoprostanoid production from membrane phospholipids [37]. In the current study, isoprostanoid content was considered for one single adipocyte to limit the impact of hypertrophy (raising the proportion of lipid droplets) on the measure. A major finding was that the concentration of several isoprostanoids was increased in pWAT with the refined PO diet, indicating local oxidative stress enhancement. In addition, no significant change was observed for the crude PO group and only dihomo-isofuran concentration tended to rise with the lard diet. Isofurans, which were recently discovered [36,64], are mainly produced when oxygen tension is high and their combined measurement with isoprostanoids allows a reliable overall assessment of oxidative stress damage. Oxidative status is a finely controlled parameter in AT, regulating the proliferation and differentiation capacities of preadipocytes into mature adipocytes, and is likely involved in their dysfunction [26,65]. Oxidative stress in AT depends on the balance between ROS production (mitochondrial activity, NADPH oxidase, production by macrophages) and the activity of antioxidant defences, including superoxide dismutases or glutathione peroxidases, which are possibly reduced during obesity [66,67]. In that respect, it has been shown that a decrease in glutathione-s-transferase expression favoured a strong increase in oxidative stress in rat epididymal WAT following a cafeteria diet [68]. In our HF diet model, it could be interesting to determine if adipose tissue oxidative stress and inflammation are more related to changes in ROS production or to a drop in oxidant enzymes [27,65,69]. Oxidative stress enhancement in pWAT with a refined PO diet could be a cause and a consequence of macrophage infiltration in this AT. Indeed, ROS production by adipocytes promotes macrophage recruitment, and the latter are potential sources of ROS [25,26,66]. More than just oxidative stress markers, isoprostanoids are bioactive compounds and 15-F2t-IsoP functional effects have been widely studied. Remarkably, this isoprostanoid can inhibit angiogenesis [30] or stimulate macrophage migration and their cytokine production [31]. These properties could have participated in pWAT dysfunction in the refined PO group. In addition, our group recently observed that several isoprostanoids, including 15-F2t-IsoP and its epimer, inhibit insulin secretion in isolated islets (unpublished data) [70]. This could have favoured the glucose homeostasis disruption observed with the refined PO through local biocommunication between pWAT and the pancreas. Regarding 5(RS)-5-F2c-IsoP and 7(RS)-ST-Δ8-11-dihomo-IsoF, a study of their biological effects received little attention but their high concentration in pWAT following a refined PO diet may have had functional consequences.

5. Conclusions

To conclude, a high dietary intake of refined PO led to an increase in lipid inclusions in periaortic BAT and adipocyte hypertrophy in peripancreatic WAT. The latter displayed signs of inflammation and increased oxidative stress. Dysfunction of this adipose tissue could have influenced pancreas and glucose homeostasis by the production of pro-inflammatory adipokines or lipid mediators according to local biocommunication. Our observations were related to a high intake of refined PO and adverse effects would be unlikely during normal consumption of this oil as part of a healthy diet [4]. Moderate ectopic lipid accumulation was observed with the crude PO diet and no macrophage infiltration or oxidative stress was detected in peripancreatic WAT. It is suggested that the high antioxidant content of crude PO may alleviate its deleterious effects on this adipose deposit. This study shows that not only composition in fatty acids, but mostly the amount of valuable natural compounds as antioxidants of oils used in high-fat diets, can have morphological and functional consequences for adipose tissues. Our results also show pWAT-specific adaptations to PO-rich high-fat diets.

Supplementary Materials

The following are available online at https://0-www-mdpi-com.brum.beds.ac.uk/article/10.3390/nu13041134/s1, Table S1: Fatty acid composition of oils and lard used in diets, Table S2: Comparison of antioxidant content in crude PO and refined PO.

Author Contributions

Conceptualisation, J.L. and B.J.; methodology, J.L., B.J., N.G., Y.F.D. and E.B.; validation, L.J. and K.M.; formal analysis, J.L. and B.J.; investigation, J.L., B.J., Y.F.D., E.B., C.C., C.F.-C., L.J., K.M. and N.G.; resources, T.D., C.V., C.O. and J.-M.G.; writing—original draft preparation, J.L. and B.J.; writing—review and editing, J.L., B.J., E.B., C.F.-C., C.C. and T.D.; visualisation, J.L, B.J. and N.G.; supervision, J.P.C., A.-D.L. and T.D.; funding acquisition, A.-D.L. and J.P.C.; All authors have read and agreed to the published version of the manuscript.

Funding

Except Y.F.D. (who received help from University of Cocody and SANIA company), the authors have not received any funding or benefits from industry to conduct this study. This work was supported by a grant REPERE program (n°18022518) from the Conseil Régional Occitanie (France).

Institutional Review Board Statement

The present experiment complies with the European directive 2010/63/UE, all procedures were approved by the local ethical committee (reference CEEA-LR-12002, Montpellier, France) and conform to the Guide for the Care and Use of Laboratory Animals published by the United States National Institute of Health (National Academies Press US, 8th edition, 2011).

Data Availability Statement

The datasets generated and analysed during the current study are available from the corresponding author on reasonable request.

Acknowledgments

We thank Montpellier’s histology platform, the RHEM-Biocampus, for their technical assistance. We gratefully acknowledge Amandine Rocher, Guillaume Reversat, Valérie Bultel-Poncé and Alexandre Guy for their valuable technical assistance in targeted lipidomics and total synthesis of the isoprostanoids.

Conflicts of Interest

The authors declare no conflict of interest. The funders had no role in the design of the study; in the collection, analyses, or interpretation of data; in the writing of the manuscript, or in the decision to publish the results.

References

  1. Mba, O.I.; Dumont, M.-J.; Ngadi, M. Palm Oil: Processing, Characterization and Utilization in the Food Industry—A Review. Food Biosci. 2015, 10, 26–41. [Google Scholar] [CrossRef]
  2. Edem, D.O. Palm Oil: Biochemical, Physiological, Nutritional, Hematological, and Toxicological Aspects: A Review. Plant Foods Hum. Nutr. 2002, 57, 319–341. [Google Scholar] [CrossRef]
  3. Selvaduray, K.R.; Radhakrishnan, A.K.; Kutty, M.K.; Nesaretnam, K. Palm Tocotrienols Decrease Levels of Pro-Angiogenic Markers in Human Umbilical Vein Endothelial Cells (HUVEC) and Murine Mammary Cancer Cells. Genes Nutr. 2012, 7, 53–61. [Google Scholar] [CrossRef] [PubMed] [Green Version]
  4. Odia, O.J.; Ofori, S.; Maduka, O. Palm Oil and the Heart: A Review. World J. Cardiol. 2015, 7, 144–149. [Google Scholar] [CrossRef]
  5. Gesteiro, E.; Guijarro, L.; Sánchez-Muniz, F.J.; Vidal-Carou, M.D.C.; Troncoso, A.; Venanci, L.; Jimeno, V.; Quilez, J.; Anadón, A.; González-Gross, M. Palm Oil on the Edge. Nutrients 2019, 11, 2008. [Google Scholar] [CrossRef] [Green Version]
  6. Ahsan, H.; Ahad, A.; Iqbal, J.; Siddiqui, W.A. Pharmacological Potential of Tocotrienols: A Review. Nutr. Metab. 2014, 11, 1–22. [Google Scholar] [CrossRef] [PubMed] [Green Version]
  7. Ferguson, J.J.A.; Stojanovski, E.; MacDonald-Wicks, L.; Garg, M.L. Fat Type in Phytosterol Products Influence Their Cholesterol-Lowering Potential: A Systematic Review and Meta-Analysis of RCTs. Prog. Lipid Res. 2016, 64, 16–29. [Google Scholar] [CrossRef]
  8. Fattore, E.; Bosetti, C.; Brighenti, F.; Agostoni, C.; Fattore, G. Palm Oil and Blood Lipid-Related Markers of Cardiovascular Disease: A Systematic Review and Meta-Analysis of Dietary Intervention Trials. Am. J. Clin. Nutr. 2014, 99, 1331–1350. [Google Scholar] [CrossRef] [Green Version]
  9. Mancini, A.; Imperlini, E.; Nigro, E.; Montagnese, C.; Daniele, A.; Orrù, S.; Buono, P. Biological and Nutritional Properties of Palm Oil and Palmitic Acid: Effects on Health. Molecules 2015, 20, 17339–17361. [Google Scholar] [CrossRef]
  10. Rosen, E.D.; Spiegelman, B.M. Adipocytes as Regulators of Energy Balance and Glucose Homeostasis. Nature 2006, 444, 847–853. [Google Scholar] [CrossRef] [Green Version]
  11. Reilly, S.M.; Saltiel, A.R. Adapting to Obesity with Adipose Tissue Inflammation. Nat. Rev. Endocrinol. 2017, 13, 633–643. [Google Scholar] [CrossRef] [PubMed]
  12. Lysaght, J.; van der Stok, E.P.; Allott, E.H.; Casey, R.; Donohoe, C.L.; Howard, J.M.; McGarrigle, S.A.; Ravi, N.; Reynolds, J.V.; Pidgeon, G.P. Pro-Inflammatory and Tumour Proliferative Properties of Excess Visceral Adipose Tissue. Cancer Lett. 2011, 312, 62–72. [Google Scholar] [CrossRef]
  13. Tchkonia, T.; Thomou, T.; Zhu, Y.; Karagiannides, I.; Pothoulakis, C.; Jensen, M.D.; Kirkland, J.L. Mechanisms and Metabolic Implications of Regional Differences among Fat Depots. Cell Metab. 2013, 17, 644–656. [Google Scholar] [CrossRef] [Green Version]
  14. Go, R.-E.; Hwang, K.-A.; Kim, Y.-S.; Kim, S.-H.; Nam, K.-H.; Choi, K.-C. Effects of Palm and Sunflower Oils on Serum Cholesterol and Fatty Liver in Rats. J. Med. Food 2015, 18, 363–369. [Google Scholar] [CrossRef]
  15. Djohan, Y.F.; Badia, E.; Bonafos, B.; Fouret, G.; Lauret, C.; Dupuy, A.-M.; Pinot, E.; Sutra, T.; Gaillet, S.; Lambert, K.; et al. High Dietary Intake of Palm Oils Compromises Glucose Tolerance Whereas High Dietary Intake of Olive Oil Compromises Liver Lipid Metabolism and Integrity. Eur. J. Nutr. 2019, 58, 3091–3107. [Google Scholar] [CrossRef]
  16. Cherian, S.; Lopaschuk, G.D.; Carvalho, E. Cellular Cross-Talk between Epicardial Adipose Tissue and Myocardium in Relation to the Pathogenesis of Cardiovascular Disease. Am. J. Physiol. Endoc. M 2012, 303, E937–E949. [Google Scholar] [CrossRef] [PubMed] [Green Version]
  17. Al-Dibouni, A.; Gaspar, R.; Ige, S.; Boateng, S.; Cagampang, F.R.; Gibbins, J.; Cox, R.D.; Sellayah, D. Unique Genetic and Histological Signatures of Mouse Pericardial Adipose Tissue. Nutrients 2020, 12, 1855. [Google Scholar] [CrossRef] [PubMed]
  18. Palau, N.; Rebuffat, S.A.; Altirriba, J.; Piquer, S.; Hanzu, F.A.; Gomis, R.; Barbera, A. Role of IGFBP-3 in the Regulation of β-Cell Mass during Obesity: Adipose Tissue/β-Cell Cross Talk. Endocrinology 2012, 153, 177–187. [Google Scholar] [CrossRef]
  19. Malpique, R.; Figueiredo, H.; Esteban, Y.; Rebuffat, S.A.; Hanzu, F.A.; Vinaixa, M.; Yanes, O.; Correig, X.; Barceló-Batllori, S.; Gasa, R.; et al. Integrative Analysis Reveals Novel Pathways Mediating the Interaction between Adipose Tissue and Pancreatic Islets in Obesity in Rats. Diabetologia 2014, 57, 1219–1231. [Google Scholar] [CrossRef]
  20. Rebuffat, S.A.; Sidot, E.; Guzman, C.; Azay-Milhau, J.; Jover, B.; Lajoix, A.-D.; Peraldi-Roux, S. Adipose Tissue Derived-Factors Impaired Pancreatic β-Cell Function in Diabetes. Biochim. Biophys. Acta Mol. Basis Dis. 2018, 1864, 3378–3387. [Google Scholar] [CrossRef]
  21. Gerst, F.; Wagner, R.; Kaiser, G.; Panse, M.; Heni, M.; Machann, J.; Bongers, M.N.; Sartorius, T.; Sipos, B.; Fend, F.; et al. Metabolic Crosstalk between Fatty Pancreas and Fatty Liver: Effects on Local Inflammation and Insulin Secretion. Diabetologia 2017, 60, 2240–2251. [Google Scholar] [CrossRef]
  22. Laugerette, F.; Furet, J.-P.; Debard, C.; Daira, P.; Loizon, E.; Géloën, A.; Soulage, C.O.; Simonet, C.; Lefils-Lacourtablaise, J.; Bernoud-Hubac, N.; et al. Oil Composition of High-Fat Diet Affects Metabolic Inflammation Differently in Connection with Endotoxin Receptors in Mice. Am. J. Physiol. Endocrinol. Metab. 2012, 302, E374–E386. [Google Scholar] [CrossRef] [Green Version]
  23. Mounien, L.; Tourniaire, F.; Landrier, J.-F. Anti-Obesity Effect of Carotenoids: Direct Impact on Adipose Tissue and Adipose Tissue-Driven Indirect Effects. Nutrients 2019, 11, 1562. [Google Scholar] [CrossRef] [Green Version]
  24. Harari, A.; Coster, A.C.F.; Jenkins, A.; Xu, A.; Greenfield, J.R.; Harats, D.; Shaish, A.; Samocha-Bonet, D. Obesity and Insulin Resistance Are Inversely Associated with Serum and Adipose Tissue Carotenoid Concentrations in Adults. J. Nutr. 2020, 150, 38–46. [Google Scholar] [CrossRef] [Green Version]
  25. Furukawa, S.; Fujita, T.; Shimabukuro, M.; Iwaki, M.; Yamada, Y.; Nakajima, Y.; Nakayama, O.; Makishima, M.; Matsuda, M.; Shimomura, I. Increased Oxidative Stress in Obesity and Its Impact on Metabolic Syndrome. J. Clin. Investig. 2004, 114, 1752–1761. [Google Scholar] [CrossRef]
  26. Murdolo, G.; Piroddi, M.; Luchetti, F.; Tortoioli, C.; Canonico, B.; Zerbinati, C.; Galli, F.; Iuliano, L. Oxidative Stress and Lipid Peroxidation By-Products at the Crossroad between Adipose Organ Dysregulation and Obesity-Linked Insulin Resistance. Biochimie 2013, 95, 585–594. [Google Scholar] [CrossRef]
  27. Okuno, Y.; Fukuhara, A.; Hashimoto, E.; Kobayashi, H.; Kobayashi, S.; Otsuki, M.; Shimomura, I. Oxidative Stress Inhibits Healthy Adipose Expansion Through Suppression of SREBF1-Mediated Lipogenic Pathway. Diabetes 2018, 67, 1113–1127. [Google Scholar] [CrossRef] [Green Version]
  28. Morrow, J.D.; Hill, K.E.; Burk, R.F.; Nammour, T.M.; Badr, K.F.; Roberts, L.J. A Series of Prostaglandin F2-like Compounds Are Produced in Vivo in Humans by a Non-Cyclooxygenase, Free Radical-Catalyzed Mechanism. Proc. Natl. Acad. Sci. USA 1990, 87, 9383–9387. [Google Scholar] [CrossRef] [Green Version]
  29. Galano, J.-M.; Lee, Y.Y.; Oger, C.; Vigor, C.; Vercauteren, J.; Durand, T.; Giera, M.; Lee, J.C.-Y. Isoprostanes, Neuroprostanes and Phytoprostanes: An Overview of 25 Years of Research in Chemistry and Biology. Prog. Lipid Res. 2017, 68, 83–108. [Google Scholar] [CrossRef]
  30. Benndorf, R.A.; Schwedhelm, E.; Gnann, A.; Taheri, R.; Kom, G.; Didié, M.; Steenpass, A.; Ergün, S.; Böger, R.H. Isoprostanes Inhibit Vascular Endothelial Growth Factor-Induced Endothelial Cell Migration, Tube Formation, and Cardiac Vessel Sprouting in Vitro, as Well as Angiogenesis in Vivo via Activation of the Thromboxane A(2) Receptor: A Potential Link between Oxidative Stress and Impaired Angiogenesis. Circ. Res. 2008, 103, 1037–1046. [Google Scholar] [CrossRef] [Green Version]
  31. Proudfoot, J.M.; Murrey, M.W.; McLean, S.; Greenland, E.L.; Barden, A.E.; Croft, K.D.; Galano, J.-M.; Durand, T.; Mori, T.A.; Pixley, F.J. F2-Isoprostanes Affect Macrophage Migration and CSF-1 Signalling. Free Radic. Biol. Med. 2018, 126, 142–152. [Google Scholar] [CrossRef]
  32. Lee, C.-Y.J.; Huang, S.H.; Jenner, A.M.; Halliwell, B. Measurement of F2-Isoprostanes, Hydroxyeicosatetraenoic Products, and Oxysterols from a Single Plasma Sample. Free Radical. Bio. Med. 2008, 44, 1314–1322. [Google Scholar] [CrossRef]
  33. Vigor, C.; Reversat, G.; Rocher, A.; Oger, C.; Galano, J.-M.; Vercauteren, J.; Durand, T.; Tonon, T.; Leblanc, C.; Potin, P. Isoprostanoids Quantitative Profiling of Marine Red and Brown Macroalgae. Food Chem. 2018, 268, 452–462. [Google Scholar] [CrossRef] [Green Version]
  34. Rotondo, F.; Romero, M.D.M.; Ho-Palma, A.C.; Remesar, X.; Fernández-López, J.A.; Alemany, M. Quantitative Analysis of Rat Adipose Tissue Cell Recovery, and Non-Fat Cell Volume, in Primary Cell Cultures. PeerJ 2016, 4, e2725. [Google Scholar] [CrossRef] [Green Version]
  35. Parlee, S.D.; Lentz, S.I.; Mori, H.; MacDougald, O.A. Quantifying Size and Number of Adipocytes in Adipose Tissue. Meth. Enzymol. 2014, 537, 93–122. [Google Scholar] [CrossRef] [Green Version]
  36. de la Torre, A.; Lee, Y.Y.; Mazzoni, A.; Guy, A.; Bultel-Poncé, V.; Durand, T.; Oger, C.; Lee, J.C.-Y.; Galano, J.-M. Total Syntheses and in Vivo Quantitation of Novel Neurofuran and Dihomo-Isofuran Derived from Docosahexaenoic Acid and Adrenic Acid. Chemistry 2015, 21, 2442–2446. [Google Scholar] [CrossRef]
  37. Morrow, J.D.; Awad, J.A.; Boss, H.J.; Blair, I.A.; Roberts, L.J. Non-Cyclooxygenase-Derived Prostanoids (F2-Isoprostanes) Are Formed in Situ on Phospholipids. Proc. Natl. Acad. Sci. USA 1992, 89, 10721–10725. [Google Scholar] [CrossRef] [Green Version]
  38. Shimizu, I.; Aprahamian, T.; Kikuchi, R.; Shimizu, A.; Papanicolaou, K.N.; MacLauchlan, S.; Maruyama, S.; Walsh, K. Vascular Rarefaction Mediates Whitening of Brown Fat in Obesity. J. Clin. Investig. 2014, 124, 2099–2112. [Google Scholar] [CrossRef] [Green Version]
  39. Klöting, N.; Fasshauer, M.; Dietrich, A.; Kovacs, P.; Schön, M.R.; Kern, M.; Stumvoll, M.; Blüher, M. Insulin-Sensitive Obesity. Am. J. Physiol. Endocrinol. Metab. 2010, 299, E506–E515. [Google Scholar] [CrossRef]
  40. Bódis, K.; Roden, M. Energy Metabolism of White Adipose Tissue and Insulin Resistance in Humans. Eur. J. Clin. Investig. 2018, 48, e13017. [Google Scholar] [CrossRef] [Green Version]
  41. Chusyd, D.E.; Wang, D.; Huffman, D.M.; Nagy, T.R. Relationships between Rodent White Adipose Fat Pads and Human White Adipose Fat Depots. Front. Nutr. 2016, 3, 10. [Google Scholar] [CrossRef] [Green Version]
  42. Konrad, D.; Rudich, A.; Schoenle, E.J. Improved Glucose Tolerance in Mice Receiving Intraperitoneal Transplantation of Normal Fat Tissue. Diabetologia 2007, 50, 833–839. [Google Scholar] [CrossRef] [PubMed] [Green Version]
  43. Janssens, S.; Heemskerk, M.M.; van den Berg, S.A.; van Riel, N.A.; Nicolay, K.; van Dijk, K.W.; Prompers, J.J. Effects of Low-Stearate Palm Oil and High-Stearate Lard High-Fat Diets on Rat Liver Lipid Metabolism and Glucose Tolerance. Nutr. Metab. 2015, 12, 1–11. [Google Scholar] [CrossRef] [Green Version]
  44. van Dijk, S.J.; Feskens, E.J.M.; Bos, M.B.; Hoelen, D.W.M.; Heijligenberg, R.; Bromhaar, M.G.; de Groot, L.C.P.G.M.; de Vries, J.H.M.; Müller, M.; Afman, L.A. A Saturated Fatty Acid-Rich Diet Induces an Obesity-Linked Proinflammatory Gene Expression Profile in Adipose Tissue of Subjects at Risk of Metabolic Syndrome. Am. J. Clin. Nutr. 2009, 90, 1656–1664. [Google Scholar] [CrossRef] [Green Version]
  45. Itariu, B.K.; Zeyda, M.; Hochbrugger, E.E.; Neuhofer, A.; Prager, G.; Schindler, K.; Bohdjalian, A.; Mascher, D.; Vangala, S.; Schranz, M.; et al. Long-Chain n-3 PUFAs Reduce Adipose Tissue and Systemic Inflammation in Severely Obese Nondiabetic Patients: A Randomized Controlled Trial. Am. J. Clin. Nutr. 2012, 96, 1137–1149. [Google Scholar] [CrossRef] [Green Version]
  46. Yamazaki, R.K.; Brito, G.A.P.; Coelho, I.; Pequitto, D.C.T.; Yamaguchi, A.A.; Borghetti, G.; Schiessel, D.L.; Kryczyk, M.; Machado, J.; Rocha, R.E.R.; et al. Low Fish Oil Intake Improves Insulin Sensitivity, Lipid Profile and Muscle Metabolism on Insulin Resistant MSG-Obese Rats. Lipids Health Dis. 2011, 10, 66. [Google Scholar] [CrossRef] [Green Version]
  47. Ramaiyan, B.; Bettadahalli, S.; Talahalli, R.R. Dietary Omega-3 but Not Omega-6 Fatty Acids down-Regulate Maternal Dyslipidemia Induced Oxidative Stress: A Three Generation Study in Rats. Biochem. Biophys. Res. Commun. 2016, 477, 887–894. [Google Scholar] [CrossRef]
  48. Sampaio, K.A.; Ayala, J.V.; Van Hoed, V.; Monteiro, S.; Ceriani, R.; Verhé, R.; Meirelles, A.J.A. Impact of Crude Oil Quality on the Refining Conditions and Composition of Nutraceuticals in Refined Palm Oil. J. Food Sci. 2017, 82, 1842–1850. [Google Scholar] [CrossRef]
  49. Bonet, M.L.; Canas, J.A.; Ribot, J.; Palou, A. Carotenoids and Their Conversion Products in the Control of Adipocyte Function, Adiposity and Obesity. Arch. Biochem. Biophys. 2015, 572, 112–125. [Google Scholar] [CrossRef] [Green Version]
  50. Macarulla, M.T.; Alberdi, G.; Gómez, S.; Tueros, I.; Bald, C.; Rodríguez, V.M.; Martínez, J.A.; Portillo, M.P. Effects of Different Doses of Resveratrol on Body Fat and Serum Parameters in Rats Fed a Hypercaloric Diet. J. Physiol. Biochem. 2009, 65, 369–376. [Google Scholar] [CrossRef] [PubMed]
  51. Poudyal, H.; Campbell, F.; Brown, L. Olive Leaf Extract Attenuates Cardiac, Hepatic, and Metabolic Changes in High Carbohydrate–, High Fat–Fed Rats. J. Nutr. 2010, 140, 946–953. [Google Scholar] [CrossRef] [PubMed] [Green Version]
  52. Claro-Cala, C.M.; Quintela, J.C.; Pérez-Montero, M.; Miñano, J.; de Sotomayor, M.A.; Herrera, M.D.; Rodríguez-Rodríguez, A.R. Pomace Olive Oil Concentrated in Triterpenic Acids Restores Vascular Function, Glucose Tolerance and Obesity Progression in Mice. Nutrients 2020, 12, 323. [Google Scholar] [CrossRef] [PubMed] [Green Version]
  53. Jernås, M.; Palming, J.; Sjöholm, K.; Jennische, E.; Svensson, P.-A.; Gabrielsson, B.G.; Levin, M.; Sjögren, A.; Rudemo, M.; Lystig, T.C.; et al. Separation of Human Adipocytes by Size: Hypertrophic Fat Cells Display Distinct Gene Expression. FASEB J. 2006, 20, 1540–1542. [Google Scholar] [CrossRef]
  54. Nguyen, M.T.A.; Favelyukis, S.; Nguyen, A.-K.; Reichart, D.; Scott, P.A.; Jenn, A.; Liu-Bryan, R.; Glass, C.K.; Neels, J.G.; Olefsky, J.M. A Subpopulation of Macrophages Infiltrates Hypertrophic Adipose Tissue and Is Activated by Free Fatty Acids via Toll-like Receptors 2 and 4 and JNK-Dependent Pathways. J. Biol. Chem. 2007, 282, 35279–35292. [Google Scholar] [CrossRef] [Green Version]
  55. Yamada, M.; Maintinguer Norde, M.; Borges, M.C.; Mieko de Meneses Fujii, T.; Silva Jacob, P.; Fonseca-Alaniz, M.H.; Cardoso Alonso-Vale, M.I.; Torres-Leal, F.L.; Tirapegui, J.; Fock, R.A.; et al. Nutrient-Adjusted High-Fat Diet Is Associated with Absence of Periepididymal Adipose Tissue Inflammation: Is There a Link with Adequate Micronutrient Levels? Int. J. Vitam. Nutr. Res. 2013, 83, 299–310. [Google Scholar] [CrossRef] [PubMed]
  56. Wang, N.; Guo, J.; Liu, F.; Wang, M.; Li, C.; Jia, L.; Zhai, L.; Wei, W.; Bai, Y. Depot-Specific Inflammation with Decreased Expression of ATM2 in White Adipose Tissues Induced by High-Margarine/Lard Intake. PLoS ONE 2017, 12, e0188007. [Google Scholar] [CrossRef] [PubMed] [Green Version]
  57. Poret, J.M.; Souza-Smith, F.; Marcell, S.J.; Gaudet, D.A.; Tzeng, T.H.; Braymer, H.D.; Harrison-Bernard, L.M.; Primeaux, S.D. High Fat Diet Consumption Differentially Affects Adipose Tissue Inflammation and Adipocyte Size in Obesity-Prone and Obesity-Resistant Rats. Int. J. Obes. 2018, 42, 535–541. [Google Scholar] [CrossRef] [Green Version]
  58. Chanclón, B.; Wu, Y.; Vujičić, M.; Bauzá-Thorbrügge, M.; Banke, E.; Micallef, P.; Kanerva, J.; Wilder, B.; Rorsman, P.; Wernstedt Asterholm, I. Peripancreatic Adipose Tissue Protects against High-Fat-Diet-Induced Hepatic Steatosis and Insulin Resistance in Mice. Int. J. Obes. 2020, 44, 2323–2334. [Google Scholar] [CrossRef]
  59. Rebuffat, S.A.; Oliveira, J.M.; Altirriba, J.; Palau, N.; Garcia, A.; Esteban, Y.; Nadal, B.; Gomis, R. Downregulation of Sfrp5 Promotes Beta Cell Proliferation during Obesity in the Rat. Diabetologia 2013, 56, 2446–2455. [Google Scholar] [CrossRef] [Green Version]
  60. Brinkley, T.E.; Leng, X.; Chughtai, H.L.; Nicklas, B.J.; Kritchevsky, S.B.; Ding, J.; Kitzman, D.W.; Hundley, W.G. Periaortic Fat and Cardiovascular Risk: A Comparison of High-Risk Older Adults and Age-Matched Healthy Controls. Int. J. Obes. 2014, 38, 1397–1402. [Google Scholar] [CrossRef] [Green Version]
  61. Costa, R.M.; Neves, K.B.; Tostes, R.C.; Lobato, N.S. Perivascular Adipose Tissue as a Relevant Fat Depot for Cardiovascular Risk in Obesity. Front. Physiol. 2018, 9, 253. [Google Scholar] [CrossRef] [PubMed]
  62. Masi, L.N.; Crisma, A.R.; Martins, A.R.; do Amaral, C.L.; Torres, R.P.; Mancini Filho, J.; Hirabara, S.M.; Curi, R. Inflammatory State of Periaortic Adipose Tissue in Mice under Obesogenic Dietary Regimens. J. Nutr. Intermed. Metab. 2016, 6, 1–7. [Google Scholar] [CrossRef] [Green Version]
  63. Oi-Kano, Y.; Iwasaki, Y.; Nakamura, T.; Watanabe, T.; Goto, T.; Kawada, T.; Watanabe, K.; Iwai, K. Oleuropein Aglycone Enhances UCP1 Expression in Brown Adipose Tissue in High-Fat-Diet-Induced Obese Rats by Activating β-Adrenergic Signaling. J. Nutr. Biochem. 2017, 40, 209–218. [Google Scholar] [CrossRef] [PubMed]
  64. Fessel, J.P.; Porter, N.A.; Moore, K.P.; Sheller, J.R.; Roberts, L.J. Discovery of Lipid Peroxidation Products Formed in Vivo with a Substituted Tetrahydrofuran Ring (Isofurans) That Are Favored by Increased Oxygen Tension. Proc. Natl. Acad. Sci. USA 2002, 99, 16713–16718. [Google Scholar] [CrossRef] [Green Version]
  65. Zhang, Y.; Chen, X. Reducing Selenoprotein P Expression Suppresses Adipocyte Differentiation as a Result of Increased Preadipocyte Inflammation. Am. J. Physiol. Endocrinol. Metab. 2011, 300, E77–E85. [Google Scholar] [CrossRef] [Green Version]
  66. Marseglia, L.; Manti, S.; D’Angelo, G.; Nicotera, A.; Parisi, E.; Di Rosa, G.; Gitto, E.; Arrigo, T. Oxidative Stress in Obesity: A Critical Component in Human Diseases. Int. J. Mol. Sci. 2014, 16, 378–400. [Google Scholar] [CrossRef] [PubMed] [Green Version]
  67. Chattopadhyay, M.; Khemka, V.K.; Chatterjee, G.; Ganguly, A.; Mukhopadhyay, S.; Chakrabarti, S. Enhanced ROS Production and Oxidative Damage in Subcutaneous White Adipose Tissue Mitochondria in Obese and Type 2 Diabetes Subjects. Mol. Cell Biochem. 2015, 399, 95–103. [Google Scholar] [CrossRef]
  68. Johnson, A.R.; Wilkerson, M.D.; Sampey, B.P.; Troester, M.A.; Hayes, D.N.; Makowski, L. Cafeteria Diet-Induced Obesity Causes Oxidative Damage in White Adipose. Biochem. Biophys. Res. Commun. 2016, 473, 545–550. [Google Scholar] [CrossRef] [Green Version]
  69. Lin, Y.; Berg, A.H.; Iyengar, P.; Lam, T.K.T.; Giacca, A.; Combs, T.P.; Rajala, M.W.; Du, X.; Rollman, B.; Li, W.; et al. The Hyperglycemia-Induced Inflammatory Response in Adipocytes: The Role of Reactive Oxygen Species. J. Biol. Chem. 2005, 280, 4617–4626. [Google Scholar] [CrossRef] [Green Version]
  70. Laget, J. Biocommunication between Visceral Adipose Tissue and Pancreatic Beta-Cells: Isoprostanes and MiRNAs. Ph.D. Thesis, Université de Montpellier, Montpellier, France, 2019. [Google Scholar]
Figure 1. Adipocyte size and macrophage infiltration in epididymal white adipose tissue (eWAT). (A) Representative microphotographs of haematoxylin staining (×200; scale bar = 20 µm); (B) quantitative analysis of adipocyte area (µm2); (C) relative frequency of adipocyte area (%); (D) quantitative analysis of immunohistochemistry for CD68 (number of positive cells/mm2 of adipose tissue). Data are shown as means ± SEM, n = 4–7 animals per group. * p < 0.05 vs. control diet.
Nutrients 13 01134 g001
Figure 2. Adipocyte size and macrophage infiltration in peripancreatic adipose tissue (pWAT). (A) Representative microphotographs of haematoxylin staining (×200; scale bar = 20µm); (B) quantitative analysis of adipocyte area (µm2); (C) relative frequency of adipocyte area (%); (D) quantitative analysis of immunohistochemistry for CD68 (number of positive cells/mm2 of adipose tissue). Inset presents an example of CD68 staining in refined PO. Data are shown as means ± SEM, n = 4–7 animals per group. * p < 0.05 vs. control diet.
Nutrients 13 01134 g002
Figure 3. Lipid inclusions in periaortic brown adipose tissue (AoBAT). (A) Representative microphotographs of haematoxylin staining (×200; scale bar = 20 µm); (B) quantitative analysis of lipid inclusions as % of total tissue area; (C) box plot displaying the distribution of lipid inclusions. Quantification of lipid inclusion was realised in 10–30 fields per rat. Data are shown as means ± SEM, n = 7 animals per group. * p < 0.05 vs. control diet.
Nutrients 13 01134 g003
Figure 4. Impact of high intake of palm oils and lard on isoprostanoid concentration in peripancreatic adipose tissue (pWAT). (A) Quantification of isoprostanoids with a trans configuration: 15(RS)-15-F2t-IsoP and 5(RS)-5-F2t-IsoP (fg/adipocyte). (B) Quantification of 5(RS)-5-F2c-IsoP, an isoprostanoid with a cis configuration (fg/adipocyte). (C) Quantification of the isofuran 7(RS)-ST- Δ8-11-dihomo-IsoF (fg/adipocyte). Isoprostanoids were assayed from 200 mg of adipose tissue per rat. Data are shown as means ± SEM, n = 6–7 animals per group. * p < 0.05 or ** p < 0.01 vs. control diet.
Nutrients 13 01134 g004
Table 1. Body weight, glucose homeostasis and blood lipids.
ControlCrude PORefined POLardp-Value
Initial body weight (g)209 ± 4203 ± 1204 ± 2208 ± 3NS
Final body weight (g)527 ± 11609 ± 14 **612 ± 20 **611 ± 23 **0.0065
Body weight gain (g)318 ± 9406 ± 14 **408 ± 19 **403 ± 22 **0.0022
eWAT weight (g)12.6 ± 1.820.1 ± 2.116.6 ± 3.521.4 ± 2.9NS
Fasting glucose (mg/dL)136.0 ± 3.5155.0 ± 5.8 *157.1 ± 3.7 **131.6 ± 5.70.0015
Fasting insulin (mU/L)53.5 ± 7.6108.6 ± 22.9147.0 ± 29.993.6 ± 23.6NS
HOMA-IR18.1 ± 2.841.7 ± 9.157.6 ± 12.0 **31.6 ± 8.70.0344
Blood TG (mM)1.03 ± 0.150.99 ± 0.111.33 ± 0.211.01 ± 0.15NS
Total cholesterol (mM)1.97 ± 0.161.75 ± 0.152.00 ± 0.141.55 ± 0.09NS
HDL cholesterol (mM)1.48 ± 0.121.34 ± 0.851.56 ± 0.121.06 ± 0.12 *0.0179
Results are expressed as mean ± SEM, n = 7 animals per group. After one-way ANOVA (p-value indicated), data were compared by a Fishers’ protected least significant difference (PLSD) test: * p < 0.05 and ** p < 0.01 vs. control group; PO: palm oil, NS: non-significant, eWAT: epididymal white adipose tissue, HOMA-IR: homeostasis model assessment of insulin resistance, TG: triglycerides, HDL: high-density lipoprotein.
Publisher’s Note: MDPI stays neutral with regard to jurisdictional claims in published maps and institutional affiliations.

