
Animal Fat Intake Is Associated with Albuminuria in Patients with Non-Alcoholic Fatty Liver Disease and Metabolic Syndrome

 ,
,  ,
,  , , , and
Abstract
:1. Introduction
2. Materials and Methods
2.1. Study Design
2.2. Subjects
2.3. Ethics
2.4. Anthropometrics and Blood Pressure
2.5. General Data and Medical History
2.6. Total Energy and Dietary Fats Intake
2.7. Blood Collection and Analysis
2.8. Statistical Analyses
3. Results
4. Discussion
5. Strengths and Limitations
6. Conclusions
Author Contributions
Funding
Institutional Review Board Statement
Informed Consent Statement
Data Availability Statement
Acknowledgments
Conflicts of Interest
References
- Ng, W.Y.; Lui, K.F.; Thai, A.C. Evaluation of a rapid screening test for microalbuminuria with a spot measurement of urine albumin-creatinine ratio. Ann. Acad. Med. Singap. 2000, 29, 62–65. [Google Scholar]
- Chugh, A.; Bakris, G.L. Microalbuminuria: What is it? Why is it important? What should be done about it? An update. J. Clin. Hypertens. 2007, 9, 196–200. [Google Scholar] [CrossRef] [Green Version]
- Weir, M.R. Microalbuminuria and Cardiovascular Disease. Clin. J. Am. Soc. Nephrol. 2007, 2, 581–590. [Google Scholar] [CrossRef]
- Romundstad, S.; Holmen, J.; Kvenild, K.; Hallan, H.; Ellekjær, H. Microalbuminuria and all-cause mortality in 2089 apparently healthy individuals: A 4.4-year follow-up study. The Nord-Trøndelag Health Study (HUNT), Norway. Am. J. Kidney Dis. 2003, 42, 466–473. [Google Scholar] [CrossRef]
- Hoehner, C.M.; Greenlund, K.J.; Rith-Najarian, S.; Casper, M.L.; McClellan, W.M. Association of the Insulin Resistance Syndrome and Microalbuminuria among Nondiabetic Native Americans. The Inter-Tribal Heart Project. J. Am. Soc. Nephrol. 2002, 13, 1626–1634. [Google Scholar] [CrossRef] [Green Version]
- Rachmani, R.; Levi, Z.; Lidar, M.; Slavachevski, I.; Half-Onn, E.; Ravid, M. Considerations about the threshold value of microalbuminuria in patients with diabetes mellitus: Lessons from an 8-year follow-up study of 599 patients. Diabetes Res. Clin. Pract. 2000, 49, 187–194. [Google Scholar] [CrossRef]
- Arnlöv, J.; Evans, J.C.; Meigs, J.B.; Wang, T.J.; Fox, C.S.; Levy, D.; Benjamin, E.J.; D’Agostino, R.B.; Vasan, R.S. Low-grade albuminuria and incidence of cardiovascular disease events in nonhypertensive and nondiabetic individuals: The Framingham Heart Study. Circulation 2005, 112, 969–975. [Google Scholar] [CrossRef] [PubMed] [Green Version]
- Matsushita, K.; Van Der Velde, M.; Astor, B.C.; Woodward, M.; Levey, A.S.; De Jong, P.E.; Coresh, J.; Gansevoort, R.T. Association of estimated glomerular filtration rate and albuminuria with all-cause and cardiovascular mortality in general population cohorts: A collaborative meta-analysis. Lancet 2010, 375, 2073–2081. [Google Scholar] [CrossRef] [PubMed] [Green Version]
- Kim, C.H.; Younossi, Z.M. Nonalcoholic fatty liver disease: A manifestation of the metabolic syndrome. Clevel. Clin. J. Med. 2008, 75, 721–728. [Google Scholar] [CrossRef]
- Stepanova, M.; Rafiq, N.; Makhlouf, H.; Agrawal, R.; Kaur, I.; Younoszai, Z.; McCullough, A.; Goodman, Z.; Younossi, Z.M. Predictors of All-Cause Mortality and Liver-Related Mortality in Patients with Non-Alcoholic Fatty Liver Disease (NAFLD). Dig. Dis. Sci. 2013, 58, 3017–3023. [Google Scholar] [CrossRef]
- Ekstedt, M.; Hagström, H.; Nasr, P.; Fredrikson, M.; Stål, P.; Kechagias, S.; Hultcrantz, R. Fibrosis stage is the strongest predictor for disease-specific mortality in NAFLD after up to 33 years of follow-up. Hepatology 2015, 61, 1547–1554. [Google Scholar] [CrossRef] [PubMed] [Green Version]
- Younossi, Z.M.; Otgonsuren, M.; Venkatesan, C.; Mishra, A. In patients with non-alcoholic fatty liver disease, meta-bolically abnormal individuals are at a higher risk for mortality while metabolically normal individuals are not. Me-Tabolism 2013, 62, 352–360. [Google Scholar]
- Lin, L.; Lu, J.; Huang, X.; Ding, L.; Huang, Y.; Wang, P.; Peng, K.; Zhang, D.; Xu, Y.; Xu, M.; et al. Nonalcoholic fatty liver disease is associated with low-grade albuminuria in Chinese adults (change not displayed). QJM Int. J. Med. 2016, 109, 737–743. [Google Scholar] [CrossRef] [Green Version]
- Kang, S.H.; Cho, K.H.; Do, J.Y. Non-alcoholic fatty liver disease is associated with low-grade albuminuria in men without diabetes mellitus. Int. J. Med. Sci. 2019, 16, 285–291. [Google Scholar] [CrossRef] [PubMed] [Green Version]
- Amin, R.F.; El Bendary, A.S.; Ezzat, S.E.; Mohamed, W.S. Serum Ferritin level, microalbuminuria and non-alcoholic fatty liver disease in type 2 diabetic patients. Diabetes Metab. Syndr. Clin. Res. Rev. 2019, 13, 2226–2229. [Google Scholar] [CrossRef] [PubMed]
- Chang, A.; Van Horn, L.; Jacobs, D.R., Jr.; Liu, K.; Muntner, P.; Newsome, B.; Shoham, D.A.; Durazo-Arvizu, R.; Bib-bins-Domingo, K.; Reis, J.; et al. Lifestyle-related factors, obesity, and incident microalbuminuria: The CARDIA (Cor-onary Artery Risk Development in Young Adults) study. Am. J. Kidney Dis. 2013, 62, 267–275. [Google Scholar] [CrossRef] [Green Version]
- Guo, V.Y.; Brage, S.; Ekelund, U.M.; Griffin, S.J.; Simmons, R.K.; Amin, R.; Baker, G.; Betts, M.; Dickinson, A.; Tcheugui, J.B.E.; et al. Objectively measured sedentary time, physical activity and kidney function in people with recently diagnosed Type 2 diabetes: A prospective cohort analysis. Diabet. Med. 2015, 33, 1222–1229. [Google Scholar] [CrossRef] [PubMed] [Green Version]
- Lynch, B.M.; White, S.L.; Owen, N.; Healy, G.N.; Chadban, S.J.; Atkins, R.C.; Dunstan, D.W. Television Viewing Time and Risk of Chronic Kidney Disease in Adults: The AusDiab Study. Ann. Behav. Med. 2010, 40, 265–274. [Google Scholar] [CrossRef]
- Nettleton, J.A.; Steffen, L.M.; Palmas, W.; Burke, G.L.; Jacobs, D.R. Associations between microalbuminuria and animal foods, plant foods, and dietary patterns in the Multiethnic Study of Atherosclerosis. Am. J. Clin. Nutr. 2008, 87, 1825–1836. [Google Scholar] [CrossRef]
- Agrawal, V.; Khan, I.; Rai, B.; Krause, K.; Chengelis, D.; Zalesin, K.; Rocher, L.; McCullough, P. The effect of weight loss after bariatric surgery on albuminuria. Clin. Nephrol. 2008, 70, 194–202. [Google Scholar] [CrossRef]
- Praga, M.; Morales, E. Weight Loss and Proteinuria. Contrib. Nephrol. 2006, 151, 221–229. [Google Scholar] [CrossRef]
- Ruggenenti, P.; Abbate, M.; Ruggiero, B.; Rota, S.; Trillini, M.; Aparicio, C.; Parvanova, A.; Petrov Iliev, I.; Pisanu, G.; Perna, A.; et al. Renal and Systemic Effects of Calorie Restriction in Patients With Type 2 Diabetes With Abdominal Obesity: A Randomized Controlled Trial. Diabetes 2016, 66, 75–86. [Google Scholar] [CrossRef] [PubMed] [Green Version]
- Hansen, H.P.; Christensen, P.K.; Tauber-Lassen, E.; Klausen, A.; Jensen, B.R.; Parving, H.-H. Low-protein diet and kidney function in insulin-dependent diabetic patients with diabetic nephropathy. Kidney Int. 1999, 55, 621–628. [Google Scholar] [CrossRef] [PubMed] [Green Version]
- Schaap, G.H.; Bilo, H.J.; Alferink, T.H.; Oe, P.L.; Donker, A.J. The effect of a high protein intake on renal function of pa-tients with chronic renal insufficiency. Nephron 1987, 47, 1–6. [Google Scholar] [CrossRef]
- Hoogeveen, E.K.; Kostense, P.J.; Jager, A.; Heine, R.J.; Jakobs, C.; Bouter, L.M.; Donker, A.J.; Stehouwer, C.D. Serum homocysteine level and protein intake are related to risk of microalbuminuria: The Hoorn Study. Kidney Int. 1998, 54, 203–209. [Google Scholar] [CrossRef] [Green Version]
- Toeller, M.; Buyken, A.; Heitkamp, G.; Brmswig, S.; Mann, J.; Milneet, R.; Gries, F.A.; Keen, H. Protein intake and urinary albumin excretion rates in the EURODIABIDDM Complications Study. Diabetologia 1997, 40, 1219–1226. [Google Scholar] [CrossRef] [Green Version]
- Wrone, E.M.; Carnethon, M.R.; Palaniappan, L.; Fortmann, S.P. Association of dietary protein intake and microalbu-minuria in healthy adults: Third National Health and Nutrition Examination Survey. Am. J. Kidney Dis. 2003, 41, 580–587. [Google Scholar] [CrossRef] [PubMed]
- Bernstein, A.M.; Treyzon, L.; Li, Z. Are High-Protein, Vegetable-Based Diets Safe for Kidney Function? A Review of the Literature. J. Am. Diet. Assoc. 2007, 107, 644–650. [Google Scholar] [CrossRef]
- Wheeler, M.L.; Fineberg, S.E.; Fineberg, N.S.; Gibson, R.G.; Hackward, L.L. Animal Versus Plant Protein Meals in Indi-viduals With Type 2 Diabetes and Microalbuminuria. Diabetes Care 2002, 25, 1277–1282. [Google Scholar] [CrossRef] [Green Version]
- Lin, J.; Hu, F.B.; Curhan, G.C. Associations of Diet with Albuminuria and Kidney Function Decline. Clin. J. Am. Soc. Nephrol. 2010, 5, 836–843. [Google Scholar] [CrossRef] [Green Version]
- Lin, J.; Judd, S.; Le, A.; Ard, J.; Newsome, B.B.; Howard, G.; Warnock, D.G.; McClellan, W. Associations of dietary fat with albuminuria and kidney dysfunction. Am. J. Clin. Nutr. 2010, 92, 897–904. [Google Scholar] [CrossRef] [Green Version]
- The International Diabetic Federation (IDF). The IDF Consensus Worldwide Definition of the Metabolic Syndrome. Available online: http://www.idf.org/webdata/docs/IDF_Meta_def_final.pdf (accessed on 7 May 2020).
- Elosua, R.; Marrugat, J.; Molina, L.; Pons, S.; Pujol, E. Validation of the Minnesota Leisure Time Physical Activity Ques-tionnaire in Spanish Men. Am. J. Epidemiol. 1994, 139, 1197–1209. [Google Scholar] [CrossRef]
- Elosua, R.; Garcia, M.; Aguilar, A.; Molina, L.; Covas, M.I.; Marrugat, J. Validation of the Minnesota Leisure Time Physical Activity Questionnaire in Spanish Women. Med. Sci. Sports Exerc. 2000, 32, 1431–1437. [Google Scholar] [CrossRef] [PubMed]
- Willett, W.C.; Sampson, L.; Stampfer, M.J.; Rosner, B.; Bain, C.; Witschi, J.; Hennekens, C.H.; Speizer, F.E. Reproducibility and Validity of a Semiquantitative Food Frequency Questionnaire. Am. J. Epidemiol. 1985, 122, 51–65. [Google Scholar] [CrossRef]
- Friedewald, W.T.; Levy, R.I.; Fredrickson, D.S. Estimation of the Concentration of Low-Density Lipoprotein Cholesterol in Plasma, Without Use of the Preparative Ultracentrifuge. Clin. Chem. 1972, 18, 499–502. [Google Scholar] [CrossRef]
- Matthews, D.R.; Hosker, J.P.; Rudenski, A.S.; Naylor, B.A.; Treacher, D.F.; Turner, R.C. Homeostasis model assessment: Insulin resistance and beta-cell function from fasting plasma glucose and insulin concentrations in man. Diabetologia 1985, 28, 412–419. [Google Scholar] [CrossRef] [PubMed] [Green Version]
- Levey, A.S.; Coresh, J.; Greene, T.; Stevens, L.A.; Zhang, Y.L.; Hendriksen, S.; Kusek, J.W.; Van Lente, F. Chronic Kidney Disease Epidemiology Collaboration. Using Standardized Serum Creatinine Values in the Modification of Diet in Renal Disease Study Equation for Estimating Glomerular Filtration Rate. Ann. Intern. Med. 2006, 145, 247–254. [Google Scholar] [CrossRef] [PubMed]
- Deji, N.; Kume, S.; Araki, S.-I.; Soumura, M.; Sugimoto, T.; Isshiki, K.; Chin-Kanasaki, M.; Sakaguchi, M.; Koya, D.; Haneda, M.; et al. Structural and functional changes in the kidneys of high-fat diet-induced obese mice. Am. J. Physiol. Physiol. 2009, 296, F118–F126. [Google Scholar] [CrossRef] [PubMed] [Green Version]
- Kume, S.; Uzu, T.; Araki, S.-I.; Sugimoto, T.; Isshiki, K.; Chin-Kanasaki, M.; Sakaguchi, M.; Kubota, N.; Terauchi, Y.; Kadowaki, T.; et al. Role of Altered Renal Lipid Metabolism in the Development of Renal Injury Induced by a High-Fat Diet. J. Am. Soc. Nephrol. 2007, 18, 2715–2723. [Google Scholar] [CrossRef] [PubMed] [Green Version]
- Tokuyama, H.; Wakino, S.; Hara, Y.; Washida, N.; Fujimura, K.; Hosoya, K.; Yoshioka, K.; Hasegawa, K.; Minakuchi, H.; Homma, K.; et al. Role of mineralocorticoid receptor/Rho/Rho-kinase pathway in obesity-related renal injury. Int. J. Obes. 2011, 36, 1062–1071. [Google Scholar] [CrossRef] [PubMed] [Green Version]
- Kim, D.-H.; Yoo, T.-H.; Lee, S.H.; Kang, H.Y.; Nam, B.Y.; Kwak, S.J.; Kim, J.-K.; Park, J.T.; Han, S.H.; Kang, S.-W. Gamma Linolenic Acid Exerts Anti-Inflammatory and Anti-Fibrotic Effects in Diabetic Nephropathy. Yonsei Med. J. 2012, 53, 1165–1175. [Google Scholar] [CrossRef]
- Sun, Y.; Ge, X.; Li, X.; He, J.; Wei, X.; Du, J.; Sun, J.; Li, X.; Xun, Z.; Liu, W.; et al. High-fat diet promotes renal injury by inducing oxidative stress and mitochondrial dysfunction. Cell Death Dis. 2020, 11, 1–14. [Google Scholar] [CrossRef]
- de Vries, A.P.J.; Ruggenenti, P.; Ruan, X.Z.; Praga, M.; Cruzado, J.M.; Bajema, I.M.; D’Agati, V.D.; Lamb, H.J.; Barlovic, D.P.; Hojs, R.; et al. Fatty kidney: Emerging role of ectopic lipid in obesity-related renal disease. Lancet Diabetes Endocrinol. 2014, 2, 417–426. [Google Scholar] [CrossRef]
- Yang, W.; Luo, Y.; Yang, S.; Zeng, M.; Zhang, S.; Liu, J.; Han, Y.; Liu, Y.; Zhu, X.; Wu, H.; et al. Ectopic lipid accumulation: Potential role in tubular injury and inflammation in diabetic kidney disease. Clin. Sci. 2018, 132, 2407–2422. [Google Scholar] [CrossRef] [PubMed]
- Möllsten, A.V.; Dahlquist, G.G.; Stattin, E.-L.; Rudberg, S. Higher intakes of fish protein are related to a lower risk of microalbuminuria in young Swedish type 1 diabetic patients. Diabetes Care 2001, 24, 805–810. [Google Scholar] [CrossRef] [PubMed] [Green Version]
- Jensen, T.; Stender, S.; Goldstein, K.; Hølmer, G.; Deckert, T. Partial Normalization by Dietary Cod-Liver Oil of Increased Microvascular Albumin Leakage in Patients with Insulin-Dependent Diabetes and Albuminuria. N. Engl. J. Med. 1989, 321, 1572–1577. [Google Scholar] [CrossRef]
- Rossing, P.; Hansen, B.V.; Nielsen, F.S.; Myrup, B.; Hølmer, G.; Parving, H.-H. Fish Oil in Diabetic Nephropathy. Diabetes Care 1996, 19, 1214–1219. [Google Scholar] [CrossRef] [PubMed]
- Hu, J.; Liu, Z.; Zhang, H. Omega-3 fatty acid supplementation as an adjunctive therapy in the treatment of chronic kidney disease: A meta-analysis. Clinics 2017, 72, 58–64. [Google Scholar] [CrossRef]
- Pei, K.; Gui, T.; Li, C.; Zhang, Q.; Feng, H.; Li, Y.; Wu, J.; Gai, Z. Recent Progress on Lipid Intake and Chronic Kidney Disease. BioMed Res. Int. 2020, 2020, 1–11. [Google Scholar] [CrossRef]
- Shapiro, H.; Theilla, M.; Attal-Singer, J.; Singer, P. Effects of polyunsaturated fatty acid consumption in diabetic nephropathy. Nat. Rev. Nephrol. 2010, 7, 110–121. [Google Scholar] [CrossRef] [PubMed]
- Stevens, P.E.; Levin, A. Kidney Disease: Improving Global Outcomes Chronic Kidney Disease Guideline Development Work Group Members. Evaluation and management of chronic kidney disease: Synopsis of the kidney disease: Im-proving global outcomes 2012 clinical practice guideline. Ann. Intern. Med. 2013, 158, 825–830. [Google Scholar] [CrossRef] [PubMed] [Green Version]
- Gheorghe, A.; Griffiths, U.; Murphy, A.; Legido-Quigley, H.; Lamptey, P.; Perel, P. The economic burden of cardiovascular disease and hypertension in low- and middle-income countries: A systematic review. BMC Public Health 2018, 18, 1–11. [Google Scholar] [CrossRef] [PubMed] [Green Version]


| UACR < 10 mg/g | UACR ≥ 10–29 mg/g | UACR 30–300 mg/g | p * | Post Hoc | |
|---|---|---|---|---|---|
| n | 102 | 24 | 20 | ||
| Age (y) | 52.58 ± 8.03 | 51.17 ± 6.10 | 52.80 ± 6.07 | 0.690 | |
| Gender [n (%)] | 0.010 | ||||
| Females | 41 (40.2) | 14 (58.3) | 3 (15.0) | b > c | |
| Males | 61 (59.8) | 10 (41.7) | 17 (85.0) | c > b | |
| Alcohol (≥20g/d) [n (%)] | 20 (19.6) | 3 (12.5) | 2 (10.0) | 0.450 | |
| Currently smoking [n (%)] | 18 (17.6) | 3 (12.5) | 3 (15.0) | 0.820 | |
| Waist circumference (cm) | 111.02 ± 8.74 | 112.08 ± 9.61 | 115.79 ± 10.21 | 0.100 | |
| Weight (kg) | 94.21 ± 13.04 | 94.84 ± 14.62 | 100.62 ± 15.75 | 0.160 | |
| BMI (kg/m2) | 33.27 ± 3.58 | 34.58 ± 3.35 | 34.82 ± 4.47 | 0.110 | |
| Systolic BP (mm Hg) | 133.56 ± 13.68 | 135.90 ± 15.13 | 141.06 ± 16.97 | 0.100 | |
| Diastolic BP (mm Hg) | 83.88 ± 8.60 | 86.15 ± 9.78 | 89.73 ± 10.47 | 0.030 | c > a |
| Physical activity (MET/h) | 20.36 ± 19.48 | 18.28 ± 19.55 | 14.06 ± 14.35 | 0.400 | |
| Fasting glucose (mg/dL) | 109.03 ± 25.49 | 123.83 ± 57.87 | 148.35 ± 83.04 | 0.001 | c > a |
| HbA1c (%) | 5.93 ± 0.85 | 6.19 ± 1.46 | 6.99 ± 2.54 | 0.005 | c > a |
| HOMA-IR | 5.20 ± 3.10 | 6.80 ± 3.64 | 9.61 ± 9.53 | 0.040 | c > a |
| Total cholesterol (mg/dL) | 197.73 ± 44.30 | 196.63 ± 33.24 | 195.35 ± 36.36 | 0.970 | |
| HDL cholesterol (mg/dL) | 44.74 ± 11.01 | 43.59 ± 7.14 | 42.31 ± 10.34 | 0.600 | |
| LDL cholesterol (mg/dL) | 118.72 ± 35.90 | 114.74 ± 27.16 | 106.34 ± 31.28 | 0.340 | |
| Triglycerides (mg/dL) | 175.43 ± 125.54 | 191.50 ± 115.09 | 239.20 ± 149.50 | 0.130 | |
| AST (U/L) | 25.81 ± 13.28 | 23.83 ± 9.87 | 30.06 ± 15.52 | 0.300 | |
| ALT (U/L) | 35.85 ± 30.98 | 35.67 ± 25.40 | 44.85 ± 34.22 | 0.470 | |
| GGT (U/L) | 50.37 ± 63.77 | 49.29 ± 22.29 | 49.05 ± 30.88 | 0.990 | |
| Serum creatinine (mg/dL) | 0.84 ± 0.15 | 0.77 ± 0.14 | 0.92 ± 0.19 | 0.005 | c > b |
| eGFR (ml/min/1.73m2) | 85.99 ± 19.28 | 97.50 ± 14.47 | 83.78 ± 23.09 | 0.010 | b > a |
| HBP [n (%)] | 36 (35.3) | 6 (25.0) | 9 (45.0) | 0.380 | |
| T2DM [n (%)] | 21 (20.6) | 5 (20.8) | 5 (25.0) | 0.910 | |
| Use of hypoglycemic agents (any) [n (%)] | 20 (19.6) | 4 (16.7) | 5 (25.0) | 0.783 | |
| Oral hypoglycemic agents alone | 19 (18.6) | 3 (12.5) | 4 (20.0) | 0.750 | |
| Insulin and oral hypoglycemic agents | 1 (1.0) | 1 (4.2) | 1 (5.0) | 0.372 | |
| Antihypertensive agents (any) [n (%)] | 36 (35.3) | 6 (25.0) | 9 (45.0) | 0.379 | |
| Diuretic | 9 (8.8) | 3 (12.5) | 4 (20.0) | 0.331 | |
| β-Blocker | 6 (5.9) | 0 (0.0) | 2 (10.0) | 0.331 | |
| Calcium-channel blockers | 5 (4.9) | 0 (0.0) | 3 (15.0) | 0.084 | |
| ACEi/ARBs | 31 (30.4) | 6 (25.0) | 9 (45.0) | 0.330 | |
| Lipid-lowering agents (any) [n (%)] | 29 (28.4) | 4 (16.7) | 5 (25.0) | 0.494 | |
| Statin alone | 20 (19.6) | 4 (16.7) | 3 (15.0) | 0.861 | |
| Fibrate alone | 7 (6.9) | 0 (0.0) | 1 (5.0) | 0.411 | |
| Statin and fibrate | 2 (2.0) | 0 (0.0) | 1 (5.0) | 0.504 |
| Mean Daily Intakes | UACR < 10 mg/g | UACR ≥ 10–29 mg/g | UACR ≥ 30–300 mg/g | p * | Post Hoc |
|---|---|---|---|---|---|
| n | 102 | 24 | 20 | ||
| Total Energy (Kcal) | 2458.92 ± 840.92 | 2334.95 ± 533.24 | 2720.89 ± 978.34 | 0.300 | |
| Total fat (g) | 103.75 ± 37.69 | 106.88 ± 39.37 | 116.77 ± 39.03 | 0.400 | |
| Animal fat (g) | 49.35 ± 21.51 | 47.49 ± 20.30 | 66.70 ± 31.80 | 0.030 | c > a |
| Vegetable fat (g) | 59.79 ± 27.14 | 65.36 ± 30.76 | 72.98 ± 32.67 | 0.280 | |
| MUFA (g) | 49.76 ± 19.68 | 53.40 ± 19.86 | 55.55 ± 18.10 | 0.420 | |
| PUFA (g) | 16.68 ± 6.37 | 17.68 ± 12.10 | 17.48 ± 7.96 | 0.820 | |
| SFA (g) | 28.82 ± 12.28 | 28.63 ± 10.63 | 35.03 ± 14.00 | 0.120 | |
| TFA (g) | 0.75 ± 0.47 | 0.90 ± 0.64 | 0.97 ± 0.51 | 0.130 |
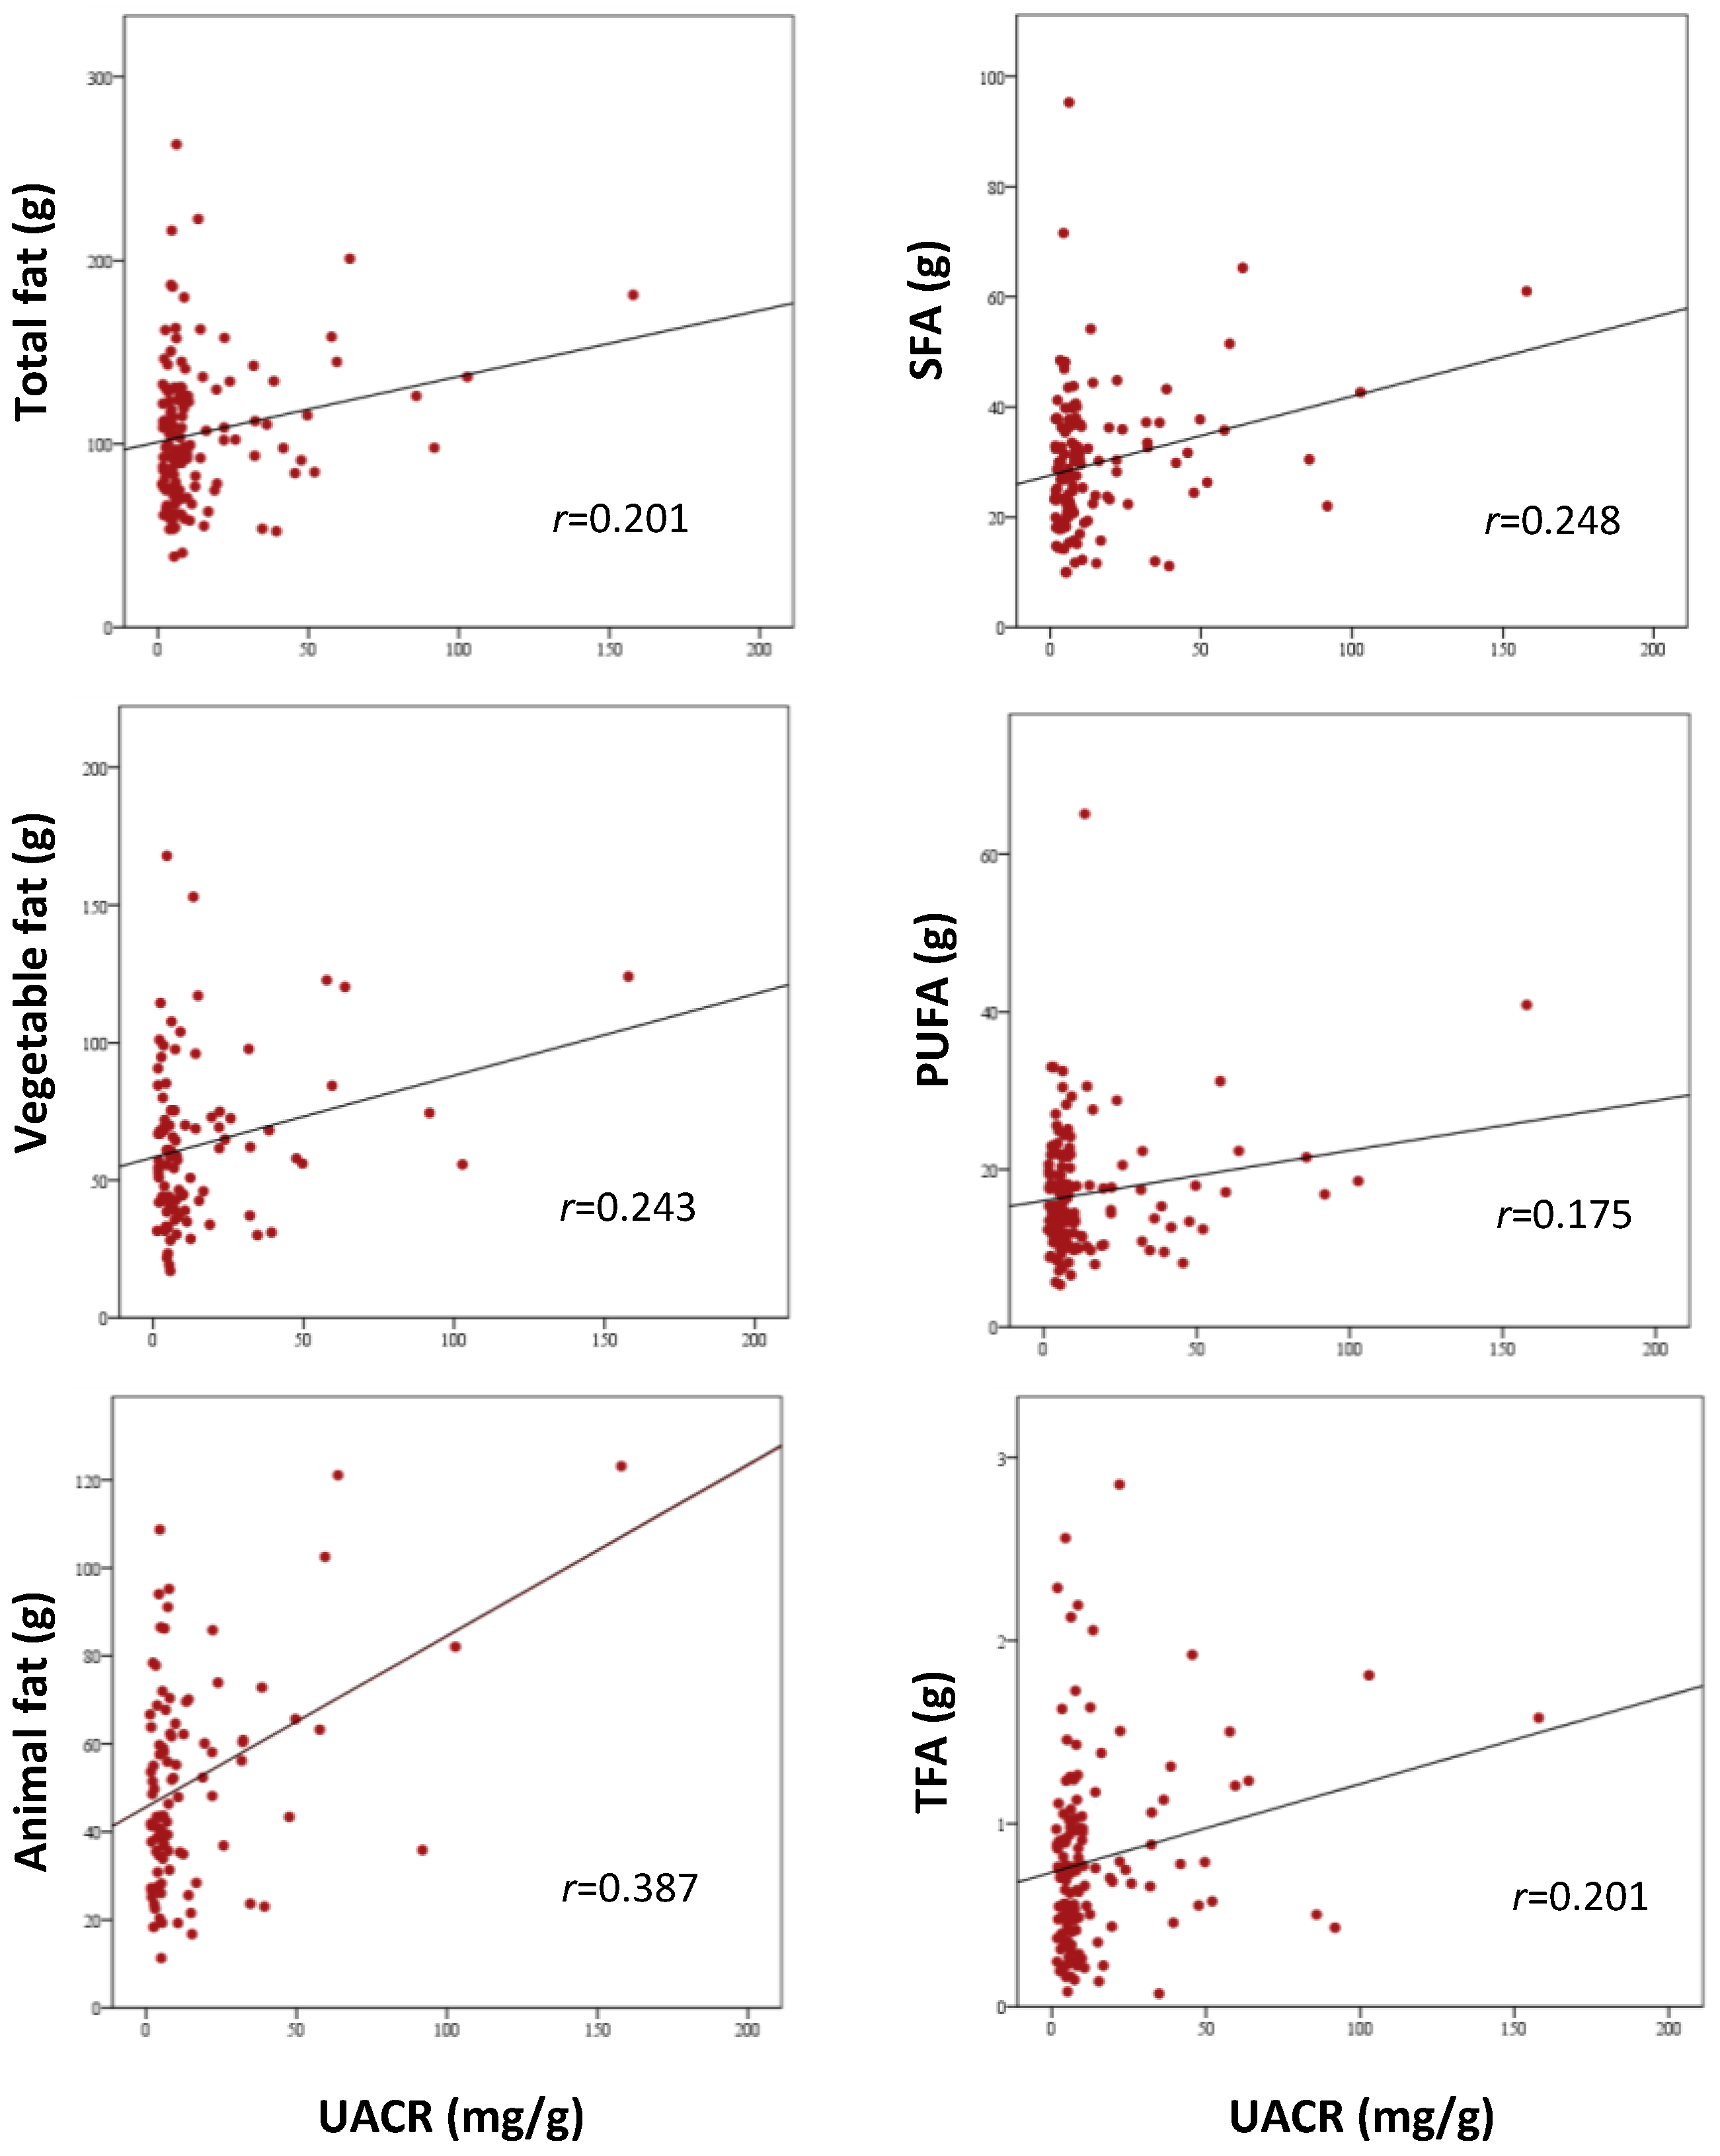
| Correlation Analysis | Multivariable Analysis (1) | Multivariable Analysis (2) | ||||
|---|---|---|---|---|---|---|
| r | p | SβC | p | SβC | p | |
| Total energy (Kcal/d) | 0.21 | 0.012 | −0.11 | 0.61 | 0.03 | 0.88 |
| Total fat (g/d) | 0.20 | 0.017 | ||||
| Animal fat (g/d) | 0.39 | <0.001 | 0.41 | 0.013 | ||
| Vegetable fat (g/d) | 0.24 | 0.018 | 0.15 | 0.31 | ||
| MUFA (g/d) | 0.12 | 0.16 | ||||
| PUFA (g/d) | 0.18 | 0.04 | 0.04 | 0.68 | ||
| SFA (g/d) | 0.25 | 0.003 | 0.16 | 0.47 | ||
| TFA (g/d) | 0.20 | 0.02 | 0.06 | 0.65 | ||
Publisher’s Note: MDPI stays neutral with regard to jurisdictional claims in published maps and institutional affiliations. |
© 2021 by the authors. Licensee MDPI, Basel, Switzerland. This article is an open access article distributed under the terms and conditions of the Creative Commons Attribution (CC BY) license (https://creativecommons.org/licenses/by/4.0/).
Share and Cite
Abbate, M.; Mascaró, C.M.; Montemayor, S.; Barbería-Latasa, M.; Casares, M.; Gómez, C.; Ugarriza, L.; Tejada, S.; Abete, I.; Zulet, M.Á.; et al. Animal Fat Intake Is Associated with Albuminuria in Patients with Non-Alcoholic Fatty Liver Disease and Metabolic Syndrome. Nutrients 2021, 13, 1548. https://0-doi-org.brum.beds.ac.uk/10.3390/nu13051548
Abbate M, Mascaró CM, Montemayor S, Barbería-Latasa M, Casares M, Gómez C, Ugarriza L, Tejada S, Abete I, Zulet MÁ, et al. Animal Fat Intake Is Associated with Albuminuria in Patients with Non-Alcoholic Fatty Liver Disease and Metabolic Syndrome. Nutrients. 2021; 13(5):1548. https://0-doi-org.brum.beds.ac.uk/10.3390/nu13051548
Chicago/Turabian StyleAbbate, Manuela, Catalina M. Mascaró, Sofía Montemayor, María Barbería-Latasa, Miguel Casares, Cristina Gómez, Lucia Ugarriza, Silvia Tejada, Itziar Abete, María Ángeles Zulet, and et al. 2021. "Animal Fat Intake Is Associated with Albuminuria in Patients with Non-Alcoholic Fatty Liver Disease and Metabolic Syndrome" Nutrients 13, no. 5: 1548. https://0-doi-org.brum.beds.ac.uk/10.3390/nu13051548