
Assessment of Body Composition in Athletes: A Narrative Review of Available Methods with Special Reference to Quantitative and Qualitative Bioimpedance Analysis

 ,
,  ,
,  and
and
Abstract
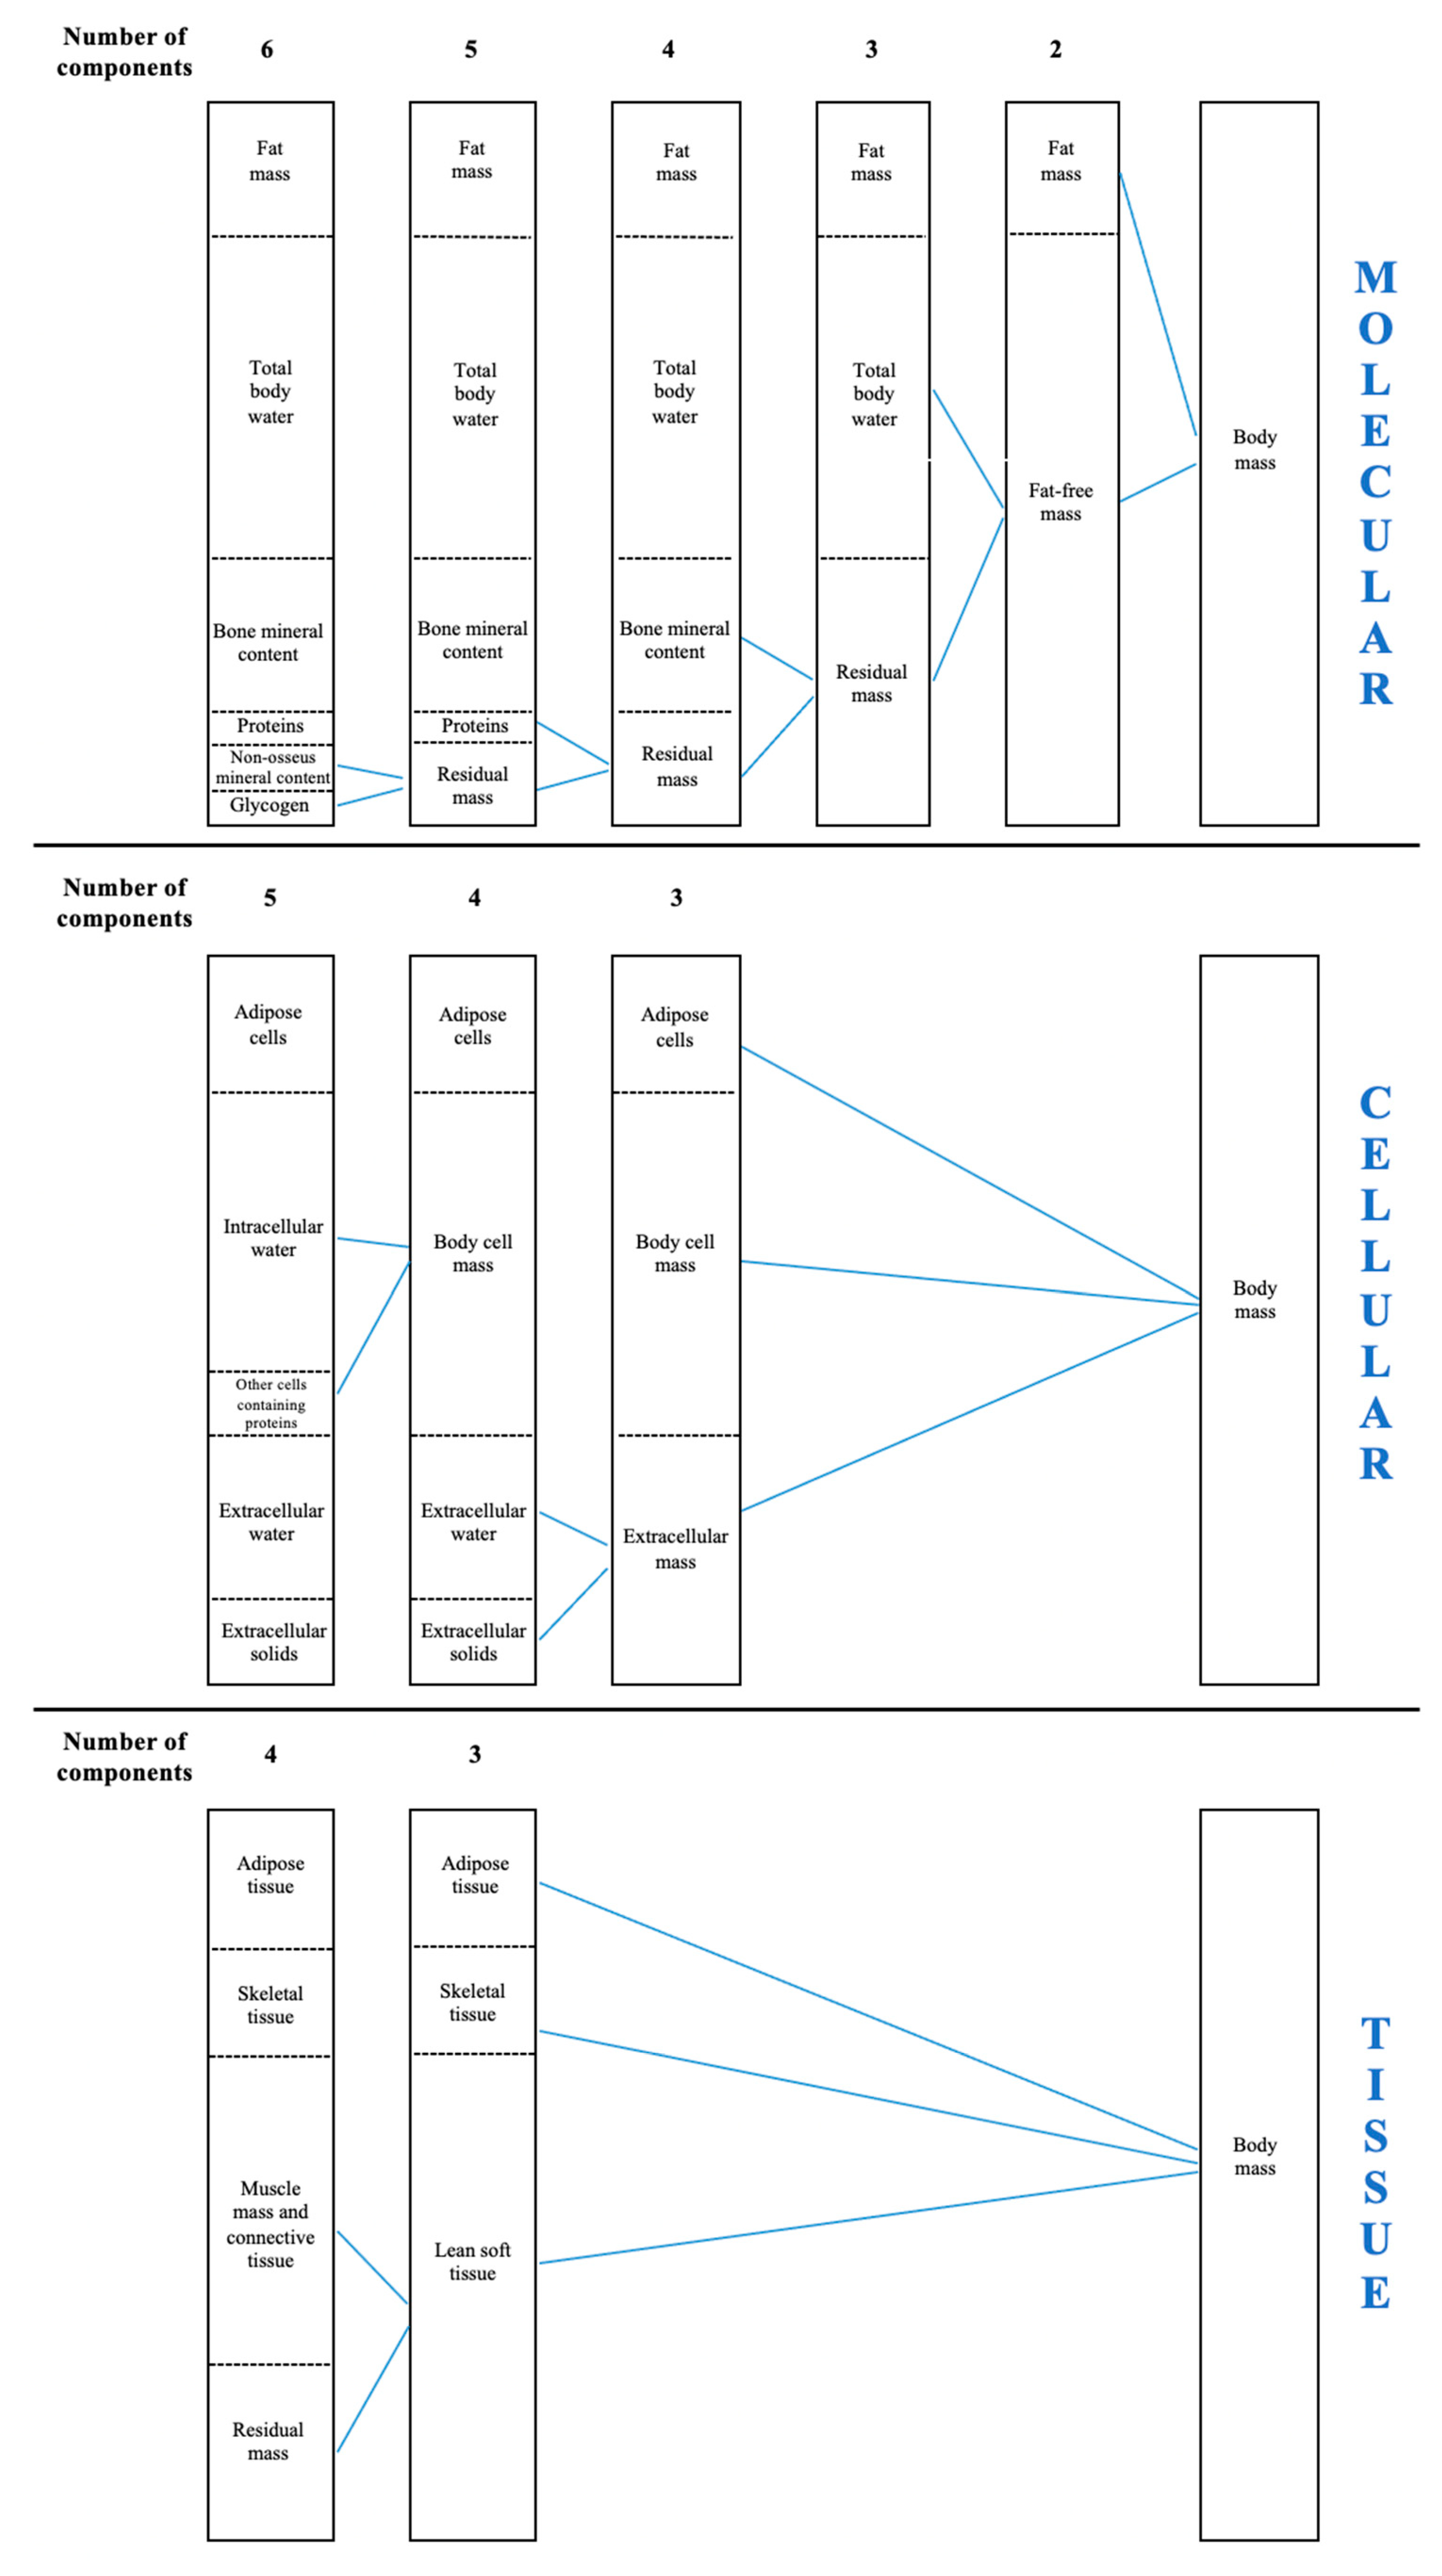
:1. Introduction
2. Aim of Narrative Review
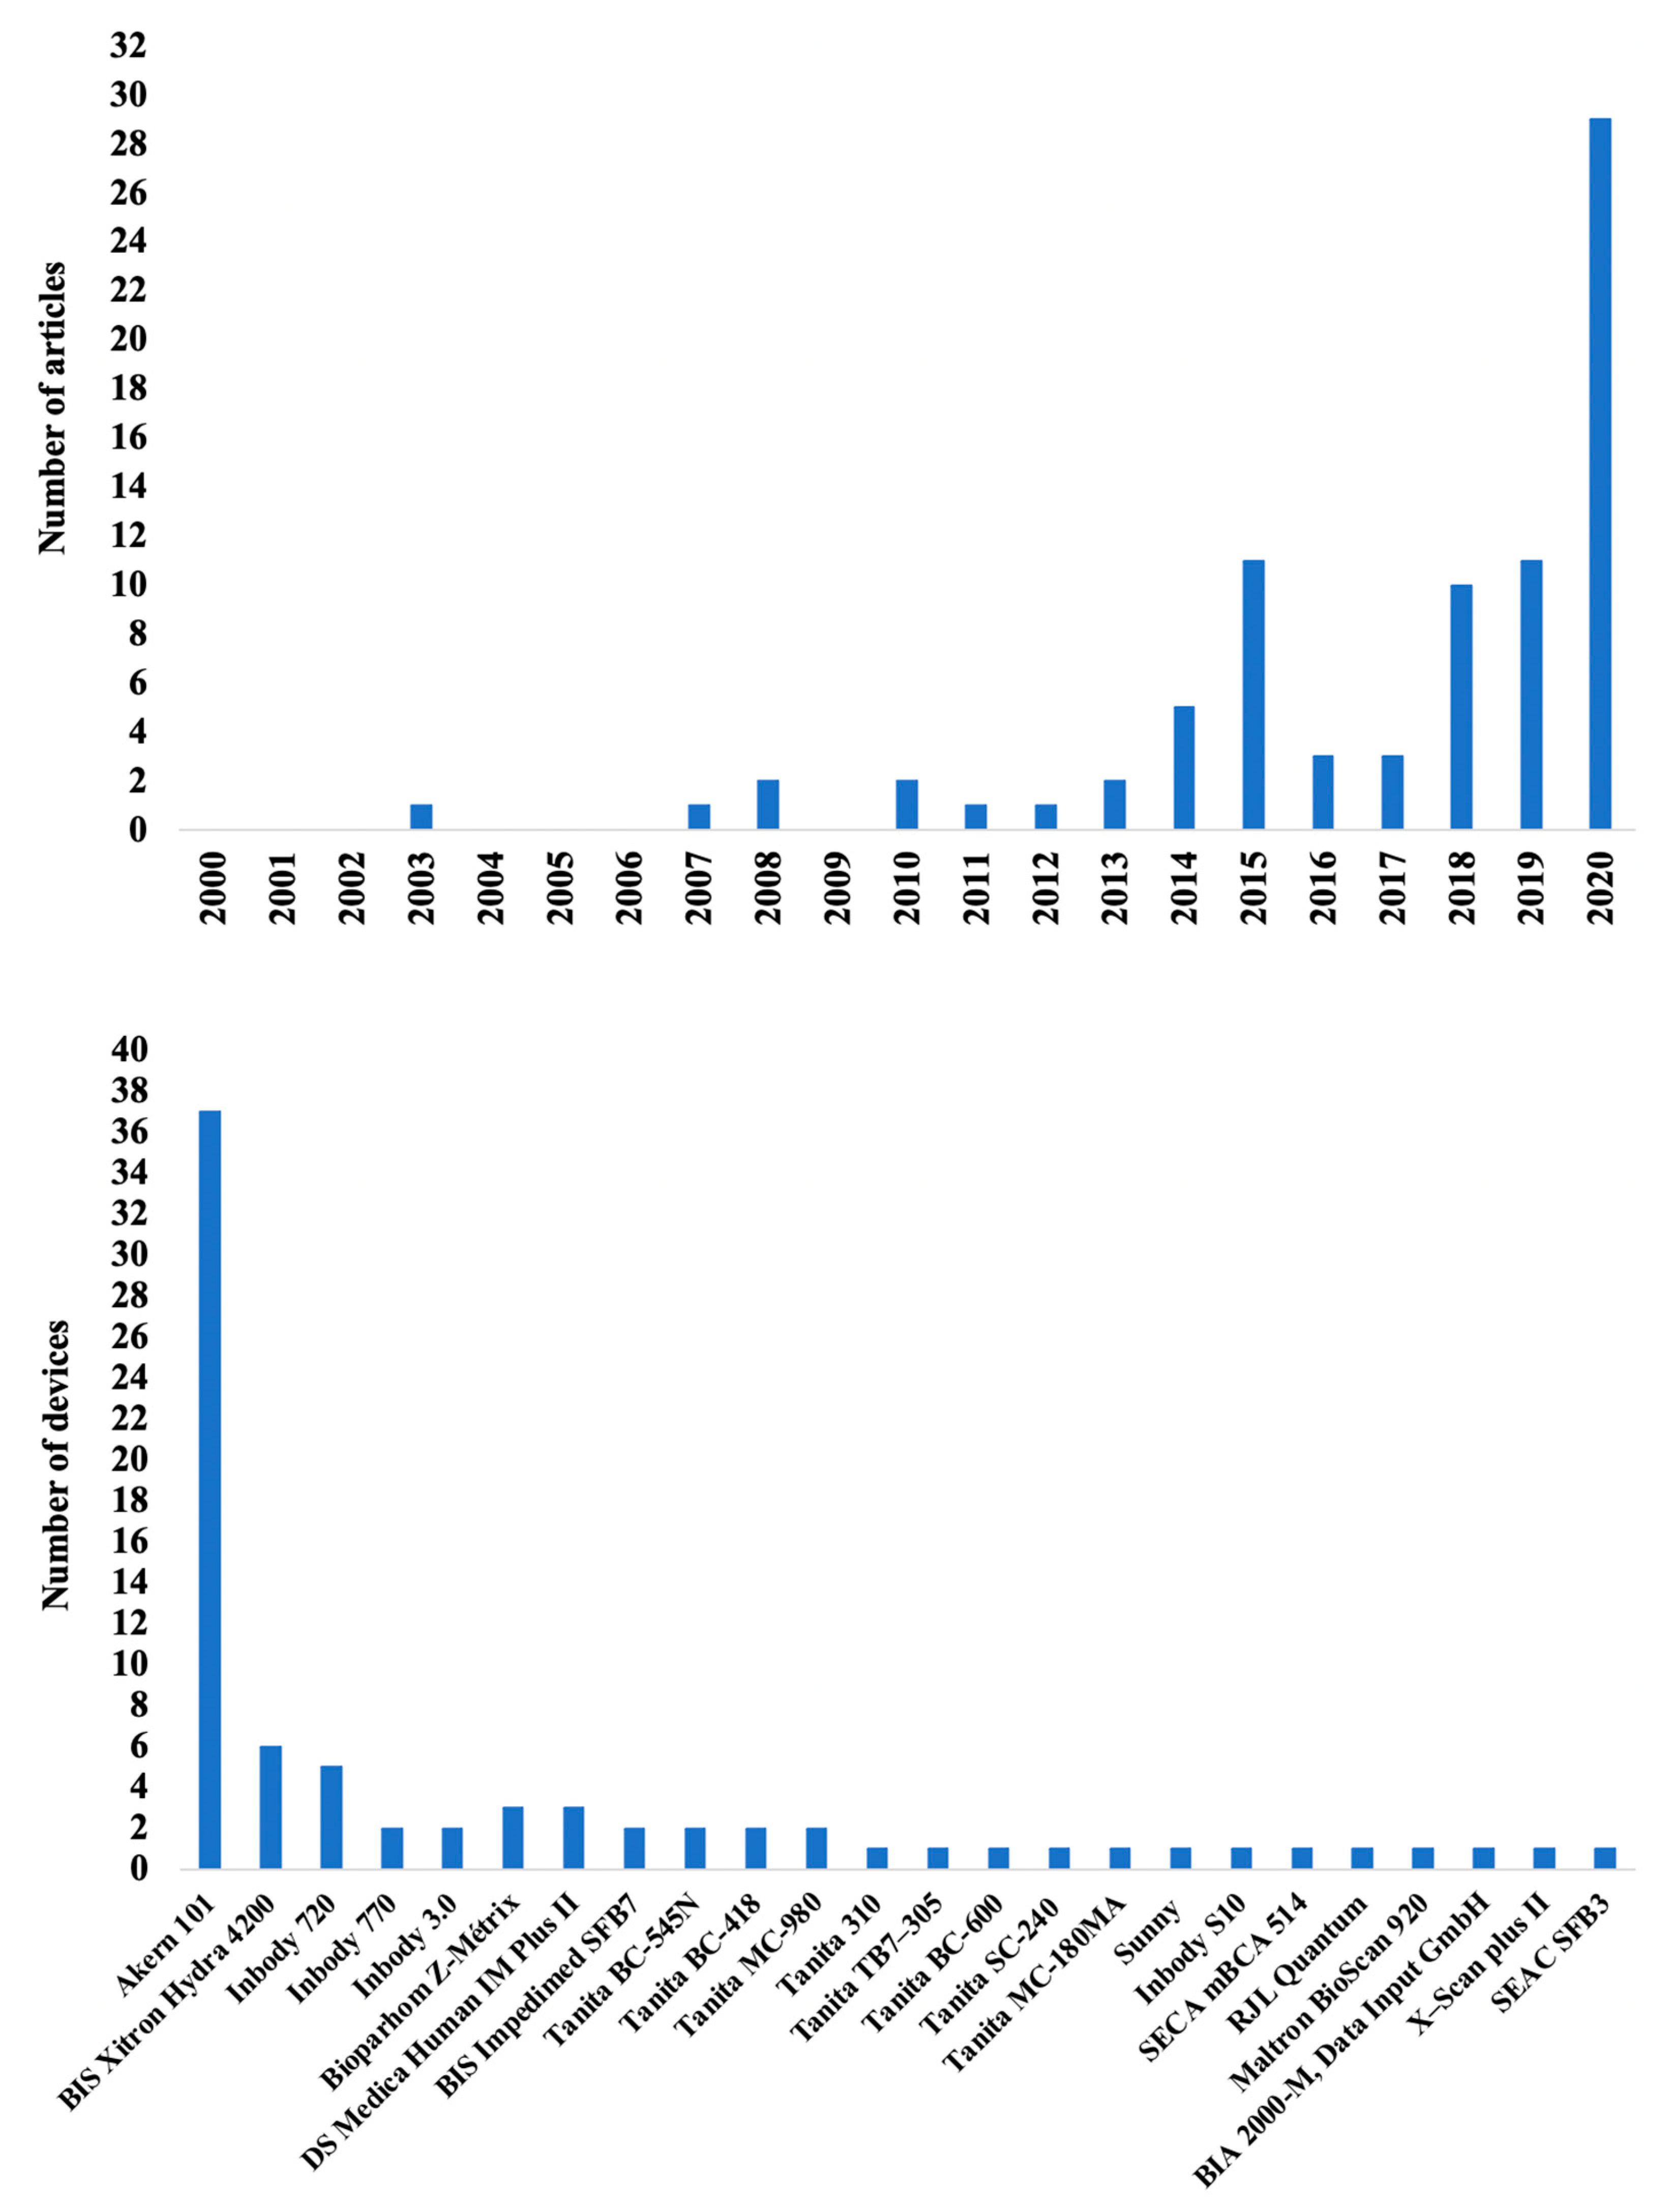
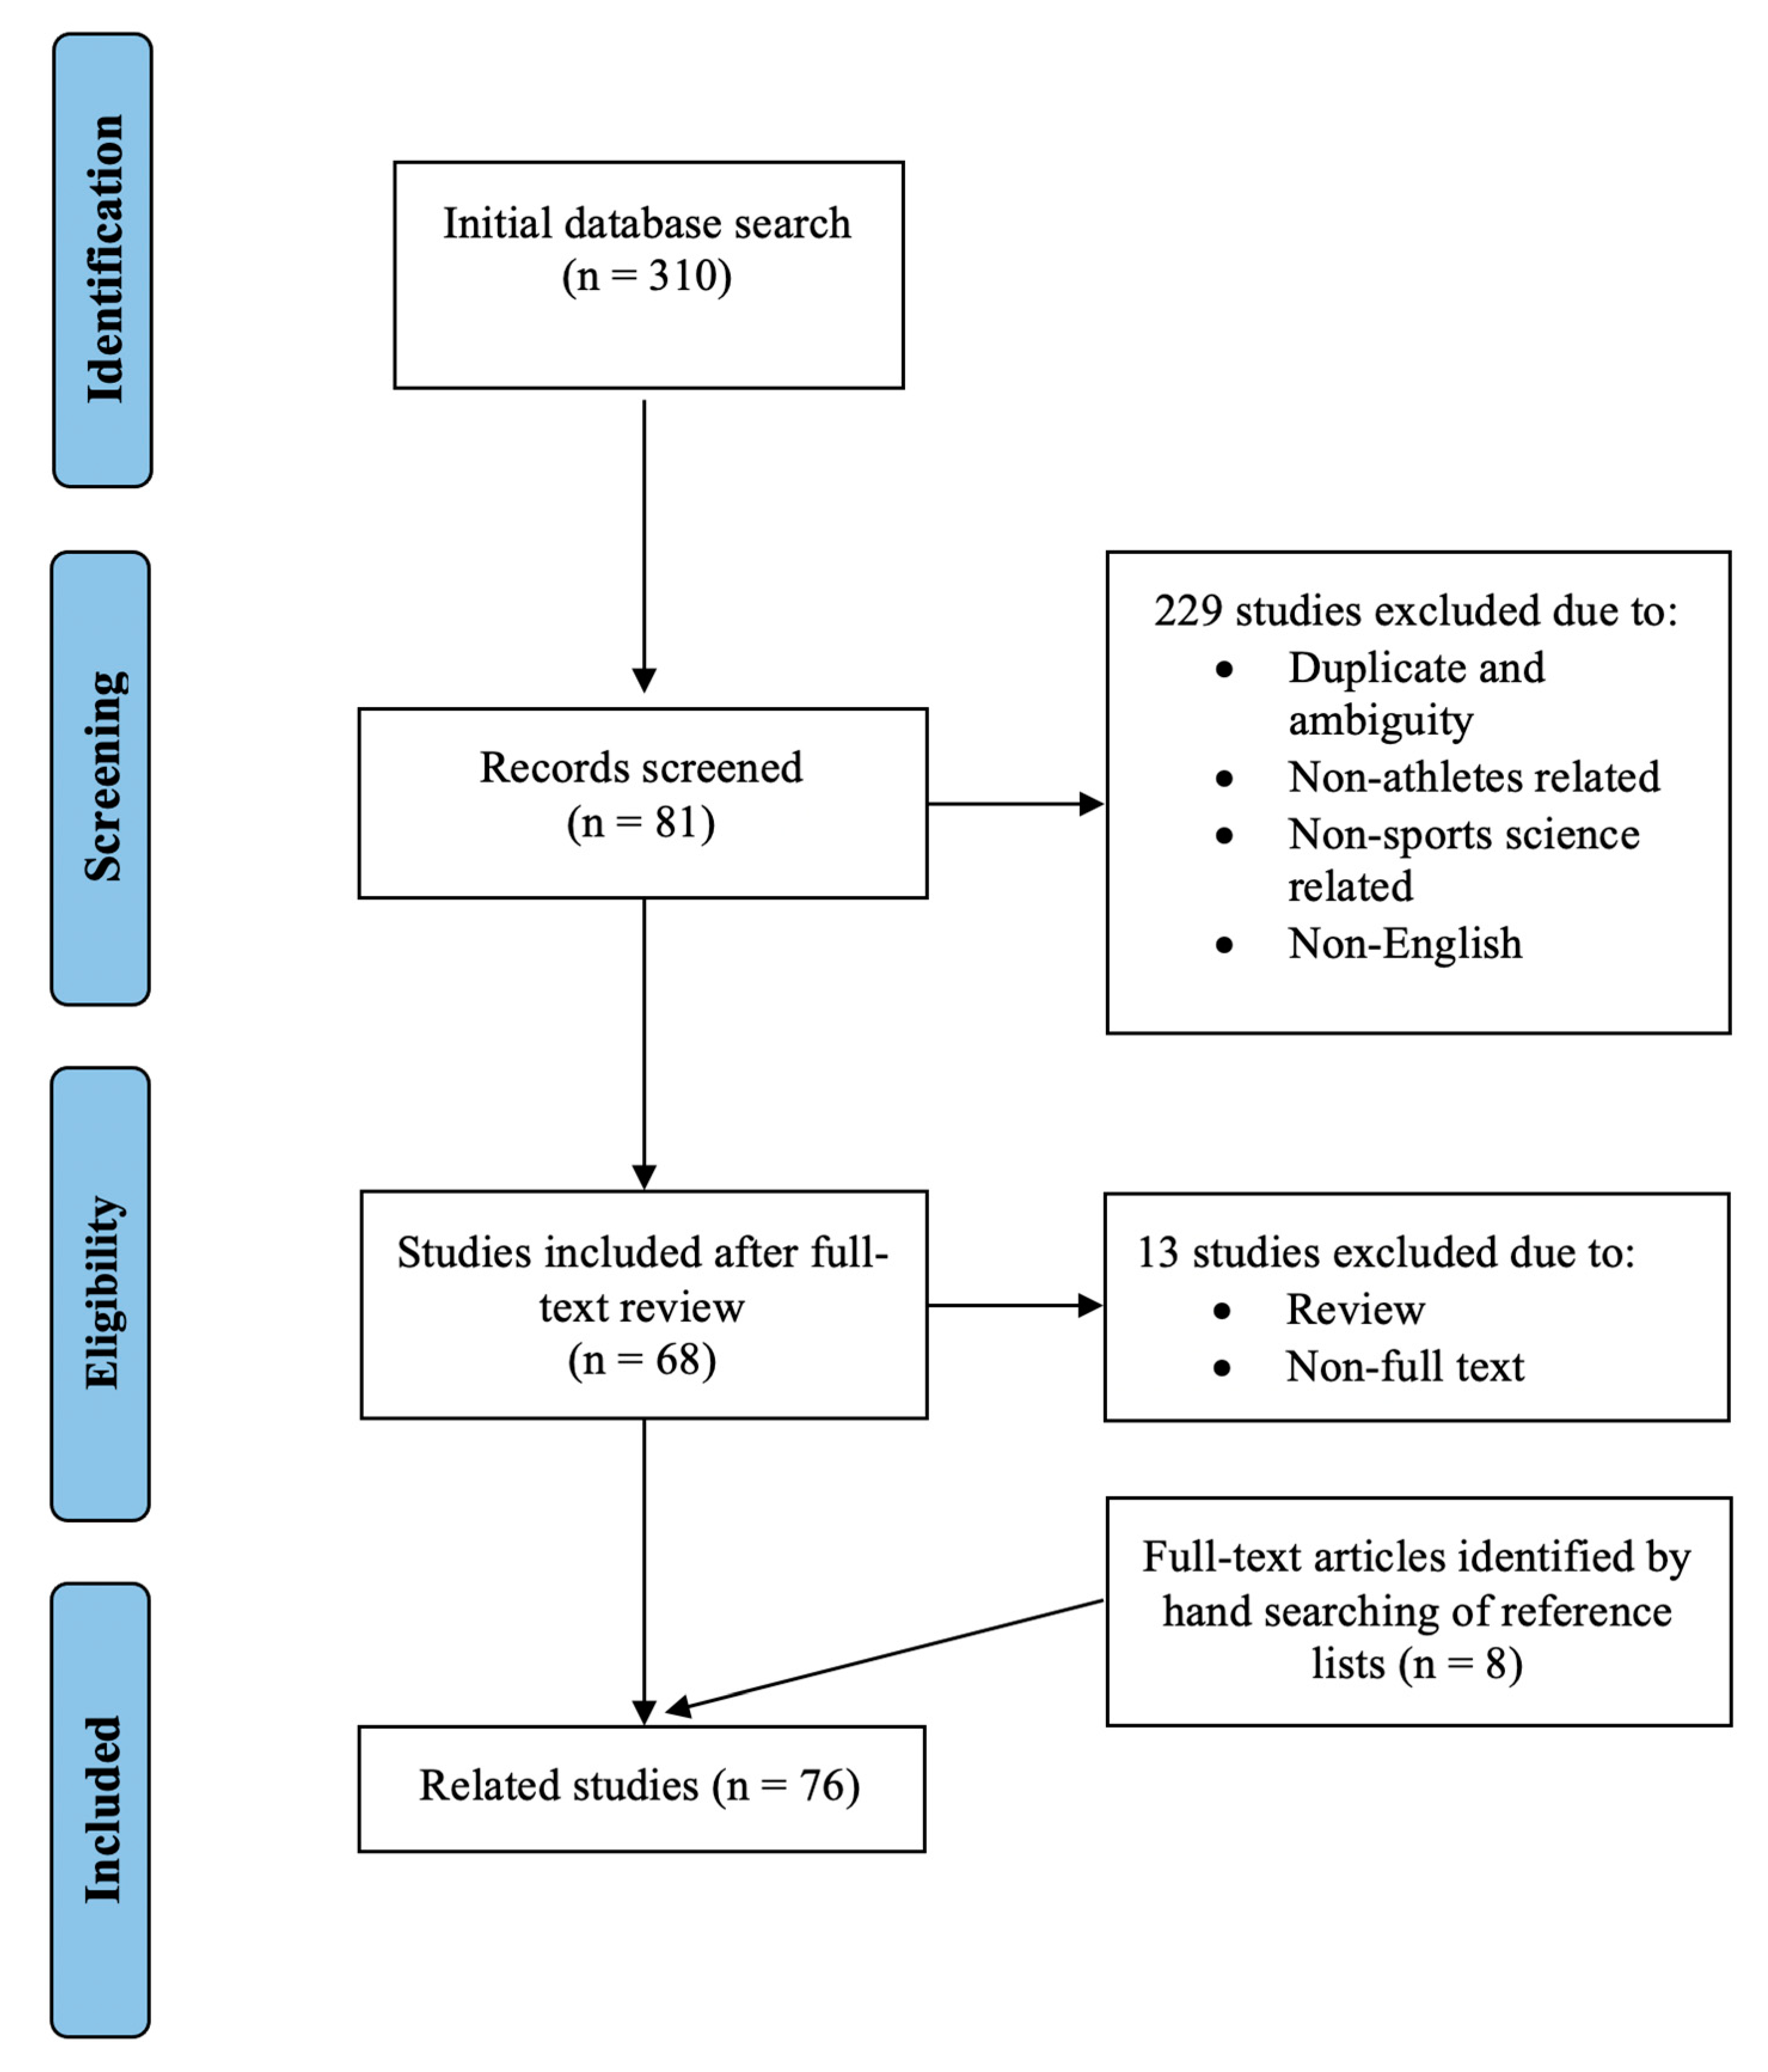
3. Methods
4. Bioelectric Impedance Analysis (BIA) in Athletes
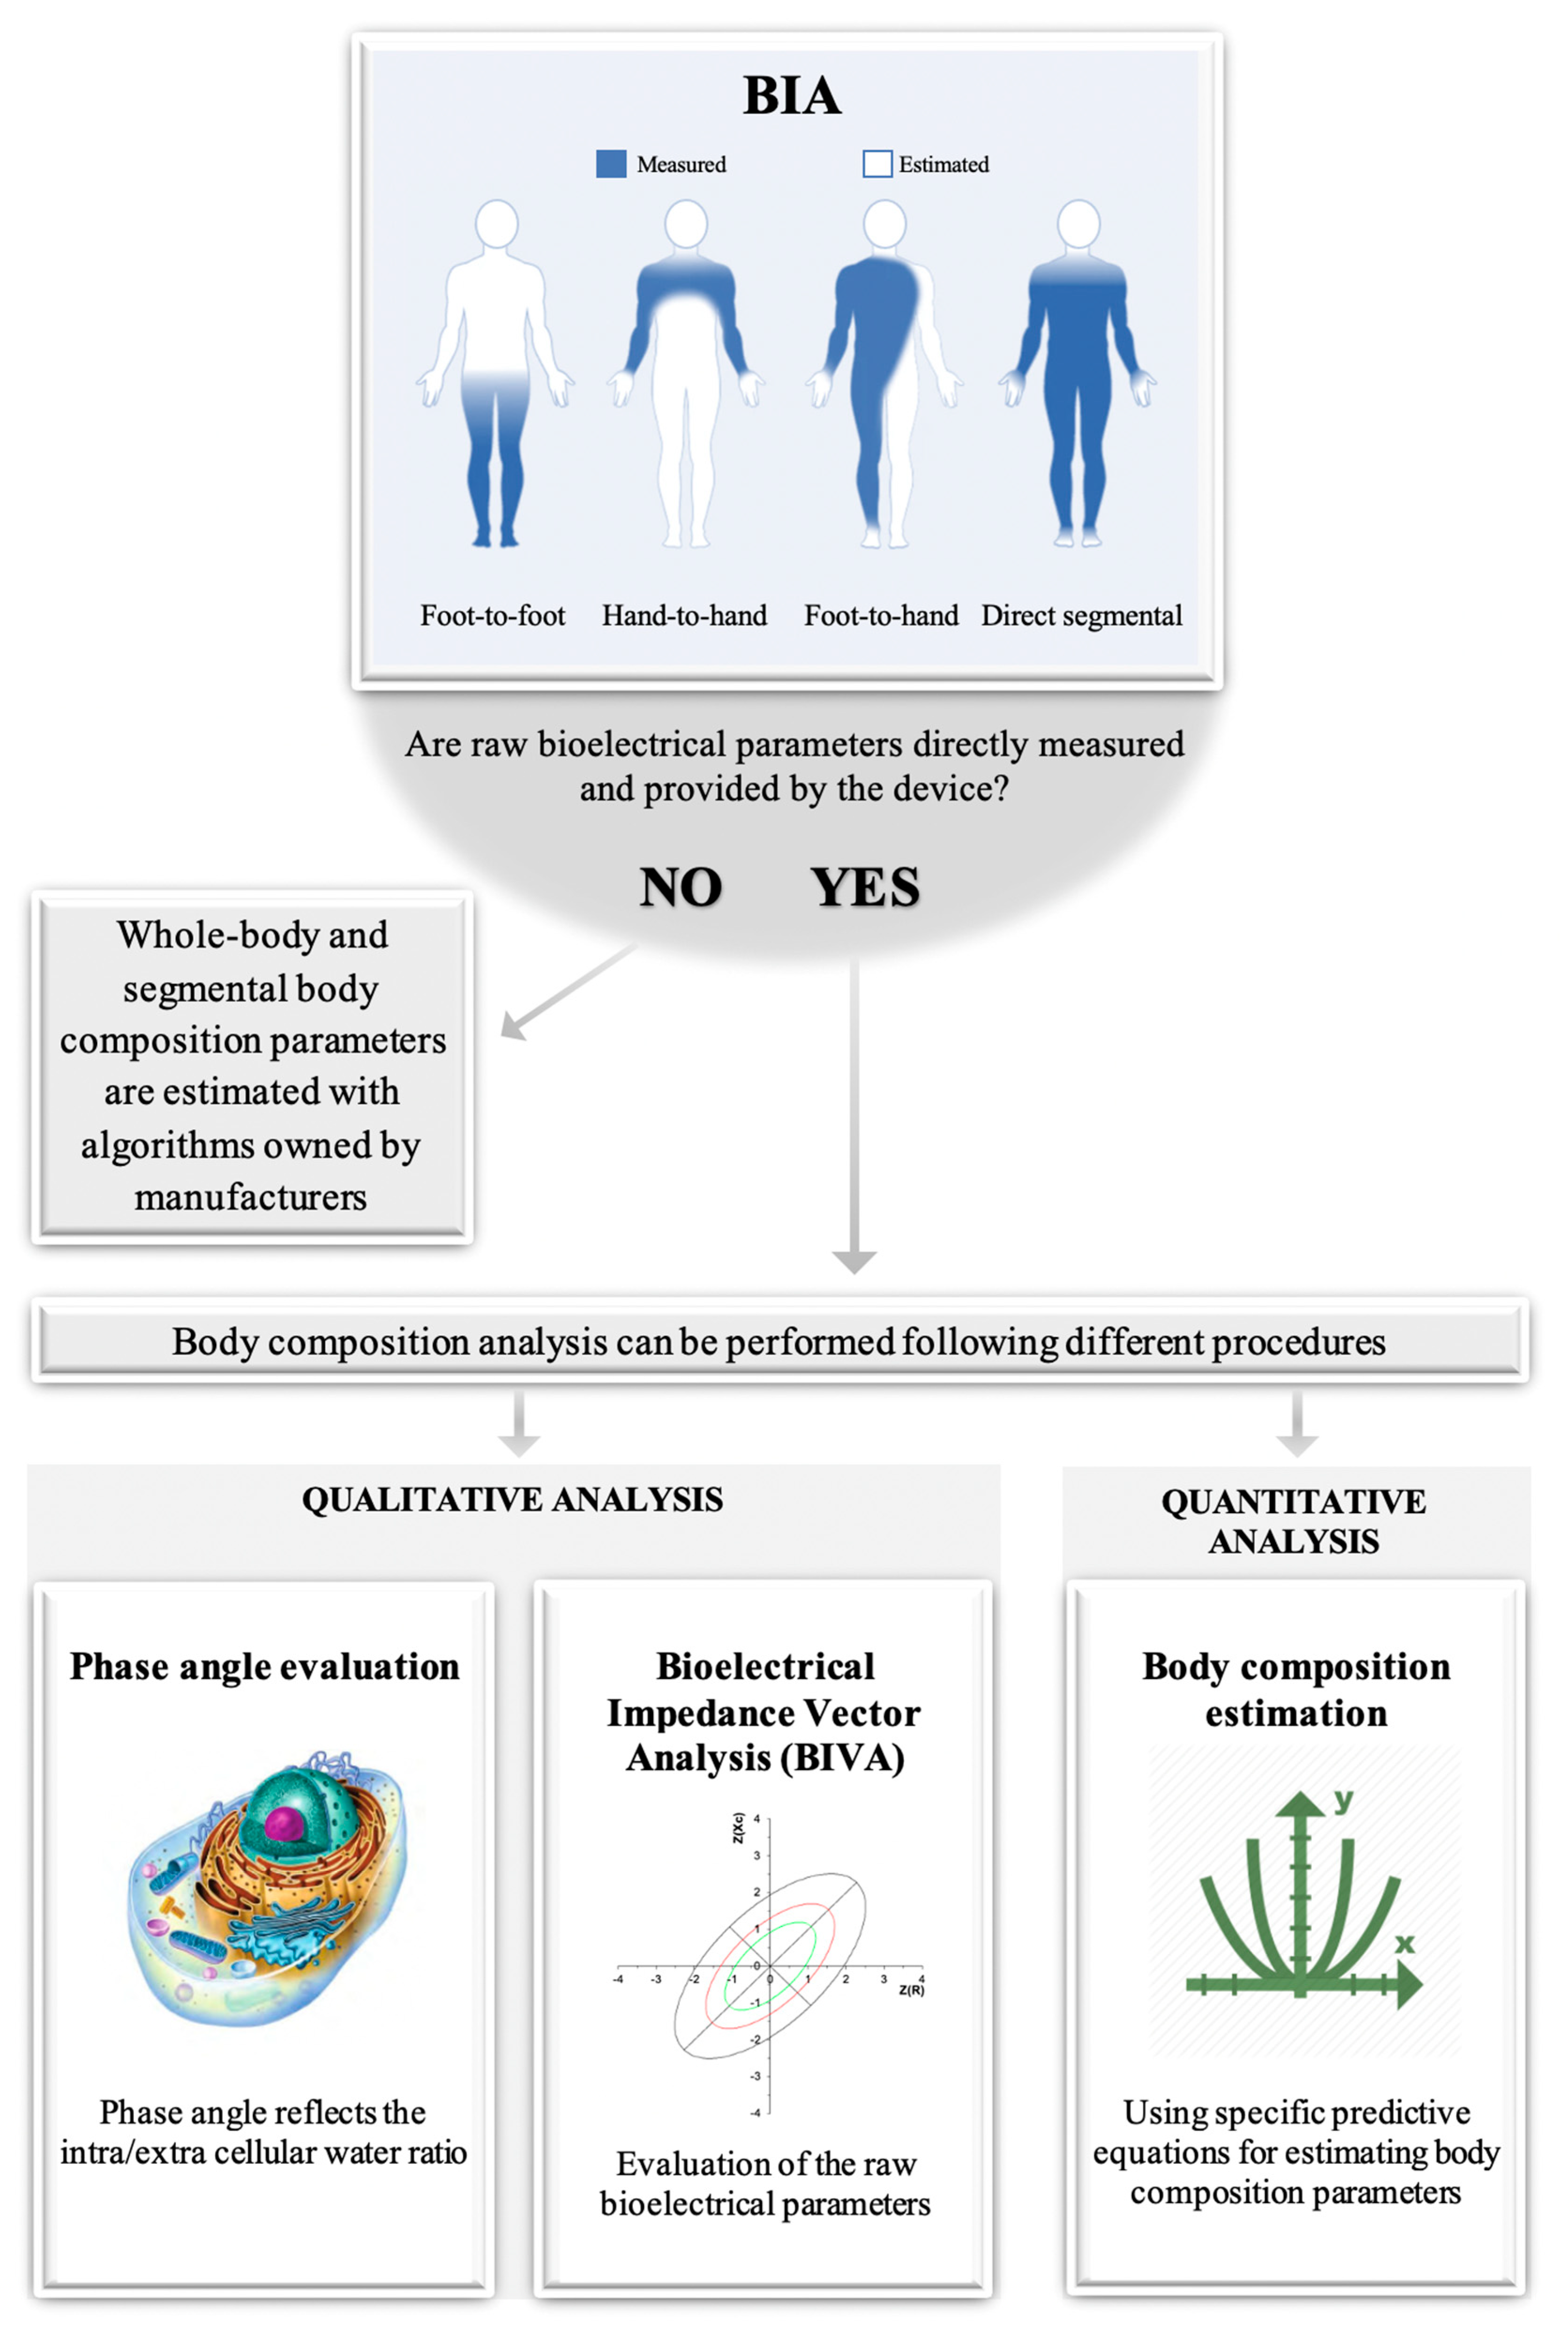
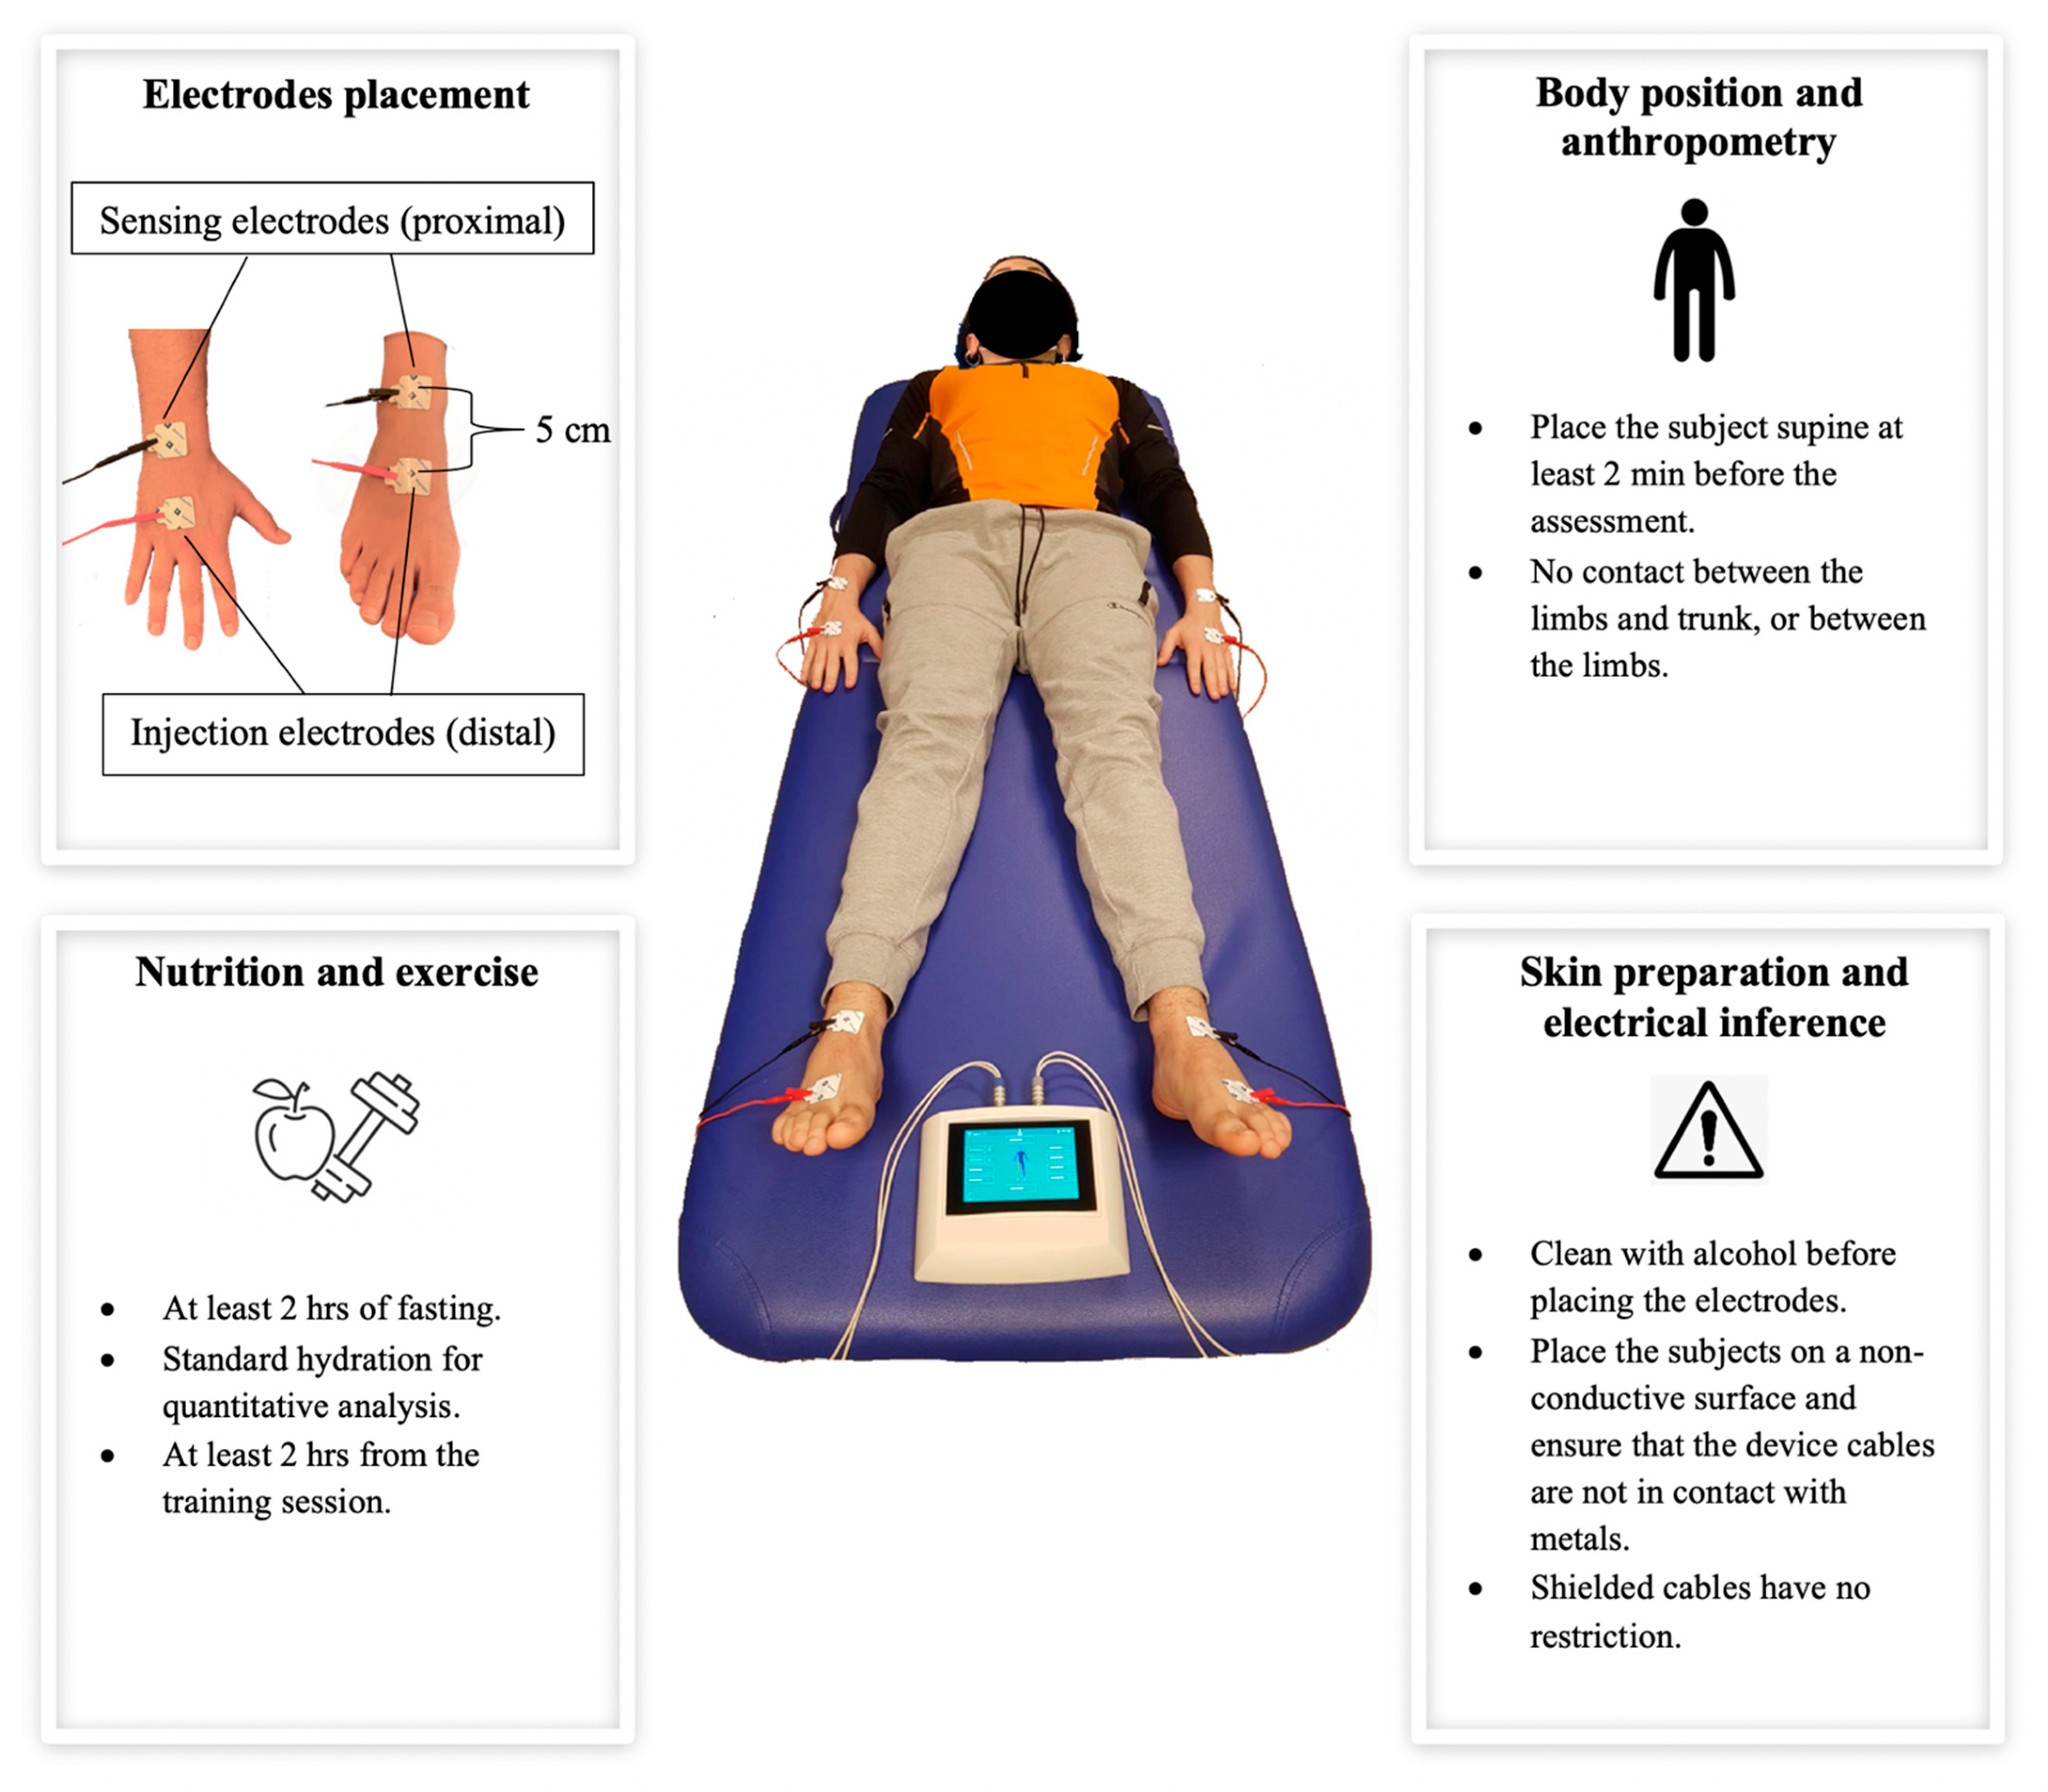
5. BIA Evaluation Procedures
- Device: the frequency, the amperage, and the type of signal measured (i.e., impedance or R or Xc or phase angle) should be reported.
- Electrodes: the type and size of the electrodes supplied by the manufacturer should be reported. The recommended electrode placement is depicted in Figure 4.
- Calibration: an electronic verification module with a tolerance of ±1% to assess the accuracy of the device should be used.
- Anthropometry: the body mass and stature should be reported to the nearest ±0.1 kg and ±0.5 cm, respectively, and measured each time.
- Environment: the measurement should occur at an external temperature ranging from 22.3 °C to 27.7 °C (72.1 °F to 81.9 °F).
- Time of measurement: cross-sectional between-subject assessment should be performed within the same competitive period for each athlete. Circadian rhythms should be taken into account; thus, longitudinal within-subject measurements should be performed at the same time of the day.
- Menstrual cycle: the phase of the menstrual cycle should be specified, and both within- and between-subject body composition assessments in women should be performed in the same phase of the menstrual cycle.
- Body composition assessment: validated regression equations and BIVA tolerance ellipses for athletes should be used. Additionally, both regression equations and BIVA tolerance ellipses should refer to the frequency used to validate them.
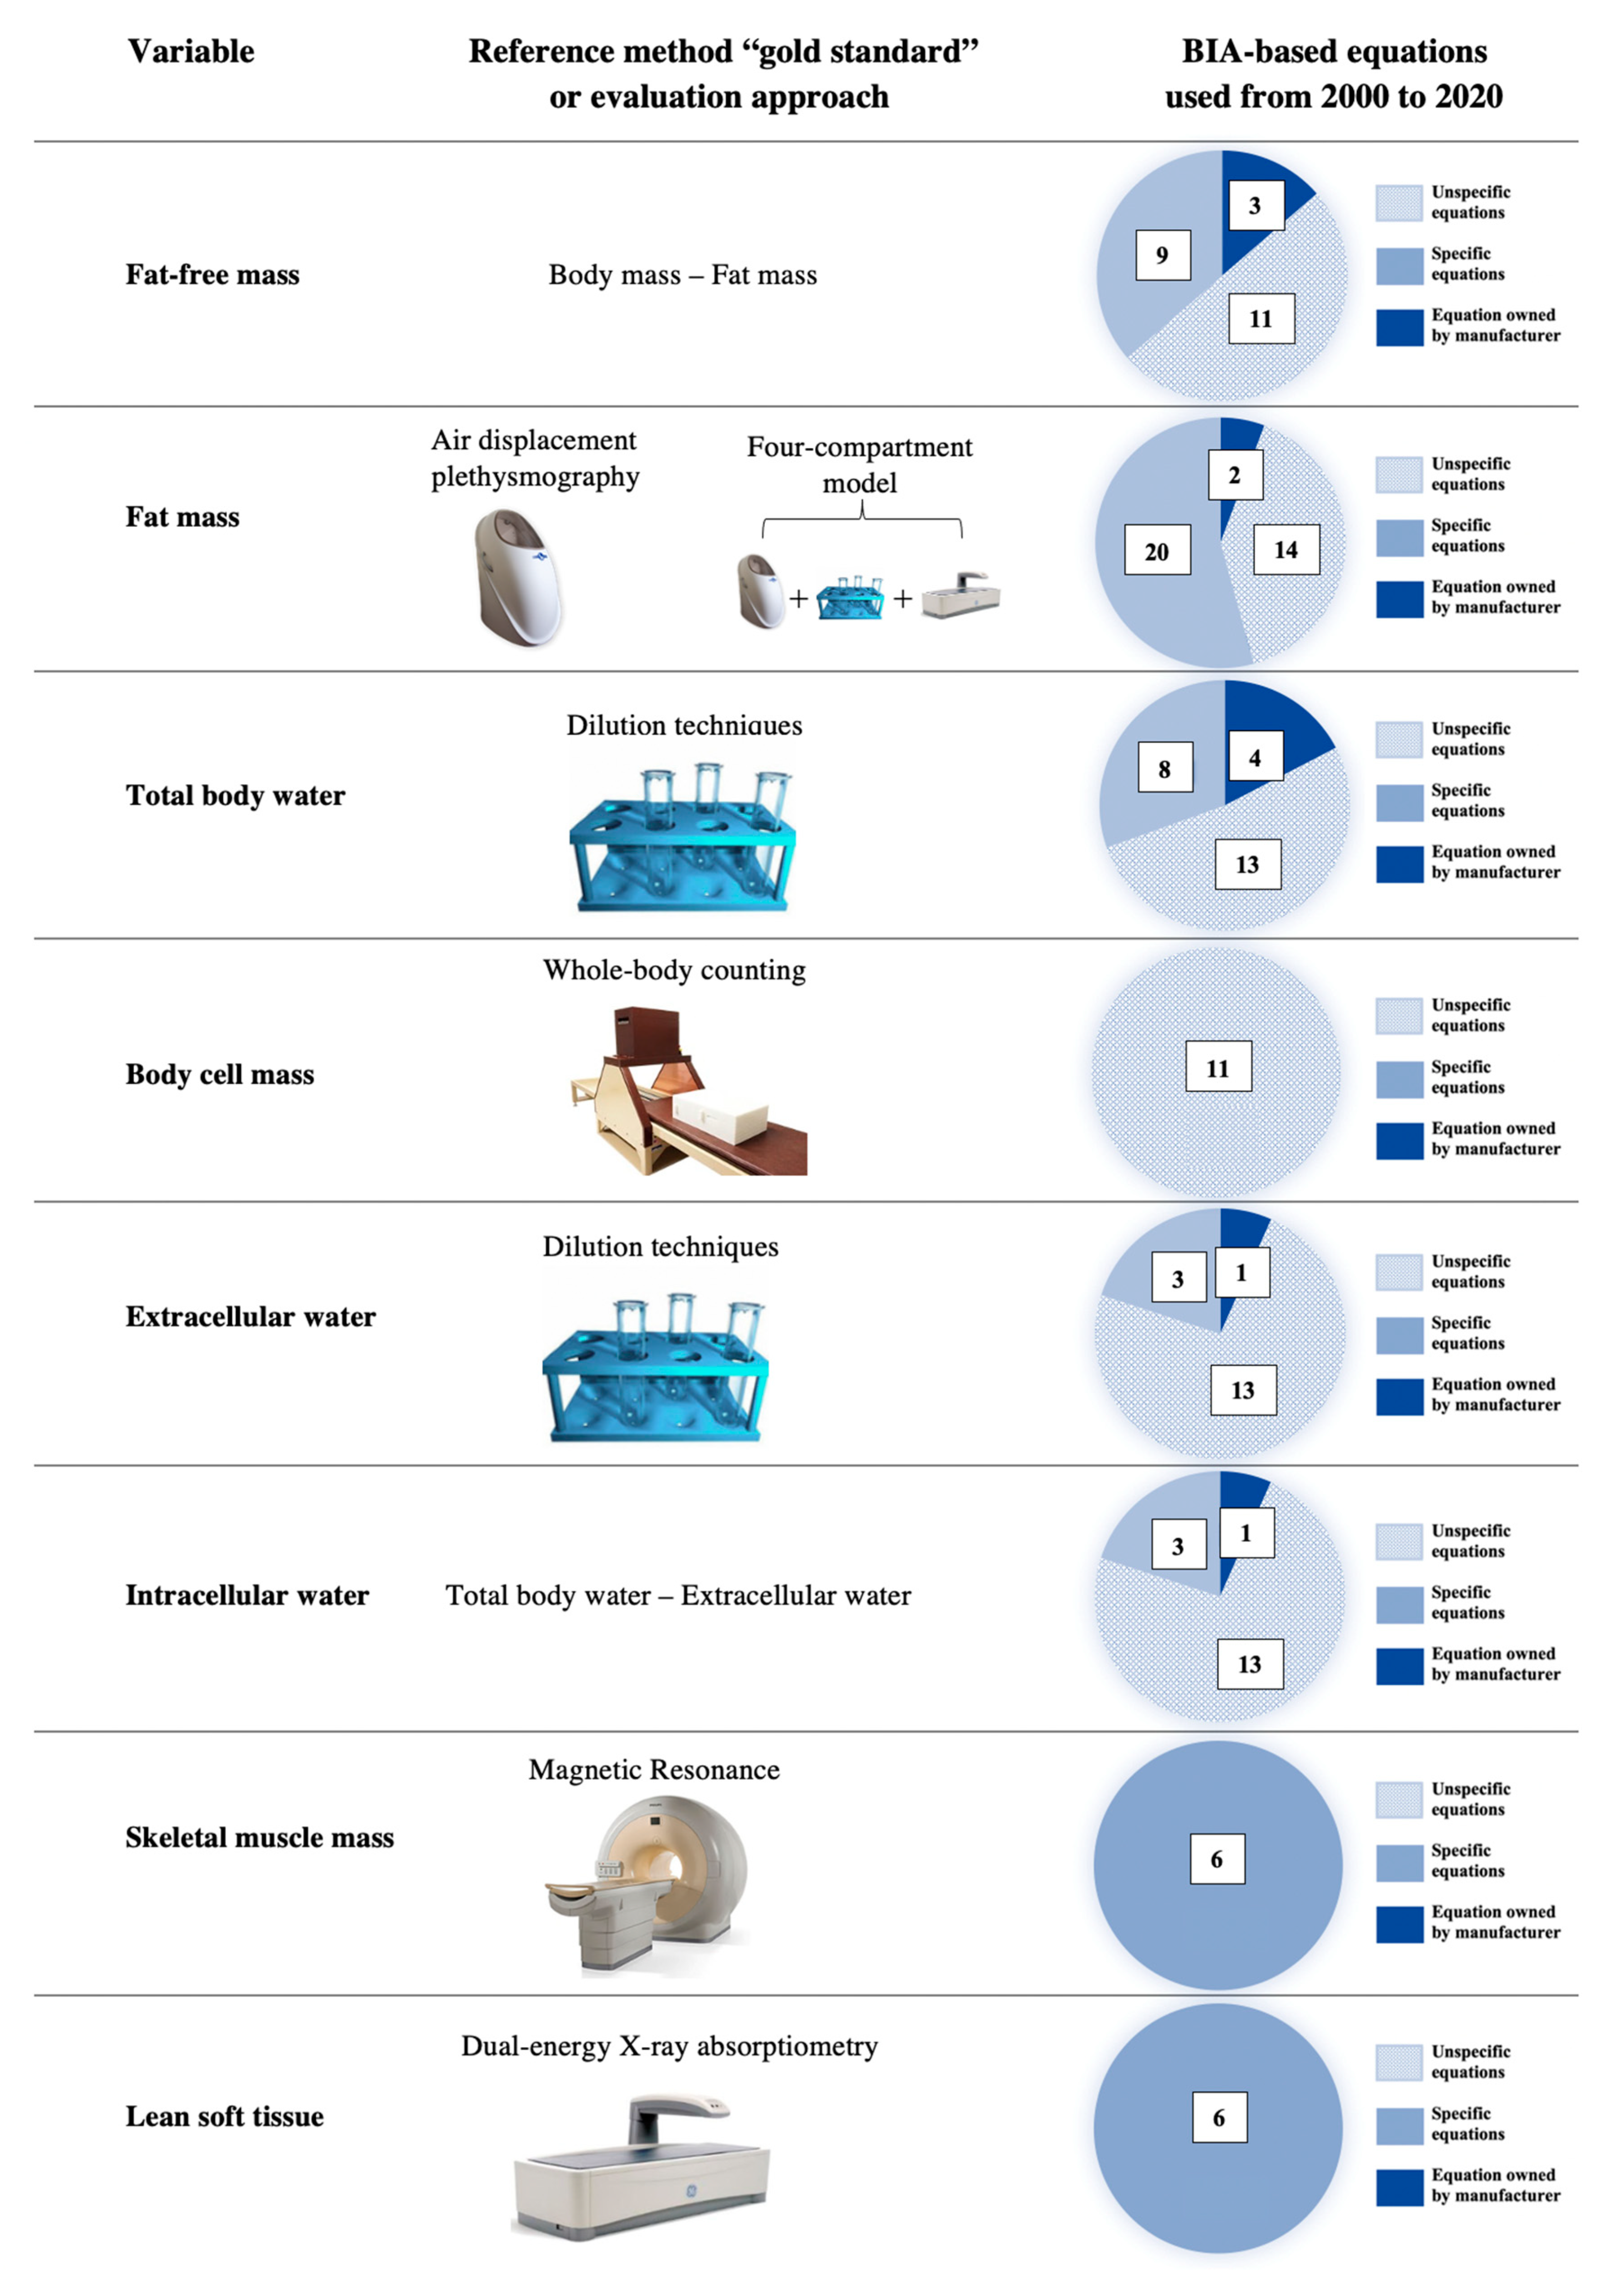
6. Quantitative Analysis: Estimation of Body Composition Variables through Predictive Equations
7. Qualitative Analysis: Interpretation of the Raw Bioimpedance Parameters
7.1. Bioelectrical Phase Angle and Localized Bioimpedance Analysis (L-BIA)
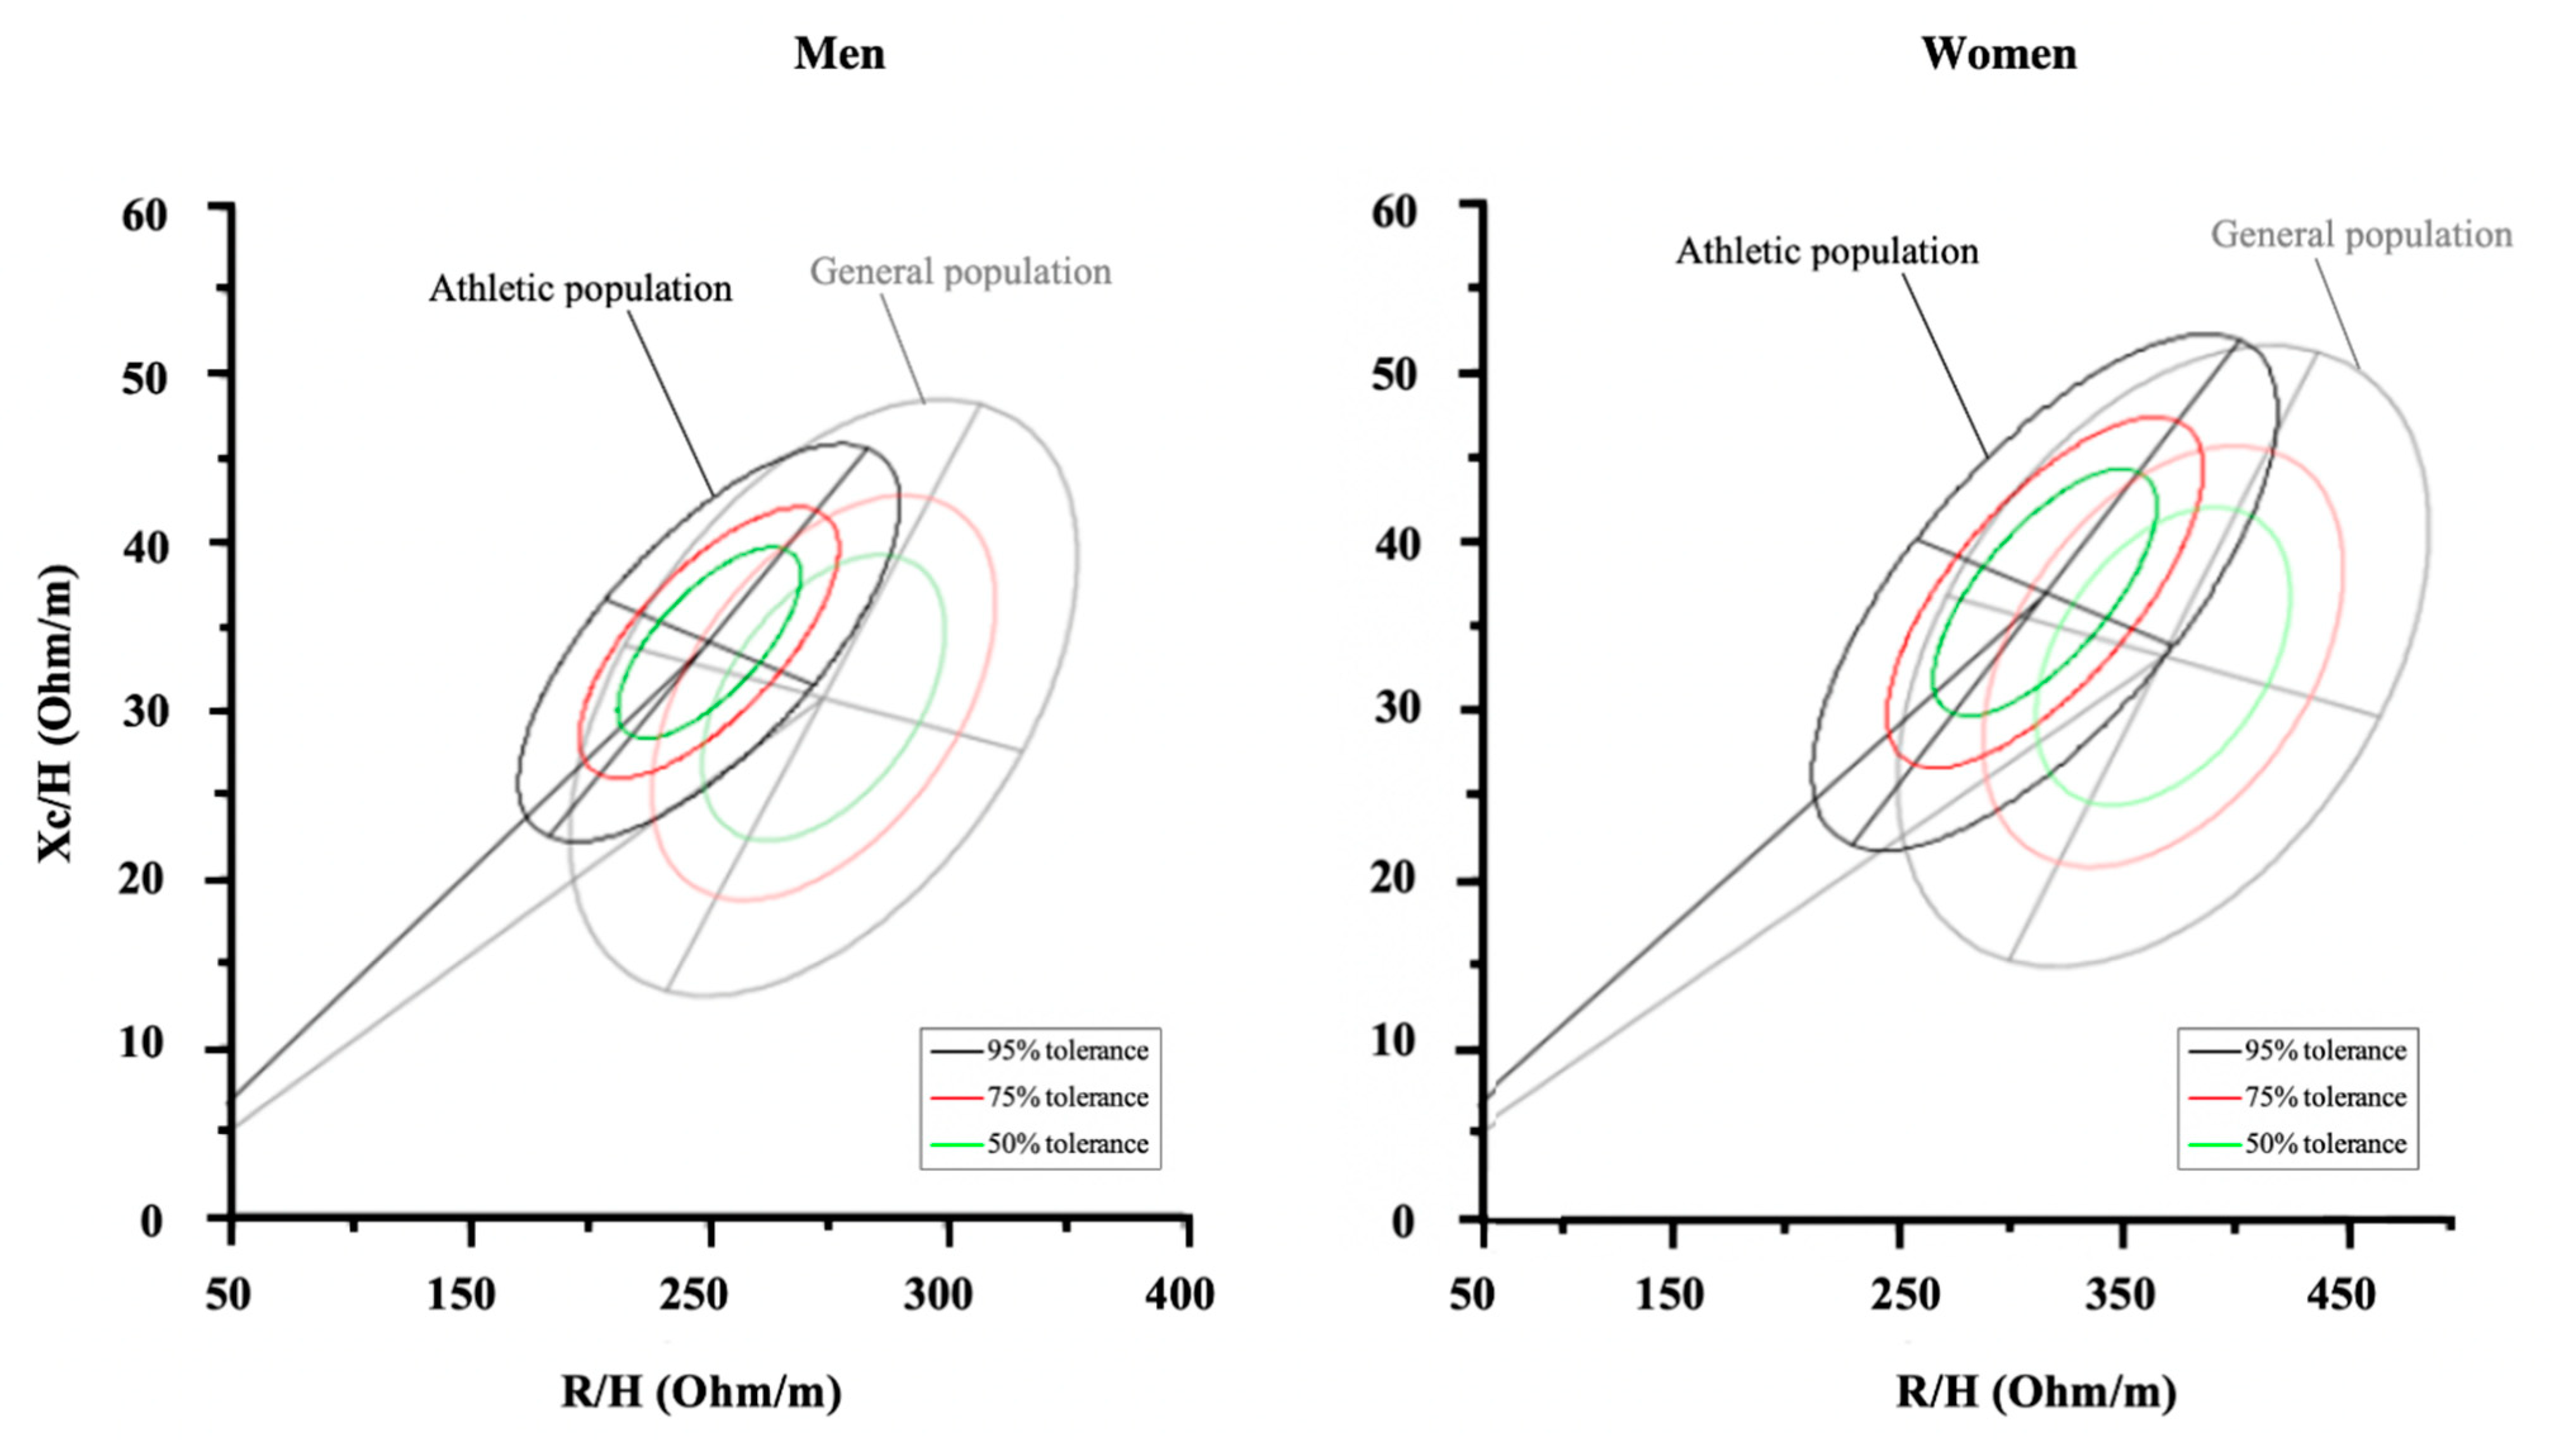
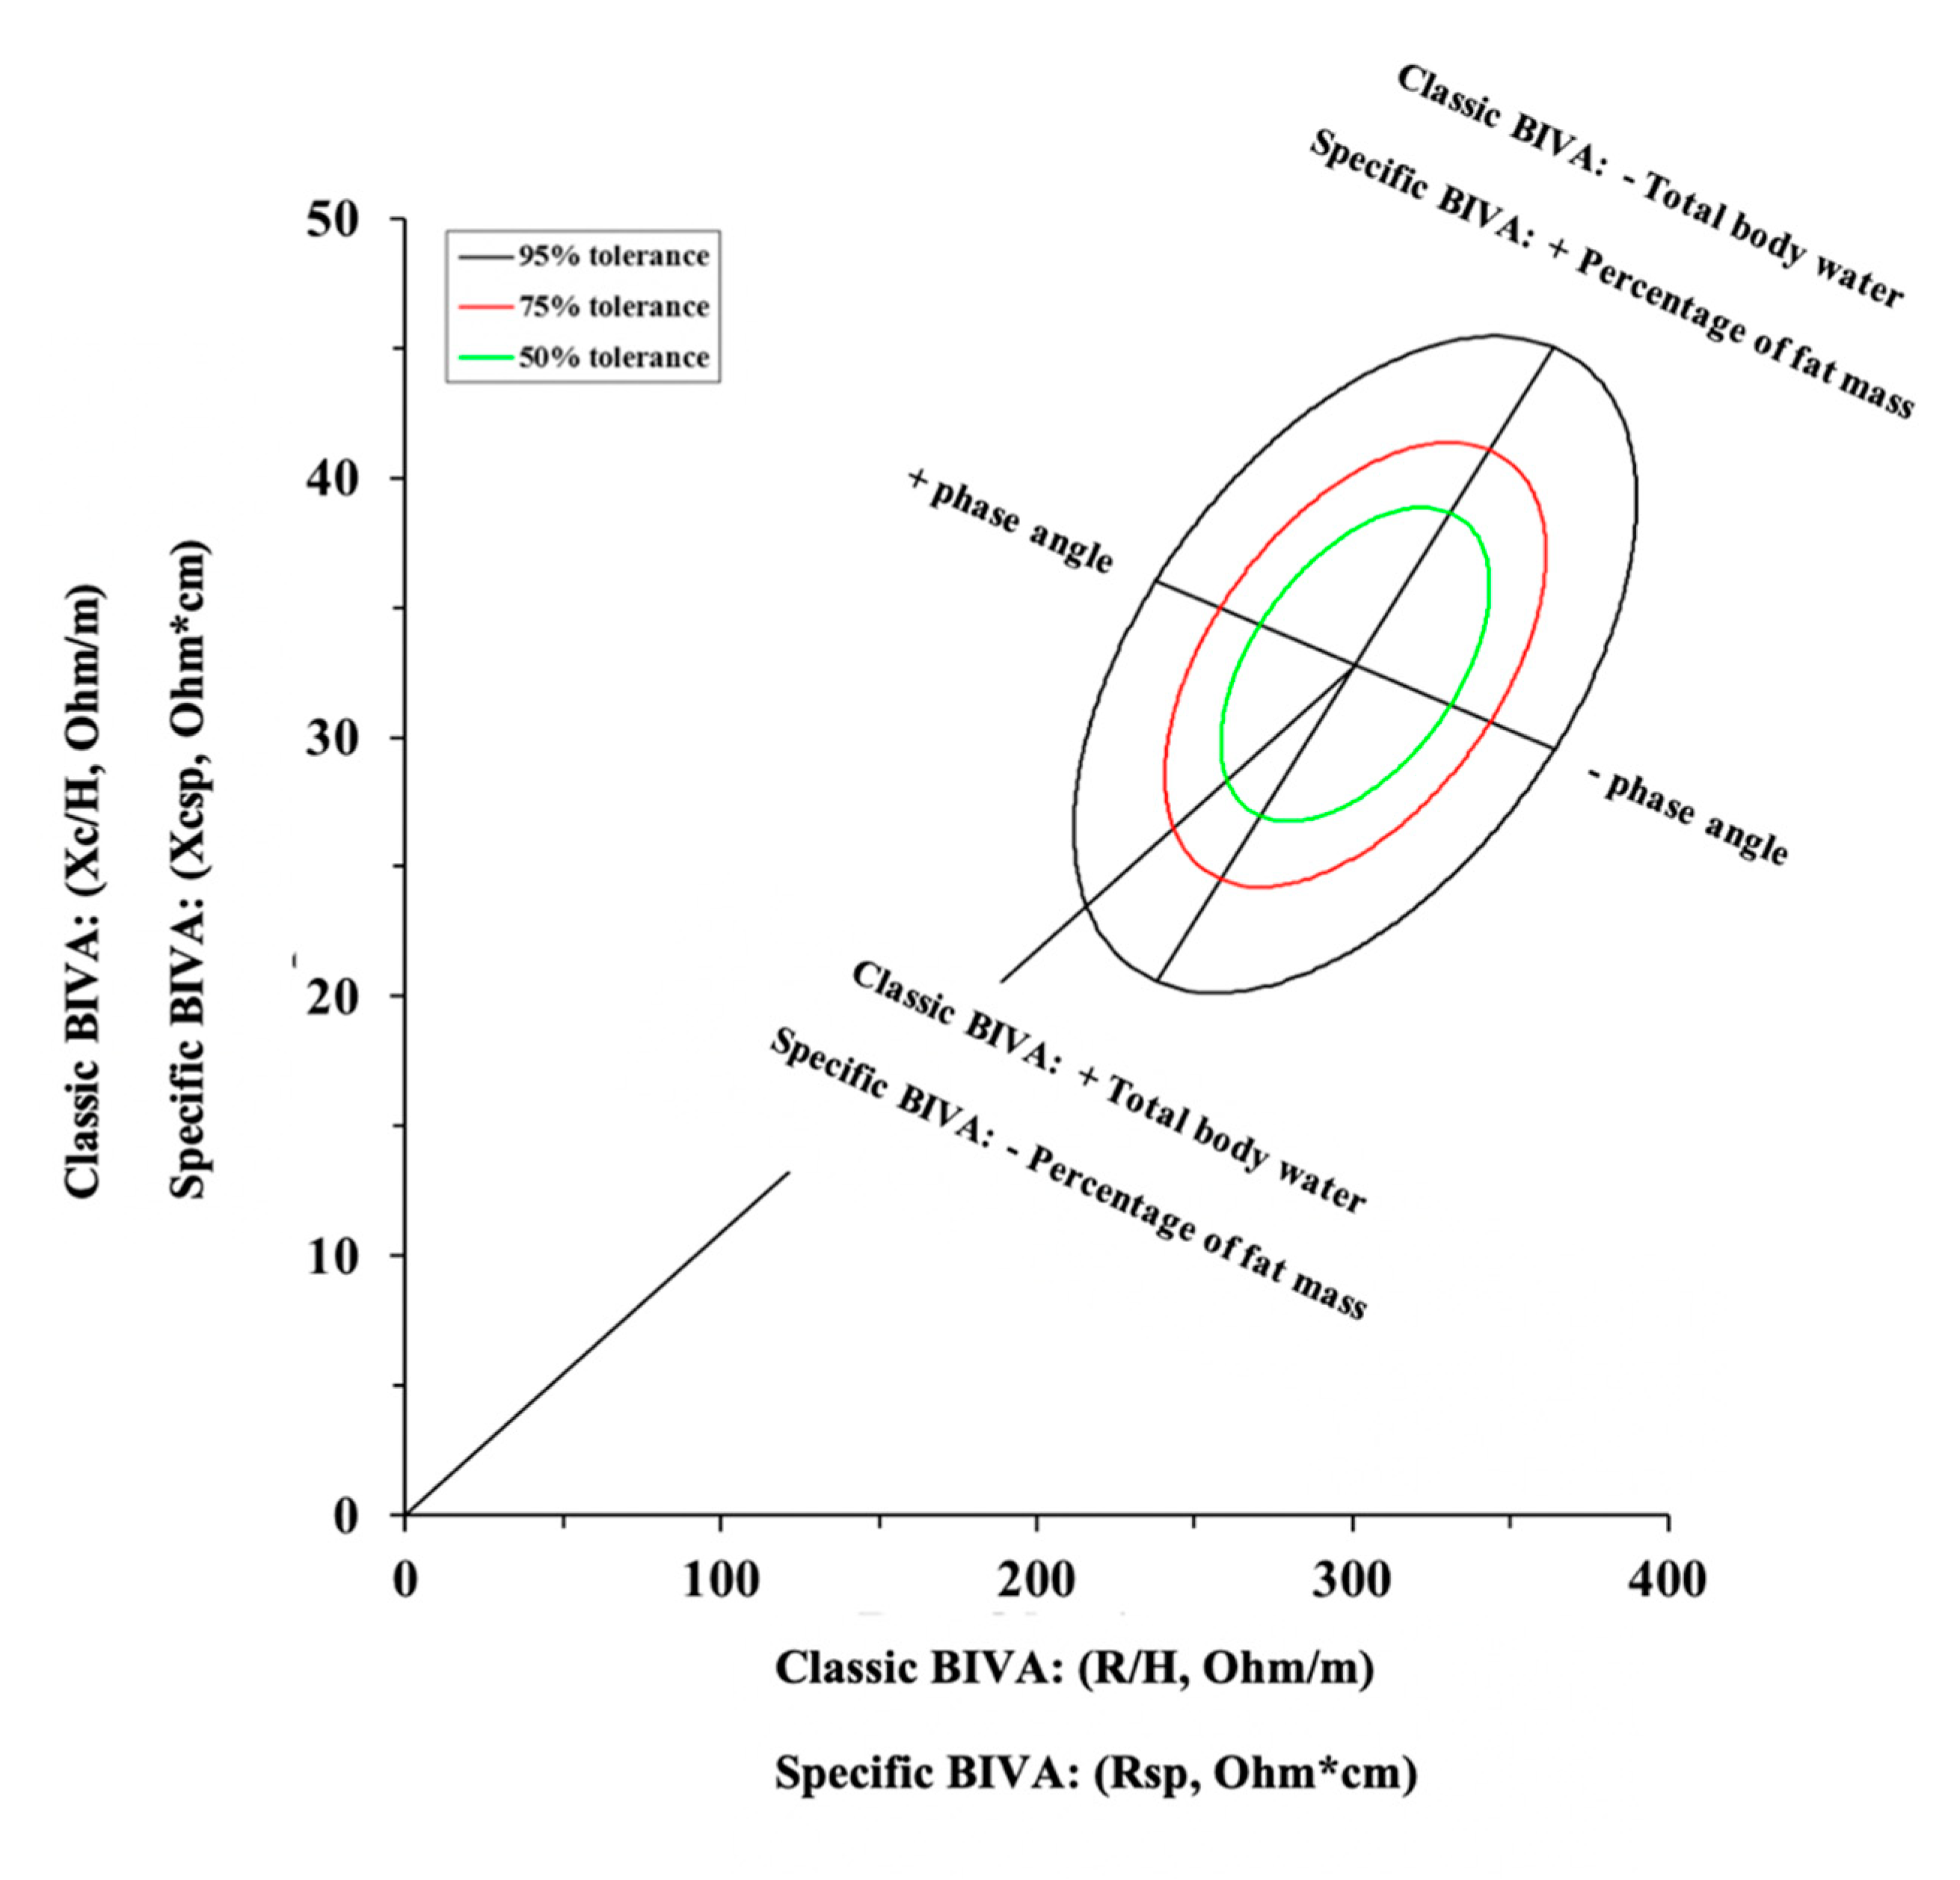
7.2. Bioelectrical Impedance Vector Analysis (BIVA)
8. Quantitative and Qualitative Analysis for Assessing Hydration and Nutritional Status
9. Conclusions
Supplementary Materials
Author Contributions
Funding
Institutional Review Board Statement
Informed Consent Statement
Data Availability Statement
Acknowledgments
Conflicts of Interest
Appendix A

References
- Ackland, T.R.; Lohman, T.G.; Sundgot-Borgen, J.; Maughan, R.J.; Meyer, N.L.; Stewart, A.D.; Müller, W. Current status of body composition assessment in sport: Review and position statement on behalf of the ad hoc research working group on body composition health and performance, under the auspices of the I.O.C. Medical Commission. Sports Med. 2012, 42, 227–249. [Google Scholar] [CrossRef]
- Bacciotti, S.; Baxter-Jones, A.; Gaya, A.; Maia, J. The Physique of Elite Female Artistic Gymnasts: A Systematic Review. J. Hum. Kinet. 2017, 58, 247–259. [Google Scholar] [CrossRef] [Green Version]
- Franchini, E.; Brito, C.J.; Artioli, G.G. Weight loss in combat sports: Physiological, psychological and performance effects. J. Int. Soc. Sports Nutr. 2012, 9, 52. [Google Scholar] [CrossRef] [PubMed] [Green Version]
- Sundgot-Borgen, J.; Torstveit, M.K. Aspects of disordered eating continuum in elite high-intensity sports. Scand. J. Med. Sci. Sports 2010, 20 (Suppl. 2), 112–121. [Google Scholar] [CrossRef]
- Saltzman, E.; Mogensen, K.M. Physical and clinical assessment of nutrition status. In Nutrition in the Prevention and Treatment of Disease; Elsevier Inc.: Amsterdam, The Netherlands, 2013; pp. 65–79. ISBN 9780123918840. [Google Scholar]
- Wang, Z.M.; Pierson, R.N.; Heymsfield, S.B. The five-level model: A new approach to organizing body-composition research. Am. J. Clin. Nutr. 1992. [Google Scholar] [CrossRef]
- Heymsfield, S.; Lohman, T.; Wang, Z.; Going, S. Human Body Composition, 2nd ed.; Human Kinetics: Leeds in Champaign, IL, USA, 2005. [Google Scholar]
- Silva, A.M. Structural and functional body components in athletic health and performance phenotypes. Eur. J. Clin. Nutr. 2019, 73, 215–224. [Google Scholar] [CrossRef]
- Heymsfield, B.S.; Wang, Z.; Baumgartner, R.N.; Ross, R. Human Body Composition: Advances in Models and Methods. Annu. Rev. Nutr. 1997. [Google Scholar] [CrossRef] [PubMed]
- Wang, Z.; Pi-Sunyer, F.X.; Kotler, D.P.; Wielopolski, L.; Withers, R.T.; Pierson, R.N.J.; Heymsfield, S.B. Multicomponent methods: Evaluation of new and traditional soft tissue mineral models by in vivo neutron activation analysis. Am. J. Clin. Nutr. 2002, 76, 968–974. [Google Scholar] [CrossRef] [PubMed] [Green Version]
- Deurenberg, P.; Deurenberg-Yap, M. Validity of body composition methods across ethnic population groups. Forum Nutr. 2003, 56, 299–301. [Google Scholar] [CrossRef] [PubMed]
- Buffa, R. Techniques for the evaluation of body composition. In Nutritional Status Within Life-Cicle and among Populations; UNICApress: Cagliari, Italy, 2017; pp. 77–85. [Google Scholar]
- Toomey, C.M.; Cremona, A.; Hughes, K.; Norton, C.; Jakeman, P. A review of body composition measurement in the assessment of health. Top. Clin. Nutr. 2015, 30, 16–32. [Google Scholar] [CrossRef]
- Andrews, E.T.; Beattie, R.M.; Johnson, M.J. Measuring body composition in the preterm infant: Evidence base and practicalities. Clin. Nutr. 2019, 38, 2521–2530. [Google Scholar] [CrossRef]
- Wells, J.C.K.; Fewtrell, M.S. Measuring body composition. Arch. Dis. Child. 2006, 91, 612–617. [Google Scholar] [CrossRef] [PubMed] [Green Version]
- Thomasset, M.A. [Bioelectric properties of tissue. Impedance measurement in clinical medicine. Significance of curves obtained]. Lyon Med. 1962, 94, 107–118. [Google Scholar] [PubMed]
- Lukaski, H.C.; Johnson, P.E.; Bolonchuk, W.W.; Lykken, G.I. Assessment of fat-free mass using bioelectrical impedance measurements of the human body. Am. J. Clin. Nutr. 1985, 41, 810–817. [Google Scholar] [CrossRef]
- Lukaski, H.C.; Vega Diaz, N.; Talluri, A.; Nescolarde, L. Classification of Hydration in Clinical Conditions: Indirect and Direct Approaches Using Bioimpedance. Nutrients 2019, 11, 809. [Google Scholar] [CrossRef] [Green Version]
- Lukaski, H.; Raymond-Pope, C.J. New Frontiers of Body Composition in Sport. Int. J. Sports Med. 2021. [Google Scholar] [CrossRef]
- Stahn, A.; Terblanche, E.; Gunga, H.-C. Use of Bioelectrical Impedance: General Principles and Overview. In Handbook of Anthropometry: Physical Measures of Human Form in Health and Disease; Preedy, V.R., Ed.; Springer: New York, NY, USA, 2012; pp. 49–90. ISBN 978-1-4419-1788-1. [Google Scholar]
- Hoffer, E.C.; Meador, C.K.; Simpson, D.C. Correlation of whole-body impedance with total body water volume. J. Appl. Physiol. 1969, 27, 531–534. [Google Scholar] [CrossRef]
- Lukaski, H.C.; Piccoli, A. Bioelectrical impedance vector analysis for assessment of hydration in physiological states and clinical conditions. In Handbook of Anthropometry; Preedy, V., Ed.; Springer: London, UK, 2012; pp. 287–305. [Google Scholar]
- Moon, J.R. Body composition in athletes and sports nutrition: An examination of the bioimpedance analysis technique. Eur. J. Clin. Nutr. 2013, 67, S54. [Google Scholar] [CrossRef] [Green Version]
- Matias, C.N.; Santos, D.A.; Júdice, P.B.; Magalhães, J.P.; Minderico, C.S.; Fields, D.A.; Lukaski, H.C.; Sardinha, L.B.; Silva, A.M. Estimation of total body water and extracellular water with bioimpedance in athletes: A need for athlete-specific prediction models. Clin. Nutr. 2016, 35, 468–474. [Google Scholar] [CrossRef]
- Matias, C.N.; Campa, F.; Santos, D.A.; Lukaski, H.; Sardinha, L.B.; Silva, A.M. Fat-free Mass Bioelectrical Impedance Analysis Predictive Equation for Athletes using a 4-Compartment Model. Int. J. Sports Med. 2021, 42, 27–32. [Google Scholar] [CrossRef]
- Sardinha, L.B.; Correia, I.R.; Magalhães, J.P.; Júdice, P.B.; Silva, A.M.; Hetherington-Rauth, M. Development and validation of BIA prediction equations of upper and lower limb lean soft tissue in athletes. Eur. J. Clin. Nutr. 2020, 74, 1646–1652. [Google Scholar] [CrossRef]
- Castizo-Olier, J.; Irurtia, A.; Jemni, M.; Carrasco-Marginet, M.; Fernandez-Garcia, R.; Rodriguez, F.A. Bioelectrical impedance vector analysis (BIVA) in sport and exercise: Systematic review and future perspectives. PLoS ONE 2018, 13, e0197957. [Google Scholar] [CrossRef] [PubMed]
- Ward, L.C. Bioelectrical impedance analysis for body composition assessment: Reflections on accuracy, clinical utility, and standardisation. Eur. J. Clin. Nutr. 2019, 73, 194–199. [Google Scholar] [CrossRef] [PubMed]
- Sedeaud, A.; Marc, A.; Schipman, J.; Schaal, K.; Danial, M.; Guillaume, M.; Berthelot, G.; Toussaint, J.-F. Secular trend: Morphology and performance. J. Sports Sci. 2014, 32, 1146–1154. [Google Scholar] [CrossRef] [PubMed]
- Bongiovanni, T.; Mascherini, G.; Genovesi, F.; Pasta, G.; Iaia, F.M.; Trecroci, A.; Ventimiglia, M.; Alberti, G.; Campa, F. Bioimpedance Vector References Need to Be Period-Specific for Assessing Body Composition and Cellular Health in Elite Soccer Players: A Brief Report. J. Funct. Morphol. Kinesiol. 2020, 5. [Google Scholar] [CrossRef]
- Campa, F.; Matias, C.; Gatterer, H.; Toselli, S.; Koury, J.C.; Andreoli, A.; Melchiorri, G.; Sardinha, L.B.; Silva, A.M. Classic Bioelectrical Impedance Vector Reference Values for Assessing Body Composition in Male and Female Athletes. Int. J. Environ. Res. Public Health 2019, 16. [Google Scholar] [CrossRef] [PubMed] [Green Version]
- Campa, F.; Toselli, S. Bioimpedance Vector Analysis of Elite, Subelite, and Low-Level Male Volleyball Players. Int. J. Sports Physiol. Perform. 2018, 13, 1250–1253. [Google Scholar] [CrossRef]
- Giorgi, A.; Vicini, M.; Pollastri, L.; Lombardi, E.; Magni, E.; Andreazzoli, A.; Orsini, M.; Bonifazi, M.; Lukaski, H.; Gatterer, H. Bioimpedance patterns and bioelectrical impedance vector analysis (BIVA) of road cyclists. J. Sports Sci. 2018, 1–6. [Google Scholar] [CrossRef]
- Micheli, M.L.; Pagani, L.; Marella, M.; Gulisano, M.; Piccoli, A.; Angelini, F.; Burtscher, M.; Gatterer, H. Bioimpedance and impedance vector patterns as predictors of league level in male soccer players. Int. J. Sports Physiol. Perform. 2014, 9, 532–539. [Google Scholar] [CrossRef] [PubMed]
- Koury, J.C.; Trugo, N.M.; Torres, A.G. Phase angle and bioelectrical impedance vectors in adolescent and adult male athletes. Int. J. Sports Physiol. Perform. 2014, 9, 798–804. [Google Scholar] [CrossRef]
- Toselli, S.; Marini, E.; Maietta Latessa, P.; Benedetti, L.; Campa, F. Maturity Related Differences in Body Composition Assessed by Classic and Specific Bioimpedance Vector Analysis among Male Elite Youth Soccer Players. Int. J. Environ. Res. Public Health 2020, 17. [Google Scholar] [CrossRef] [Green Version]
- Andreoli, A.; Melchiorri, G.; Brozzi, M.; Di Marco, A.; Volpe, S.L.; Garofano, P.; Di Daniele, N.; De Lorenzo, A. Effect of different sports on body cell mass in highly trained athletes. Acta Diabetol. 2003, 40 (Suppl. 1), S122–S125. [Google Scholar] [CrossRef]
- Barrero, A.; Erola, P.; Bescós, R. Energy balance of triathletes during an ultra-endurance event. Nutrients 2014, 7, 209–222. [Google Scholar] [CrossRef] [PubMed] [Green Version]
- Brancaccio, P.; Limongelli, F.M.; Paolillo, I.; D’Aponte, A.; Donnarumma, V.; Rastrelli, L. Supplementation of Acqua Lete® (Bicarbonate Calcic Mineral Water) improves hydration status in athletes after short term anaerobic exercise. J. Int. Soc. Sports Nutr. 2012, 9, 35. [Google Scholar] [CrossRef] [PubMed] [Green Version]
- Durcan, L.; Coole, A.; McCarthy, E.; Johnston, C.; Webb, M.J.; O’Shea, F.D.; Gissane, C.; Wilson, F. The prevalence of patellar tendinopathy in elite academy rugby: A clinical and imaging study. J. Sci. Med. Sport 2014, 17, 173–176. [Google Scholar] [CrossRef] [PubMed] [Green Version]
- Galanti, G.; Stefani, L.; Scacciati, I.; Mascherini, G.; Buti, G.; Maffulli, N. Eating and nutrition habits in young competitive athletes: A comparison between soccer players and cyclists. Transl. Med. UniSa 2015, 11, 44–47. [Google Scholar]
- Gatterer, H.; Schenk, K.; Ferrari, P.; Faulhaber, M.; Schopp, E.; Burtscher, M. Changes in hydration status of soccer players competing in the 2008 European Championship. J. Sports Med. Phys. Fitness 2011, 51, 89–94. [Google Scholar] [PubMed]
- Hoffman, M.D.; Lebus, D.K.; Ganong, A.C.; Casazza, G.A.; Van Loan, M. Body composition of 161-km ultramarathoners. Int. J. Sports Med. 2010, 31, 106–109. [Google Scholar] [CrossRef]
- Knechtle, B.; Knechtle, P.; Schück, R.; Andonie, J.L.; Kohler, G. Effects of a Deca Iron Triathlon on body composition: A case study. Int. J. Sports Med. 2008, 29, 343–351. [Google Scholar] [CrossRef]
- Nescolarde, L.; Yanguas, J.; Lukaski, H.; Alomar, X.; Rosell-Ferrer, J.; Rodas, G. Localized bioimpedance to assess muscle injury. Physiol. Meas. 2013, 34, 237–245. [Google Scholar] [CrossRef]
- Piccoli, A.; Pastori, G.; Codognotto, M.; Paoli, A. Equivalence of information from single frequency v. bioimpedance spectroscopy in bodybuilders. Br. J. Nutr. 2007, 97, 182–192. [Google Scholar] [CrossRef] [PubMed] [Green Version]
- Reljic, D.; Hässler, E.; Jost, J.; Friedmann-Bette, B. Rapid weight loss and the body fluid balance and hemoglobin mass of elite amateur boxers. J. Athl. Train. 2013, 48, 109–117. [Google Scholar] [CrossRef] [PubMed] [Green Version]
- Ubeda, N.; Palacios Gil-Antuñano, N.; Montalvo Zenarruzabeitia, Z.; García Juan, B.; García, A.; Iglesias-Gutiérrez, E. Food habits and body composition of Spanish elite athletes in combat sports. Nutr. Hosp. 2010, 25, 414–421. [Google Scholar]
- Knechtle, B.; Salas Fraire, O.; Andonie, J.L.; Kohler, G. Effect of a multistage ultra-endurance triathlon on body composition: World Challenge Deca Iron Triathlon 2006. Br. J. Sports Med. 2008, 42, 121–125, discussion 125. [Google Scholar] [CrossRef] [Green Version]
- Drid, P.; Drid, P.; Casals, C.; Mekic, A.; Radjo, I.; Stojanovic, M.; Ostojic, S.M. Fitness and Anthropometric Profiles of International vs. National Judo Medalists in Half-Heavyweight Category. J. Strength Cond. Res. 2015, 29, 2115–2121. [Google Scholar] [CrossRef] [PubMed]
- Esco, M.R.; Snarr, R.L.; Leatherwood, M.D.; Chamberlain, N.A.; Redding, M.L.; Flatt, A.A.; Moon, J.R.; Williford, H.N. Comparison of total and segmental body composition using DXA and multifrequency bioimpedance in collegiate female athletes. J. Strength Cond. Res. 2015, 29, 918–925. [Google Scholar] [CrossRef] [PubMed]
- Stachoń, A.J. Menstrual Changes in Body Composition of Female Athletes. Coll. Antropol. 2016, 40, 111–122. [Google Scholar]
- Kalnina, L.; Sauka, M.; Timpka, T.; Dahlström, Ö.; Nylander, E.; Selga, G.; Ligere, R.; Karklina, H.; Priedite, I.S.; Larins, V. Body fat in children and adolescents participating in organized sports: Descriptive epidemiological study of 6048 Latvian athletes. Scand. J. Public Health 2015, 43, 615–622. [Google Scholar] [CrossRef]
- Mala, L.; Maly, T.; Zahalka, F.; Bunc, V.; Kaplan, A.; Jebavy, R.; Tuma, M. Body composition of elite female players in five different sports games. J. Hum. Kinet. 2015, 45, 207–215. [Google Scholar] [CrossRef] [Green Version]
- Mascherini, G.; Gatterer, H.; Lukaski, H.; Burtscher, M.; Galanti, G. Changes in hydration, body-cell mass and endurance performance of professional soccer players through a competitive season. J. Sports Med. Phys. Fit. 2015, 55, 749–755. [Google Scholar]
- Mascherini, G.; Petri, C.; Galanti, G. Integrated total body composition and localized fat-free mass assessment. Sport Sci. Health 2015. [Google Scholar] [CrossRef]
- Matias, C.N.; Monteiro, C.P.; Santos, D.A.; Martins, F.; Silva, A.M.; Laires, M.J.; Sardinha, L.B. Magnesium and phase angle: A prognostic tool for monitoring cellular integrity in judo athletes. Magnes. Res. 2015, 28, 92–98. [Google Scholar] [CrossRef] [PubMed]
- Nescolarde, L.; Yanguas, J.; Lukaski, H.; Alomar, X.; Rosell-Ferrer, J.; Rodas, G. Effects of muscle injury severity on localized bioimpedance measurements. Physiol. Meas. 2015, 36, 27–42. [Google Scholar] [CrossRef] [PubMed]
- Santos, D.A.; Silva, A.M.; Matias, C.N.; Magalhães, J.P.; Minderico, C.S.; Thomas, D.M.; Sardinha, L.B. Utility of novel body indices in predicting fat mass in elite athletes. Nutrition 2015, 31, 948–954. [Google Scholar] [CrossRef]
- Vitiello, D.; Degache, F.; Saugy, J.J.; Place, N.; Schena, F.; Millet, G.P. The increase in hydric volume is associated to contractile impairment in the calf after the world’s most extreme mountain ultra-marathon. Extrem. Physiol. Med. 2015, 4, 18. [Google Scholar] [CrossRef] [Green Version]
- Hulmi, J.J.; Isola, V.; Suonpää, M.; Järvinen, N.J.; Kokkonen, M.; Wennerström, A.; Nyman, K.; Perola, M.; Ahtiainen, J.P.; Häkkinen, K. The Effects of Intensive Weight Reduction on Body Composition and Serum Hormones in Female Fitness Competitors. Front. Physiol. 2016, 7, 689. [Google Scholar] [CrossRef] [Green Version]
- Marra, M.; Da Prat, B.; Montagnese, C.; Caldara, A.; Sammarco, R.; Pasanisi, F.; Corsetti, R. Segmental bioimpedance analysis in professional cyclists during a three week stage race. Physiol. Meas. 2016, 37, 1035–1040. [Google Scholar] [CrossRef] [PubMed] [Green Version]
- Meleleo, D.; Bartolomeo, N.; Cassano, L.; Nitti, A.; Susca, G.; Mastrototaro, G.; Armenise, U.; Zito, A.; Devito, F.; Scicchitano, P.; et al. Evaluation of body composition with bioimpedence. A comparison between athletic and non-athletic children. Eur. J. Sport Sci. 2017, 17, 710–719. [Google Scholar] [CrossRef] [PubMed]
- Pollastri, L.; Lanfranconi, F.; Tredici, G.; Schenk, K.; Burtscher, M.; Gatterer, H. Body fluid status and physical demand during the Giro d’Italia. Res. Sports Med. 2016, 24, 30–38. [Google Scholar] [CrossRef]
- Araújo, D.; Teixeira, V.H.; Carvalho, P.; Amaral, T.F. Exercise induced dehydration status and skinfold compressibility in athletes: An intervention study. Asia Pac. J. Clin. Nutr. 2018, 27, 189–194. [Google Scholar] [CrossRef]
- Castañeda Babarro, A.; Viribay Morales, A.; León Guereño, P.; Mielgo-Ayuso, J.; Urdampilleta, A.; Coca Núñez, A. Anthropometric profile, body composition, and somatotype in stand-up paddle (SUP) boarding international athletes: A cross-sectional study. Nutr. Hosp. 2020, 37, 958–963. [Google Scholar] [CrossRef]
- Bacciotti, S.; Baxter-Jones, A.; Gaya, A.; Maia, J. Body physique and proportionality of Brazilian female artistic gymnasts. J. Sports Sci. 2018, 36, 749–756. [Google Scholar] [CrossRef] [PubMed]
- Belinchon-deMiguel, P.; Clemente-Suárez, V.J. Psychophysiological, Body Composition, Biomechanical and Autonomic Modulation Analysis Procedures in an Ultraendurance Mountain Race. J. Med. Syst. 2018, 42, 32. [Google Scholar] [CrossRef] [PubMed]
- Campa, F.; Bongiovanni, T.; Matias, C.N.; Genovesi, F.; Trecroci, A.; Rossi, A.; Iaia, F.M.; Alberti, G.; Pasta, G.; Toselli, S. A New Strategy to Integrate Heath-Carter Somatotype Assessment with Bioelectrical Impedance Analysis in Elite Soccer Player. Sport 2020, 8. [Google Scholar] [CrossRef]
- Campa, F.; Matias, C.N.; Marini, E.; Heymsfield, S.B.; Toselli, S.; Sardinha, L.B.; Silva, A.M. Identifying athlete body fluid changes during a competitive season with bioelectrical impedance vector analysis. Int. J. Sports Physiol. Perform. 2020, 15, 361–367. [Google Scholar] [CrossRef] [PubMed]
- Campa, F.; Matias, C.N.; Nikolaidis, P.T.; Lukaski, H.; Talluri, J.; Toselli, S. Prediction of Somatotype from Bioimpedance Analysis in Elite Youth Soccer Players. Int. J. Environ. Res. Public Health 2020, 17. [Google Scholar] [CrossRef]
- Campa, F.; Silva, A.M.; Iannuzzi, V.; Mascherini, G.; Benedetti, L.; Toselli, S. The Role of Somatic Maturation on Bioimpedance Patterns and Body Composition in Male Elite Youth Soccer Players. Int. J. Environ. Res. Public Health 2019, 16. [Google Scholar] [CrossRef] [Green Version]
- Campa, F.; Silva, A.M.; Matias, C.N.; Monteiro, C.P.; Paoli, A.; Nunes, J.P.; Talluri, J.; Lukaski, H.; Toselli, S. Body Water Content and Morphological Characteristics Modify Bioimpedance Vector Patterns in Volleyball, Soccer, and Rugby Players. Int. J. Environ. Res. Public Health 2020, 17. [Google Scholar] [CrossRef]
- Campa, F.; Silva, A.M.; Talluri, J.; Matias, C.N.; Badicu, G.; Toselli, S. Somatotype and Bioimpedance Vector Analysis: A New Target Zone for Male Athletes. Sustainability 2020, 12, 4365. [Google Scholar] [CrossRef]
- Castizo-Olier, J.; Carrasco-Marginet, M.; Roy, A.; Chaverri, D.; Iglesias, X.; Pérez-Chirinos, C.; Rodríguez, F.; Irurtia, A. Bioelectrical Impedance Vector Analysis (BIVA) and Body Mass Changes in an Ultra-Endurance Triathlon Event. J. Sports Sci. Med. 2018, 17, 571–579. [Google Scholar]
- Martins, P.C.; Hansen, F.; Silva, A.M.; Silva, D.A.S. Fluid distribution and cell integrity indicators evaluated by bioelectrical impedance in university athletes: Comparison between team sports and individual sports. Physiol. Meas. 2019, 40, 15004. [Google Scholar] [CrossRef]
- de Almeida-Neto, P.F.; de Matos, D.G.; Pinto, V.C.M.; Dantas, P.M.S.; de Cesário, T.M.; da Silva, L.F.; Bulhões-Correia, A.; Aidar, F.J.; de Cabral, B.G.A.T. Can the Neuromuscular Performance of Young Athletes Be Influenced by Hormone Levels and Different Stages of Puberty? Int. J. Environ. Res. Public Health 2020, 17, 5637. [Google Scholar] [CrossRef] [PubMed]
- Di Vincenzo, O.; Marra, M.; Sammarco, R.; Speranza, E.; Cioffi, I.; Scalfi, L. Body composition, segmental bioimpedance phase angle and muscular strength in professional volleyball players compared to a control group. J. Sports Med. Phys. Fit. 2020, 60, 870–874. [Google Scholar] [CrossRef]
- Domingos, C.; Matias, C.N.; Cyrino, E.S.; Sardinha, L.B.; Silva, A.M. The usefulness of Tanita TBF-310 for body composition assessment in Judo athletes using a four-compartment molecular model as the reference method. Rev. Assoc. Med. Bras. 2019, 65, 1283–1289. [Google Scholar] [CrossRef] [PubMed] [Green Version]
- Durkalec-Michalski, K.; Nowaczyk, P.M.; Podgórski, T.; Kusy, K.; Osiński, W.; Jeszka, J. Relationship between body composition and the level of aerobic and anaerobic capacity in highly trained male rowers. J. Sports Med. Phys. Fit. 2019, 59, 1526–1535. [Google Scholar] [CrossRef]
- Francisco, R.; Matias, C.N.; Santos, D.A.; Campa, F.; Minderico, C.S.; Rocha, P.; Heymsfield, S.B.; Lukaski, H.; Sardinha, L.B.; Silva, A.M. The Predictive Role of Raw Bioelectrical Impedance Parameters in Water Compartments and Fluid Distribution Assessed by Dilution Techniques in Athletes. Int. J. Environ. Res. Public Health 2020, 17, 759. [Google Scholar] [CrossRef] [Green Version]
- Gamero-delCastillo, D.; Lorenzo Calvo, J.; Navandar, A.; López Díaz de Durana, A. Differences in the Bodyweight, Hydration Levels, Lean Mass, and Fat Mass in Spanish Junior Elite Judokas. Int. J. Environ. Res. Public Health 2020, 17, 2853. [Google Scholar] [CrossRef] [Green Version]
- Herdy, C.; Figueiredo, T.; Costa, G.; Simao, R. Comparison between anthropometry and multi-frequency bioimpedance for body composition evaluation in Brazilian elite U-20 soccer athletes. Motricidade 2020, 16, 28–38. [Google Scholar] [CrossRef]
- Hetherington-Rauth, M.; Leu, C.G.; Júdice, P.B.; Correia, I.R.; Magalhães, J.P.; Sardinha, L.B. Whole body and regional phase angle as indicators of muscular performance in athletes. Eur. J. Sport Sci. 2021, 1–9. [Google Scholar] [CrossRef] [PubMed]
- Domínguez, R.; López-Domínguez, R.; López-Samanes, Á.; Gené, P.; González-Jurado, J.A.; Sánchez-Oliver, A.J. Analysis of Sport Supplement Consumption and Body Composition in Spanish Elite Rowers. Nutrients 2020, 12, 3871. [Google Scholar] [CrossRef]
- Koury, J.C.; de Oliveira-Junior, A.V.; Portugal, M.R.C.; de Oliveira, K.D.J.F.; Donangelo, C.M. Bioimpedance parameters in adolescent athletes in relation to bone maturity and biochemical zinc indices. J. Trace Elem. Med. Biol. 2018, 46, 26–31. [Google Scholar] [CrossRef] [PubMed]
- Mala, L.; Maly, T.; Cabell, L.; Hank, M.; Bujnovsky, D.; Zahalka, F. Anthropometric, Body Composition, and Morphological Lower Limb Asymmetries in Elite Soccer Players: A Prospective Cohort Study. Int. J. Environ. Res. Public Health 2020, 17, 1140. [Google Scholar] [CrossRef] [Green Version]
- Marini, E.; Campa, F.; Buffa, R.; Stagi, S.; Matias, C.N.; Toselli, S.; Sardinha, L.B.; Silva, A.M. Phase angle and bioelectrical impedance vector analysis in the evaluation of body composition in athletes. Clin. Nutr. 2020, 39, 447–454. [Google Scholar] [CrossRef]
- Marra, M.; Di Vincenzo, O.; Sammarco, R.; Morlino, D.; Scalfi, L. Bioimpedance phase angle in elite male athletes: A segmental approach. Physiol. Meas. 2021, 41, 125007. [Google Scholar] [CrossRef] [PubMed]
- Mascherini, G.; Castizo-Olier, J.; Irurtia, A.; Petri, C.; Galanti, G. Differences between the sexes in athletes’ body composition and lower limb bioimpedance values. Muscles. Ligaments Tendons J. 2017, 7, 573–581. [Google Scholar] [CrossRef] [PubMed] [Green Version]
- Mascherini, G.; Petri, C.; Ermini, E.; Bini, V.; Calà, P.; Galanti, G.; Modesti, P.A. Overweight in Young Athletes: New Predictive Model of Overfat Condition. Int. J. Environ. Res. Public Health 2019, 16, 5128. [Google Scholar] [CrossRef] [Green Version]
- Nabuco, H.C.G.; Silva, A.M.; Sardinha, L.B.; Rodrigues, F.B.; Tomeleri, C.M.; Ravagnani, F.C.P.; Cyrino, E.S.; Ravagnani, C.F.C. Phase Angle is Moderately Associated with Short-term Maximal Intensity Efforts in Soccer Players. Int. J. Sports Med. 2019, 40, 739–743. [Google Scholar] [CrossRef] [PubMed]
- Nescolarde, L.; Roca, E.; Bogónez-Franco, P.; Hernández-Hermoso, J.; Bayes-Genis, A.; Ara, J. Relationship Between Bioimpedance Vector Displacement and Renal Function After a Marathon in Non-elite Runners. Front. Physiol. 2020, 11, 352. [Google Scholar] [CrossRef]
- Mascherini, G.; Petri, C.; Galanti, G. Link between body cellular mass and left ventricular hypertrophy in female and male athletes. J. Sports Med. Phys. Fit. 2019, 59, 164–170. [Google Scholar] [CrossRef] [PubMed]
- Nikolaidis, P.T.; Knechtle, C.; Ramirez-Campillo, R.; Vancini, R.L.; Rosemann, T.; Knechtle, B. Training and Body Composition during Preparation for a 48-Hour Ultra-Marathon Race: A Case Study of a Master Athlete. Int. J. Environ. Res. Public Health 2019, 16, 903. [Google Scholar] [CrossRef] [Green Version]
- Petri, C.; Mascherini, G.; Bini, V.; Anania, G.; Calà, P.; Toncelli, L.; Galanti, G. Integrated total body composition versus Body Mass Index in young athletes. Minerva Pediatr. 2020, 72, 163–169. [Google Scholar] [CrossRef]
- Campa, F.; Gatterer, H.; Lukaski, H.; Toselli, S. Stabilizing Bioimpedance-Vector-Analysis Measures With a 10-Minute Cold Shower After Running Exercise to Enable Assessment of Body Hydration. Int. J. Sports Physiol. Perform. 2019, 1–13. [Google Scholar] [CrossRef] [PubMed]
- Campa, F.; Piras, A.; Raffi, M.; Trofè, A.; Perazzolo, M.; Mascherini, G.; Toselli, S. The Effects of Dehydration on Metabolic and Neuromuscular Functionality During Cycling. Int. J. Environ. Res. Public Health 2020, 17, 1161. [Google Scholar] [CrossRef] [Green Version]
- Prill, R.; Michel, S.; Schulz, R.; Coriolano, H.-J.A. Body Composition and Strength Parameters in Elite Judo Athletes 5 Years after Anterior Cruciate Ligament Reconstruction. Int. J. Sports Med. 2019, 40, 38–42. [Google Scholar] [CrossRef] [PubMed]
- Reis, J.F.; Matias, C.N.; Campa, F.; Morgado, J.P.; Franco, P.; Quaresma, P.; Almeida, N.; Curto, D.; Toselli, S.; Monteiro, C.P. Bioimpedance Vector Patterns Changes in Response to Swimming Training: An Ecological Approach. Int. J. Environ. Res. Public Health 2020, 17, 4851. [Google Scholar] [CrossRef] [PubMed]
- Silva, A.M.; Matias, C.N.; Nunes, C.L.; Santos, D.A.; Marini, E.; Lukaski, H.C.; Sardinha, L.B. Lack of agreement of in vivo raw bioimpedance measurements obtained from two single and multi-frequency bioelectrical impedance devices. Eur. J. Clin. Nutr. 2018. [Google Scholar] [CrossRef] [PubMed]
- Silva, A.M.; Nunes, C.L.; Matias, C.N.; Rocha, P.M.; Minderico, C.S.; Heymsfield, S.B.; Lukaski, H.; Sardinha, L.B. Usefulness of raw bioelectrical impedance parameters in tracking fluid shifts in judo athletes. Eur. J. Sport Sci. 2020, 20, 734–743. [Google Scholar] [CrossRef]
- Sönksen, P.H.; Holt, R.I.G.; Böhning, W.; Guha, N.; Cowan, D.A.; Bartlett, C.; Böhning, D. Why do endocrine profiles in elite athletes differ between sports? Clin. Diabetes Endocrinol. 2018, 4, 3. [Google Scholar] [CrossRef] [Green Version]
- Tinsley, G.M.; Graybeal, A.J.; Moore, M.L.; Nickerson, B.S. Fat-free Mass Characteristics of Muscular Physique Athletes. Med. Sci. Sports Exerc. 2019, 51, 193–201. [Google Scholar] [CrossRef]
- Utczás, K.; Tróznai, Z.; Pálinkás, G.; Kalabiska, I.; Petridis, L. How Length Sizes Affect Body Composition Estimation in Adolescent Athletes Using Bioelectrical Impedance. J. Sports Sci. Med. 2020, 19, 577–584. [Google Scholar]
- Zaric, I.; Dopsaj, M.; Markovic, M.; Zaric, M.; Jakovljevic, S.; Beric, D.; Zaric, I.; Dopsaj, M.; Markovic, M.; Zaric, M.; et al. Body Composition Characteristics Measured By Multichannel Bioimpedance In Young Female Basketball Players: Relation With Match Performance. Int. J. Morphol. 2020, 38, 328–335. [Google Scholar] [CrossRef] [Green Version]
- Carrasco-Marginet, M.; Castizo-Olier, J.; Rodríguez-Zamora, L.; Iglesias, X.; Rodríguez, F.A.; Chaverri, D.; Brotons, D.; Irurtia, A. Bioelectrical impedance vector analysis (BIVA) for measuring the hydration status in young elite synchronized swimmers. PLoS ONE 2017, 12, e0178819. [Google Scholar] [CrossRef] [PubMed] [Green Version]
- Raymond, C.J.; Dengel, D.R.; Bosch, T.A. Total and Segmental Body Composition Examination in Collegiate Football Players Using Multifrequency Bioelectrical Impedance Analysis and Dual X-ray Absorptiometry. J. Strength Cond. Res. 2018, 32, 772–782. [Google Scholar] [CrossRef] [PubMed]
- Buffa, R.; Saragat, B.; Cabras, S.; Rinaldi, A.C.; Marini, E. Accuracy of specific BIVA for the assessment of body composition in the United States population. PLoS ONE 2013, 8, e58533. [Google Scholar] [CrossRef]
- Lorenzo, A.D.; Andreoli, A. Segmental bioelectrical impedance analysis. Curr. Opin. Clin. Nutr. Metab. Care 2003, 6, 551–555. [Google Scholar] [CrossRef]
- Cornish, B.H.; Jacobs, A.; Thomas, B.J.; Ward, L.C. Optimizing electrode sites for segmental bioimpedance measurements. Physiol. Meas. 1999, 20, 241–250. [Google Scholar] [CrossRef] [Green Version]
- Chumlea, W.C.; Guo, S.S.; Zeller, C.M.; Reo, N.V.; Siervogel, R.M. Total body water data for white adults 18 to 64 years of age: The Fels Longitudinal Study. Kidney Int. 1999. [Google Scholar] [CrossRef] [Green Version]
- Baumgartner, R.N.; Chumlea, W.C.; Roche, A.F. Bioelectric impedance phase angle and body composition. Am. J. Clin. Nutr. 1988, 48, 16–23. [Google Scholar] [CrossRef] [Green Version]
- Zhu, F.; Schneditz, D.; Levin, N.W. Sum of segmental bioimpedance analysis during ultrafiltration and hemodialysis reduces sensitivity to changes in body position. Kidney Int. 1999, 56, 692–699. [Google Scholar] [CrossRef] [Green Version]
- Chanchairujira, T.; Mehta, R.L. Assessing fluid change in hemodialysis: Whole body versus sum of segmental bioimpedance spectroscopy. Kidney Int. 2001, 60, 2337–2342. [Google Scholar] [CrossRef] [Green Version]
- Nescolarde, L.; García-González, M.A.; Rosell-Ferrer, J.; Doñate, T.; Querfeld, U. Thoracic versus whole body bioimpedance measurements: The relation to hydration status and hypertension in peritoneal dialysis patients. Physiol. Meas. 2006, 27, 961–971. [Google Scholar] [CrossRef]
- Nescolarde, L.; Yanguas, J.; Terricabras, J.; Lukaski, H.; Alomar, X.; Rosell-Ferrer, J.; Rodas, G. Detection of muscle gap by L-BIA in muscle injuries: Clinical prognosis. Physiol. Meas. 2017, 38, L1–L9. [Google Scholar] [CrossRef]
- Nescolarde, L.; Terricabras, J.; Mechó, S.; Rodas, G.; Yanguas, J. Differentiation Between Tendinous, Myotendinous and Myofascial Injuries by L-BIA in Professional Football Players. Front. Physiol. 2020, 11, 574124. [Google Scholar] [CrossRef]
- Piccoli, A.; Rossi, B.; Pillon, L.; Bucciante, G. A new method for monitoring body fluid variation by bioimpedance analysis: The RXc graph. Kidney Int. 1994, 46, 534–539. [Google Scholar] [CrossRef] [Green Version]
- Gatterer, H.; Schenk, K.; Laninschegg, L.; Schlemmer, P.; Lukaski, H.; Burtscher, M. Bioimpedance identifies body fluid loss after exercise in the heat: A pilot study with body cooling. PLoS ONE 2014, 9, e109729. [Google Scholar] [CrossRef]
- Khalil, S.F.; Mohktar, M.S.; Ibrahim, F. The theory and fundamentals of bioimpedance analysis in clinical status monitoring and diagnosis of diseases. Sensors 2014, 14, 10895–10928. [Google Scholar] [CrossRef] [PubMed]
- Lukaski, H.C. Evolution of bioimpedance: A circuitous journey from estimation of physiological function to assessment of body composition and a return to clinical research. Eur. J. Clin. Nutr. 2013, 67 (Suppl. 1), S2–S9. [Google Scholar] [CrossRef] [Green Version]
- Kyle, U.G.; Bosaeus, I.; De Lorenzo, A.D.; Deurenberg, P.; Elia, M.; Gomez, J.M.; Heitmann, B.L.; Kent-Smith, L.; Melchior, J.-C.; Pirlich, M.; et al. Bioelectrical impedance analysis—Part I: Review of principles and methods. Clin. Nutr. 2004, 23, 1226–1243. [Google Scholar] [CrossRef] [PubMed]
- Kyle, U.G.; Bosaeus, I.; De Lorenzo, A.D.; Deurenberg, P.; Elia, M.; Manuel Gomez, J.; Lilienthal Heitmann, B.; Kent-Smith, L.; Melchior, J.-C.; Pirlich, M.; et al. Bioelectrical impedance analysis-part II: Utilization in clinical practice. Clin. Nutr. 2004, 23, 1430–1453. [Google Scholar] [CrossRef] [PubMed]
- Brantlov, S.; Jødal, L.; Lange, A.; Rittig, S.; Ward, L.C. Standardisation of bioelectrical impedance analysis for the estimation of body composition in healthy paediatric populations: A systematic review. J. Med. Eng. Technol. 2017, 41, 460–479. [Google Scholar] [CrossRef] [PubMed]
- Houtkooper, L.B.; Lohman, T.G.; Going, S.B.; Howell, W.H. Why bioelectrical impedance analysis should be used for estimating adiposity. Am. J. Clin. Nutr. 1996, 64, 436S–448S. [Google Scholar] [CrossRef] [PubMed]
- Ellis, K.J. Human body composition: In vivo methods. Physiol. Rev. 2000, 80, 649–680. [Google Scholar] [CrossRef] [PubMed] [Green Version]
- Piccoli, A.; Pillon, L.; Dumler, F. Impedance vector distribution by sex, race, body mass index, and age in the United States: Standard reference intervals as bivariate Z scores. Nutrition 2002, 18, 153–167. [Google Scholar] [CrossRef]
- Foster, K.R.; Lukaski, H.C. Whole-body impedance—What does it measure? Am. J. Clin. Nutr. 1996, 64, 388S–396S. [Google Scholar] [CrossRef] [Green Version]
- Di Vincenzo, O.; Marra, M.; Scalfi, L. Bioelectrical impedance phase angle in sport: A systematic review. J. Int. Soc. Sports Nutr. 2019, 16, 49. [Google Scholar] [CrossRef] [Green Version]
- Piccoli, A.; Nigrelli, S.; Caberlotto, A.; Bottazzo, S.; Rossi, B.; Pillon, L.; Maggiore, Q. Bivariate normal values of the bioelectrical impedance vector in adult and elderly populations. Am. J. Clin. Nutr. 1995, 61, 269–270. [Google Scholar] [CrossRef]
- Reljic, D.; Feist, J.; Jost, J.; Kieser, M.; Friedmann-Bette, B. Rapid body mass loss affects erythropoiesis and hemolysis but does not impair aerobic performance in combat athletes. Scand. J. Med. Sci. Sports 2016, 26, 507–517. [Google Scholar] [CrossRef] [PubMed]
- Roberts, J.; Zinchenko, A.; Suckling, C.; Smith, L.; Johnstone, J.; Henselmans, M. The short-term effect of high versus moderate protein intake on recovery after strength training in resistance-trained individuals. J. Int. Soc. Sports Nutr. 2017, 14, 44. [Google Scholar] [CrossRef] [Green Version]
- Campa, F.; Matias, C.N.M.; Teixeira, F.J.; Reis, J.F.; Valamatos, M.J.; Toselli, S.; Monteiro, C.P. Leucine metabolites do not induce changes in phase angle, bioimpedance vector analysis patterns, and strength in resistance trained men. Appl. Physiol. Nutr. Metab. 2020. [Google Scholar] [CrossRef]


| Method | Advantages | Disadvantages | |
|---|---|---|---|
| Direct | Whole body counting | High accuracy | Costs, technical difficulties. |
| Indirect | Densitometry (underwater weighing, air-displacement plethysmography) | Relatively fast and non-invasive | Costs, hydration assumptions, effects of disease on lean mass reduce accuracy, distribution of fat unable to be determined. |
| Hydrometry (D2O, NaBr) | Suitable for all age group | Costs, low acceptability, delayed results. | |
| Dual-energy X-ray Absorptiometry (DXA) | Reliable and repeatable. Can provide regional as well as total evaluations | Small radiation exposure. Can overestimate fat mass. | |
| Magnetic resonance, computed tomography | High reproducibility, accurate assessment of lean soft tissue, assessment of regional adiposity and of intra-abdominal vs subcutaneous adiposity. | Costs, not suitable for all infants due to need for transfer to scanner and time required for scan acquisition. Computed tomography involves the use of X-rays, which are a form of ionizing radiation. | |
| Double Indirect | Anthropometry | Simple measurement of subcutaneous fat | Population specific, poor accuracy in individuals and groups, training required. |
| Bioelectric Impedance Analysis (BIA) | Quick and non-invasive. Cumulative accuracy makes useful for repeated measures | Population specific. Distribution of fat unable to be determined. |
| Authors | Aim | Study Design | Participants | Technology and Sampling Frequency | Reference Method | Results |
|---|---|---|---|---|---|---|
| Esco et al. (2015) [51] | Assessing the agreement between multifrequency BIA and DXA for measuring fat mass, fat-free mass, and total body and segmental lean soft tissue | Cross-sectional | 45 female athletes (age 21.2 ± 2.0 year) engaged in different sports | Direct segmental at multifrequency | DXA | (i) Multifrequency BIA underestimated fat mass and overestimated fat-free mass (ii) Multifrequency BIA and DXA showed agreement for measuring total body and segmental lean soft tissue |
| Raymond et al. (2018) [108] | Assessing the agreement between multifrequency BIA and DXA for measuring fat mass and fat-free mass | Cross-sectional | 44 male athletes (age 19.6 ± 1.0 year) collegiate football athletes | Direct segmental at multifrequency | DXA | (i) Multifrequency BIA underestimated fat mass and overestimated fat-free mass |
| Domingos et al. (2019) [79] | Assessing the validity of BIA to determine fat mass and fat-free mass | Cross-sectional study | 29 male judo athletes (age 23.1 ± 3.4 year) | Foot-to-foot at multifrequency | Four-compartment model | (i) BIA overestimated fat mass, while showed agreement for measuring fat-free mass |
| Silva et al. (2019) [102] | Assessing the ability of BIVA in tracking body fluids changes during the preparation period prior to competition in combat sport | Observational study | 27 male judo athletes (age 23.2 ± 2.8 year) | Foot-to hand at 50 kHz | Dilution techniques (deuterium and bromide) | (i) Decreases in total body water were accompanied by vector elongations, and vice versa (ii) Changes in intracellular/extracellular water ratio were positively associated with changes in phase angle |
| Marini et al. (2020) [88] | Assessing the association of classic and BIVA patterns and phase angle with body fluids and fat mass | Cross-sectional study | 202 athletes (men: age 21.5 ± 5.0 year; women: age 20.7 ± 5.1 year) engaged in different sports | Foot-to hand at 50 kHz | Dilution techniques (deuterium and bromide) and DXA | (i) Specific BIVA accurately assessed fat mass but no total body water (ii) Classic BIVA accurately assessed total body water but no fat mass (iii) The intracellular/extracellular water ratio were positively associated with phase angle |
| Campa et al. (2020) [70] | Assessing the ability of BIVA in tracking body fluids changes over the competitive period and vector position in relation to lean soft tissue | Observational study | 58 athletes (men: age 18.7 ± 4.0 year; women: age 19.2 ± 6.0 year) engaged in different sports | Foot-to hand at 50 kHz | Dilution techniques (deuterium and bromide) and DXA | (i) Decreases in total body water were accompanied by vector elongations, and vice versa (ii) Lateral vectors lying on the left or right side of the BIVA graph resulted in higher or lower phase angles, indicating more or less soft tissue, respectively (iii) Changes in intracellular/extracellular water ratio were positively associated with changes in phase angle |
| Francisco et al. (2020) [81] | Assessing the associations of raw bioelectrical parameters with body fluids | Cross-sectional study | 202 athletes (men: age 21.5 ± 4.5 year; women: age 20.4 ± 5.2 year) engaged in different sports | Foot-to hand at 50 kHz | Dilution techniques (deuterium and bromide) | (i) Lower R is associated with higher total body water whereas lower Xc is associated with higher extracellular water (ii) The intracellular/extracellular water ratio were positively associated with phase angle |
| Authors | Estimate Variables | Technology and Sampling Frequency | Reference Method | Equation | Note |
|---|---|---|---|---|---|
| Matias et al. (2016) [24] | - Total body water - Extracellular water | Foot-to hand at 50 kHz | Dilution techniques (deuterium and bromide) | - Total body water (kg) = 0.286 + 0.195 × stature2/R+ 0.385 × body mass + 5.086 × Sex - Extracellular water (kg) = 1.579 + 0.055 × stature2/R + 0.127 × body mass + 0.006 × stature2/Xc + 0.932 × Sex | where sex is 0 if female or 1 if male, R is resistance, and Xc is reactance |
| Matias et al. (2020) [25] | Fat-free mass | Foot-to hand at 50 kHz | Four-compartment model | - Fat-free mass (kg) = −2.261 + 0.327 × stature2/R + 0.525 × body mass + 5.462 × Sex | where sex is 0 if female or 1 if male, and R is resistance |
| Sardinha et al. (2020) [26] | - Arms lean soft tissue - Legs lean soft tissue | Foot-to hand at 50 kHz | DXA | - Arms lean soft tissue (kg) = 0.940 × Sex + 0.042 × body mass + 0.080 × stature2/R + 0.024 × Xc − 3.927 - Legs lean soft tissue (kg) = 1.983 × Sex + 0.154 × body mass +0.127 × stature2/R − 1.147 | where sex is 1 if female or 0 if male, R is resistance, and Xc is reactance |
| Authors | Population | Sample Size | Competitive Period | Technology and Sampling Frequency | R/H | Xc/H | Phase Angle |
|---|---|---|---|---|---|---|---|
| Micheli et al. (2014) [34] | Male adult elite soccer players | 219 | first half of the in-season period | Foot-to hand at 50 kHz | 252.1 ± 23.1 | 33.7 ± 3.6 | 7.7 ± 0.6 |
| Koury et al. (2014) [35] | General male adolescents | 195 | N/A | Foot-to hand at 50 kHz | 302.0 ± 71.0 | 36.1 ± 6.7 | 6.9 ± 0.9 |
| Koury et al. (2014) [35] | General adult | 90 | N/A | Foot-to hand at 50 kHz | 252.4 ± 33.8 | 35.4 ± 4.9 | 8.0 ± 0.7 |
| Campa and Toselli (2018) [32] | Male adult elite volleyball players | 75 | Second half of the in-season period | Foot-to hand at 50 kHz | 232.1 ± 24.1 | 31.5 ± 4.3 | 7.7 ± 0.7 |
| Giorgi et al. (2018) [33] | Male adult elite ciclysts | 79 | N/A | Foot-to hand at 50 kHz | 284.5 ± 31.4 | 34.9 ± 4.1 | 7.0 ± 0.7 |
| Campa et al. (2019) [31] | General male adult endurance athletes | 165 | Off-season period | Foot-to hand at 50 kHz | 267.2 ± 28.0 | 35.5 ± 4.7 | 7.6 ± 0.8 |
| Campa et al. (2019) [31] | General male adult team sports athletes | 576 | Off-season period | Foot-to hand at 50 kHz | 246.2 ± 32.3 | 32.9 ± 4.8 | 7.6 ± 0.8 |
| Campa et al. (2019) [31] | General male velocity/power athletes | 375 | Off-season period | Foot-to hand at 50 kHz | 253.3 ± 32.4 | 34.2 ± 5.5 | 7.7 ± 0.8 |
| Campa et al. (2019) [31] | General female adult endurance athletes | 76 | Off-season period | Foot-to hand at 50 kHz | 337.5 ± 42.9 | 40.1 ± 5.5 | 6.8 ± 0.8 |
| Campa et al. (2019) [31] | General female adult team sports athletes | 187 | Off-season period | Foot-to hand at 50 kHz | 305.6 ± 37.6 | 36.3 ± 5.3 | 6.8 ± 0.8 |
| Campa et al. (2019) [31] | General female velocity/power athletes | 177 | Off-season period | Foot-to hand at 50 kHz | 321.0 ± 46.9 | 38.0 ± 7.4 | 7.0 ± 0.8 |
| Toselli et al. (2020) [36] | Youth elite soccer players | 178 | first part of the preparation period | Foot-to hand at 50 kHz | 382.1 ± 81.6 | 41.3 ± 7.8 | 6.4 ± 0.8 |
| Bongiovanni et al. (2020) [30] | Male adult elite soccer players | 131 | End of the preparation period | Foot-to hand at 50 kHz | 281.1 ± 20.3 | 34.6 ± 3.3 | 8.0 ± 0.5 |
Publisher’s Note: MDPI stays neutral with regard to jurisdictional claims in published maps and institutional affiliations. |
© 2021 by the authors. Licensee MDPI, Basel, Switzerland. This article is an open access article distributed under the terms and conditions of the Creative Commons Attribution (CC BY) license (https://creativecommons.org/licenses/by/4.0/).
Share and Cite
Campa, F.; Toselli, S.; Mazzilli, M.; Gobbo, L.A.; Coratella, G. Assessment of Body Composition in Athletes: A Narrative Review of Available Methods with Special Reference to Quantitative and Qualitative Bioimpedance Analysis. Nutrients 2021, 13, 1620. https://0-doi-org.brum.beds.ac.uk/10.3390/nu13051620
Campa F, Toselli S, Mazzilli M, Gobbo LA, Coratella G. Assessment of Body Composition in Athletes: A Narrative Review of Available Methods with Special Reference to Quantitative and Qualitative Bioimpedance Analysis. Nutrients. 2021; 13(5):1620. https://0-doi-org.brum.beds.ac.uk/10.3390/nu13051620
Chicago/Turabian StyleCampa, Francesco, Stefania Toselli, Massimiliano Mazzilli, Luís Alberto Gobbo, and Giuseppe Coratella. 2021. "Assessment of Body Composition in Athletes: A Narrative Review of Available Methods with Special Reference to Quantitative and Qualitative Bioimpedance Analysis" Nutrients 13, no. 5: 1620. https://0-doi-org.brum.beds.ac.uk/10.3390/nu13051620