
Greater Protection of Lower Dietary Carbohydrate to Fiber Ratio (CFR) against Poor Blood Pressure Control in Patients with Essential Hypertension: A Cross-Sectional Study
 and
and
Abstract
:1. Introduction
2. Materials and Methods
2.1. Design and Study Participants
2.2. Blood Pressure
2.3. Dietary Fiber and Carbohydrate Intake
2.4. Sociodemographic and Clinical Data
2.5. Statistical Analysis
- (1)
- Description of demographic, clinical data, and nutrients: The categorical variables were expressed as frequencies (percentages); the continuous variables were expressed as mean ± standard deviation (SD) if they conformed to normality, or quartiles M (P25, P75) if they were skewed.
- (2)
- Comparisons of demographic, clinical data, and nutrients: For continuous variables, the independent samples T test (normal), the Mann–Whitney U test (skewed), or the analysis of variance (ANOVA) were applied. For categorical variables, Pearson’s chi-square test, Yates’ correction chi-square, or Fisher’s exact test was used.
- (3)
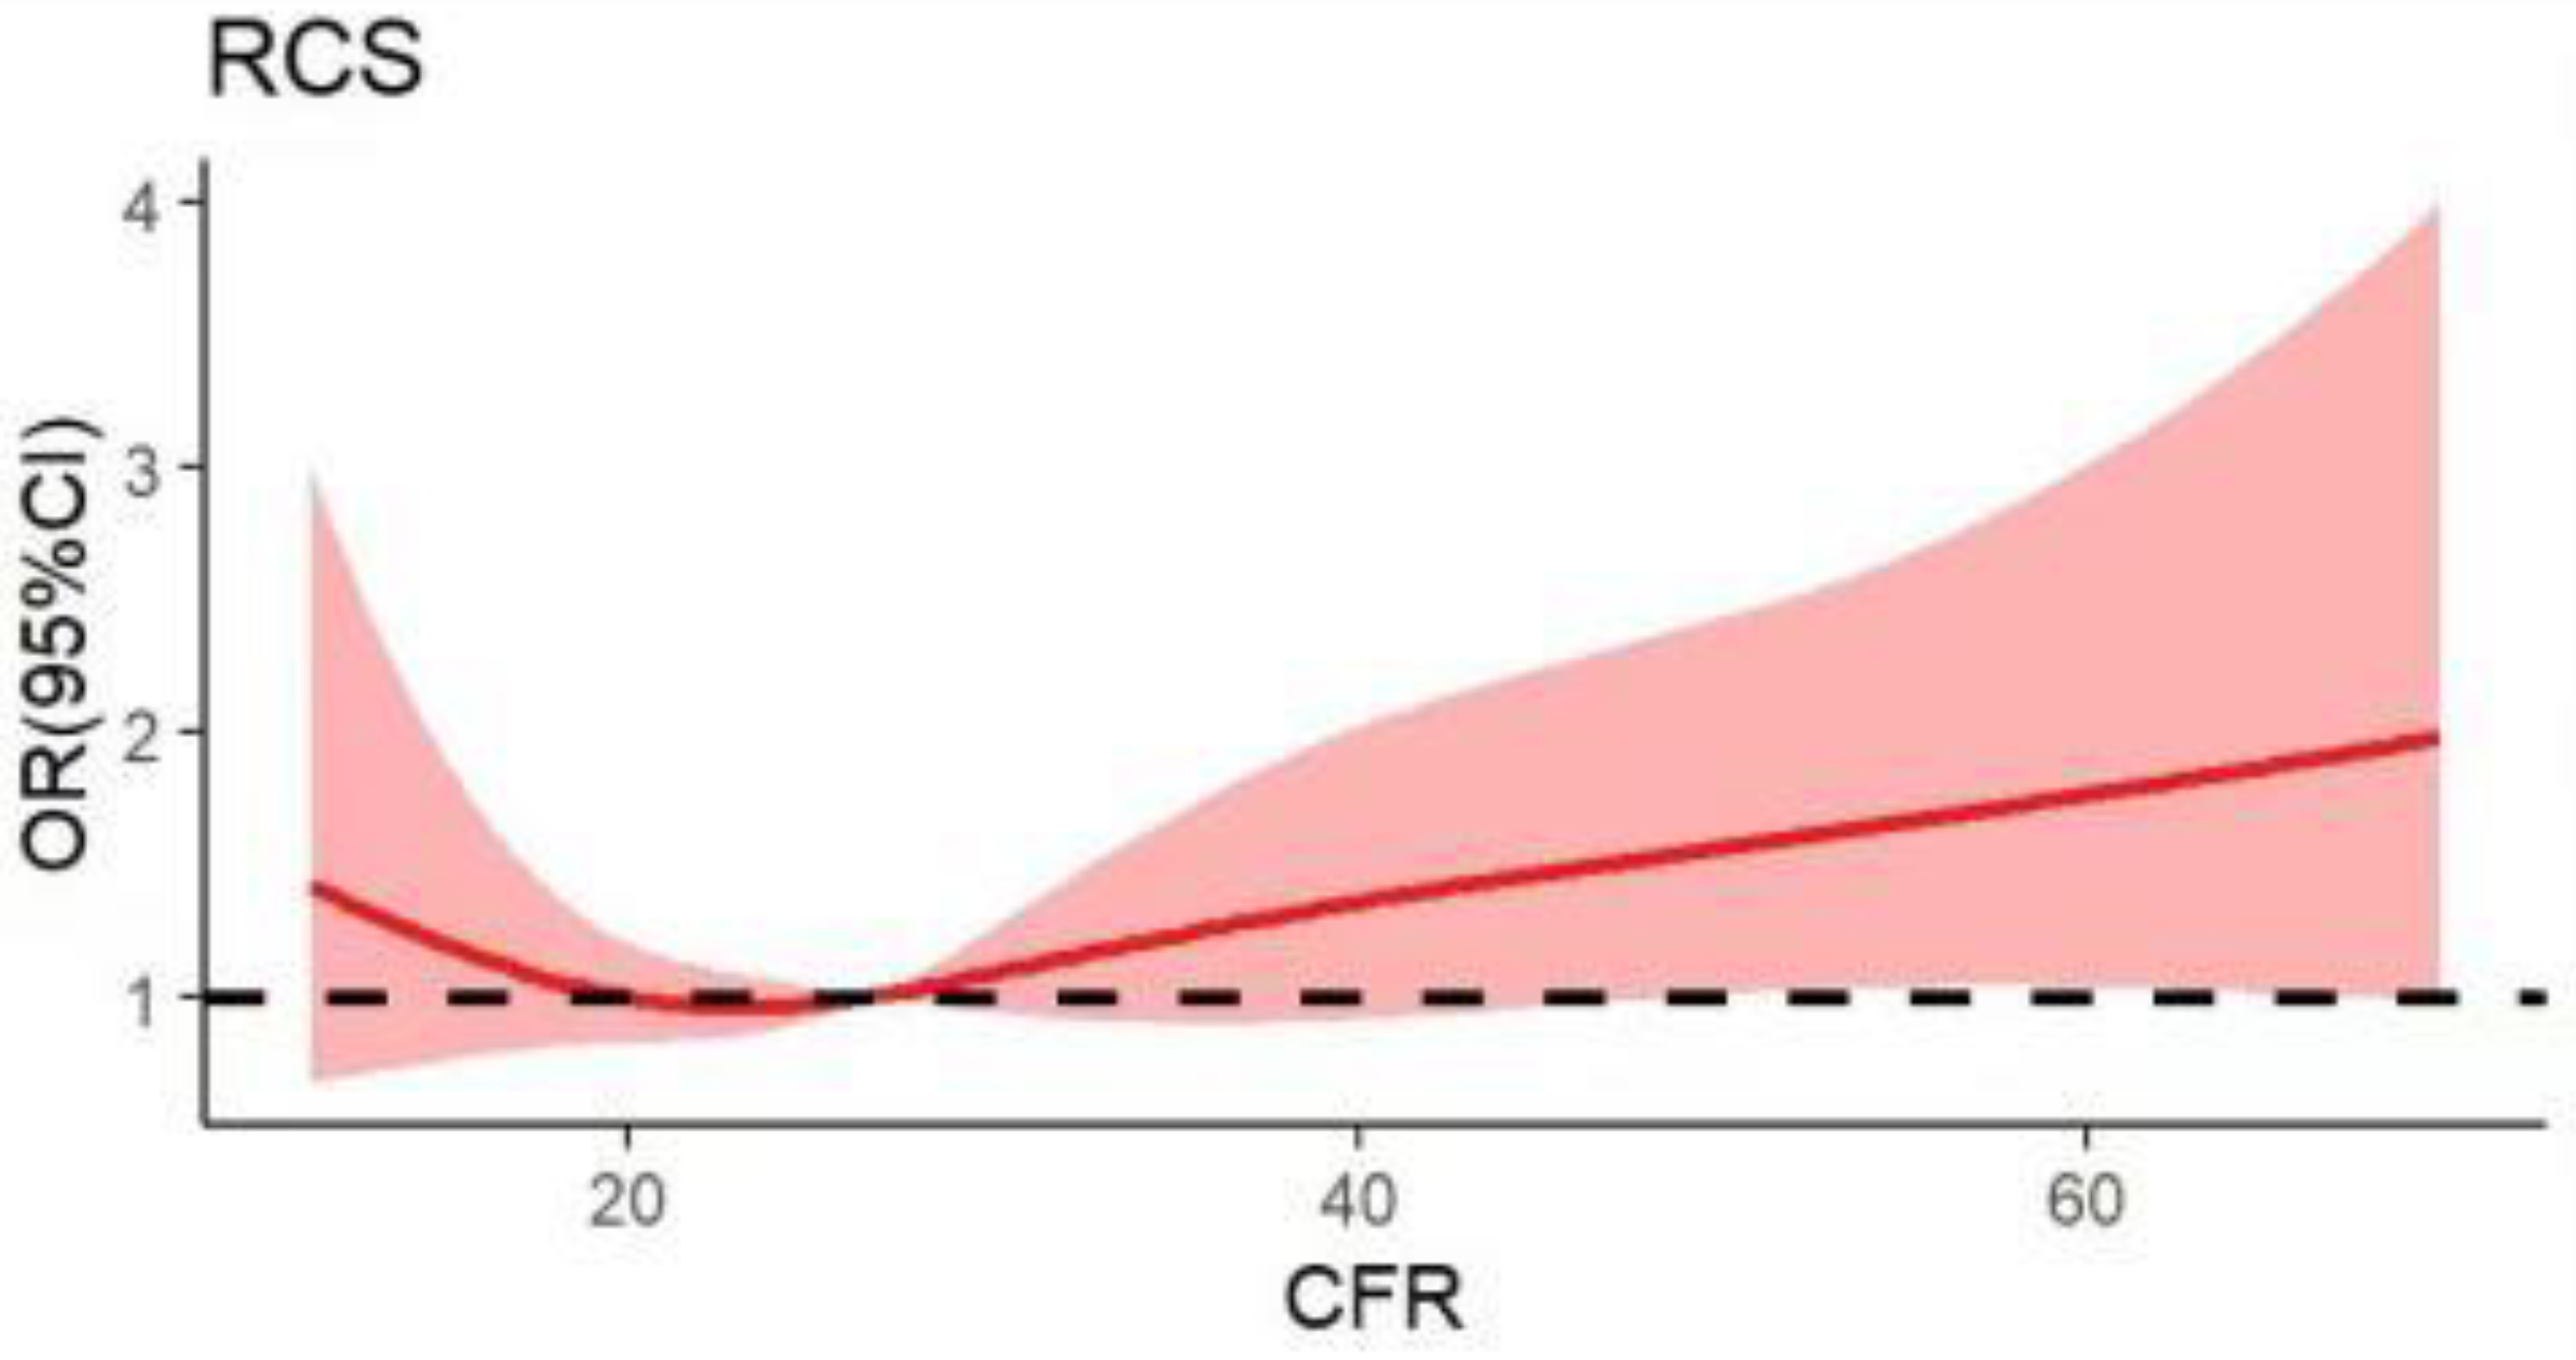
- Restricted cubic splines (RCS) were plotted by the ggplot2 and rms packages of R software 4.0.2, with nodes assigned at the 5th, 35th, 65th, and 95th percentiles to assess the shape of the relationship between the dietary CFR (continuous data) and BP control.
- (4)
- Binary logistic regression was used to investigate the associations between the dietary CFR, carbohydrate, or DF alone, and poorly controlled rates of SBP and DBP.
3. Results
3.1. General Characteristics of Participants
3.2. The Status of Carbohydrate, Dietary Fiber Intake and CFR
3.3. The Dietary Carbohydrate to Fiber Ratio and the Poor BP-Controlled Rate
3.4. The Association between the Dietary Carbohydrate to Fiber Ratio and SBP Control
3.5. The Association between the Dietary Carbohydrate to Fiber Ratio and DBP Control
4. Discussion
4.1. General Characteristics of Participants
4.2. The Status of Carbohydrate and Dietary Fiber Intake
4.3. Association between Dietary CFR and SBP
4.4. Association between Dietary CFR and DBP
5. Conclusions
6. Strengths and Limitations
Author Contributions
Funding
Institutional Review Board Statement
Informed Consent Statement
Data Availability Statement
Acknowledgments
Conflicts of Interest
References
- Strilchuk, L.; Cincione, R.I.; Fogacci, F.; Cicero, A. Dietary interventions in blood pressure lowering: Current evidence in 2020. Kardiol. Pol. 2020, 78, 659–666. [Google Scholar] [CrossRef] [PubMed]
- Cicero, A.; Veronesi, M.; Fogacci, F. Dietary Intervention to Improve Blood Pressure Control: Beyond Salt Restriction. High Blood Press. Cardiovasc. Prev. 2021, 28, 547–553. [Google Scholar] [CrossRef] [PubMed]
- Williams, B.; Mancia, G.; Spiering, W.; Agabiti, R.E.; Azizi, M.; Burnier, M.; Clement, D.L.; Coca, A.; de Simone, G.; Dominiczak, A.; et al. 2018 ESC/ESH Guidelines for the management of arterial hypertension: The Task Force for the management of arterial hypertension of the European Society of Cardiology and the European Society of Hypertension: The Task Force for the management of arterial hypertension of the European Society of Cardiology and the European Society of Hypertension. J. Hypertens. 2018, 36, 1953–2041. [Google Scholar] [PubMed] [Green Version]
- Chandel, N.S. Carbohydrate Metabolism. Cold Spring Harb. Perspect. Biol. 2021, 13, a040568. [Google Scholar] [CrossRef]
- Huang, L.; Wang, Z.; Wang, H.; Zhao, L.; Jiang, H.; Zhang, B.; Ding, G. Nutrition transition and related health challenges over decades in China. Eur. J. Clin. Nutr. 2021, 75, 247–252. [Google Scholar] [CrossRef]
- Song, S.; Song, Y. Three types of a high-carbohydrate diet are differently associated with cardiometabolic risk factors in Korean adults. Eur. J. Nutr. 2019, 58, 3279–3289. [Google Scholar] [CrossRef]
- Shon, J.; Han, Y.; Park, Y.J. Effects of Dietary Fat to Carbohydrate Ratio on Obesity Risk Depending on Genotypes of Circadian Genes. Nutrients 2022, 14, 478. [Google Scholar] [CrossRef]
- Hall, J.E.; Mouton, A.J.; Da, S.A.; Omoto, A.; Wang, Z.; Li, X.; Do, C.J. Obesity, kidney dysfunction, and inflammation: Interactions in hypertension. Cardiovasc. Res. 2021, 117, 1859–1876. [Google Scholar] [CrossRef]
- Ahn, S.K.; Lee, J.M.; Ji, S.M.; Kim, K.H.; Park, J.H.; Hyun, M.K. Incidence Hypertension and Fasting Blood Glucose from Real-World Data: Retrospective Cohort for 7-Years Follow-Up. Int. J. Environ. Res. Public Health 2021, 18, 2085. [Google Scholar] [CrossRef]
- Reynolds, A.; Mann, J.; Cummings, J.; Winter, N.; Mete, E.; Te, M.L. Carbohydrate quality and human health: A series of systematic reviews and meta-analyses. Lancet 2019, 393, 434–445. [Google Scholar] [CrossRef]
- Buyken, A.E.; Goletzke, J.; Joslowski, G.; Felbick, A.; Cheng, G.; Herder, C.; Brand-Miller, J.C. Association between carbohydrate quality and inflammatory markers: Systematic review of observational and interventional studies. Am. J. Clin. Nutr. 2014, 99, 813–833. [Google Scholar] [CrossRef] [PubMed] [Green Version]
- Alessa, H.B.; Bhupathiraju, S.N.; Malik, V.S.; Wedick, N.M.; Campos, H.; Rosner, B.; Willett, W.C.; Hu, F.B. Carbohydrate quality and quantity and risk of type 2 diabetes in US women. Am. J. Clin. Nutr. 2015, 102, 1543–1553. [Google Scholar] [CrossRef] [PubMed] [Green Version]
- Alessa, H.B.; Cohen, R.; Malik, V.S.; Adebamowo, S.N.; Rimm, E.B.; Manson, J.E.; Willett, W.C.; Hu, F.B. Carbohydrate quality and quantity and risk of coronary heart disease among US women and men. Am. J. Clin. Nutr. 2018, 107, 257–267. [Google Scholar] [CrossRef] [PubMed] [Green Version]
- Gopinath, B.; Flood, V.M.; Kifley, A.; Louie, J.C.; Mitchell, P. Association Between Carbohydrate Nutrition and Successful Aging Over 10 Years. J. Gerontol. A Biol. Sci. Med. Sci. 2016, 71, 1335–1340. [Google Scholar] [CrossRef] [PubMed]
- Willett, W.C.; Liu, S. Carbohydrate quality and health: Distilling simple truths from complexity. Am. J. Clin. Nutr. 2019, 110, 803–804. [Google Scholar] [CrossRef]
- Sawicki, C.M.; Lichtenstein, A.H.; Rogers, G.T.; Jacques, P.F.; Ma, J.; Saltzman, E.; Mckeown, N.M. Comparison of Indices of Carbohydrate Quality and Food Sources of Dietary Fiber on Longitudinal Changes in Waist Circumference in the Framingham Offspring Cohort. Nutrients 2021, 13, 997. [Google Scholar] [CrossRef]
- Makki, K.; Deehan, E.C.; Walter, J.; Backhed, F. The Impact of Dietary Fiber on Gut Microbiota in Host Health and Disease. Cell Host Microbe 2018, 23, 705–715. [Google Scholar] [CrossRef] [Green Version]
- Xue, Y.; Cui, L.; Qi, J.; Ojo, O.; Du, X.; Liu, Y.; Wang, X. The effect of dietary fiber (oat bran) supplement on blood pressure in patients with essential hypertension: A randomized controlled trial. Nutr. Metab. Cardiovasc. Dis. 2021, 31, 2458–2470. [Google Scholar] [CrossRef]
- Catapano, G.; Pedone, C.; Nunziata, E.; Zizzo, A.; Passantino, A.; Incalzi, R.A. Nutrient intake and serum cytokine pattern in elderly people with heart failure. Eur. J. Heart Fail. 2008, 10, 428–434. [Google Scholar] [CrossRef]
- Holscher, H.D. Dietary fiber and prebiotics and the gastrointestinal microbiota. Gut Microbes 2017, 8, 172–184. [Google Scholar] [CrossRef]
- Reynolds, A.N.; Akerman, A.; Kumar, S.; Diep, P.H.; Coffey, S.; Mann, J. Dietary fibre in hypertension and cardiovascular disease management: Systematic review and meta-analyses. BMC Med. 2022, 20, 139. [Google Scholar] [CrossRef] [PubMed]
- Li, Q.; Liu, C.; Zhang, S.; Li, R.; Zhang, Y.; He, P.; Zhang, Z.; Liu, M.; Zhou, C.; Ye, Z.; et al. Dietary Carbohydrate Intake and New-Onset Hypertension: A Nationwide Cohort Study in China. Hypertension 2021, 78, 422–430. [Google Scholar] [CrossRef] [PubMed]
- Makhani, S.S.; Davies, C.; George, K.A.; Castro, G.; Rodriguez, D.L.V.P.; Barengo, N.C. Carbohydrate-to-Fiber Ratio, a Marker of Dietary Intake, as an Indicator of Depressive Symptoms. Cureus 2021, 13, e17996. [Google Scholar] [CrossRef] [PubMed]
- Fontanelli, M.M.; Micha, R.; Sales, C.H.; Liu, J.; Mozaffarian, D.; Fisberg, R.M. Application of the </= 10:1 carbohydrate to fiber ratio to identify healthy grain foods and its association with cardiometabolic risk factors. Eur. J. Nutr. 2020, 59, 3269–3279. [Google Scholar] [CrossRef] [PubMed]
- Kaye, D.M.; Shihata, W.A.; Jama, H.A.; Tsyganov, K.; Ziemann, M.; Kiriazis, H.; Horlock, D.; Vijay, A.; Giam, B.; Vinh, A.; et al. Deficiency of Prebiotic Fiber and Insufficient Signaling Through Gut Metabolite-Sensing Receptors Leads to Cardiovascular Disease. Circulation 2020, 141, 1393–1403. [Google Scholar] [CrossRef]
- Kopp, W. Pathogenesis and etiology of essential hypertension: Role of dietary carbohydrate. Med. Hypotheses 2005, 64, 782–787. [Google Scholar] [CrossRef]
- Guidelines for the Prevention and Control of Hypertension in China (2018 Revised Edition). Chin. Cardiovasc. J. 2019, 24, 24–56.
- Bajinka, O.; Tan, Y.; Abdelhalim, K.A.; Ozdemir, G.; Qiu, X. Extrinsic factors influencing gut microbes, the immediate consequences and restoring eubiosis. AMB Express 2020, 10, 130. [Google Scholar] [CrossRef]
- Gu, A.; Huang, J.; Jiang, N. The effectiveness of a 3-day dietary diary intervention in peritoneal dialysis patients. Chin. J. Nurs. 2014, 49, 157–160. [Google Scholar]
- Sharman, J.E.; La Gerche, A.; Coombes, J.S. Exercise and Cardiovascular Risk in Patients with Hypertension. Am. J. Hypertens. 2015, 28, 147–158. [Google Scholar] [CrossRef] [Green Version]
- Wang, F.; Luo, X.; Zhang, J.; Chen, F. The use of visual analogue rating scales in the consultation of influenza patients. Chin. Gen. Pract. 2019, 22, 2472–2475. [Google Scholar]
- Menzel, J.; Abraham, K.; Stangl, G.I.; Ueland, P.M.; Obeid, R.; Schulze, M.B.; Herter-Aeberli, I.; Schwerdtle, T.; Weikert, C. Vegan Diet and Bone Health-Results from the Cross-Sectional RBVD Study. Nutrients 2021, 13, 685. [Google Scholar] [CrossRef] [PubMed]
- Aziz, I.; Whitehead, W.E.; Palsson, O.S.; Törnblom, H.; Simrén, M.; Sahlgrenska, A.; Institute of Medicine, D.O.I.M.; Göteborgs, U.; Gothenburg, U.; Institutionen För Medicin, A.F.I.O.; et al. An approach to the diagnosis and management of Rome IV functional disorders of chronic constipation. Expert Rev. Gastroent. 2020, 14, 39–46. [Google Scholar] [CrossRef] [PubMed]
- Oparil, S.; Acelajado, M.C.; Bakris, G.L.; Berlowitz, D.R.; Cifkova, R.; Dominiczak, A.F.; Grassi, G.; Jordan, J.; Poulter, N.R.; Rodgers, A.; et al. Hypertension. Nat. Rev. Dis. Primers. 2018, 4, 18014. [Google Scholar] [CrossRef] [Green Version]
- Schalet, B.D.; Pilkonis, P.A.; Yu, L.; Dodds, N.; Johnston, K.L.; Yount, S.; Riley, W.; Cella, D. Clinical validity of PROMIS Depression, Anxiety, and Anger across diverse clinical samples. J. Clin. Epidemiol. 2016, 73, 119–127. [Google Scholar] [CrossRef] [Green Version]
- Sunderland, M.; Batterham, P.; Calear, A.; Carragher, N. Validity of the PROMIS depression and anxiety common metrics in an online sample of Australian adults. Qual. Life Res. 2018, 27, 2453–2458. [Google Scholar] [CrossRef]
- Zhang, J.; Wang, Z.; Du, W.; Huang, F.; Jiang, H.; Bai, J.; Zhang, X.; Zhang, B.; Wang, H. Twenty-Five-Year Trends in Dietary Patterns among Chinese Adults from 1991 to 2015. Nutrients 2021, 13, 1327. [Google Scholar] [CrossRef]
- Lu, J.; Lu, Y.; Wang, X.; Li, X.; Linderman, G.C.; Wu, C.; Cheng, X.; Mu, L.; Zhang, H.; Liu, J.; et al. Prevalence, awareness, treatment, and control of hypertension in China: Data from 1·7 million adults in a population-based screening study (China PEACE Million Persons Project). Lancet 2017, 390, 2549–2558. [Google Scholar] [CrossRef]
- Tuoyire, D.A.; Ayetey, H. Gender differences in the association between marital status and hypertension in Ghana. J. Biosoc. Sci. 2019, 51, 313–334. [Google Scholar] [CrossRef]
- Wu, J.; Li, T.; Song, X.; Sun, W.; Zhang, Y.; Liu, Y.; Li, L.; Yu, Y.; Liu, Y.; Qi, C.; et al. Prevalence and distribution of hypertension and related risk factors in Jilin Province, China 2015: A cross-sectional study. BMJ Open 2018, 8, e20126. [Google Scholar] [CrossRef] [Green Version]
- Hsu, H. Age Differences in Work Stress, Exhaustion, Well-Being, and Related Factors from an Ecological Perspective. Int. J. Env. Res. Public Health 2018, 16, 50. [Google Scholar] [CrossRef] [PubMed] [Green Version]
- Landsbergis, P.A.; Dobson, M.; Koutsouras, G.; Schnall, P. Job strain and ambulatory blood pressure: A meta-analysis and systematic review. Am. J. Public Health 2013, 103, e61–e71. [Google Scholar] [CrossRef] [PubMed]
- Van Oort, S.; Beulens, J.; van Ballegooijen, A.J.; Grobbee, D.E.; Larsson, S.C. Association of Cardiovascular Risk Factors and Lifestyle Behaviors with Hypertension: A Mendelian Randomization Study. Hypertension 2020, 76, 1971–1979. [Google Scholar] [CrossRef] [PubMed]
- Pan, J.; Wu, L.; Wang, H.; Lei, T.; Hu, B.; Xue, X.; Li, Q. Determinants of hypertension treatment adherence among a Chinese population using the therapeutic adherence scale for hypertensive patients. Medicine 2019, 98, e16116. [Google Scholar] [CrossRef]
- Hamam, M.S.; Kunjummen, E.; Hussain, M.S.; Nasereldin, M.; Bennett, S.; Miller, J. Anxiety, Depression, and Pain: Considerations in the Treatment of Patients with Uncontrolled Hypertension. Curr. Hypertens. Rep. 2020, 22, 106. [Google Scholar] [CrossRef]
- Vincent, M.J.; Allen, B.; Palacios, O.M.; Haber, L.T.; Maki, K.C. Meta-regression analysis of the effects of dietary cholesterol intake on LDL and HDL cholesterol. Am. J. Clin. Nutr. 2019, 109, 7–16. [Google Scholar] [CrossRef] [Green Version]
- Macdonald, C.; Madika, A.; Bonnet, F.; Fagherazzi, G.; Lajous, M.; Boutron-Ruault, M. Cholesterol and Egg Intakes, and Risk of Hypertension in a Large Prospective Cohort of French Women. Nutrients 2020, 12, 1350. [Google Scholar] [CrossRef]
- Huang, L.; Wang, H.; Wang, Z.; Wang, Y.; Zhang, B.; Ding, G. Associations of Dietary Sodium, Potassium, and Sodium to Potassium Ratio with Blood Pressure- Regional Disparities in China. Nutrients 2020, 12, 366. [Google Scholar] [CrossRef] [Green Version]
- Zhai, F.Y.; Du, S.F.; Wang, Z.H.; Zhang, J.G.; Du, W.W.; Popkin, B.M. Dynamics of the Chinese diet and the role of urbanicity, 1991-2011. Obes. Rev. 2014, 15, 16–26. [Google Scholar] [CrossRef] [Green Version]
- Bu, T.; Tang, D.; Liu, Y.; Chen, D. Trends in Dietary Patterns and Diet-related Behaviors in China. Am. J. Health Behav. 2021, 45, 371–383. [Google Scholar] [CrossRef]
- Yu, D.; He, Y.; Guo, Q.; Fang, H.; Xu, X.; Fang, Y.; Li, J.; Zhao, L. Trends of energy and nutrients intake among Chinese population in 2002–2012. Wei Sheng Yan Jiu 2016, 45, 527–533. [Google Scholar] [PubMed]
- Comerford, K.B.; Papanikolaou, Y.; Jones, J.M.; Rodriguez, J.; Slavin, J.; Angadi, S.; Drewnowski, A. Toward an Evidence-Based Definition and Classification of Carbohydrate Food Quality: An Expert Panel Report. Nutrients 2021, 13, 2667. [Google Scholar] [CrossRef] [PubMed]
- Chaignon, M.M.; Mourad, J.J.; Guedon, J. Comparative effects of antihypertensive drugs on systolic blood pressure. J. Hypertens. Suppl. 1993, 11, S27–S31. [Google Scholar] [CrossRef]
- Global, regional, and national comparative risk assessment of 84 behavioural, environmental and occupational, and metabolic risks or clusters of risks for 195 countries and territories, 1990–2017: A systematic analysis for the Global Burden of Disease Study 2017. Lancet 2018, 392, 1923–1994.
- Franklin, S.S.; Jacobs, M.J.; Wong, N.D.; L′Italien, G.J.; Lapuerta, P. Predominance of isolated systolic hypertension among middle-aged and elderly US hypertensives: Analysis based on National Health and Nutrition Examination Survey (NHANES) III. Hypertension 2001, 37, 869–874. [Google Scholar] [CrossRef] [PubMed] [Green Version]
- Mahajan, S.; Zhang, D.; He, S.; Lu, Y.; Gupta, A.; Spatz, E.S.; Lu, J.; Huang, C.; Herrin, J.; Liu, S.; et al. Prevalence, Awareness, and Treatment of Isolated Diastolic Hypertension: Insights from the China PEACE Million Persons Project. J. Am. Heart Assoc. 2019, 8, e12954. [Google Scholar] [CrossRef] [PubMed] [Green Version]
- Li, Y.; Wei, F.F.; Wang, S.; Cheng, Y.B.; Wang, J.G. Cardiovascular risks associated with diastolic blood pressure and isolated diastolic hypertension. Curr. Hypertens. Rep. 2014, 16, 489. [Google Scholar] [CrossRef]
- Spreadbury, I. Comparison with ancestral diets suggests dense acellular carbohydrates promote an inflammatory microbiota, and may be the primary dietary cause of leptin resistance and obesity. Diabetes Metab. Syndr. Obes. 2012, 5, 175–189. [Google Scholar] [CrossRef] [Green Version]
- Kristek, A.; Wiese, M.; Heuer, P.; Kosik, O.; Schär, M.Y.; Soycan, G.; Alsharif, S.; Kuhnle, G.G.C.; Walton, G.; Spencer, J.P.E. Oat bran, but not its isolated bioactive β-glucans or polyphenols, have a bifidogenic effect in an in vitro fermentation model of the gut microbiota. Brit. J. Nutr. 2019, 121, 549–559. [Google Scholar] [CrossRef]
- Robles Vera, I.; Toral, M.; la Visitación, N.; Sánchez, M.; Gómez Guzmán, M.; Romero, M.; Yang, T.; Izquierdo Garcia, J.L.; Jiménez, R.; Ruiz Cabello, J.; et al. Probiotics Prevent Dysbiosis and the Rise in Blood Pressure in Genetic Hypertension: Role of Short-Chain Fatty Acids. Mol. Nutr. Food Res. 2020, 64, e1900616. [Google Scholar] [CrossRef]
- Pluznick, J.L.; Protzko, R.J.; Gevorgyan, H.; Peterlin, Z.; Sipos, A.; Han, J.; Brunet, I.; Wan, L.; Rey, F.; Wang, T.; et al. Olfactory receptor responding to gut microbiota-derived signals plays a role in renin secretion and blood pressure regulation. Proc. Natl. Acad. Sci. USA 2013, 110, 4410–4415. [Google Scholar] [CrossRef] [Green Version]
- Natarajan, N.; Hori, D.; Flavahan, S.; Steppan, J.; Flavahan, N.A.; Berkowitz, D.E.; Pluznick, J.L. Microbial short chain fatty acid metabolites lower blood pressure via endothelial G protein-coupled receptor 41. Physiol. Genom. 2016, 48, 826–834. [Google Scholar] [CrossRef] [PubMed] [Green Version]
- Nøhr, M.K.; Egerod, K.L.; Christiansen, S.H.; Gille, A.; Offermanns, S.; Schwartz, T.W.; Møller, M. Expression of the short chain fatty acid receptor GPR41/FFAR3 in autonomic and somatic sensory ganglia. Neuroscience 2015, 290, 126–137. [Google Scholar] [CrossRef] [PubMed]
- Moreira, T.S.; Antunes, V.R.; Falquetto, B.; Marina, N. Long-term stimulation of cardiac vagal preganglionic neurons reduces blood pressure in the spontaneously hypertensive rat. J. Hypertens. 2018, 36, 2444–2452. [Google Scholar] [CrossRef] [PubMed]


| Characteristics | SBP Control ± s/M (P25,P75)/n(%) | DBP Control ± s/M (P25,P75)/n(%) | |||||
|---|---|---|---|---|---|---|---|
| Poor (n = 187) | t/χ2/z | p | Poor (n = 179) | t/χ2/z | p | ||
| Demographic Information | |||||||
| Age (year) | 50.09 ± 13.90 | 1.712 a | 0.088 | 46.15 ± 11.56 | 7.393 a | <0.001 *** | |
| Sex | Male | 115 (61.5) | 0.210 b | 0.647 | 124 (69.3) | 5.350 b | 0.021 * |
| Marital status | Single | 1 (0.5) | 11.327 c | 0.001 ** | 5 (2.8) | 1.221 c | 0.625 |
| Married | 185 (98.9) | 173 (96.6) | |||||
| Others | 1 (0.5) | 1 (0.6) | |||||
| Education degree | High school and above | 109 (58.3) | 1.859 b | 0.173 | 121 (67.6) | 20.402 b | <0.001 *** |
| Occupational status | On the job | 121 (64.7) | 1.922 c | 0.393 | 143 (79.9) | 40.333 c | <0.001 *** |
| Retired | 62 (33.2) | 34 (19.0) | |||||
| No job | 4 (2.1) | 2 (1.1) | |||||
| Medical payment method | Medical Insurance | 12 (6.4) | 1.097 b | 0.578 | 11 (6.1) | 2.135 b | 0.344 |
| Agricultural insurance | 14 (7.5) | 11 (6.1) | |||||
| Self-paying | 161 (86.1) | 157 (87.7) | |||||
| Regular exercise | No | 137 (73.3) | 0.058 b | 0.810 | 131 (73.2) | 0.069 b | 0.793 |
| Duration of sleep (h/day) | 6.82 ± 1.07 | 0.445 a | 0.657 | 6.90 ± 1.05 | −0.923 a | 0.357 | |
| Quality of sleep | Good | 16 (8.6) | 2.099 b | 0.350 | 14 (7.8) | 0.916 b | 0.633 |
| Fair | 113 (60.4) | 111 (62.0) | |||||
| Poor | 58 (31.0) | 54 (30.2) | |||||
| Smoking status | Yes | 49 (26.2) | 0.041 b | 0.840 | 60 (33.5) | 9.375 b | 0.002 ** |
| Alcohol drinking | Yes | 47 (25.1) | 0.236 b | 0.627 | 59 (33.0) | 13.031 b | <0.001 *** |
| Clinical Information | |||||||
| BMI (kg/m2) | 25.15 (23.35, 27.43) | −1.757 d | 0.079 | 25.35 (23.84, 27.83) | −3.572 d | <0.001 * | |
| Constipation | Yes | 25 (13.4) | 5.949 b | 0.015 * | 21 (11.7) | 1.931 b | 0.165 |
| Duration of HTN (year) | 2.00 (0.50, 7.00) | −3.852 d | <0.001 *** | 2.00 (0.50, 7.00) | −3.593 d | <0.001 *** | |
| Taking drugs | Yes | 130 (69.5) | 11.021 b | 0.001 ** | 118 (65.9) | 21.839 b | <0.001 *** |
| Complication | Yes | 4 (2.1) | 1.793 e | 0.181 | 1 (0.6) | 0.172 e | 0.678 |
| Comorbidity | Yes | 27 (14.4) | 0.234 b | 0.629 | 21 (11.7) | 0.792 b | 0.373 |
| Anxiety | Yes | 45 (24.1) | 6.432 b | 0.011 * | 44 (24.6) | 7.147 b | 0.008 ** |
| Depression | Yes | 52 (27.8) | 13.460 b | <0.001 *** | 54 (30.2) | 20.757 b | <0.001 *** |
| Nutrition intake (d) | |||||||
| Energy (kcal) | 1966.12 ± 329.44 | 1.597 a | 0.111 | 2005.84 ± 348.66 | −0.303 a | 0.762 | |
| Protein (g) | 72.28 ± 22.02 | 1.582 a | 0.114 | 76.71 ± 22.64 | −1.890 a | 0.059 | |
| Fat (g) | 69.29 ± 19.37 | −0.395 a | 0.693 | 70.75 ± 19.49 | −1.631 a | 0.104 | |
| Cholesterol (mg) | 377.29 ± 226.50 | −1.932 a | 0.054 | 379.70 ± 238.81 | −2.056 a | 0.040 * | |
| Calcium (mg) | 456.66 ± 281.03 | 3.866 a | <0.001 *** | 620.03 ± 595.27 | −1.416 a | 0.157 | |
| Potassium (mg) | 1656.10 ± 483.42 | 1.466 a | 0.143 | 1722.64 ± 445.44 | −1.138 a | 0.256 | |
| Sodium (mg) | 2126.86 ± 631.48 | −2.135 a | 0.033 * | 2008.35 ± 843.01 | 0.418 a | 0.676 | |
| Group | Carbohydrate (g/day) | Fiber (g/day) | ||||||
|---|---|---|---|---|---|---|---|---|
| Range | ± S | F | p | Range | ± S | F | p | |
| Q1 | (77.00, 559.00) | 252.49 ± 91.92 | 15.438 | <0.001 *** | (7.30, 28.85) | 16.02 ± 5.48 | 129.740 | <0.001 *** |
| Q2 | (135.00, 454.00) | 274.29 ± 66.61 | (5.40, 21.60) | 11.91 ± 3.10 | ||||
| Q3 | (149.00, 515.00) | 309.41 ± 77.71 | (4.50, 18.50) | 10.18 ± 2.72 | ||||
| Q4 | (191.00, 503.00) | 308.49 ± 63.18 | (2.70, 11.40) | 6.82 ± 2.21 | ||||
| Carbohydrate to Fiber Ratio | SBP Control, n(%) | DBP Control, n(%) | ||||
|---|---|---|---|---|---|---|
| Poor (n = 187) | χ2 | p | Poor (n = 179) | χ2 | p | |
| Q1 (<20.66) | 36 (31.8) | 25.265 | <0.001 *** | 43 (38.0) | 3.473 | 0.324 |
| Q2 (20.66 to <26.69) | 42 (36.2) | 39 (33.6) | ||||
| Q3 (26.69 to <36.05) | 40 (34.7) | 45 (39.1) | ||||
| Q4 (≥36.05) | 69 (60.0) | 52 (45.2) | ||||
| Variable | Crude | Model 1 | Model 2 | Model 3 | |
|---|---|---|---|---|---|
| OR (95% CI) | OR (95% CI) | OR (95% CI) | OR (95% CI) | ||
| Dietary CFR | 1.029 (1.015, 1.044) *** | 1.027 (1.011, 1.043) ** | 1.037 (1.020, 1.055) *** | 1.037 (1.019, 1.055) *** | |
| Group by quartile of CFR | Q1 | 1.00 (Ref.) | 1.00 (Ref.) | 1.00 (Ref.) | 1.00 (Ref.) |
| Q2 | 1.263 (0.730, 2.182) | 1.208 (0.686, 2.128) | 1.212 (0.662, 2.216) | 1.118 (0.602, 2.078) | |
| Q3 | 1.170 (0.675, 2.029) | 1.119 (0.620, 2.021) | 1.323 (0.706, 2.480) | 1.224 (0.645, 2.324) | |
| Q4 | 3.365 (1.952, 5.800) *** | 3.200 (1.752, 5.847) *** | 4.522 (2.356, 8.679) *** | 4.374 (2.236, 8.559) *** | |
| Carbohydrate | Alone | 0.998 (0.995, 1.001) | 0.999 (0.996, 1.002) | 1.001 (0.998, 1.004) | 1.001 (0.998, 1.005) |
| Fiber | Alone | 0.879 (0.835, 0.924) *** | 0.887 (0.839, 0.939) *** | 0.873 (0.822, 0.927) *** | 0.868 (0.814, 0.927) *** |
| Covariates | Cholesterol (mg/day) | - | 1.001 (1.000, 1.002) ** | - | - |
| Calcium (mg/day) | - | 0.999 (0.999, 1.000) * | 0.999 (0.999, 1.000) ** | 0.999 (0.999, 1.000) * | |
| Duration of HTN (year) | - | - | 0.962 (0.932, 0.992) * | 0.967 (0.936, 0.999) * | |
| Taking drugs | - | - | 0.380 (0.219, 0.660) ** | 0.384 (0.221, 0.669) ** | |
| Depression | - | - | 1.969 (1.105, 3.510) * | 1.861 (1.040, 3.328) * | |
| Variable | Crude | Model 1 | Model 2 | Model 3 | |
|---|---|---|---|---|---|
| OR (95% CI) | OR (95% CI) | OR (95% CI) | OR (95% CI) | ||
| Dietary CFR | 1.011 (0.998, 1.024) | 1.016 (1.002, 1.031) * | 1.027 (1.012, 1.043) ** | 1.033 (1.015, 1.051) *** | |
| Group by quartile of CFR | Q2 | 1.00 (Ref.) | 1.00 (Ref.) | 1.00 (Ref.) | 1.00 (Ref.) |
| Q1 | 1.164 (0.678, 1.997) | 1.133 (0.655, 1.960) | 1.246 (0.695, 2.232) | 1.213 (0.644, 2.283) | |
| Q3 | 1.253 (0.732, 2.145) | 1.466 (0.843, 2.550) | 1.962 (1.072, 3.591) * | 1.964 (1.016, 3.795) * | |
| Q4 | 1.634 (0.958, 2.787) | 2.070 (1.179, 3.635) * | 3.179 (1.693, 5.968) *** | 4.291 (2.132, 8.637) *** | |
| Carbohydrate | Alone | 0.999 (0.997, 1.002) | 0.999 (0.996, 1.002) | 1.001 (0.998, 1.005) | 1.004 (1.000, 1.007) |
| Fiber | Alone | 0.966 (0.925, 1.008) | 0.933 (0.888, 0.980) ** | 0.923 (0.876, 0.973) ** | 0.920 (0.869, 0.974) ** |
| Covariates | Duration of HTN (year) | - | - | 0.961 (0.931, 0.991) * | - |
| Taking drugs | - | - | 0.408 (0.243, 0.686) ** | 0.493 (0.281, 0.868) * | |
| Depression | - | - | 2.547 (1.447, 4.484) ** | 2.292 (1.252, 4.194) ** | |
| Age | - | - | - | 0.964 (0.942, 0.986) ** | |
| Education degree | - | - | - | 0.561 (0.335, 0.939) * | |
| Retired | - | - | - | 0.528 (0.297, 0.939) * | |
| Alcohol drinking | - | - | - | 2.225 (1.332, 3.716) ** | |
Publisher’s Note: MDPI stays neutral with regard to jurisdictional claims in published maps and institutional affiliations. |
© 2022 by the authors. Licensee MDPI, Basel, Switzerland. This article is an open access article distributed under the terms and conditions of the Creative Commons Attribution (CC BY) license (https://creativecommons.org/licenses/by/4.0/).
Share and Cite
Dong, Q.; Wang, L.; Hu, H.; Cui, L.; Lu, A.; Qian, C.; Wang, X.; Du, X. Greater Protection of Lower Dietary Carbohydrate to Fiber Ratio (CFR) against Poor Blood Pressure Control in Patients with Essential Hypertension: A Cross-Sectional Study. Nutrients 2022, 14, 4443. https://0-doi-org.brum.beds.ac.uk/10.3390/nu14214443
Dong Q, Wang L, Hu H, Cui L, Lu A, Qian C, Wang X, Du X. Greater Protection of Lower Dietary Carbohydrate to Fiber Ratio (CFR) against Poor Blood Pressure Control in Patients with Essential Hypertension: A Cross-Sectional Study. Nutrients. 2022; 14(21):4443. https://0-doi-org.brum.beds.ac.uk/10.3390/nu14214443
Chicago/Turabian StyleDong, Qingqing, Lili Wang, Hanbing Hu, Lingling Cui, Anping Lu, Chunya Qian, Xiaohua Wang, and Xiaojiao Du. 2022. "Greater Protection of Lower Dietary Carbohydrate to Fiber Ratio (CFR) against Poor Blood Pressure Control in Patients with Essential Hypertension: A Cross-Sectional Study" Nutrients 14, no. 21: 4443. https://0-doi-org.brum.beds.ac.uk/10.3390/nu14214443