
Investigating microRNAs to Explain the Link between Cholesterol Metabolism and NAFLD in Humans: A Systematic Review

Abstract
:1. Introduction
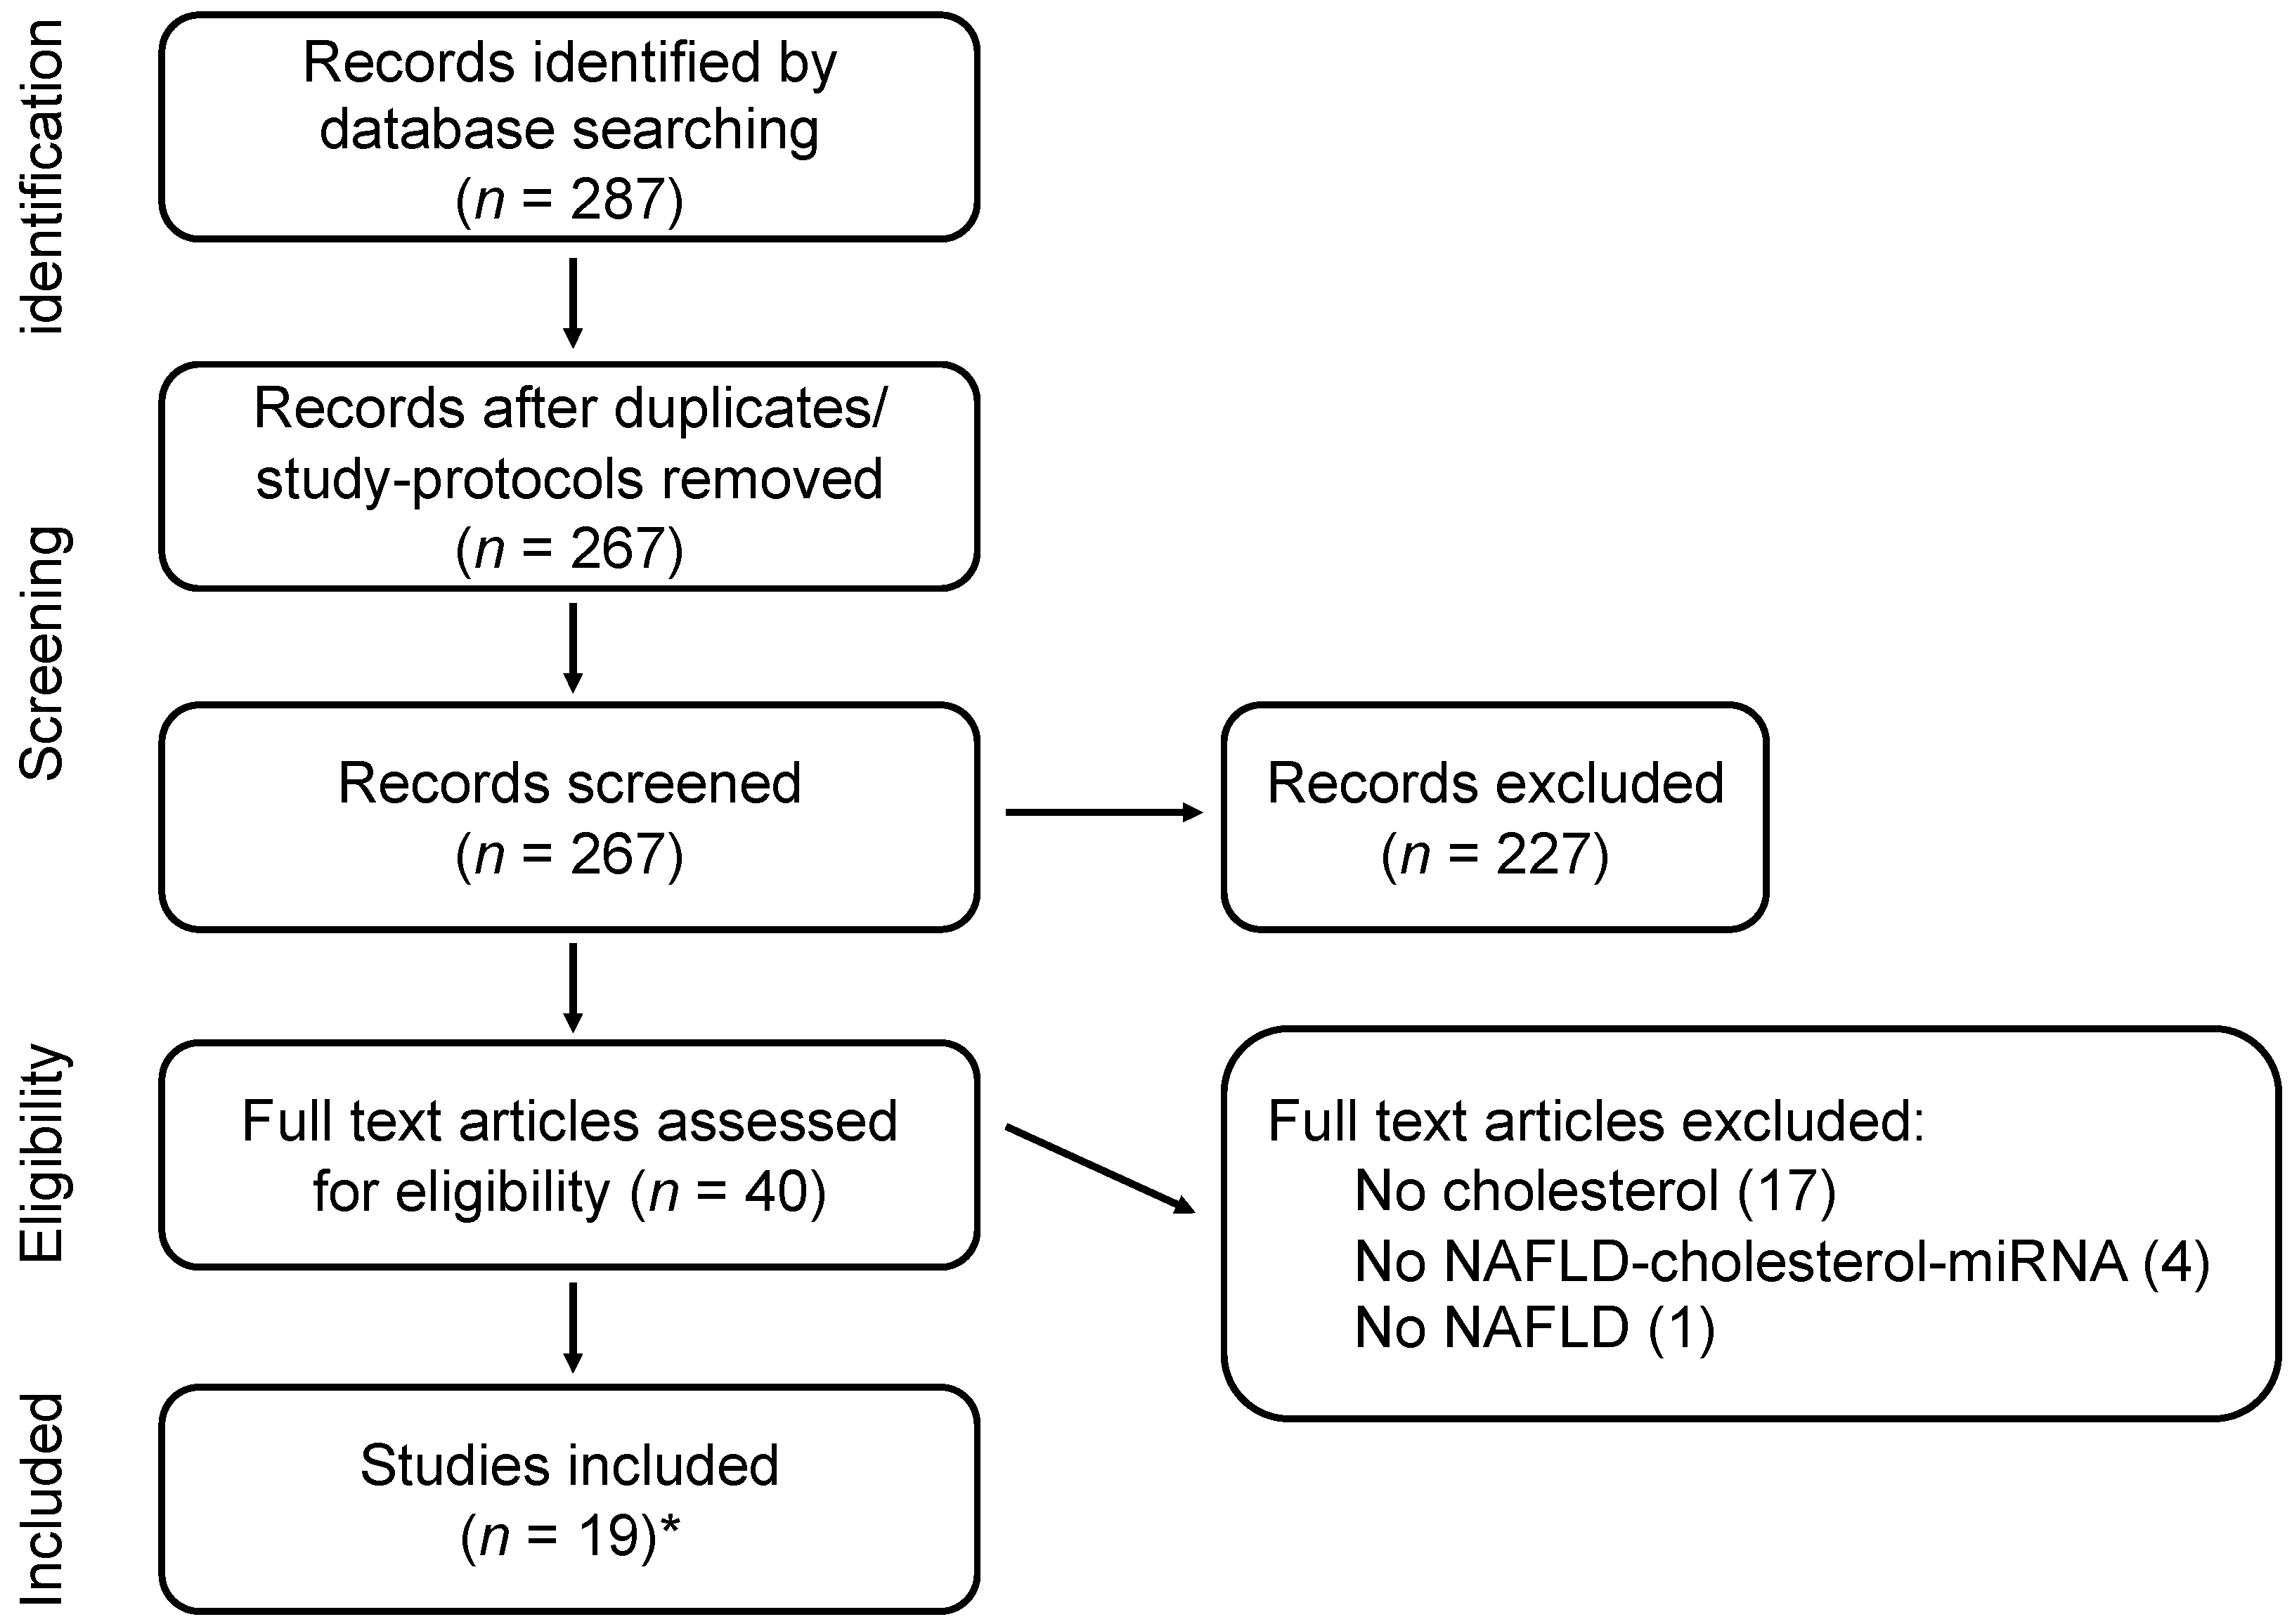
2. Methods
2.1. Search Strategy
2.2. Selection of Studies
2.3. Data Collection
3. Results
3.1. Study Characteristics and Selected miRNAs
3.2. miR122
3.2.1. Associations with NAFLD and Cholesterol Metabolism
3.2.2. Diagnostics
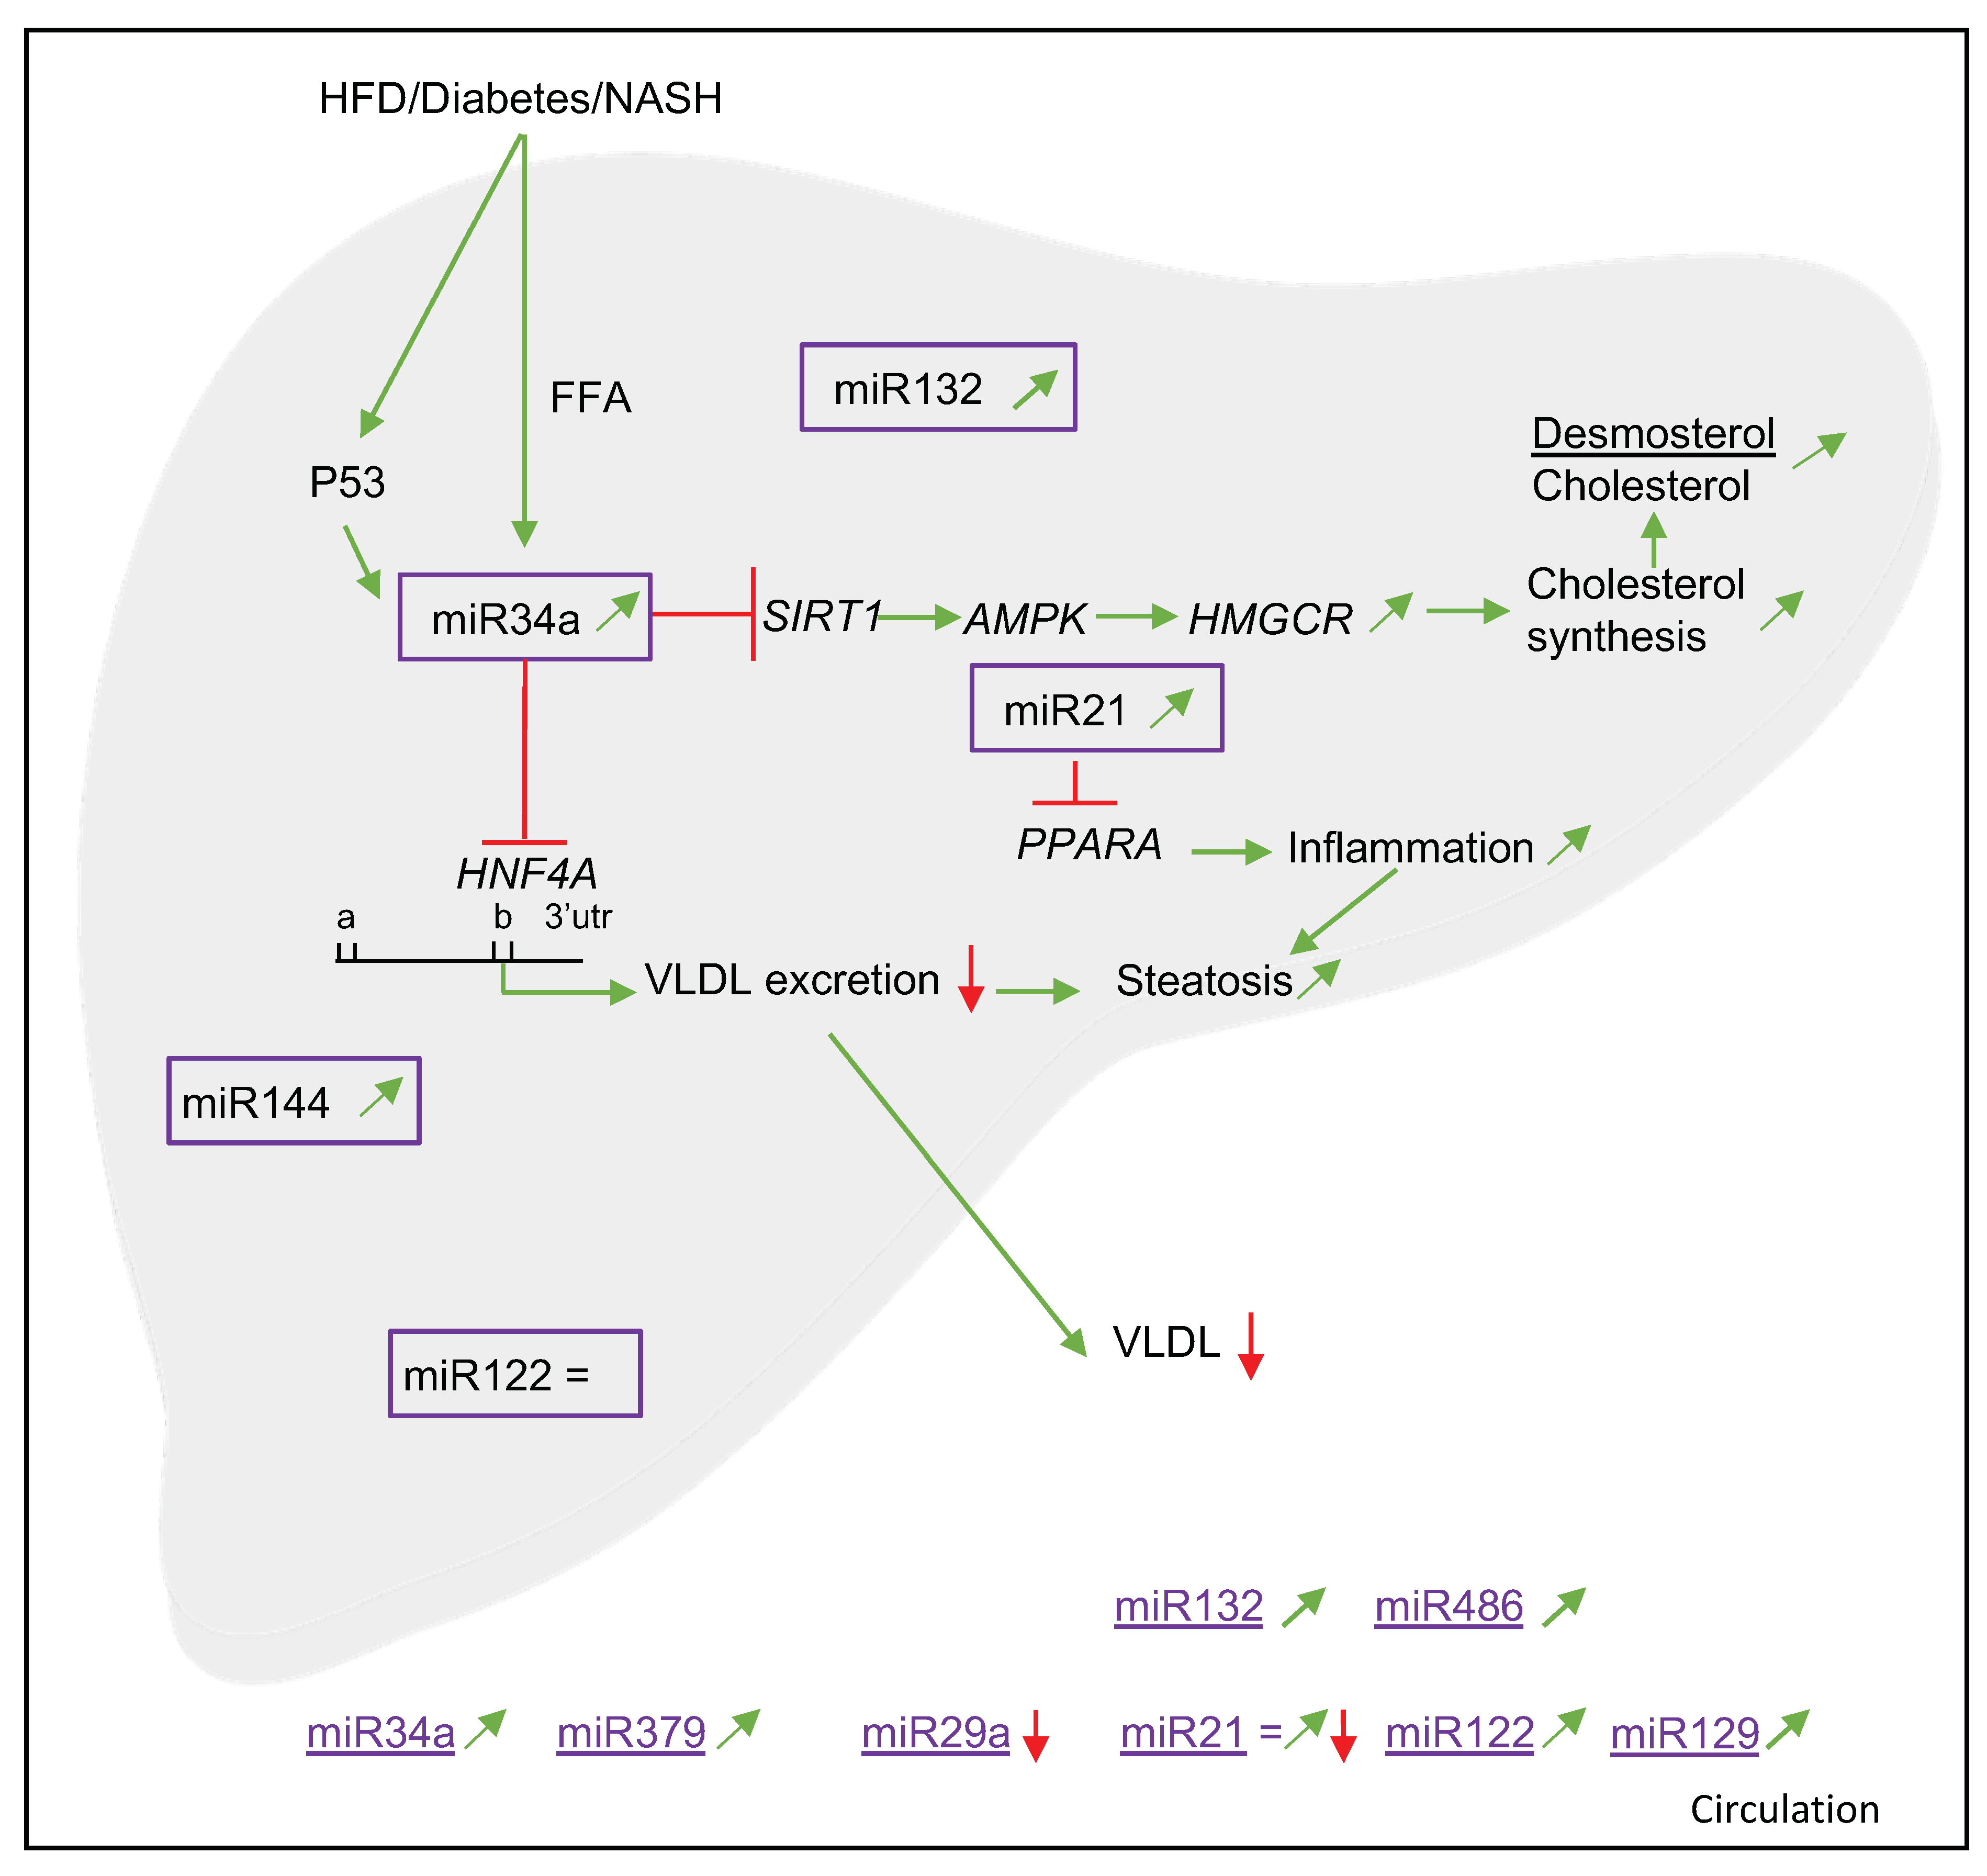
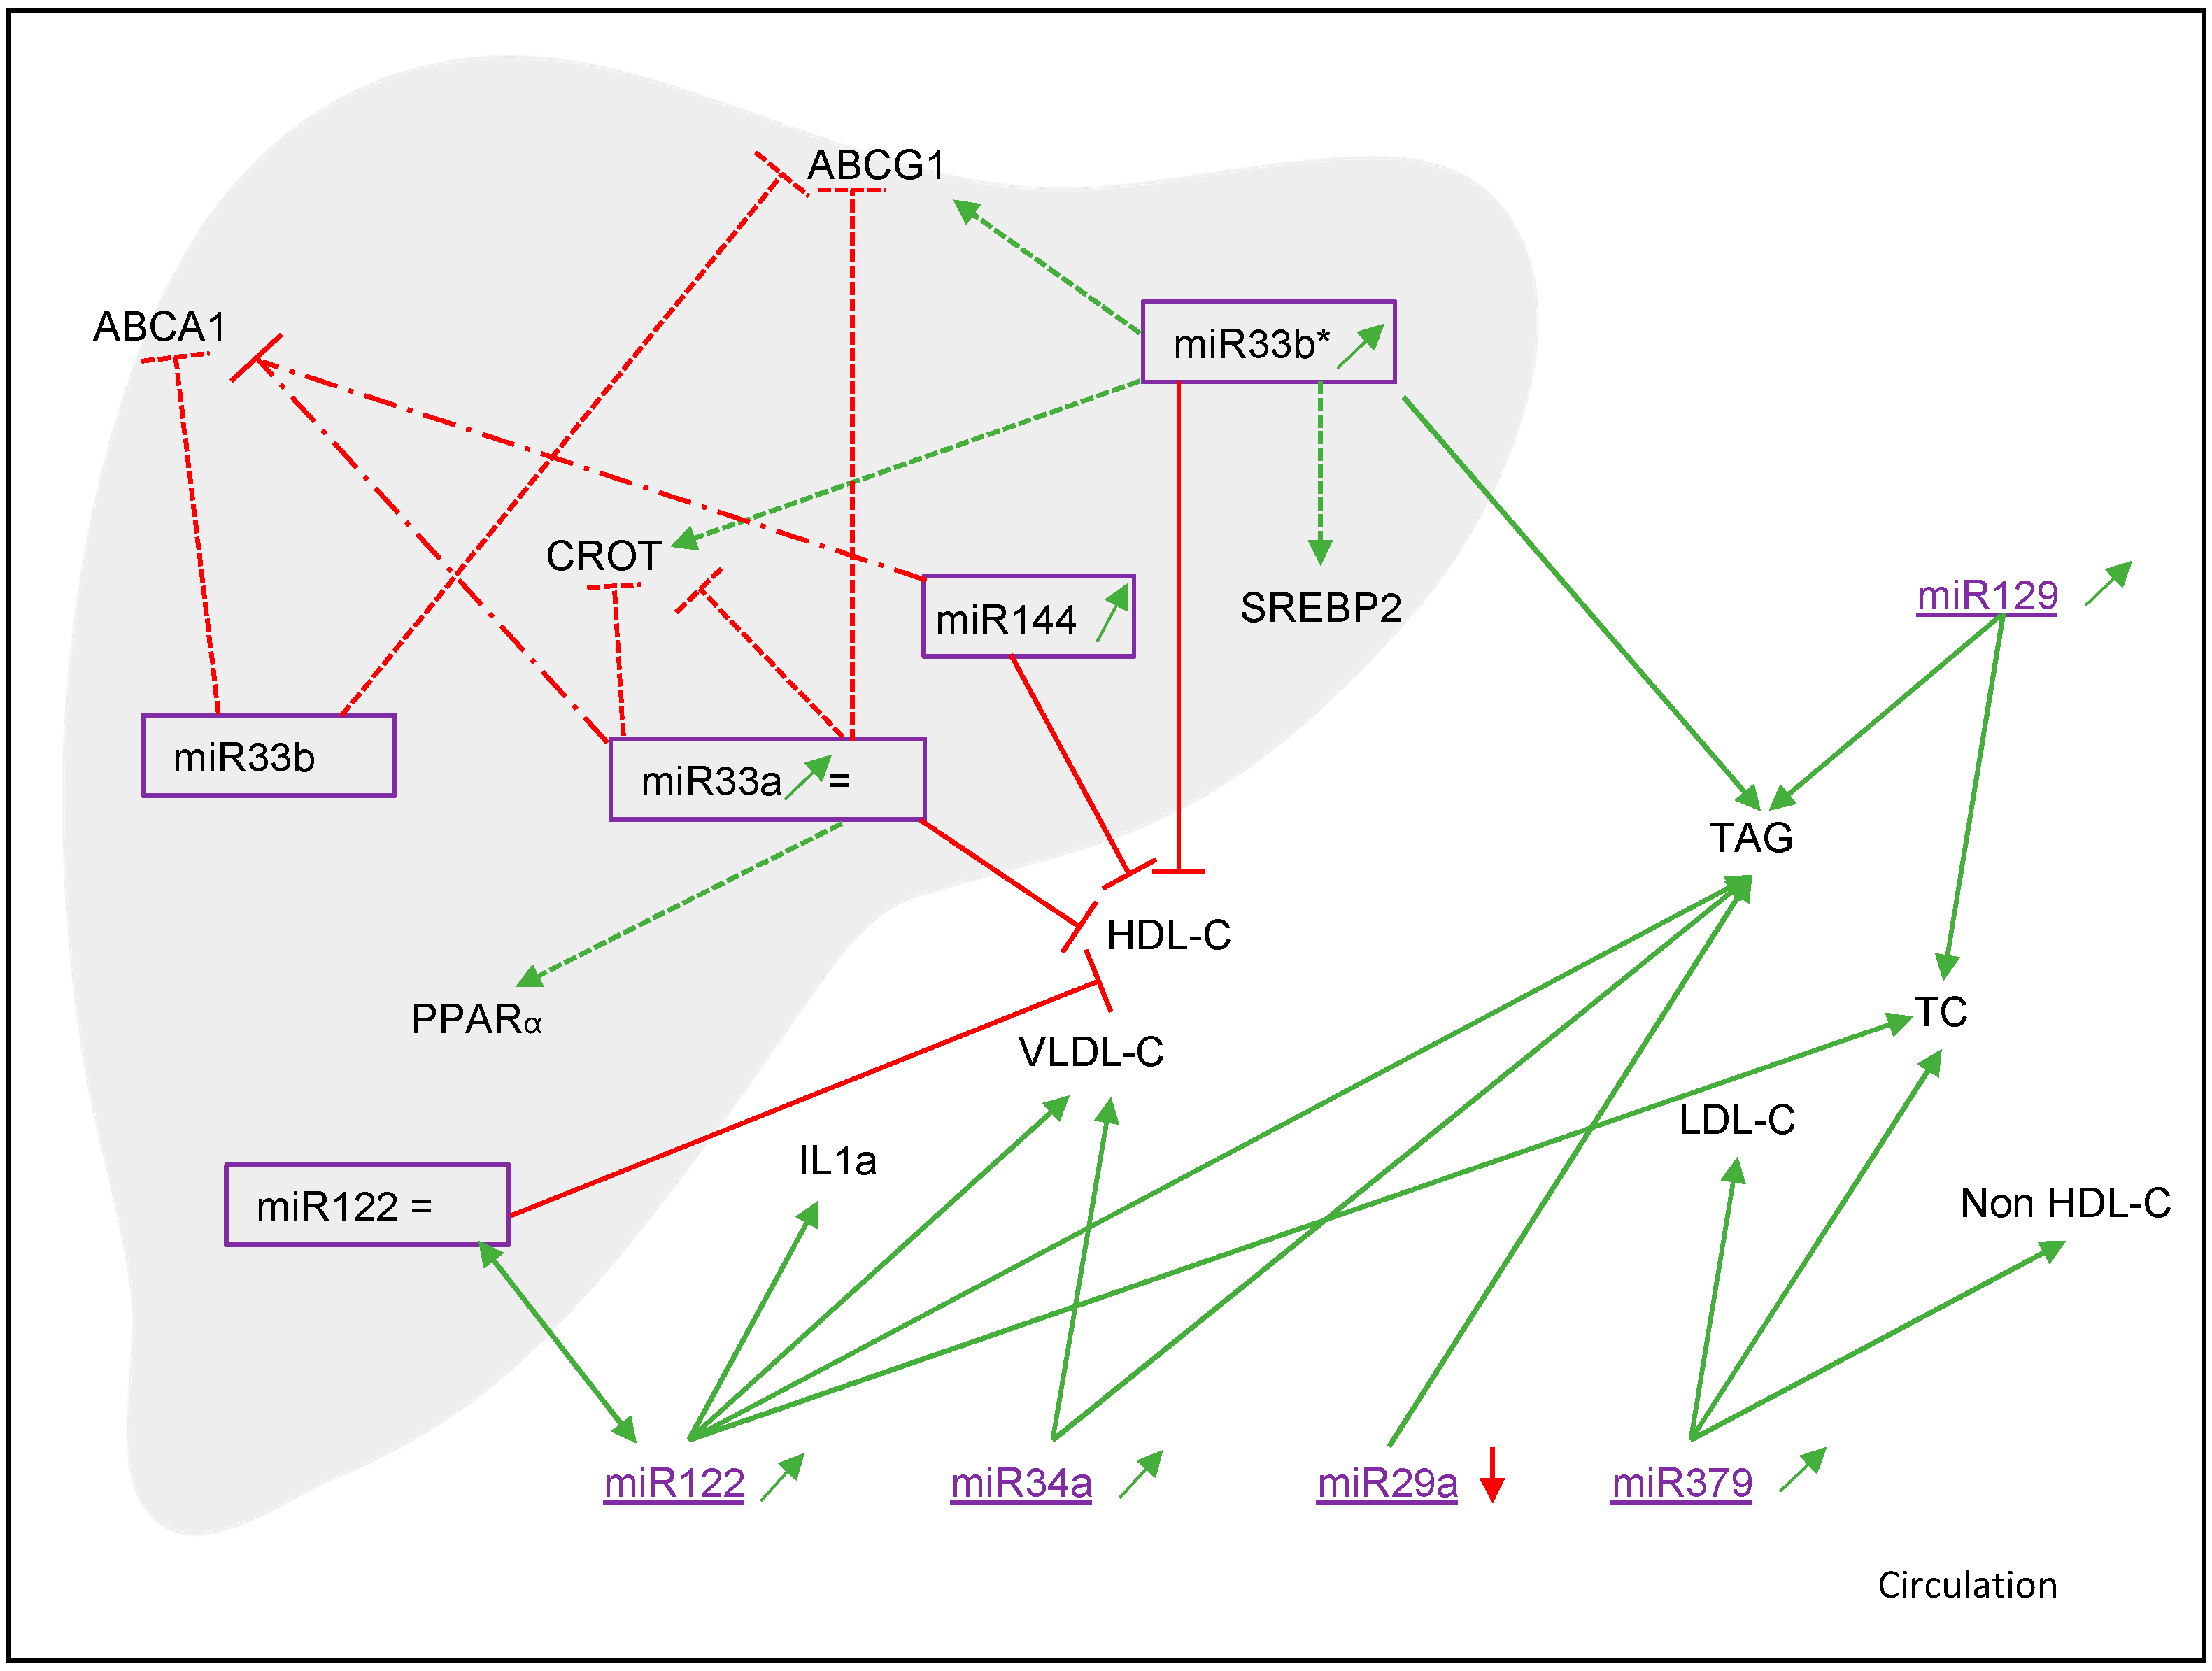
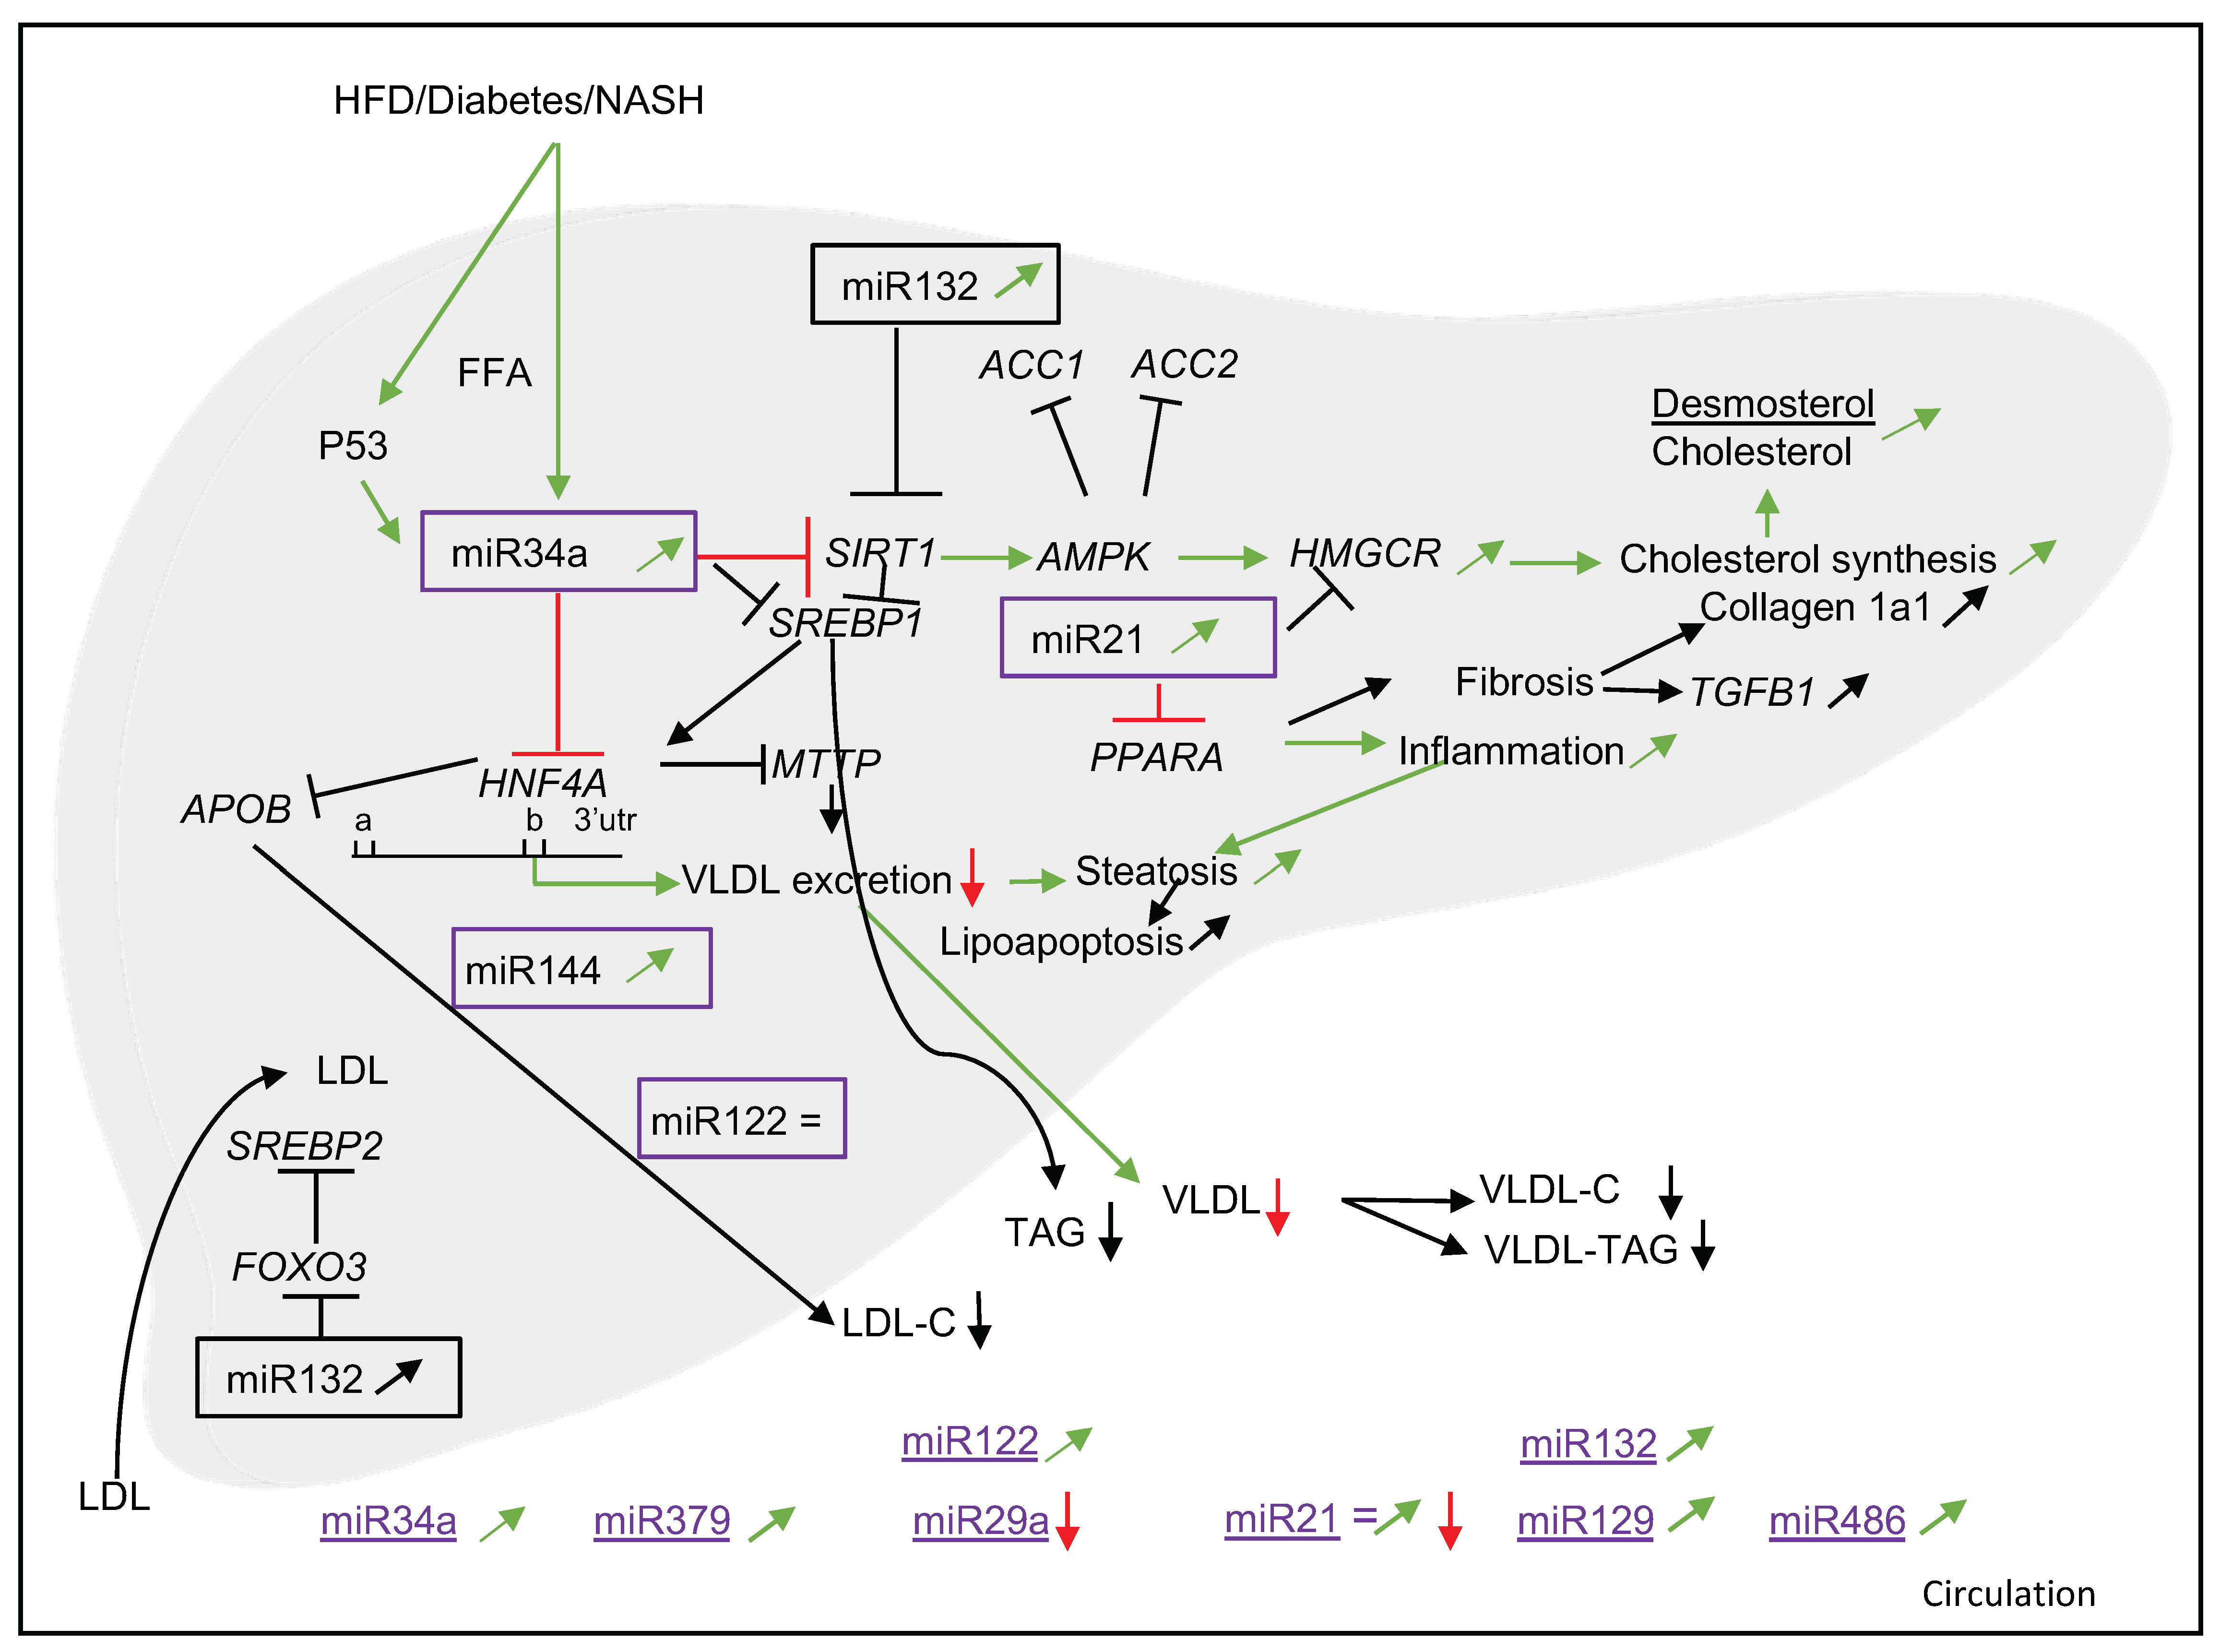
3.2.3. Target Genes and Mechanisms
3.3. miR34a
3.3.1. Associations with NAFLD and Cholesterol Metabolism
3.3.2. Diagnostics
3.3.3. Target Genes and Mechanisms
3.4. miR21
3.4.1. Associations with NAFLD and Cholesterol Metabolism
3.4.2. Diagnostics
3.4.3. Target Genes and Mechanisms
3.5. Other miRNAs (miR379, miR29a, miR144, miR33a/b, miR33b*, miR451, miR132, miR129 and miR486)
3.5.1. Associations with NAFLD and Cholesterol Metabolism
3.5.2. Diagnostics
3.5.3. Target Genes and Mechanisms
3.6. Animal Data
4. Discussion
Author Contributions
Funding
Conflicts of Interest
References
- Ballestri, S.; Zona, S.; Targher, G.; Romagnoli, D.; Baldelli, E.; Nascimbeni, F.; Roverato, A.; Guaraldi, G.; Lonardo, A. Nonalcoholic fatty liver disease is associated with an almost twofold increased risk of incident type 2 diabetes and metabolic syndrome. Evidence from a systematic review and meta-analysis. J. Gastroenterol. Hepatol. 2016, 31, 936–944. [Google Scholar] [CrossRef] [PubMed]
- Fan, J.G.; Farrell, G.C. Epidemiology of non-alcoholic fatty liver disease in China. J. Hepatol. 2009, 50, 204–210. [Google Scholar] [CrossRef] [PubMed] [Green Version]
- Yki-Jarvinen, H. Non-alcoholic fatty liver disease as a cause and a consequence of metabolic syndrome. Lancet Diabetes Endocrinol. 2014, 2, 901–910. [Google Scholar] [CrossRef]
- Starley, B.Q.; Calcagno, C.J.; Harrison, S.A. Nonalcoholic fatty liver disease and hepatocellular carcinoma: A weighty connection. Hepatology 2010, 51, 1820–1832. [Google Scholar] [CrossRef] [PubMed]
- Wong, V.W.; Adams, L.A.; de Ledinghen, V.; Wong, G.L.; Sookoian, S. Noninvasive biomarkers in NAFLD and NASH—current progress and future promise. Nat. Rev. Gastroenterol. Hepatol. 2018, 15, 461–478. [Google Scholar] [CrossRef]
- Kim, C.H.; Younossi, Z.M. Nonalcoholic fatty liver disease: A manifestation of the metabolic syndrome. Clevel. Clin. J. Med. 2008, 75, 721–728. [Google Scholar] [CrossRef] [PubMed]
- Ludwig, J.; McGill, D.B.; Lindor, K.D. Review: Nonalcoholic steatohepatitis. J. Gastroenterol. Hepatol. 1997, 12, 398–403. [Google Scholar] [CrossRef]
- Anstee, Q.M.; Goldin, R.D. Mouse models in non-alcoholic fatty liver disease and steatohepatitis research. Int. J. Exp. Pathol. 2006, 87, 1–16. [Google Scholar] [CrossRef] [PubMed]
- Shiri-Sverdlov, R.; Wouters, K.; van Gorp, P.J.; Gijbels, M.J.; Noel, B.; Buffat, L.; Staels, B.; Maeda, N.; van Bilsen, M.; Hofker, M.H. Early diet-induced non-alcoholic steatohepatitis in APOE2 knock-in mice and its prevention by fibrates. J. Hepatol. 2006, 44, 732–741. [Google Scholar] [CrossRef] [PubMed]
- Wouters, K.; van Gorp, P.J.; Bieghs, V.; Gijbels, M.J.; Duimel, H.; Lutjohann, D.; Kerksiek, A.; van Kruchten, R.; Maeda, N.; Staels, B.; et al. Dietary cholesterol, rather than liver steatosis, leads to hepatic inflammation in hyperlipidemic mouse models of nonalcoholic steatohepatitis. Hepatology 2008, 48, 474–486. [Google Scholar] [CrossRef]
- Hendrikx, T.; Walenbergh, S.M.; Hofker, M.H.; Shiri-Sverdlov, R. Lysosomal cholesterol accumulation: Driver on the road to inflammation during atherosclerosis and non-alcoholic steatohepatitis. Obes. Rev. 2014, 15, 424–433. [Google Scholar] [CrossRef] [PubMed]
- Rottiers, V.; Naar, A.M. MicroRNAs in metabolism and metabolic disorders. Nat. Rev. Mol. Cell Biol. 2012, 13, 239–250. [Google Scholar] [CrossRef] [PubMed] [Green Version]
- Williams, M.D.; Mitchell, G.M. MicroRNAs in insulin resistance and obesity. Exp. Diabetes Res. 2012, 2012, 484696. [Google Scholar] [CrossRef] [PubMed]
- Calvopina, D.A.; Coleman, M.A.; Lewindon, P.J.; Ramm, G.A. Function and Regulation of MicroRNAs and Their Potential as Biomarkers in Paediatric Liver Disease. Int. J. Mol. Sci. 2016, 17, 1795. [Google Scholar] [CrossRef] [PubMed] [Green Version]
- Baffy, G. MicroRNAs in Nonalcoholic Fatty Liver Disease. J. Clin. Med. 2015, 4, 1977–1988. [Google Scholar] [CrossRef] [PubMed] [Green Version]
- Dongiovanni, P.; Meroni, M.; Longo, M.; Fargion, S.; Fracanzani, A.L. miRNA Signature in NAFLD: A Turning Point for a Non-Invasive Diagnosis. Int. J. Mol. Sci. 2018, 19, 3966. [Google Scholar] [CrossRef] [PubMed] [Green Version]
- Iravani, F.; Hosseini, N.; Mojarrad, M. Role of MicroRNAs in Pathophysiology of Non-alcoholic Fatty Liver Disease and Non-alcoholic Steatohepatitis. Middle East J. Dig. Dis. 2018, 10, 213–219. [Google Scholar] [CrossRef] [PubMed]
- Dasarathy, S.; Dasarathy, J.; Khiyami, A.; Joseph, R.; Lopez, R.; McCullough, A.J. Validity of real time ultrasound in the diagnosis of hepatic steatosis: A prospective study. J. Hepatol. 2009, 51, 1061–1067. [Google Scholar] [CrossRef]
- Sevastianova, K.; Hakkarainen, A.; Kotronen, A.; Corner, A.; Arkkila, P.; Arola, J.; Westerbacka, J.; Bergholm, R.; Lundbom, J.; Lundbom, N.; et al. Nonalcoholic fatty liver disease: Detection of elevated nicotinamide adenine dinucleotide phosphate with in vivo 3.0-T 31P MR spectroscopy with proton decoupling. Radiology 2010, 256, 466–473. [Google Scholar] [CrossRef] [Green Version]
- Abdel-Hamed, A.R.; Mesbah, N.M.; Ghattas, M.H.; Abo-elmatty, D.M.; Saleh, S.M. Serum miRNA-122 expression in non-alcoholic fatty liver disease among Egyptian patients and its correlation with interleukin-1A gene polymorphism. Meta Gene 2017, 14, 19–23. [Google Scholar] [CrossRef]
- Auguet, T.; Aragones, G.; Berlanga, A.; Guiu-Jurado, E.; Marti, A.; Martinez, S.; Sabench, F.; Hernandez, M.; Aguilar, C.; Sirvent, J.J.; et al. miR33a/miR33b* and miR122 as possible contributors to hepatic lipid metabolism in obese women with nonalcoholic fatty liver disease. Int. J. Mol. Sci. 2016, 17, 1620. [Google Scholar] [CrossRef] [PubMed] [Green Version]
- Cermelli, S.; Ruggieri, A.; Marrero, J.A.; Ioannou, G.N.; Beretta, L. Circulating microRNAs in patients with chronic hepatitis C and non-alcoholic fatty liver disease. PLoS ONE 2011, 6, e23937. [Google Scholar] [CrossRef] [Green Version]
- Hegazy, M.A.; Algwad, I.A.; Fadl, S.A.; Hassan, M.S.; Rashed, L.A.; Hussein, M.A. Serum micro-rna-122 level as a simple noninvasive marker of mafld severity. Diabet. Metab. Synd. Obes. 2021, 14, 2247–2254. [Google Scholar] [CrossRef] [PubMed]
- Jampoka, K.; Muangpaisarn, P.; Khongnomnan, K.; Treeprasertsuk, S.; Tangkijvanich, P.; Payungporn, S. Serum miR-29a and miR-122 as potential biomarkers for non-alcoholic fatty liver disease (NAFLD). MicroRNA 2018, 7, 215–222. [Google Scholar] [CrossRef] [PubMed]
- Salvoza, N.C.; Klinzing, D.C.; Gopez-Cervantes, J.; Baclig, M.O. Association of circulating serum MIR-34a and MIR-122 with dyslipidemia among patients with non-alcoholic fatty liver disease. PLoS ONE 2016, 11, e0153497. [Google Scholar] [CrossRef] [PubMed] [Green Version]
- Yamada, H.; Suzuki, K.; Ichino, N.; Ando, Y.; Sawada, A.; Osakabe, K.; Sugimoto, K.; Ohashi, K.; Teradaira, R.; Inoue, T.; et al. Associations between circulating microRNAs (miR-21, miR-34a, miR-122 and miR-451) and non-alcoholic fatty liver. Clin. Chim. Acta 2013, 424, 99–103. [Google Scholar] [CrossRef]
- Ye, D.; Zhang, T.; Lou, G.; Xu, W.; Dong, F.; Chen, G.; Liu, Y. Plasma miR-17, miR-20a, miR-20b and miR-122 as potential biomarkers for diagnosis of NAFLD in type 2 diabetes mellitus patients. Life Sci. 2018, 208, 201–207. [Google Scholar] [CrossRef] [PubMed]
- Min, H.K.; Kapoor, A.; Fuchs, M.; Mirshahi, F.; Zhou, H.; Maher, J.; Kellum, J.; Warnick, R.; Contos, M.J.; Sanyal, A.J. Increased hepatic synthesis and dysregulation of cholesterol metabolism is associated with the severity of nonalcoholic fatty liver disease. Cell Metab. 2012, 15, 665–674. [Google Scholar] [CrossRef] [PubMed] [Green Version]
- Xu, Y.; Zalzala, M.; Xu, J.; Li, Y.; Yin, L.; Zhang, Y. A metabolic stress-inducible miR-34a-HNF4alpha pathway regulates lipid and lipoprotein metabolism. Nat. Commun. 2015, 6, 7466. [Google Scholar] [CrossRef] [Green Version]
- Slabakova, E.; Culig, Z.; Remsik, J.; Soucek, K. Alternative mechanisms of miR-34a regulation in cancer. Cell Death Dis. 2017, 8, e3100. [Google Scholar] [CrossRef]
- Lendvai, G.; Jarmay, K.; Karacsony, G.; Halasz, T.; Kovalszky, I.; Baghy, K.; Wittmann, T.; Schaff, Z.; Kiss, A. Elevated miR-33a and miR-224 in steatotic chronic hepatitis C liver biopsies. World J. Gastroenterol. 2014, 20, 15343–15350. [Google Scholar] [CrossRef] [PubMed] [Green Version]
- Rodrigues, P.M.; Afonso, M.B.; Simao, A.L.; Carvalho, C.C.; Trindade, A.; Duarte, A.; Borralho, P.M.; MacHado, M.V.; Cortez-Pinto, H.; Rodrigues, C.M.; et al. MiR-21 ablation and obeticholic acid ameliorate nonalcoholic steatohepatitis in mice. Cell Death Dis. 2017, 8, e2748. [Google Scholar] [CrossRef] [PubMed]
- Sun, C.; Huang, F.; Liu, X.; Xiao, X.; Yang, M.; Hu, G.; Liu, H.; Liao, L. miR-21 regulates triglyceride and cholesterol metabolism in non-alcoholic fatty liver disease by targeting HMGCR. Int. J. Mol. Med. 2015, 35, 847–853. [Google Scholar] [CrossRef] [Green Version]
- Feng, Y.H.; Tsao, C.J. Emerging role of microRNA-21 in cancer. Biomed. Rep. 2016, 5, 395–402. [Google Scholar] [CrossRef] [PubMed] [Green Version]
- Okamoto, K.; Koda, M.; Okamoto, T.; Onoyama, T.; Miyoshi, K.; Kishina, M.; Matono, T.; Kato, J.; Tokunaga, S.; Sugihara, T.; et al. Serum miR-379 expression is related to the development and progression of hypercholesterolemia in non-alcoholic fatty liver disease. PLoS ONE 2020, 15, e0219412. [Google Scholar] [CrossRef] [PubMed] [Green Version]
- Vega-Badillo, J.; Gutierrez-Vidal, R.; Hernandez-Perez, H.A.; Villamil-Ramirez, H.; Leon-Mimila, P.; Sanchez-Munoz, F.; Moran-Ramos, S.; Larrieta-Carrasco, E.; Fernandez-Silva, I.; Mendez-Sanchez, N.; et al. Hepatic miR-33a/miR-144 and their target gene ABCA1 are associated with steatohepatitis in morbidly obese subjects. Liver Int. 2016, 36, 1383–1391. [Google Scholar] [CrossRef]
- Hanin, G.; Yayon, N.; Tzur, Y.; Haviv, R.; Bennett, E.R.; Udi, S.; Krishnamoorthy, Y.R.; Kotsiliti, E.; Zangen, R.; Efron, B.; et al. miRNA-132 induces hepatic steatosis and hyperlipidaemia by synergistic multitarget suppression. Gut 2018, 67, 1124–1134. [Google Scholar] [CrossRef] [PubMed] [Green Version]
- Zong, Y.; Yan, J.; Jin, L.; Xu, B.; He, Z.; Zhang, R.; Hu, C.; Jia, W. Relationship between circulating miR-132 and non-alcoholic fatty liver disease in a Chinese population. Hereditas 2020, 157, 22. [Google Scholar] [CrossRef] [PubMed]
- Wang, Y.; Feng, Y.; Zhang, H.; Niu, Q.; Liang, K.; Bian, C.; Li, H. Clinical Value and Role of miR-129-5p in Non-Alcoholic Fatty Liver Disease. Horm. Metab. Res. 2021, 53, 692–698. [Google Scholar] [CrossRef]
- Al Azzouny, M.A.; Behiry, E.G.; Behairy, O.G.; Abd Ellraouf, H.A.; Elfallah, A.A. Serum microRNA-486-5p expression in obese Egyptian children and its possible association with fatty liver. Diabetes Metab. Syndr. 2021, 15, 102258. [Google Scholar] [CrossRef] [PubMed]
- Loyer, X.; Paradis, V.; Henique, C.; Vion, A.C.; Colnot, N.; Guerin, C.L.; Devue, C.; On, S.; Scetbun, J.; Romain, M.; et al. Liver microRNA-21 is overexpressed in non-alcoholic steatohepatitis and contributes to the disease in experimental models by inhibiting PPARalpha expression. Gut 2016, 65, 1882–1894. [Google Scholar] [CrossRef] [Green Version]
- Burg, J.S.; Espenshade, P.J. Regulation of HMG-CoA reductase in mammals and yeast. Prog. Lipid Res. 2011, 50, 403–410. [Google Scholar] [CrossRef] [PubMed] [Green Version]
- Pirola, C.J.; Fernandez Gianotti, T.; Castano, G.O.; Mallardi, P.; San Martino, J.; Mora Gonzalez Lopez Ledesma, M.; Flichman, D.; Mirshahi, F.; Sanyal, A.J.; Sookoian, S. Circulating microRNA signature in non-alcoholic fatty liver disease: From serum non-coding RNAs to liver histology and disease pathogenesis. Gut 2015, 64, 800–812. [Google Scholar] [CrossRef] [Green Version]
- Cheung, O.; Puri, P.; Eicken, C.; Contos, M.J.; Mirshahi, F.; Maher, J.W.; Kellum, J.M.; Min, H.; Luketic, V.A.; Sanyal, A.J. Nonalcoholic steatohepatitis is associated with altered hepatic MicroRNA expression. Hepatology 2008, 48, 1810–1820. [Google Scholar] [CrossRef] [PubMed] [Green Version]
- Vincent, R.; Sanyal, A. Recent Advances in Understanding of NASH: MicroRNAs as Both Biochemical Markers and Players. Curr. Pathobiol. Rep. 2014, 2, 109–115. [Google Scholar] [CrossRef]
- Esau, C.; Davis, S.; Murray, S.F.; Yu, X.X.; Pandey, S.K.; Pear, M.; Watts, L.; Booten, S.L.; Graham, M.; McKay, R.; et al. miR-122 regulation of lipid metabolism revealed by in vivo antisense targeting. Cell Metab. 2006, 3, 87–98. [Google Scholar] [CrossRef] [PubMed] [Green Version]
- Castro, R.E.; Ferreira, D.M.; Afonso, M.B.; Borralho, P.M.; Machado, M.V.; Cortez-Pinto, H.; Rodrigues, C.M. miR-34a/SIRT1/p53 is suppressed by ursodeoxycholic acid in the rat liver and activated by disease severity in human non-alcoholic fatty liver disease. J. Hepatol. 2013, 58, 119–125. [Google Scholar] [CrossRef]
- Zarfeshani, A.; Ngo, S.; Sheppard, A.M. MicroRNA Expression Relating to Dietary-Induced Liver Steatosis and NASH. J. Clin. Med. 2015, 4, 1938–1950. [Google Scholar] [CrossRef] [Green Version]
- Ding, J.; Li, M.; Wan, X.; Jin, X.; Chen, S.; Yu, C.; Li, Y. Effect of miR-34a in regulating steatosis by targeting PPARalpha expression in nonalcoholic fatty liver disease. Sci. Rep. 2015, 5, 13729. [Google Scholar] [CrossRef] [Green Version]
- Zhao, J.; Tang, N.; Wu, K.; Dai, W.; Ye, C.; Shi, J.; Zhang, J.; Ning, B.; Zeng, X.; Lin, Y. MiR-21 simultaneously regulates ERK1 signaling in HSC activation and hepatocyte EMT in hepatic fibrosis. PLoS ONE 2014, 9, e108005. [Google Scholar] [CrossRef]
- Becker, P.P.; Rau, M.; Schmitt, J.; Malsch, C.; Hammer, C.; Bantel, H.; Mullhaupt, B.; Geier, A. Performance of Serum microRNAs -122, -192 and -21 as Biomarkers in Patients with Non-Alcoholic Steatohepatitis. PLoS ONE 2015, 10, e0142661. [Google Scholar] [CrossRef] [PubMed]
- Browning, J.D.; Szczepaniak, L.S.; Dobbins, R.; Nuremberg, P.; Horton, J.D.; Cohen, J.C.; Grundy, S.M.; Hobbs, H.H. Prevalence of hepatic steatosis in an urban population in the United States: Impact of ethnicity. Hepatology 2004, 40, 1387–1395. [Google Scholar] [CrossRef] [PubMed]
- Angulo, P. GI epidemiology: Nonalcoholic fatty liver disease. Aliment. Pharmacol. Ther. 2007, 25, 883–889. [Google Scholar] [CrossRef] [PubMed]
- Mofrad, P.; Contos, M.J.; Haque, M.; Sargeant, C.; Fisher, R.A.; Luketic, V.A.; Sterling, R.K.; Shiffman, M.L.; Stravitz, R.T.; Sanyal, A.J. Clinical and histologic spectrum of nonalcoholic fatty liver disease associated with normal ALT values. Hepatology 2003, 37, 1286–1292. [Google Scholar] [CrossRef] [PubMed]
- Pillai, S.S.; Lakhani, H.V.; Zehra, M.; Wang, J.; Dilip, A.; Puri, N.; O’Hanlon, K.; Sodhi, K. Predicting nonalcoholic fatty liver disease through a panel of plasma biomarkers and micrornas in female West Virginia population. Int. J. Mol. Sci. 2020, 21, 6698. [Google Scholar] [CrossRef] [PubMed]
- Harrison, S.A.; Ratziu, V.; Boursier, J.; Francque, S.; Bedossa, P.; Majd, Z.; Cordonnier, G.; Sudrik, F.B.; Darteil, R.; Liebe, R.; et al. A blood-based biomarker panel (NIS4) for non-invasive diagnosis of non-alcoholic steatohepatitis and liver fibrosis: A prospective derivation and global validation study. Lancet Gastroenterol. Hepatol. 2020, 5, 970–985. [Google Scholar] [CrossRef]
- Puri, P.; Mirshahi, F.; Cheung, O.; Natarajan, R.; Maher, J.W.; Kellum, J.M.; Sanyal, A.J. Activation and dysregulation of the unfolded protein response in nonalcoholic fatty liver disease. Gastroenterology 2008, 134, 568–576. [Google Scholar] [CrossRef] [PubMed]


| miRNA | Target Genes |
|---|---|
| 122 [24] | CYP7A1, SRF, RAC1, RHOA, CCNG1, GTF2B, GYS1, NFATC2IP, ENTPD4, ANXA11, FOXP1, MECP2, NCAM1, TBX19, AACS, DUSP2, ATP1A2, MAPK11, AKT3, GALNT10, G6PC3, SLC7A1, FOXJ3, SLC7A11, TRIB1, DSTYK, PRKAB1, ACVR1C, PRKRA, PTP1B, P4HA1, ZNF395, SOCS1, HMOX1, CDK4 |
| 34a [29] | HNF4A, MTP, APOB, SREBP1C, ACC1, ACC2, HMGCR |
| 21 [32] | PPARA |
| 21 [33] | HMGCR |
| 379 [35] | Fibrosis and inflammation: CAT, CTGF, IL10, PDGFA, PDGFRA, SMAD4, TGFBR1, THBS1 Energy management, including gluconeogenesis and lipogenesis: CREB1, EIF4E, FOXO1, INSR, IGF1, IGF1R, ITPR2, PRKAA1, PRKAA2, RICTOR, SOCS1, TCF7L2 Cell survival and proliferation: BCL2, CCNB1, HGF, PMAIP1, PTEN, YAP1 Signaling pathways: HDAC2 |
| 29a [24] | DK6, RAN, BACE1, S100B, IMPDH1, GLUL, PPM1D, PIK3R1, LPL, CPEB3, CPEB4, ADAMTS9, TRIM63, MYCN, SERPINB9, DICER1, TNFAIP3, CDC42, PXDN, ITIH5, PTEN, ABL1 |
| 144 | Not reported |
| 33a [36] | CROT |
| 33b* [36] | CROT |
| 33b | Not reported |
| 451 | Not reported |
| 132 [37] | ACHE, FOXO3, PTEN, SIRT1 |
| 129 | Not reported |
| 486 | Not reported |
| MiR | With | Correlation | Where | Author |
|---|---|---|---|---|
| 122 | IL-1α | r = 0.250; p = 0.030; n = 75 | serum | [20] |
| TAG | r = 0.230; p = 0.048; n = 75 | serum | [20] | |
| VLDL-C | r = 0.230; p = 0.048; n = 75 | serum | [20] | |
| HDL-C | r = -0.305; p = 0.001; n = 65 | serum | [21] | |
| ALP | r = 0.306; p = 0.021; n = 65 | serum | [21] | |
| ALT | r = 0.351; p < 0.001; n = 65 | serum | [21] | |
| AST | r = 0.367; p < 0.001; n = 65 | serum | [21] | |
| Hepatocellular ballooning | r = 0.200; p = 0.035; n = 65 | liver | [21] | |
| Lobular inflammation | r = 0.225; p = 0.017; n = 65 | liver | [21] | |
| Liver | r = 0.253; p = 0.019; n = 65 | serum | [21] | |
| ALT | r = 0.75; n = 34 | serum | [22] | |
| AST | r = 0.55; n = 34 | serum | [22] | |
| Fibrotic stage | r = 0.33; n = 34 | serum | [22] | |
| Inflammation activation | r = 0.33; n = 34 | serum | [22] | |
| LDL-C | r = 0.44; n = 34 | serum | [22] | |
| TC | r = 0.36; n = 34 | serum | [22] | |
| Fibrotic stage | r = 0.399; p < 0.002; n = 56 | serum | [24] | |
| NAS | r = 0.306; p = 0.022; n = 56 | serum | [24] | |
| men | Severity of steatosis | normal vs. mild p < 0.001; n = 90 vs. n = 37 | serum | [26] |
| mild vs. severe p = 0.047; n = 37 vs. n = 11 | serum | [26] | ||
| women | Severity of steatosis | normal vs. mild p = 0.002; n = 221 vs. n = 36 | serum | [26] |
| mild vs. severe p = 0.035; n = 36 vs. n = 8 | serum | [26] | ||
| 34a | Fibrotic stage | r = 0.41; n = 34 | serum | [22] |
| Inflammation activation | r = 0.43; n = 34 | serum | [22] | |
| TAG | r = 0.43; n = 28 | serum | [25] | |
| VLDL-C | r = 0.44; n = 28 | serum | [25] | |
| 21 | Fibrosis | r = 0.461; p = 0.021; n = 19 | liver | [41] |
| Hepatic ballooning | r = 0.713; p < 0.001; n = 19 | liver | [41] | |
| Lobular inflammation | r = 0.735; p < 0.001; n = 19 | liver | [41] | |
| Steatosis | r = 0.539; p = 0.005; n = 19 | liver | [41] | |
| 379 | ALP | r = 0.278; p = 0.048; n = 53 | serum | [35] |
| TC (all participants) | r = 0.361; p = 0.039; n = 53 | serum | [35] | |
| LDL-C | r = 0.285; p = 0.043; n = 53 | serum | [35] | |
| Non-HDL-C | r = 0.286; p = 0.038; n = 53 | serum | [35] | |
| TC (non-statin users) | r = 0.381; p = 0.045; n = 42 | serum | [35] | |
| 29a | TAG | r = 0.144; p = 0.048; n = 46 | serum | [24] |
| 33b * | AST | r = 0.203; p = 0.046; n = 61 | serum | [21] |
| HDL-C | r = -0.276; p = 0.004; n = 61 | serum | [21] | |
| Hepatic ballooning | r = 0.343; p = 0.001; n = 13 | liver | [21] | |
| Lobular inflammation | r = 0.358; p < 0.001; n = 12 | liver | [21] | |
| TAG | r = 0.279; p = 0.004; n = 61 | serum | [21] | |
| 33a | HDL-C | r = -0.313; p = 0.004; n = 74 | serum | [36] |
| 144 | HDL-C | r = -0.221; p = 0.043; n = 74 | serum | [36] |
| 129 | TAG | r = 0.662; p < 0.001; n = 117 | serum | [39] |
| TC | r = 0.708; p < 0.001; n = 117 | serum | [39] | |
| 132 | ApoE | β ± SE = 0.038 ± 0.002; p = 0.017; n = 140 | serum | [38] |
| ALT | β ± SE = 0.005 ± 0.002; p = 0.018; n = 140 | serum | [38] | |
| NAFLD | OR 3.08 (1.06, 8.99); p = 0.0392; n = 140 | serum | [38] | |
| TAG | β ± SE = 0.072 ± 0.029; p = 0.015; n = 140 | serum | [38] |
| miR | AUC | Significance | Sensitivity | Specificity | PPV (%) | NPV (%) | Author | |
|---|---|---|---|---|---|---|---|---|
| 122 | Hepatocellular ballooning a,b | 0.76 | 74.4% | 46.8% | 46.8% | 87.3% | [21] | |
| Lobular inflammation a,c | 0.76 | 74.4% | 46.8% | 46.8% | 87.3% | [21] | ||
| NAFLD a,d | 0.82 | 83.1% | 69.8% | 47.8% | 92.5% | [21] | ||
| ALT | 0.91 | [22] | ||||||
| NAFLD-ss e | 0.93 | [22] | ||||||
| NAFLD-ss e vs. NASH f | 0.70 | [22] | ||||||
| 0.83 | p < 0.001 | 75.0% | 82.4% | [24] | ||||
| 0.86 | p = 0.001, 95% CI = 0.77–0.95 | [25] | ||||||
| 34a | 0.78 | p = 0.001, 95% CI = 0.66–0.90 | [25] | |||||
| ALT | 0.83 | p = 0.001, 95% CI = 0.73–0.94 | [25] | |||||
| NAFLD-ss e vs. NASH f | 0.76 | [22] | ||||||
| 379 | NAFL | 0.76 | [35] | |||||
| NAFLD | 0.72 | [35] | ||||||
| NASH | 0.72 | [35] | ||||||
| Early stage NAFLD | 0.74 | [35] | ||||||
| Advanced stage NAFLD | 0.67 | [35] | ||||||
| 29a | 0.68 | p = 0.007 | 60.9% | 82.4% | [24] | |||
| 129 | NAFLD | 0.93 | 83.8% | 92.7% | [39] | |||
Publisher’s Note: MDPI stays neutral with regard to jurisdictional claims in published maps and institutional affiliations. |
© 2022 by the authors. Licensee MDPI, Basel, Switzerland. This article is an open access article distributed under the terms and conditions of the Creative Commons Attribution (CC BY) license (https://creativecommons.org/licenses/by/4.0/).
Share and Cite
Konings, M.C.J.M.; Baumgartner, S.; Mensink, R.P.; Plat, J. Investigating microRNAs to Explain the Link between Cholesterol Metabolism and NAFLD in Humans: A Systematic Review. Nutrients 2022, 14, 4946. https://0-doi-org.brum.beds.ac.uk/10.3390/nu14234946
Konings MCJM, Baumgartner S, Mensink RP, Plat J. Investigating microRNAs to Explain the Link between Cholesterol Metabolism and NAFLD in Humans: A Systematic Review. Nutrients. 2022; 14(23):4946. https://0-doi-org.brum.beds.ac.uk/10.3390/nu14234946
Chicago/Turabian StyleKonings, Maurice C. J. M., Sabine Baumgartner, Ronald P. Mensink, and Jogchum Plat. 2022. "Investigating microRNAs to Explain the Link between Cholesterol Metabolism and NAFLD in Humans: A Systematic Review" Nutrients 14, no. 23: 4946. https://0-doi-org.brum.beds.ac.uk/10.3390/nu14234946