
Evaluation of Dietary Quality Based on Intelligent Ordering System and Chinese Healthy Eating Index in College Students from a Medical School in Shanghai, China


Abstract
:1. Introduction
2. Subjects and Methods
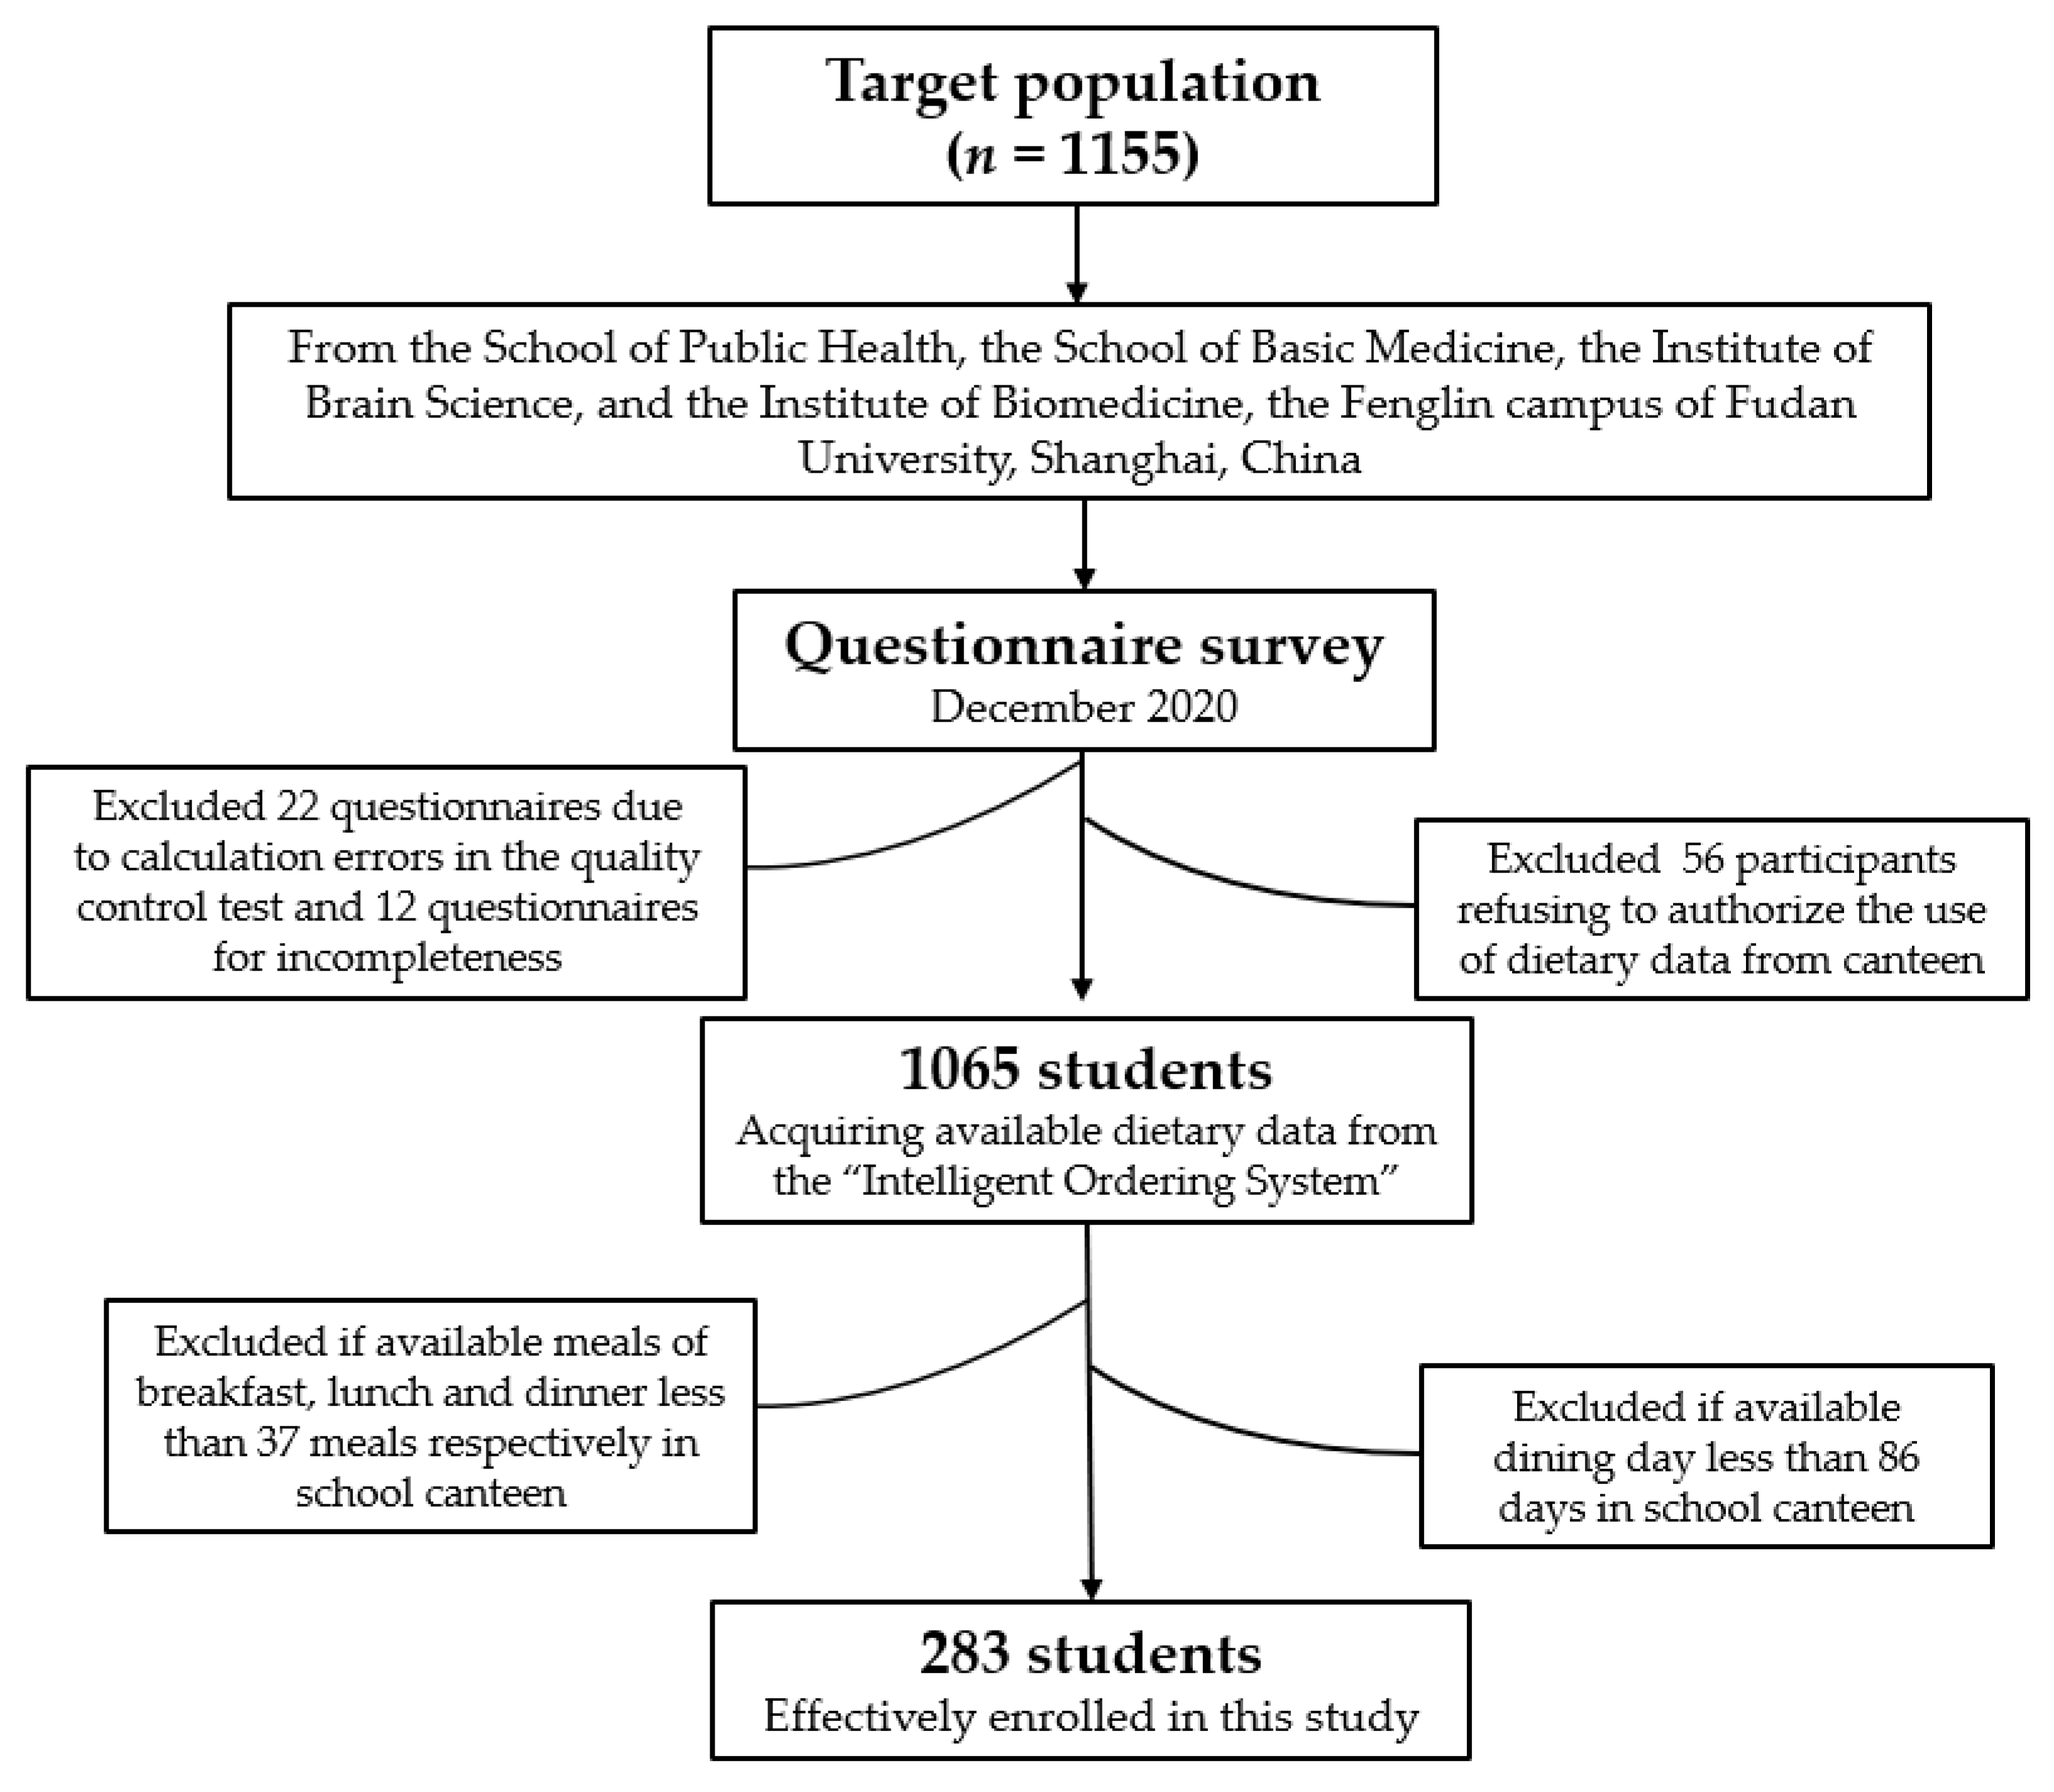
2.1. Target Population
2.2. Introduction of the “Intelligent Ordering System”
2.3. Acquiring the Available Dietary Data from the “Intelligent Ordering System”
2.4. Questionnaire Survey
2.5. CHEI Calculation
2.6. Assessment of Covariates
2.7. Statistical Analysis
3. Results
4. Discussion
5. Strengths and Limitations
6. Conclusions
Supplementary Materials
Author Contributions
Funding
Institutional Review Board Statement
Informed Consent Statement
Data Availability Statement
Conflicts of Interest
References
- Shan, Z.; Guo, Y.; Hu, F.B.; Liu, L.; Qi, Q. Association of Low-Carbohydrate and Low-Fat Diets With Mortality Among US Adults. JAMA Intern. Med. 2020, 180, 513–523. [Google Scholar] [CrossRef] [PubMed]
- Rivera, J.A.; Barquera, M.S.; González-Cossío, M.T.; Olaiz, M.G.; Sepúlveda, M.J. Nutrition Transition in Mexico and in Other Latin American Countries. Nutr. Rev. 2004, 62, S149–S157. [Google Scholar] [CrossRef] [PubMed]
- Zhai, F.; Du, S.F.; Wang, Z.; Zhang, J.G.; Du, W.; Popkin, B.M. Dynamics of the Chinese diet and the role of urbanicity, 1991–2011. Obes. Rev. 2014, 15 (Suppl. 1), 16–26. [Google Scholar] [CrossRef] [Green Version]
- Dreher, M.L. Whole Fruits and Fruit Fiber Emerging Health Effects. Nutrients 2018, 10, 1833. [Google Scholar] [CrossRef] [PubMed] [Green Version]
- Li, B.; Li, F.; Wang, L.; Zhang, D. Fruit and Vegetables Consumption and Risk of Hypertension: A Meta-Analysis. J. Clin. Hypertens. 2016, 18, 468–476. [Google Scholar] [CrossRef] [PubMed]
- Zhan, J.; Liu, Y.-J.; Cai, L.-B.; Xu, F.-R.; Xie, T.; He, Q.-Q. Fruit and vegetable consumption and risk of cardiovascular disease: A meta-analysis of prospective cohort studies. Crit. Rev. Food Sci. Nutr. 2017, 57, 1650–1663. [Google Scholar] [CrossRef] [PubMed]
- Wang, Y.; Li, F.; Wang, Z.; Qiu, T.; Shen, Y.; Wang, M. Fruit and vegetable consumption and risk of lung cancer: A dose-response meta-analysis of prospective cohort studies. Lung Cancer 2015, 88, 124–130. [Google Scholar] [CrossRef]
- Tian, Y.; Su, L.; Wang, J.; Duan, X.; Jiang, X. Fruit and vegetable consumption and risk of the metabolic syndrome: A meta-analysis. Public Health Nutr. 2018, 21, 756–765. [Google Scholar] [CrossRef]
- Lacaille, L.J.; Dauner, K.N.; Krambeer, R.J.; Pedersen, J. Psychosocial and Environmental Determinants of Eating Behaviors, Physical Activity, and Weight Change Among College Students: A Qualitative Analysis. J. Am. Coll. Health 2011, 59, 531–538. [Google Scholar] [CrossRef]
- Stok, F.M.; Renner, B.; Clarys, P.; Lien, N.; Lakerveld, J.; Deliens, T. Understanding Eating Behavior during the Transition from Adolescence to Young Adulthood: A Literature Review and Perspective on Future Research Directions. Nutrients 2018, 10, 667. [Google Scholar] [CrossRef] [Green Version]
- Cuenca-García, M.; Ortega, F.B.; Ruiz, J.R.; Gonzalez-Gross, M.; Labayen, I.; Jago, R.; Martínez-Gómez, D.; Dallongeville, J.; Bel-Serrat, S.; Marcos, A.; et al. Combined influence of healthy diet and active lifestyle on cardiovascular disease risk factors in adolescents. Scand. J. Med. Sci. Sports 2012, 24, 553–562. [Google Scholar] [CrossRef] [PubMed] [Green Version]
- Al-Rethaiaa, A.S.; Fahmy, A.-E.A.; Al-Shwaiyat, N.M. Obesity and eating habits among college students in Saudi Arabia: A cross sectional study. Nutr. J. 2010, 9, 39. [Google Scholar] [CrossRef] [PubMed] [Green Version]
- Racette, S.B.; Deusinger, S.S.; Strube, M.J.; Highstein, G.R.; Deusinger, R.H. Weight Changes, Exercise, and Dietary Patterns During Freshman and Sophomore Years of College. J. Am. Coll. Health 2005, 53, 245–251. [Google Scholar] [CrossRef] [Green Version]
- Sprake, E.F.; Russell, J.M.; Cecil, J.E.; Cooper, R.J.; Grabowski, P.; Pourshahidi, L.K.; Barker, M.E. Dietary patterns of university students in the UK: A cross-sectional study. Nutr. J. 2018, 17, 1–17. [Google Scholar] [CrossRef]
- Gonzales, R.; Laurent, J.S.; Johnson, R.K. Relationship Between Meal Plan, Dietary Intake, Body Mass Index, and Appetitive Responsiveness in College Students. J. Pediatr. Health Care 2017, 31, 320–326. [Google Scholar] [CrossRef]
- Watanabe-Ito, M.; Kishi, E.; Shimizu, Y. Promoting Healthy Eating Habits for College Students Through Creating Dietary Diaries via a Smartphone App and Social Media Interaction: Online Survey Study. JMIR mHealth uHealth 2020, 8, e17613. [Google Scholar] [CrossRef] [PubMed]
- Mezgec, S.; Eftimov, T.; Bucher, T.; Seljak, B.K. Mixed deep learning and natural language processing method for fake-food image recognition and standardization to help automated dietary assessment. Public Health Nutr. 2018, 22, 1–10. [Google Scholar] [CrossRef] [Green Version]
- Koo, H.C.; Hadirah, Z.; Airina, A.; Amrina, N.A.; Faziela, N. Effect of nutrient intakes on anthropometric profiles among university students from a selected private University in Klang Valley, Malaysia. Afr. Health Sci. 2019, 19, 2243–2251. [Google Scholar] [CrossRef]
- Plichta, M.; Jezewska-Zychowicz, M. Orthorexic Tendency and Eating Disorders Symptoms in Polish Students: Examining Differences in Eating Behaviors. Nutrients 2020, 12, 218. [Google Scholar] [CrossRef] [Green Version]
- Fallaize, R.; Forster, H.; Macready, A.L.; Walsh, M.C.; Mathers, J.C.; Brennan, L.; Gibney, E.R.; Gibney, M.J.; Lovegrove, J.A. Online Dietary Intake Estimation: Reproducibility and Validity of the Food4Me Food Frequency Questionnaire Against a 4-Day Weighed Food Record. J. Med. Internet Res. 2014, 16, e190. [Google Scholar] [CrossRef]
- Li, S.Z.; Zhou, W.Q.; Mi, Y. Exploration and practice on intelligent ordering system in university. J. Cent. China Norm. Univ. Nat. Sci. 2017, S1, 59–62. [Google Scholar] [CrossRef]
- Appel, L.J.; Brands, M.W.; Daniels, S.R.; Karanja, N.; Elmer, P.J.; Sacks, F.M. Dietary Approaches to Prevent and Treat Hypertension: A Scientific Statement From the American Heart Association. Hypertension 2006, 47, 296–308. [Google Scholar] [CrossRef] [PubMed] [Green Version]
- Fung, T.T.; McCullough, M.L.; Newby, P.; Manson, J.E.; Meigs, J.B.; Rifai, N.; Willett, W.C.; Hu, F.B. Diet-quality scores and plasma concentrations of markers of inflammation and endothelial dysfunction. Am. J. Clin. Nutr. 2005, 82, 163–173. [Google Scholar] [CrossRef] [PubMed]
- Krebs-Smith, S.M.; Pannucci, T.E.; Subar, A.F.; Kirkpatrick, S.I.; Lerman, J.L.; Tooze, J.A.; Wilson, M.M.; Reedy, J. Update of the Healthy Eating Index: HEI-2015. J. Acad. Nutr. Diet. 2018, 118, 1591–1602. [Google Scholar] [CrossRef] [PubMed] [Green Version]
- Yuan, Y.-Q.; Li, F.; Dong, R.-H.; Chen, J.-S.; He, G.-S.; Li, S.-G.; Chen, B. The Development of a Chinese Healthy Eating Index and Its Application in the General Population. Nutrients 2017, 9, 977. [Google Scholar] [CrossRef] [Green Version]
- Chen, P.-Y.; Fang, A.-P.; Wang, X.-Y.; Lan, Q.-Y.; Liao, G.-C.; Liu, Z.-Y.; Zhang, D.-M.; Zhang, Y.-Y.; Chen, Y.-M.; Zhu, H.-L. Adherence to the Chinese or American Dietary Guidelines is Associated with a Lower Risk of Primary Liver Cancer in China: A Case-Control Study. Nutrients 2018, 10, 1113. [Google Scholar] [CrossRef] [PubMed] [Green Version]
- Yu, L.; Liu, L.; Wang, F.; Zhou, F.; Xiang, Y.; Huang, S.; Yin, G.; Zhuo, Y.; Ma, Z.; Zhang, Q.; et al. Higher frequency of dairy intake is associated with a reduced risk of breast cancer: Results from a case-control study in Northern and Eastern China. Oncol. Lett. 2019, 17, 2737–2744. [Google Scholar] [CrossRef]
- Shiao, S.P.K.; Grayson, J.; Lie, A.; Yu, C.H. Predictors of the Healthy Eating Index and Glycemic Index in Multi-Ethnic Colorectal Cancer Families. Nutrients 2018, 10, 674. [Google Scholar] [CrossRef] [Green Version]
- Krause, C.; Sommerhalder, K.; Beer-Borst, S.; Abel, T. Just a subtle difference? Findings from a systematic review on definitions of nutrition literacy and food literacy. Health Promot. Int. 2016, 33, 378–389. [Google Scholar] [CrossRef] [Green Version]
- Liao, L.; Lai, I.; Chang, L. Nutrition literacy is associated with healthy-eating behavior among college students in Taiwan. Health Educ. J. 2019, 78, 756–769. [Google Scholar] [CrossRef]
- Zoellner, J.M.; Hedrick, V.E.; You, W.; Chen, Y.; Davy, B.M.; Porter, K.J.; Bailey, A.; Lane, H.; Alexander, R.; Estabrooks, P.A. Effects of a behavioral and health literacy intervention to reduce sugar-sweetened beverages: A randomized-controlled trial. Int. J. Behav. Nutr. Phys. Act. 2016, 13, 1–12. [Google Scholar] [CrossRef] [PubMed] [Green Version]
- Liu, S.; Zhou, W.; Wang, J.; Chen, B.; He, G.; Jia, Y. Association between Mobile Phone Addiction Index and Sugar-Sweetened Food Intake in Medical College Students Stratified by Sex from Shanghai, China. Nutrients 2021, 13, 2256. [Google Scholar] [CrossRef] [PubMed]
- Wyse, R.; Gabrielyan, G.; Wolfenden, L.; Yoong, S.; Swigert, J.; Delaney, T.; Lecathelinais, C.; Ooi, J.Y.; Pinfold, J.; Just, D. Can changing the position of online menu items increase selection of fruit and vegetable snacks? A cluster randomized trial within an online canteen ordering system in Australian primary schools. Am. J. Clin. Nutr. 2019, 109, 1422–1430. [Google Scholar] [CrossRef] [PubMed]
- Yuan, Y.-Q.; Li, F.; Wu, H.; Wang, Y.-C.; Chen, J.-S.; He, G.-S.; Li, S.-G.; Chen, B. Evaluation of the Validity and Reliability of the Chinese Healthy Eating Index. Nutrients 2018, 10, 114. [Google Scholar] [CrossRef] [PubMed] [Green Version]
- Wang, J.Q.; Li, F.; Jia, Y.N.; Fu, H. Development of nutrition literacy assessment questionnaire for college students and the evaluation of relability and validity. Fudan Univ. J. Med. Sci. 2021, 48, 383–387. [Google Scholar] [CrossRef]
- Guttersrud, Ø.; Dalane, J.Ø.; Pettersen, S. Improving measurement in nutrition literacy research using Rasch modelling: Examining construct validity of stage-specific ‘critical nutrition literacy’ scales. Public Health Nutr. 2014, 17, 877–883. [Google Scholar] [CrossRef] [Green Version]
- Zhang, L.; Jia, Y.N.; Qian, H.H.; Fu, H. Development of assessment indicators system of health literacy for college students in China. Health Educ. Health Promot. 2018, 13, 514–519. [Google Scholar] [CrossRef]
- Zhu, Y.-B. “Obesity paradox”—A phenomenon based upon the health-related outcome on quality of life. Chin. J. Epidemiol. 2013, 34, 294–296. [Google Scholar] [CrossRef]
- Racette, S.B.; Deusinger, S.S.; Strube, M.J.; Highstein, G.R.; Deusinger, R.H. Changes in Weight and Health Behaviors from Freshman through Senior Year of College. J. Nutr. Educ. Behav. 2008, 40, 39–42. [Google Scholar] [CrossRef]
- Wardle, J.; Steptoe, A.; Bellisle, F.; Davou, B.; Reschke, K.; Lappalainen, R.; Fredrikson, M. Health dietary practices among European students. Health Psychol. 1997, 16, 443–450. [Google Scholar] [CrossRef]
- Werner, E.; Betz, H.H. Knowledge of physical activity and nutrition recommendations in college students. J. Am. Coll. Health 2020, 2020, 1–7. [Google Scholar] [CrossRef] [PubMed]
- Dolatkhah, N.; Aghamohammadi, D.; Farshbaf-Khalili, A.; Hajifaraji, M.; Hashemian, M.; Esmaeili, S. Nutrition knowledge and attitude in medical students of Tabriz University of Medical Sciences in 2017–2018. BMC Res. Notes 2019, 12, 1–6. [Google Scholar] [CrossRef] [Green Version]
- Santos, O.; Alarcão, V.; Feteira-Santos, R.; Fernandes, J.; Virgolino, A.; Sena, C.; Vieira, C.P.; Gregório, M.J.; Nogueira, P.; Graça, P.; et al. Impact of different front-of-pack nutrition labels on online food choices. Appetite 2020, 154, 104795. [Google Scholar] [CrossRef]
- Papadaki, A.; Hondros, G.; Scott, J.A.; Kapsokefalou, M. Eating habits of University students living at, or away from home in Greece. Appetite 2007, 49, 169–176. [Google Scholar] [CrossRef]
- AlJohani, S.; Salam, M.; BaniMustafa, A.A.; Zaidi, A.R.; Aljohani, A.A.; Almutairi, A.; AlJohani, M.A.; AlSheef, M. Dietary Habits of Students Enrolled in Faculties of Health Sciences: A Cross-sectional Study. Cureus 2019, 11, e6012. [Google Scholar] [CrossRef] [PubMed] [Green Version]
- Kulawik, P.; Özogul, F.; Glew, R.; Özogul, Y. Significance of Antioxidants for Seafood Safety and Human Health. J. Agric. Food Chem. 2013, 61, 475–491. [Google Scholar] [CrossRef] [PubMed]
- ZibaeeNezhad, M.J.; Ghavipisheh, M.; Attar, A.; Aslani, A. Comparison of the effect of omega-3 supplements and fresh fish on lipid profile: A randomized, open-labeled trial. Nutr. Diabetes 2017, 7, 1–8. [Google Scholar] [CrossRef] [PubMed] [Green Version]
- Lazzeri, G.; Pammolli, A.; Azzolini, E.; Simi, R.; Meoni, V.; De Wet, D.R.; Giacchi, M.V. Association between fruits and vegetables intake and frequency of breakfast and snacks consumption: A cross-sectional study. Nutrients J. 2013, 12, 123. [Google Scholar] [CrossRef] [Green Version]
- Yahia, N.; El-Ghazale, H.; Achkar, A.; Rizk, S. Dieting practices and body image perception among Lebanese university students. Asia Pac. J. Clin. Nutr. 2011, 20, 21–28. [Google Scholar]
- Von Bothmer, M.I.K.; Fridlund, B. Gender differences in health habits and in motivation for a healthy lifestyle among Swedish university students. Nurs. Health Sci. 2005, 7, 107–118. [Google Scholar] [CrossRef]
- Yahia, N.; Brown, C.A.; Rapley, M.; Chung, M. Level of nutrition knowledge and its association with fat consumption among college students. BMC Public Health 2016, 16, 1–10. [Google Scholar] [CrossRef] [PubMed] [Green Version]
- Graves, R.J.; Williams, S.G.; Hauff, C.; Fruh, S.M.; Sims, B.; Hudson, G.M.; McDermott, R.C.; Sittig, S.; Shaw, T.; Campbell, M.; et al. Undergraduate versus graduate nursing students: Differences in nutrition, physical activity, and self-reported body mass index. J. Am. Coll. Health 2020, 2020, 1–6. [Google Scholar] [CrossRef] [PubMed]
- Yang, S.C.; Luo, Y.F.; Chiang, C.-H. Electronic Health Literacy and Dietary Behaviors in Taiwanese College Students: Cross-Sectional Study. J. Med. Internet Res. 2019, 21, e13140. [Google Scholar] [CrossRef] [PubMed] [Green Version]
- Maher, C.; Olds, T.S.; Eisenmann, J.C.; Dollman, J. Screen time is more strongly associated than physical activity with overweight and obesity in 9- to 16-year-old Australians. Acta Paediatr. 2012, 101, 1170–1174. [Google Scholar] [CrossRef] [PubMed]
- Oliver, M.; Duncan, S.; Kuch, C.; McPhee, J.; Schofield, G. Prevalence of New Zealand Children and Adolescents Achieving Current Physical Activity and Television Watching Recommendations. J. Phys. Act. Health 2012, 9, 173–187. [Google Scholar] [CrossRef] [PubMed]
- Hebden, L.A.; King, L.; Grunseit, A.; Kelly, B.; Chapman, K. Advertising of fast food to children on Australian television: The impact of industry self-regulation REPLY. Med J. Aust. 2011, 195, 453. [Google Scholar] [CrossRef]
- Sharma, M. Dietary Education in School-Based Childhood Obesity Prevention Programs. Adv. Nutr. Int. Rev. J. 2011, 2, 207S–216S. [Google Scholar] [CrossRef] [Green Version]
- Huang, L.; Wang, Z.; Wang, H.; Zhao, L.; Jiang, H.; Zhang, B.; Ding, G. Nutrition transition and related health challenges over decades in China. Eur. J. Clin. Nutr. 2021, 75, 247–252. [Google Scholar] [CrossRef]
- Geelen, A.; Souverein, O.W.; Busstra, M.C.; De Vries, J.H.; Veer, P.V. ‘T Comparison of approaches to correct intake–health associations for FFQ measurement error using a duplicate recovery biomarker and a duplicate 24 h dietary recall as reference method. Public Health Nutr. 2014, 18, 226–233. [Google Scholar] [CrossRef] [Green Version]


| Characteristics | Male (n (%)) | Female (n (%)) | χ2 Value | p Value | |
|---|---|---|---|---|---|
| Age (years) | <26 | 72 (64.90) | 106 (61.60) | 0.303 | 0.582 |
| ≥26 | 39 (35.10) | 66 (38.40) | |||
| Education | Undergraduate | 64 (57.70) | 62 (36.00) | 12.756 | <0.001 |
| Graduate | 47 (42.30) | 110 (64.00) | |||
| Major | Medical major | 107 (96.40) | 159 (92.40) | 1.869 | 0.172 |
| Medical-related major | 4 (3.60) | 13 (7.60) | |||
| Household type | Urban | 53 (47.70) | 96 (55.80) | 1.761 | 0.185 |
| Countryside | 58 (52.30) | 76 (44.20) | |||
| Resident student | Yes | 106 (95.50) | 169 (98.30) | 1.871 | 0.171 |
| No | 5 (4.50) | 3 (1.70) | |||
| Dietary habit | General diet | 101 (91.00) | 169 (98.30) | 8.124 | 0.004 |
| Other diet a | 10 (9.00) | 3 (1.70) | |||
| BMI (kg/m2) | Underweight | 3 (2.70) | 37 (21.50) | 47.435 | <0.001 |
| Normal weight | 73 (65.80) | 126 (73.30) | |||
| Overweight and obesity | 35 (31.50) | 9 (5.20) | |||
| Smoking | Yes | 4 (3.60) | 0 (0.00) | 6.287 | 0.012 |
| No | 107 (96.40) | 172 (100.00) | |||
| Median (IQR) | Median (IQR) | Z value | |||
| Nutrition Literacy Assessment Questionnaire | Acquisition capacity | 12.00 (8.00, 13.00) | 12.00 (11.00, 15.00) | −3.942 | <0.001 |
| Comprehension capacity | 22.00 (18.00, 24.00) | 23.00 (20.00, 24.00) | −1.900 | 0.058 | |
| Application capacity | 10.00 (9.00, 12.00) | 12.00 (9.00, 12.00) | −3.700 | <0.001 | |
| Sedentary time (hour/day) | — | 8.00 (5.00, 10.00) | 8.00 (6.00, 10.00) | −0.680 | 0.497 |
| Leftovers rate (%) | — | 10.00 (5.00, 10.00) | 10.00 (10.00, 20.00) | −4.434 | <0.001 |
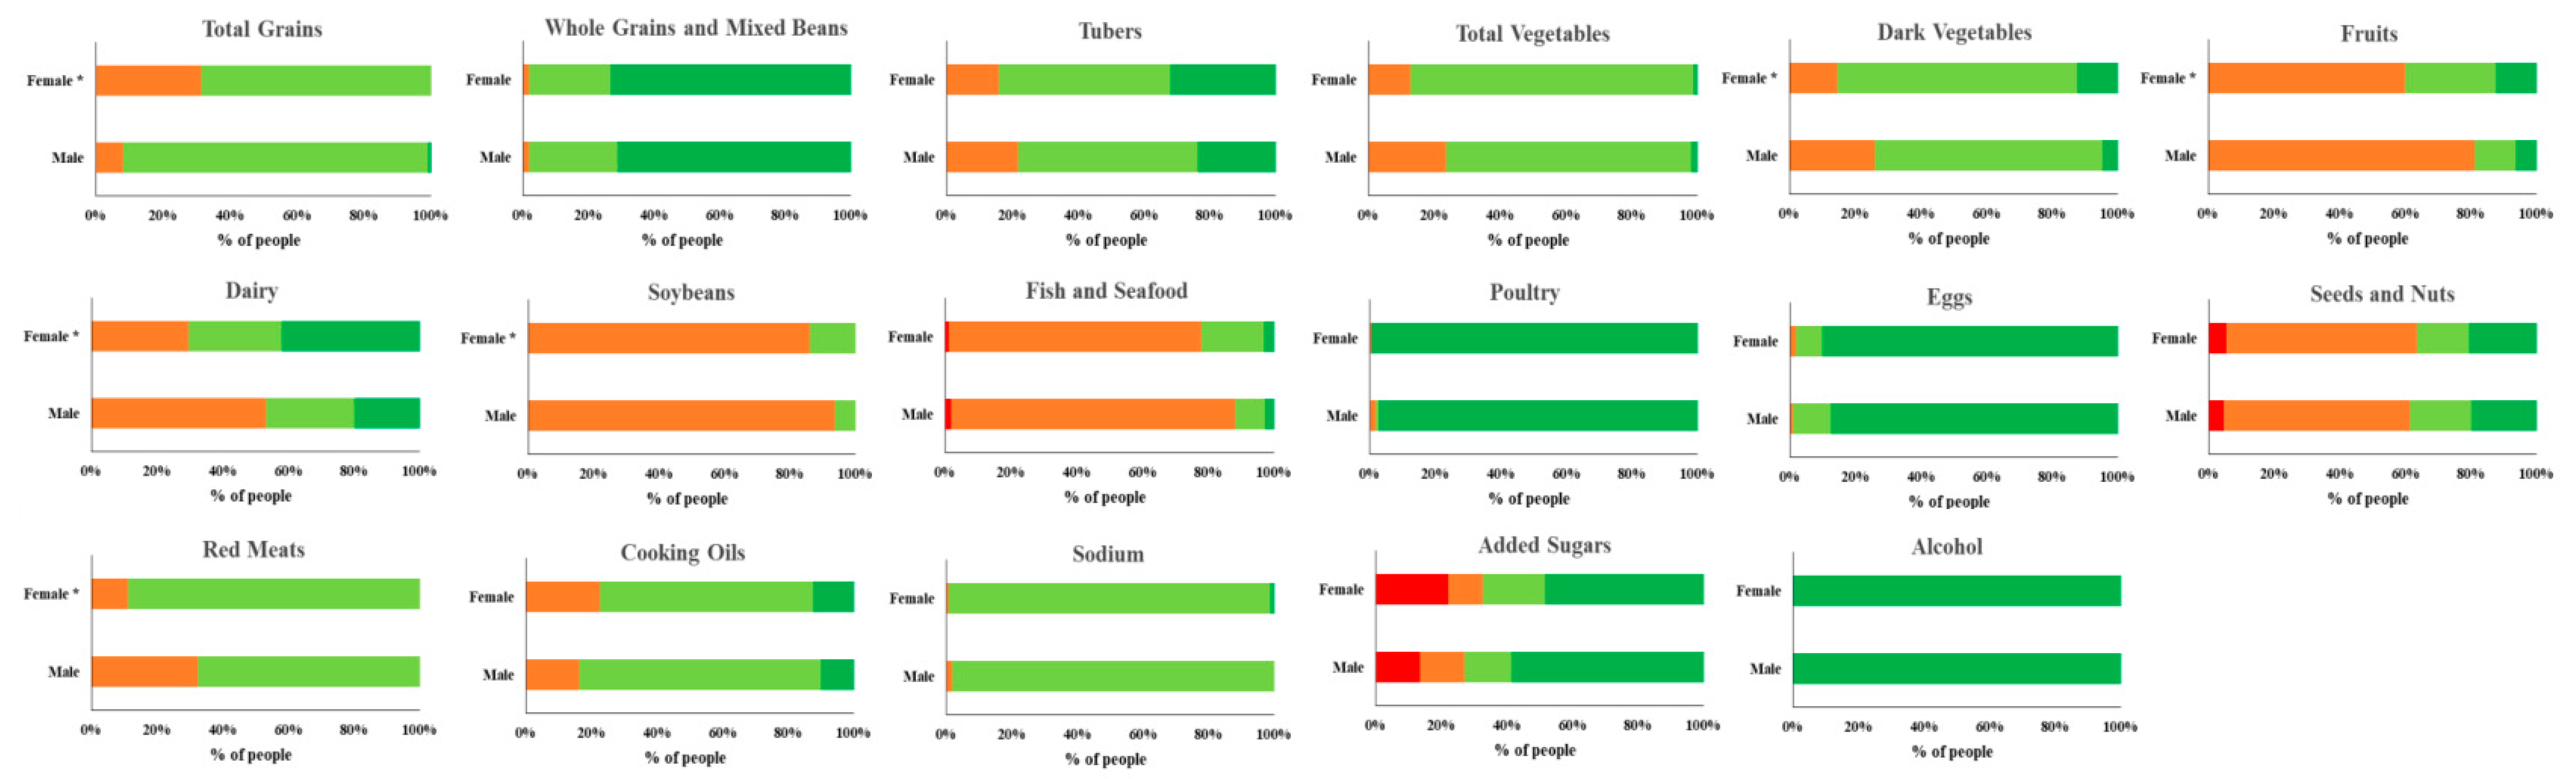
| CHEI and Component Scores | Total Participants | Male (n = 111) | Female (n = 172) | p Value |
|---|---|---|---|---|
| CHEI | 66.65 (63.17, 70.41) | 64.31 (61.31, 68.59) | 68.38 (64.63, 71.95) | <0.001 |
| Total Grains | 2.95 (2.57, 3.33) | 3.25 (2.79, 3.64) | 2.78 (2.40, 3.14) | <0.001 |
| Whole Grains and Mixed Beans | 5.00 (4.87, 5.00) | 5.00 (4.84, 5.00) | 5.00 (4.87, 5.00) | 0.588 |
| Tubers | 3.85 (2.85, 5.00) | 3.54 (2.60, 4.90) | 4.13 (2.99, 5.00) | 0.043 |
| Total Vegetables | 3.16 (2.66, 3.72) | 2.85 (2.51, 3.35) | 3.36 (2.85, 3.88) | <0.001 |
| Dark Vegetables | 3.35 (2.67, 4.08) | 2.95 (2.44, 3.70) | 3.59 (2.92, 4.26) | <0.001 |
| Fruits | 3.5 (1.94, 5.96) | 2.43 (1.16, 3.93) | 4.39 (2.71, 6.81) | <0.001 |
| Dairy | 3.64 (1.65, 5.00) | 2.35 (0.96, 4.58) | 4.19 (2.24, 5.00) | <0.001 |
| Soybeans | 1.69 (1.30, 2.06) | 1.62 (1.30, 2.00) | 1.73 (1.35, 2.09) | 0.281 |
| Fish and Seafood | 1.22 (0.62, 1.94) | 0.85 (0.41, 1.76) | 1.56 (0.79, 2.27) | <0.001 |
| Poultry | 5.00 (5.00, 5.00) | 5.00 (5.00, 5.00) | 5.00 (5.00, 5.00) | 0.143 |
| Eggs | 5.00 (5.00, 5.00) | 5.00 (5.00, 5.00) | 5.00 (5.00, 5.00) | 0.516 |
| Seeds and Nuts | 1.65 (0.48, 3.99) | 1.41 (0.45, 3.79) | 1.72 (0.52, 4.33) | 0.692 |
| Red Meats | 3.09 (2.65, 3.53) | 2.89 (2.41, 3.39) | 3.18 (2.85, 3.58) | <0.001 |
| Cooking Oils | 7.12 (5.29, 8.67) | 7.22 (5.72, 8.58) | 6.91 (5.11, 8.71) | 0.432 |
| Sodium | 7.64 (7.17, 8.34) | 7.80 (7.35, 8.49) | 7.53 (7.12, 8.33) | 0.104 |
| Added Sugars | 5.00 (1.47, 5.00) | 5.00 (1.87, 5.00) | 4.89 (1.22, 5.00) | 0.084 |
| Alcohol | 5.00 (5.00, 5.00) | 5.00 (5.00, 5.00) | 5.00 (5.00, 5.00) | 0.999 |
| Characteristics | Univariate Linear Regression Model | Multiple Linear Regression Model b | |||
|---|---|---|---|---|---|
| β (95 % CI) | p Value | β (95 % CI) | p Value | ||
| Age (years) | ≥26 | 1.01 (−0.47, 2.49) | 0.179 | 0.17 (−1.51, 1.85) | 0.844 |
| <26 | 1.00 (reference) | 1.00 (reference) | |||
| Sex | Female | 3.77 (2.47, 5.06) | <0.001 | 2.80 (1.24, 4.35) | <0.001 |
| Male | 1.00 (reference) | 1.00 (reference) | |||
| Education | Graduate | 2.04 (0.72, 3.36) | <0.001 | 1.56 (0.23, 2.89) | 0.022 |
| Undergraduate | 1.00 (reference) | 1.00 (reference) | |||
| Major | Medical-related major | 1.33 (−1.48, 4.14) | 0.353 | −0.06 (−2.79, 2.68) | 0.969 |
| Medical major | 1.00 (reference) | 1.00 (reference) | |||
| Household type | Countryside | 0.13 (−1.21, 1.47) | 0.849 | 0.43 (−0.86, 1.72) | 0.509 |
| Urban | 1.00 (reference) | 1.00 (reference) | |||
| Resident student | No | −3.06 (−7.08, 0.96) | 0.136 | −2.56 (−6.47, 1.34) | 0.198 |
| Yes | 1.00 (reference) | 1.00 (reference) | |||
| Dietary habit | Other diet a | 0.28 (−2.92, 3.47) | 0.863 | 2.37 (−0.73, 5.46) | 0.133 |
| General diet | 1.00 (reference) | 1.00 (reference) | |||
| Nutrition Literacy Assessment Questionnaire | Acquisition capacity | 0.23 (0.04, 0.42) | 0.018 | 0.10 (−0.09, 0.29) | 0.296 |
| Comprehension capacity | 0.04 (−0.14, 0.21) | 0.680 | −0.12 (−0.31, 0.08) | 0.237 | |
| Application capacity | 0.37 (0.11, 0.64) | 0.006 | 0.34 (0.03, 0.66) | 0.031 | |
| BMI (kg/m2) | Underweight | 0.95 (−0.98, 2.87) | 0.334 | 0.22 (−1.68, 2.12) | 0.819 |
| Overweight and obesity | −2.47 (−4.32, −0.62) | 0.009 | −0.99 (−2.86, 0.88) | 0.298 | |
| Normal weight | 1.00 (reference) | 1.00 (reference) | |||
| Smoking | No | 4.91 (−0.72,10.55) | 0.087 | 3.01 (−2.46, 8.49) | 0.279 |
| Yes | 1.00 (reference) | 1.00 (reference) | |||
| Sedentary time (hour/day) | −0.14 (−0.27, −0.01) | 0.043 | −0.16 (−0.28, −0.03) | 0.016 | |
Publisher’s Note: MDPI stays neutral with regard to jurisdictional claims in published maps and institutional affiliations. |
© 2022 by the authors. Licensee MDPI, Basel, Switzerland. This article is an open access article distributed under the terms and conditions of the Creative Commons Attribution (CC BY) license (https://creativecommons.org/licenses/by/4.0/).
Share and Cite
Liu, S.; Wang, J.; He, G.; Chen, B.; Jia, Y. Evaluation of Dietary Quality Based on Intelligent Ordering System and Chinese Healthy Eating Index in College Students from a Medical School in Shanghai, China. Nutrients 2022, 14, 1012. https://0-doi-org.brum.beds.ac.uk/10.3390/nu14051012
Liu S, Wang J, He G, Chen B, Jia Y. Evaluation of Dietary Quality Based on Intelligent Ordering System and Chinese Healthy Eating Index in College Students from a Medical School in Shanghai, China. Nutrients. 2022; 14(5):1012. https://0-doi-org.brum.beds.ac.uk/10.3390/nu14051012
Chicago/Turabian StyleLiu, Shaojie, Jiangqi Wang, Gengsheng He, Bo Chen, and Yingnan Jia. 2022. "Evaluation of Dietary Quality Based on Intelligent Ordering System and Chinese Healthy Eating Index in College Students from a Medical School in Shanghai, China" Nutrients 14, no. 5: 1012. https://0-doi-org.brum.beds.ac.uk/10.3390/nu14051012