
Body Composition of Infants Born with Intrauterine Growth Restriction: A Systematic Review and Meta-Analysis


1
Maternal and Child Health (Nutrition), Society for Applied Studies, Centre for Health Research and Development, 45-Kalusarai, New Delhi 110016, India
2
Maternal and Child Health (Implementation Research), Society for Applied Studies, Centre for Health Research and Development, 45-Kalusarai, New Delhi 110016, India
3
Comprehensive Health Research Centre, Medicine of Woman, Childhood and Adolescence, NOVA Medical School|Faculdade de Ciências Médicas, Universidade Nova de Lisboa, Campo dos Mártires da Pátria, Nr 130, 1169-056 Lisbon, Portugal
4
NICU, Hospital Dona Estefânia, Centro Hospitalar Universitário de Lisboa Central, Rua Jacinta Marto, 1169-045 Lisbon, Portugal
*
Author to whom correspondence should be addressed.
Nutrients 2022, 14(5), 1085; https://0-doi-org.brum.beds.ac.uk/10.3390/nu14051085
Submission received: 5 February 2022
/
Revised: 1 March 2022
/
Accepted: 2 March 2022
/
Published: 4 March 2022
(This article belongs to the Special Issue New Insights in Early Growth of Premature Infants: Lifelong Health Programming)
Abstract
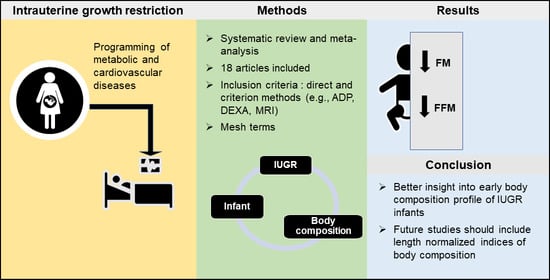
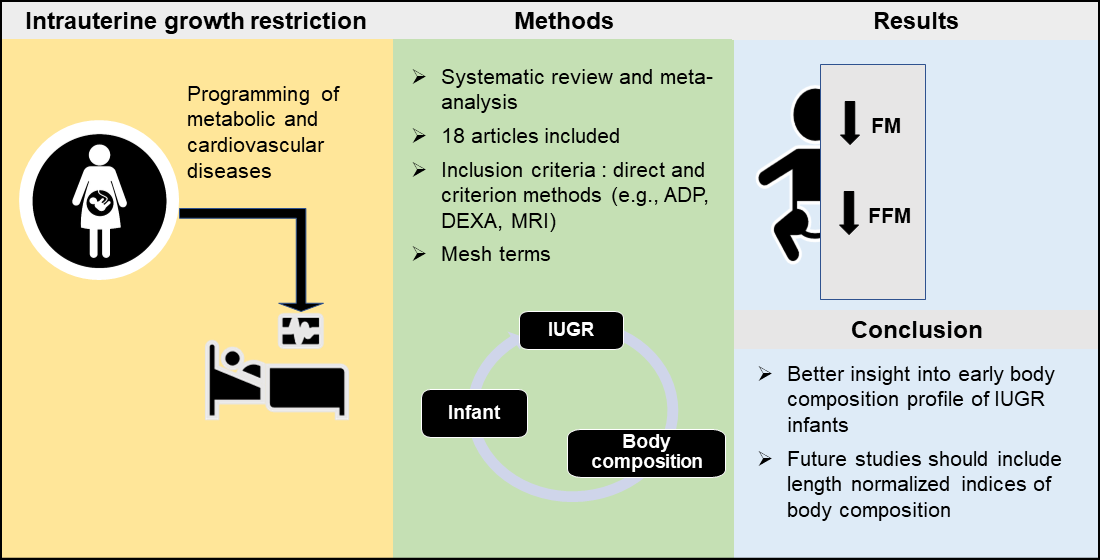
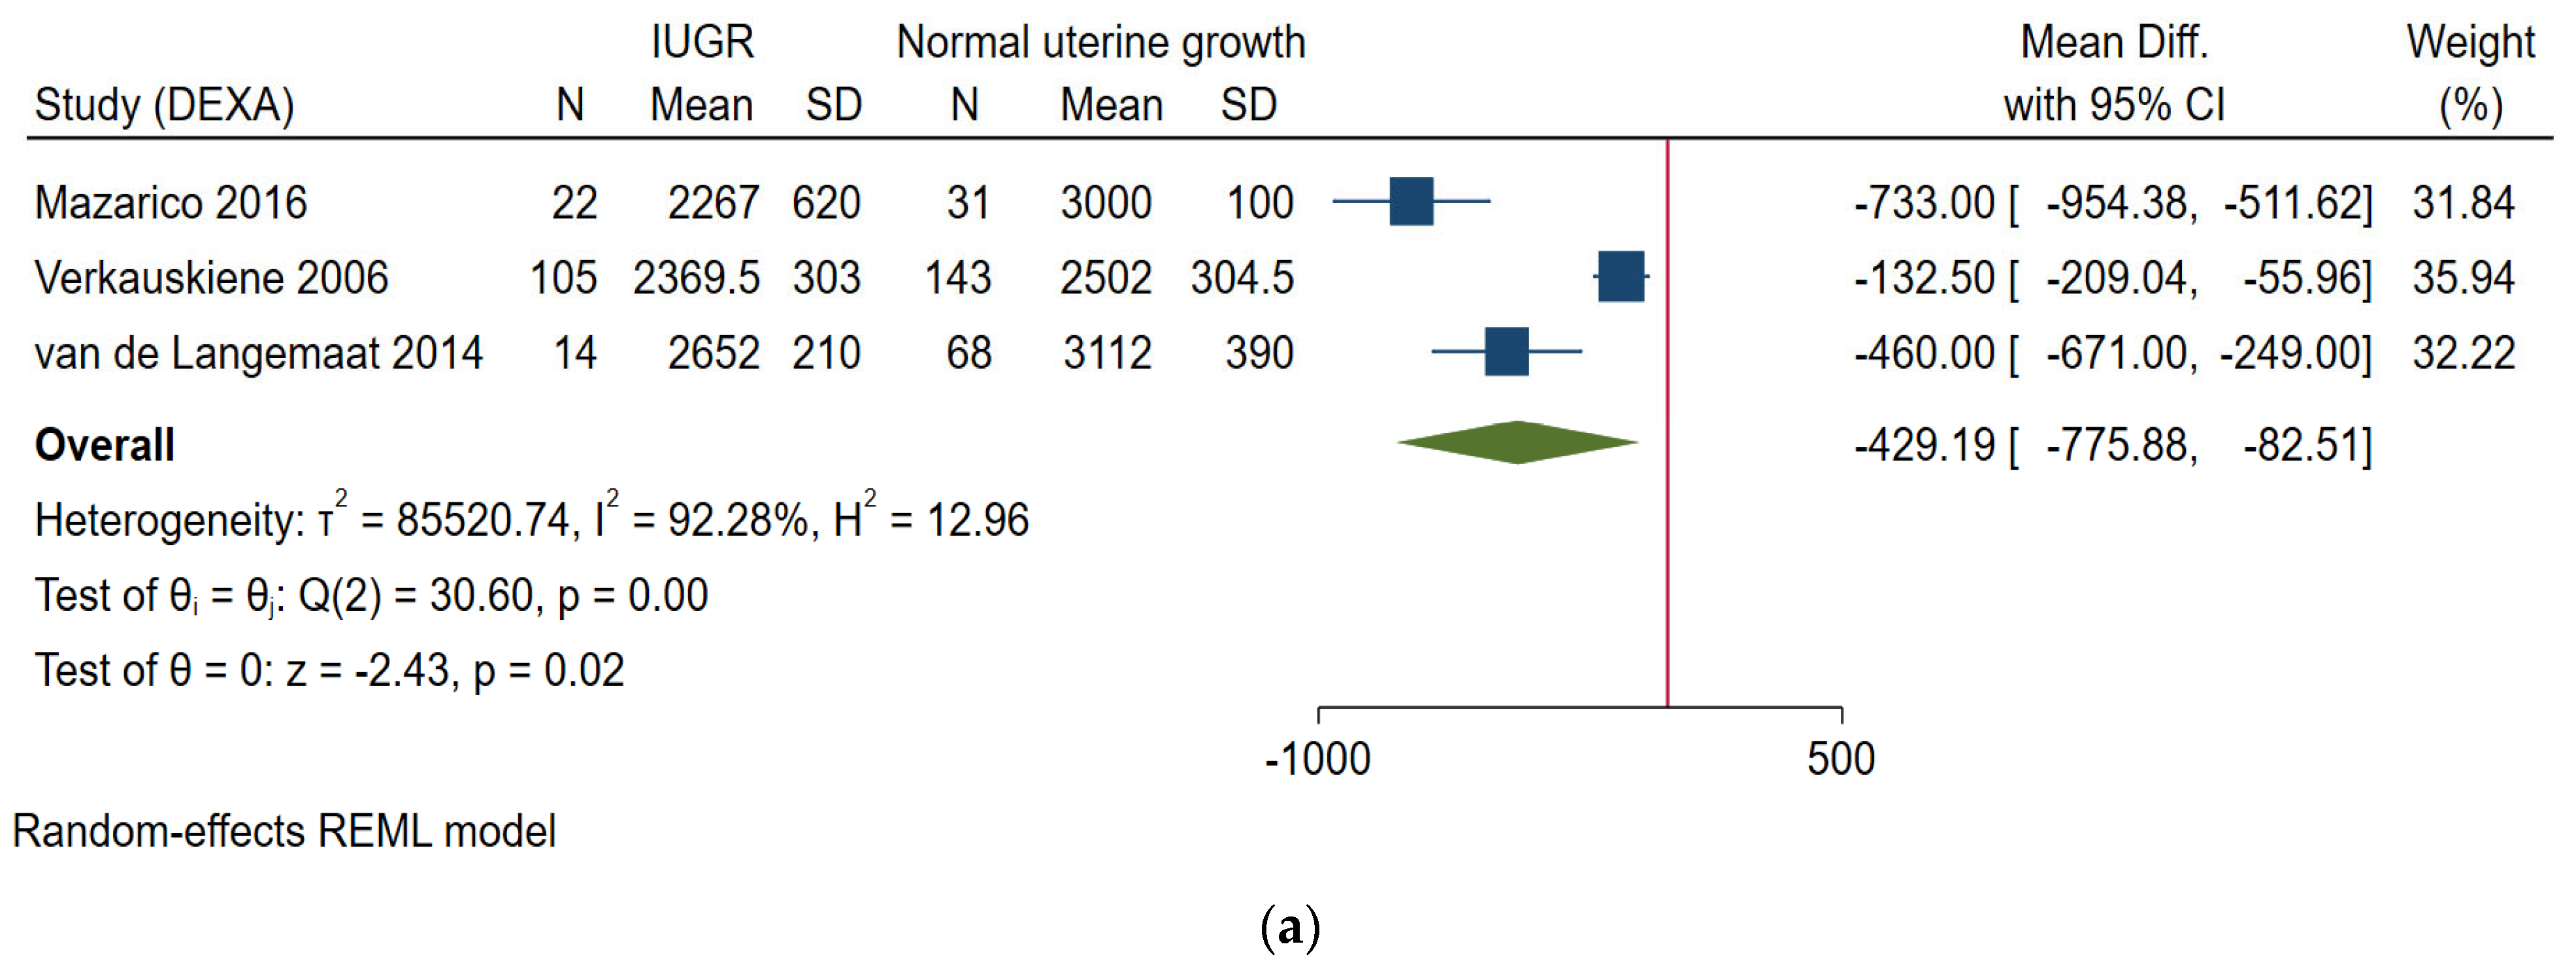
:Intrauterine growth restriction (IUGR) may predispose metabolic diseases in later life. Changes in fat-free mass (FFM) and fat mass (FM) may explain this metabolic risk. This review studied the effect of IUGR on body composition in early infancy. Five databases and included studies from all countries published from 2000 until August 2021 were searched. Participants were IUGR or small-for-gestational age (SGA) infants, and the primary outcomes were FFM and FM. Eighteen studies met the inclusion criteria, of which seven were included in the meta-analysis of primary outcomes. Overall, intrauterine growth-restricted and SGA infants were lighter and shorter than normal intrauterine growth and appropriate-for-gestational age infants, respectively, from birth to the latest follow up. They had lower FFM [mean difference −429.19 (p = 0.02)] and FM [mean difference −282.9 (p < 0.001)]. The issue of whether lower FFM and FM as reasons for future metabolic risk in IUGR infants is intriguing which could be explored in further research with longer follow-up. This review, the first of its kind can be useful for developing nutrition targeted interventions for IUGR infants in future.
1. Introduction
According to Barker’s hypothesis, intrauterine growth restriction (IUGR) predisposes to metabolic diseases in later life [1]. Many of the studies used the terms “IUGR” and “small for gestational age” (SGA) synonymously [2]. SGA is commonly defined as those infants whose birth weight is less than the 10th percentile for gestational age or two standard deviations below the population norms on the growth charts. However, the definition does not consider intrauterine growth trajectory and physical characteristics at birth [3,4,5]. An IUGR is a clinical definition and applies to fetal growth deceleration and/or neonates born with clinical features of intrauterine malnourishment, irrespective of their birth weight percentile in relation to gestational age [4]. SGA infants may constitute intrauterine growth restricted as well as constitutionally small infants [3].
Existing evidence suggests both IUGR and SGA have been associated with metabolic complications in later life [6]. Extensive research has shown that increased body fatness or fast postnatal catch-up growth are the reasons for the metabolic risk [7,8]. Additionally, evidence from longitudinal studies also reported that low body fat mass (FM) in early childhood may precede early adiposity rebound which predisposes toward late obesity [9]. There is less evidence on the effect of IUGR on postnatal body composition. This information is important to design nutritional interventions for intrauterine growth-restricted or SGA infants [10,11].
There is a growing body of literature that reports that infants born as growth restricted have a different body composition than those born with normal intrauterine growth [5,12,13]. Existing systematic reviews on body composition of infants born preterm did not distinguish whether the infants suffered IUGR or were born with normal intrauterine growth [14]. Much uncertainty still exists about the effect of fetal growth restriction on the quality of growth in early infancy, based on body composition assessment. Prolonging intrauterine malnutrition into extrauterine life may have specific consequences as undernourishment in the early postnatal months with subsequent rapid catch-up growth is a risk factor for chronic diseases related to nutrition in adult life [15]. The commonly used measurements of body composition are FM to assess body fat, fat-free mass (FFM) as a surrogate of body lean mass, and the derived indices percentage of fat mass (%FM) and fat mass index (FMI) to estimate adiposity.
Hence, the main aim of this systematic review is to investigate the differences in body composition measurements of infants with IUGR compared to infants with normal intrauterine growth during the first postnatal months, both in infants born at term and preterm. Additionally, we intend to determine differences in anthropometry of these infants with respect to weight, length, and head circumference.
2. Materials and Methods
2.1. Protocol and Registration
The current systematic review and meta-analysis was conducted and reported in accordance with the PRISMA statement checklist and was registered with PROSPERO (Registration number CRD42021272086).
2.2. Eligibility Criteria, Information Resources, and Search Strategy
All types of studies published in the English language with body composition assessment using only “direct” and “criterion methods” such as total body water (water/isotope-dilution), total body counting, air displacement plethysmography (ADP), dual-energy X-ray absorptiometry (DEXA), and magnetic resonance imaging (MRI) were considered for this review [16]. We excluded “indirect methods” or “double indirect methods” such as anthropometry and bioelectrical impedance analysis [16]. Studies before 2000 were excluded as they were likely to be of limited relevance due to the latest advancement in methods for body composition assessment. Participant criteria were infants diagnosed at birth as IUGR or SGA who were given standard care. Specifically, IUGR was defined based on fetal growth deceleration and/or clinical features of intrauterine malnourishment at birth, and SGA on birth weight less than the 10th percentile for gestational age or two standard deviations below the population norms on the growth charts [3,4].
We made a comprehensive search between 2000 to 2021, that included original articles published in PubMed (www.ncbi.nlm.nih.gov; accessed on 10 August 2021); Embase (www.embase.com; accessed on 10 August 2021); Web of Science (apps.webofknowledge.com; accessed on 10 August 2021); Scopus (www.scopus.com; accessed on 10 August 2021), and LILACS (LILACS.bvsalud.org; accessed on 10 August 2021). Two review authors (R.M, and B.P.) independently screened all the titles and abstracts identified by the search strategy (Supplementary Table S1). Disagreements were resolved by discussion or referring to a third review author (LPdS). Screening and full-text review of the articles were managed using the free web-based software, Rayyan [17]. We extracted data using the modified Cochrane Effective Practice and Organization of Care Group data collection checklist [18].
2.3. Data Extraction and Items
The following details were extracted from each and included: study author(s); year of publication; and year in which study was conducted; study design; type, duration, and completeness of follow up (e.g., greater than 80%); country and location of study; fund details; sampling strategy; participant recruitment method; inclusion and exclusion criteria for study; follow-up percentage; pre-specified plan for analysis and dealing missing data and information on the start and end dates of enrolment, gestational age, number of participants (in index and control groups); details on feeding pattern; any comorbidities among enrolled participants, and the method of assessment of body composition. Outcome measures are reported as the mean difference with the associated 95% confidence intervals (CI). Screening and data extraction was managed using the free web-based software, Rayyan (http://rayyan.qcri.org; accessed on 10 November 2021).
2.4. Assessment of Quality
The assessment of the risk of bias was conducted to define the methodological quality of the included studies using the Newcastle–Ottawa Scale (NOS). The selection, comparability, and outcome were scored, and the total score was categorized as high risk of bias (total score of 0–2), moderate risk of bias (total score of 3–5), and low risk of bias (total score of 6–8) [19]. Two review authors (B.P. and R.M.) independently assessed the risk of bias [20]. We also ruled out the potential chance of publication bias using egger’s score. The main concern for bias and imprecision of the included studies were the precision and validity of the methods used and the criteria to define IUGR. The decision was taken to do meta-analysis for only those studies that used the criterion method of body composition assessment and using population-based growth charts for defining SGA and matching for gestational age at assessment.
Since we have only pooled studies with the same criteria for defining the study population, no separate assessment of heterogeneity was performed. Additionally, the number of studies at each time point were lesser, hence no sensitivity analysis was conducted.
2.5. Data Synthesis
We used the methods described in the Cochrane Handbook for Systematic Reviews of Interventions (Version 6.2, 2021) for data extraction and analysis [20]. The primary analysis was meta-analysis, but a narrative synthesis has been used where studies were unable to pool. The fixed effect meta-analysis (inverse variance method) was used to combine data when study outcomes were similar in magnitude and direction. Studies that used the same method of body composition assessment were pooled together for meta-analysis. In cases of high heterogeneity (defined as I2 value greater than 50% [21]), a random effects model, and Restricted Maximum Likelihood Methods (REML) were used [20]. The outcomes for this review were categorized into primary and secondary. The primary outcome measures for the study were body composition measurements: FFM and FM, and the derived indices %FM, percentage of FFM (%FFM), FMI, and FFMI. The study defined IUGR (prenatal diagnosis of fetal growth restriction by ultrasound biometric or Doppler measurements or clinical diagnosis signs of IUGR at birth) and SGA (birth weight less than the 10th percentile of standard growth charts) were studied separately for analysis. The secondary outcomes (weight, length, and head circumference) were pooled irrespective of the study defined IUGR or SGA. Two age periods were considered in the analysis, the neonatal period (within 28 days of life) and postnatal period up to 6 months of age. Studies included infants born preterm and at term. When infants born preterm (36 weeks of gestation or less) reached term-corrected age (37 to 41 weeks’ postmenstrual age), they were analyzed together with infants born at term. For estimates, we used the mean (SD) of each study. If the study has reported a median with a range for the estimate, the Cochrane formula was used to calculate the mean with the standard deviation of the estimate. The combined mean and SD of the group was used for computing the estimate if there were more than one group with fetal restriction [20]. Infants were the unit of analysis. We presented the results graphically using forest plots. Analyses were conducted using Stata 16 (16.1, StataCorp LLC, College Station, TX, USA) [22].
3. Results
3.1. Study Selection
The PRISMA flowchart for the review process is shown in Figure 1. The searches resulted in 8035 articles, of which 6400 were unique records following the removal of 1635 duplicates. After screening on the title and abstract, 6351 were excluded and 49 were screened on the full text. Eighteen studies were found to be eligible for inclusion.
3.2. Study Description and Results
A summary of studies information is provided in Table 1.
3.3. Study Characteristics
The 18 included studies with their participants and characteristics are described in Table 1. Common reasons for exclusion included using fewer sensitive methods for body composition analysis such as an anthropometric or bioelectrical impedance analyzer. The list of excluded studies is given in Supplementary Table S2.
3.4. Settings
The infants included in this review were recruited from neonatal care units in the United States, Italy, United Kingdom, France, Spain, Germany, Sweden, and India.
3.5. Method of Assessment
Nine studies used DEXA [13,23,24,26,27,28,31,33,35], eight used air displacement plethysmography [12,29,30,32,34,36,37,38] and one study used MRI [25] for body composition analysis. No other methods were used to assess body composition in the included studies. Those studies with the same criteria for IUGR assessment or defining SGA have been pooled in the meta-analysis. Three studies met the criteria for inclusion but the data for SGA infants were not available separately, the authors were not able to provide data for the same.
3.6. Measurements
From the studies included, 12 measured FM and FFM, 14 measured %FM and only 1 study reported LM/FM and %FFM. A total of 9 studies measured body weight, 8 measured length, and 5 measured head circumferences. Length normalized indices FFMI and FMI were reported in only one study.
3.7. Participant Characteristics
The studies included a total of 1589 infants with a mean birth weight of 2461.2 g in the index group and 2860.5 g in the control group. Most of the studies included breastfed infants or predominantly breastfed or formula-fed infants as part of the standard care in the neonatal unit.
3.8. Types of Studies
Out of 18, 6 studies included infants with IUGR to compare to those without IUGR, and 14 studies compared SGA with AGA infants.
3.9. Meta-Analysis (IUGR vs. Normal Intrauterine Growth)
3.9.1. Fat Free Mass (in Grams)
Neonatal Period
Three studies based on DEXA reported on FFM of IUGR infants compared to those without IUGR [13,26,33]. Two of them [26,33] reported on term infants within 10 postnatal days (day 3 and day 10) and later follow up at 4 months and 12 months of age (Figure 2a). One study [13] was on preterm infants at term age, and at 6 months post term. All studies reported lower FFM in growth-restricted infants compared to those without IUGR.
From 6 Weeks to 6 Months of Age
3.9.2. Fat Mass (in Grams)
Neonatal Period
The three studies based on DEXA reported on FM of IUGR infants compared to those without IUGR [13,26,33]. Two of them [26,33] reported on term infants within 10 postnatal days (day 3 and day 10) and later follow up at 4 months and 12 months of age (Figure 2c). One study [13] was on preterm infants at term age and 6 months post-term. All studies reported lower FM in growth-restricted infants compared to those without IUGR.
From 6 Weeks to 6 Months of Age
3.10. Meta-Analysis (SGA vs. AGA)
3.10.1. Fat Free Mass (in Grams)
Eight studies reported FFM as an outcome for term infants [23,26,27,28,31,35,36,37]. Two studies that included preterm infants assessed FFM when they reached term age [13,34]. However, we were unable to pool the studies for meta-analysis as the reference charts used to define SGA were different. The time point of body composition assessment varied from 3 to 5 postnatal days for the term infants and 8 postnatal weeks for preterm infants. All these studies reported lower FFM among SGA infants compared to AGA infants.
3.10.2. Fat Mass (in Grams)
At Term Age
Two studies based on ADP including preterm infants assessed FM at term age, found significantly lower FM in SGA compared to AGA infants [12,34] (Figure 3).
The results of the secondary outcomes of the study are shown in Supplementary Figure S1.
3.11. Quality of Studies
Most of the studies included were of moderate-to-low risk of bias (see Supplementary Table S3 for bias assessment). The overall methods (ADP, DEXA, and MRI) used for defining the criteria for IUGR or SGA have been validated and show almost similar sensitivity in previous studies [39].
4. Discussion
This review was designed to describe the effect of IUGR on the body composition of infants in the first postnatal months and found that those born with IUGR were having significantly lower FFM and FM compared to infants without IUGR. Body composition of SGA compared to AGA infants followed the same pattern as that of intrauterine growth-restricted infants. The most obvious finding to emerge from this study is that IUGR infants or SGA infants did not catch up in FFM or FM up to 6 months of age.
The benefit of having assessed body composition short term after birth is that it may give more insight into the intrauterine growth quality. Accordingly, this study revealed an early IUGR profile characterized by both low body lean and fat mass. These data may be useful for planning and interpreting long-term follow-up studies, contributing to a better understanding of the mechanisms underlying metabolic programming in these individuals.
Particularly at birth or within 10 postnatal days, we found significantly lower FFM and FM among intrauterine growth-restricted infants or SGA infants. Even though no previous review to date didn’t address this issue, the findings concord with another systematic review on preterm infants, not considering their intrauterine growth [14,40]. Overall, the difference in body composition continues the same pattern at a later follow up in the included studies [12,13,33,34]. In growth-restricted preterm infants, van de Lagemaat et al. [13] found lower FFM at term age but no difference at a later follow up. These results were likely to be related to the higher amount of protein in the feeding regime of IUGR infants. It is important that further work should establish the validity of this finding, as the body composition at birth may determine the future metabolic risk [5,41,42].
SGA infants followed the same pattern as that of intrauterine growth-restricted infants. Interestingly, while both IUGR and SGA infants had lower body mass (sum of FFM and FM) than infants born with normal intrauterine growth.
These findings deserve two observations. First, low FFM rather than high FM may be a reason for metabolic complications in adult life of being born intrauterine growth-restricted or SGA [43,44]. Poor growth during fetal life and infancy may permanently constrain FFM and eventually limit metabolic capacity to tolerate a rich diet [45]. Insulin-like growth factor in fetal skeletal muscle has been studied recently for their role in muscle growth, which is affected in the fetus with IUGR [5,46]. Furthermore, in IUGR preterm infants, an early deficit of FFM is of particular concern as it is associated with brain size and poor neurologic outcomes [47,48]. Second, there is evidence of the impact of lower FM on metabolic diseases in later life. In animal models, it was found that depletion of adipose tissue is related to insulin resistance, which predisposes to chronic cardiometabolic disease [7]. This is a matter of concern in IUGR and SGA infants of our study, presenting a significant FM deficit in early infancy. These results provide further support for the hypothesis that the risk of late obesity exists if an early adiposity rebound occurs during childhood [9].
A recent study that defined SGA based on intergrowth 21st standards, gave valuable insight into the pattern of body composition in low–middle income settings [37]. However, we were unable to include this study in the meta-analysis. In concordance with the findings of high-income settings providing standard neonatal care, this study also showed decreased FFM and FM in SGA infants compared to AGA infants. More evidence from low-income settings is required, where postnatal adverse conditions may impair growth, including for infants born at term [15].
One unanticipated finding from our review was that one of the studies compared IUGR SGA and AGA infants with SGA and AGA infants with normal intrauterine growth, and found significantly lower %FM among IUGR AGA infants but not in SGA infants [26]. This finding should be interpreted with caution as the IUGR was defined at birth based on fetal growth velocity between 22 weeks and birth. Another study has assessed FM gain in preterm infants after term corrected age. Consistent with our finding at term age, IUGR AGA and SGA infants had significantly lower FM than AGA infants with normal intrauterine growth. Three months after term, FM was similar across all groups. These findings cannot be extrapolated to all SGA or IUGR AGA infants receiving routine care, as these groups received slightly higher energy intakes across the study period, which might have caused increased FM accretion [37]. It seems possible that the body compositions of preterm infants may vary based on the average daily energy and protein intake [49].
With respect to postnatal anthropometry, SGA and intrauterine growth-restricted infants were lighter and shorter than AGA and normal intrauterine growth infants, from birth to the latest follow up (Supplementary Figure S1). Contrary to earlier literature on gestational age-matched SGA and AGA infants, the head circumference did not differ significantly from the AGA group. This data must be interpreted with caution because of the lower sample size for this outcome [50].
Some study limitations need to be acknowledged. First, we were unable to pool some of the studies due to methodological differences like charts used for defining the population, time of assessment of body composition, and the different methods used for body composition assessment as data from different methods are not interchangeable [51]. Second, when infants born preterm reached term corrected age, they were analyzed together with infants born at term. It is described that preterm infants born with normal intrauterine growth, just because of being preterm, are at greater risk of extrauterine growth restriction due to difficulties in providing optimal nutrition in postnatal life [52,53]. Third, the FMI would be preferred to %FM as an indicator of adiposity, since %FM is a ratio with FM included both in the numerator and denominator (as a component of body mass) [51]. Adjusting FM to a measure unrelated to body fat such as body length, defines adiposity better than %FM [51], even for preterm infants [54]. However, only one study comparing SGA with AGA used FMI [12]. More importantly, in many studies length original measurements were not available or information was missing regarding the reliability of length measurements including interobserver variability. Any inaccuracy in length, when it is squared (as in the FMI), magnifies the error of the index, while losing the ability to differentiate overestimation from underestimation [55]. We were unable to account for individual FM and FFM changes with respect to the length in most of the studies included for the meta-analysis due to the unavailability of the length measurement corresponding to the timepoint of body composition measurement or the sample size of the infants who underwent body composition and length were substantially different [13]. In IUGR compared to normal intrauterine growth, only one study addressed %FM in the context of length and found to be positively correlated with increasing length [25]. In future studies assessing body composition of IUGR infants, a greater focus on length either using length normalized indices [56,57] or regression approach to determine the effect of length and weight on FM and FFM [51] could produce interesting findings that may throw more light on the programming hypothesis of excess FM or FFM accretion and the increased risk of metabolic diseases.
To the best of our knowledge, this is the first systematic review and meta-analysis evaluating, how body composition is affected at birth and short term after birth in infants with IUGR as well as SGA compared to those born with normal intrauterine growth, and this is the major strength of the study. This review lays the groundwork for future nutritional and metabolic research planned on IUGR infants. We suggest relating the infant body composition to antenatal ultrasound biometric or Doppler measurements in future studies to get better evidence of the effect of IUGR on body composition and follow them up to at least two years of age.
5. Conclusions
This review shows the effect of IUGR on growth and body composition in early infancy. During the early postnatal months, IUGR and SGA infants are lighter and shorter than normal growth infants. Assessing the quality of growth through body composition shows that they have lower FFM and FM. This is a novel finding and may have important implications in the postnatal management of IUGR infants. SGA infants showed a similar pattern to that of IUGR infants. The issue of whether lower FFM and particularly lower adiposity, as reasons for future metabolic risk in IUGR infants is intriguing which could be explored in further research with longer follow up. The findings of this review can be useful for developing nutrition targeted interventions for IUGR infants. More studies with longer follow up and adequate sample size and classification based on standard growth charts are required to arrive at conclusions on body composition.
Supplementary Materials
The following supporting information can be downloaded at: https://0-www-mdpi-com.brum.beds.ac.uk/article/10.3390/nu14051085/s1. Table S1: Search strategy. Table S2: List of excluded studies. Table S3: Risk of bias of the included studies. Figure S1: Forest plots of the secondary outcomes.
Author Contributions
Conceptualization, R.M. and L.P.-d.-S.; methodology, R.M. and B.G.; software, R.M.; validation, R.M. and L.P.-d.-S. and B.G.; formal analysis, R.M. and L.P.-d.-S.; investigation, R.M. and L.P.-d.-S.; resources, R.M. and B.G.; data curation, R.M. and L.P.-d.-S.; writing—original draft preparation, R.M. and L.P.-d.-S.; writing—review and editing, R.M., B.G. and L.P.-d.-S.; visualization, R.M. and L.P.-d.-S.; supervision, L.P.-d.-S.; project administration, R.M. and B.G. All authors have read and agreed to the published version of the manuscript.
Funding
This research received no external funding.
Institutional Review Board Statement
Not applicable.
Informed Consent Statement
Not applicable.
Data Availability Statement
The data presented in this study are available in Modi N, 2006; Verkauskiene R, 2007; Ibañez L, 2008; Ibañez L, 2010; Law TL, 2011; Law TL, 2012; van de Langemaat M, 2014; Giannì M, 2016; Mazarico R, 2016; Villela L, 2018.
Conflicts of Interest
The authors declare no conflict of interest.
Abbreviations
| %FM | Percentage fat mass |
| %FFM | Percentage fat-free mass |
| ADP | Air displacement plethysmography |
| DEXA | Dual-energy X-ray absorptiometry |
| FM | Fat mass |
| FMI | Fat mass index |
| FFM | Fat-free mass |
| IUGR | Intrauterine growth restriction |
| MRI | Magnetic resonance imaging |
| SGA | Small for gestational age |
References
- Calkins, K.; Devaskar, S.U. Fetal origins of adult disease. Curr. Probl. Pediatr. Adolesc. Health Care 2011, 41, 158–176. [Google Scholar] [CrossRef] [PubMed] [Green Version]
- Faraci, M.; Renda, E.; Monte, S.; Di Prima, F.A.F.; Valenti, O.; De Domenico, R.; Giorgio, E.; Hyseni, E. Fetal growth restriction: Current perspectives. J. Prenat. Med. 2011, 5, 31–33. [Google Scholar] [PubMed]
- Beune, I.M.; Bloomfield, F.H.; Ganzevoort, W.; Embleton, N.D.; Rozance, P.J.; van Wassenaer-Leemhuis, A.G.; Wynia, K.; Gordijn, S.J. Consensus based definition of growth restriction in the newborn. J. Pediatr. 2018, 196, 71–76.e1. [Google Scholar] [CrossRef]
- Goldenberg, R.L.; Cliver, S.P. Small for gestational age and intrauterine growth restriction: Definitions and standards. Clin. Obstet. Gynecol. 1997, 40, 704–714. [Google Scholar] [CrossRef]
- Okada, T.; Takahashi, S.; Nagano, N.; Yoshikawa, K.; Usukura, Y.; Hosono, S. Early postnatal alteration of body composition in preterm and small-for-gestational-age infants: Implications of catch-up fat. Pediatr. Res. 2015, 77, 136–142. [Google Scholar] [CrossRef] [PubMed] [Green Version]
- Priante, E.; Verlato, G.; Giordano, G.; Stocchero, M.; Visentin, S.; Mardegan, V.; Baraldi, E. Intrauterine growth restriction: New insight from the metabolomic approach. Metabolites 2019, 9, 267. [Google Scholar] [CrossRef] [Green Version]
- de Fluiter, K.S.; van Beijsterveldt, I.A.L.P.; Breij, L.M.; Acton, D.; Hokken-Koelega, A.C.S. Association between fat mass in early life and later fat mass trajectories. JAMA Pediatr. 2020, 174, 1141–1148. [Google Scholar] [CrossRef]
- Goossens, G.H. The metabolic phenotype in obesity: Fat mass, body fat distribution, and adipose tissue function. Obes. Facts 2017, 10, 207–215. [Google Scholar] [CrossRef]
- Rolland-Cachera, M.F.; Péneau, S. Growth trajectories associated with adult obesity. World Rev. Nutr. Diet. 2013, 106, 127–134. [Google Scholar] [CrossRef]
- Roggero, P.; Giannì, M.L.; Liotto, N.; Taroni, F.; Morniroli, D.; Mosca, F. Small for gestational age preterm infants: Nutritional strategies and quality of growth after discharge. J. Matern. Fetal Neonatal Med. 2011, 24 (Suppl. 1), 144–146. [Google Scholar] [CrossRef]
- Tudehope, D.; Vento, M.; Bhutta, Z.; Pachi, P. Nutritional requirements and feeding recommendations for small for gestational age infants. J. Pediatr. 2013, 162, S81–S89. [Google Scholar] [CrossRef] [PubMed]
- Giannì, M.L.; Roggero, P.; Liotto, N.; Taroni, F.; Polimeni, A.; Morlacchi, L.; Piemontese, P.; Consonni, D.; Mosca, F. Body composition in late preterm infants according to percentile at birth. Pediatr. Res. 2016, 79, 710–715. [Google Scholar] [CrossRef] [PubMed] [Green Version]
- van de Lagemaat, M.; Rotteveel, J.; Lafeber, H.; van Weissenbruch, M. Lean mass and fat mass accretion between term age and 6 months post-term in growth-restricted preterm infants. Eur. J. Clin. Nutr. 2014, 68, 1261–1263. [Google Scholar] [CrossRef] [PubMed]
- Johnson, M.J.; Wootton, S.A.; Leaf, A.A.; Jackson, A.A. Preterm birth and body composition at term equivalent age: A systematic review and meta-analysis. Pediatrics 2012, 130, e640–e649. [Google Scholar] [CrossRef] [Green Version]
- Victora, C.G.; Adair, L.; Fall, C.; Hallal, P.C.; Martorell, R.; Richter, L.; Sachdev, H.S.; Maternal and Child Undernutrition Study Group. Maternal and child undernutrition: Consequences for adult health and human capital. Lancet 2008, 371, 340–357. [Google Scholar] [CrossRef] [Green Version]
- Duren, D.L.; Sherwood, R.J.; Czerwinski, S.A.; Lee, M.; Choh, A.C.; Siervogel, R.M.; Cameron Chumlea, W. Body composition methods: Comparisons and interpretation. J. Diabetes Sci. Technol. 2008, 2, 1139–1146. [Google Scholar] [CrossRef] [Green Version]
- Ouzzani, M.; Hammady, H.; Fedorowicz, Z.; Elmagarmid, A. Rayyan—A web and mobile app for systematic reviews. Syst. Rev. 2016, 5, 210. [Google Scholar] [CrossRef] [Green Version]
- Cochrane Effective Practice and Organisation of Care (EPOC). EPOC Resources for Review Authors. 2017. Available online: Epoc.cochrane.org/epoc-resources-review-authors (accessed on 28 November 2021).
- Wells, G.; Shea, B.; O’Connell, D.; Peterson, J.; Welch, V.; Losos, M.; Tugwell, P. The Newcastle-Ottawa Scale (NOS) for Assessing the Quality if Nonrandomised Studies in Meta-Analyses. Available online: http://www.ohri.ca/programs/clinical_epidemiology/oxford.asp (accessed on 26 January 2022).
- Higgins, J.; Thomas, J.; Chandler, J.; Cumpston, M.; Li, T.; Page, M.; Welch, V. Cochrane Handbook for Systematic Reviews of Interventions Version 6.2 (Updated February 2021), 2nd ed.; John Wiley & Sons: Oxford, UK, 2021. [Google Scholar]
- Higgins, J.P.T.; Thompson, S.G.; Deeks, J.J.; Altman, D.G. Measuring inconsistency in meta-analyses. BMJ 2003, 327, 557–560. [Google Scholar] [CrossRef] [Green Version]
- StataCorp. Stata Statistical Software: Release 16; StataCorp LLC.: College Station, TX, USA, 2019. [Google Scholar]
- Koo, W.; Walters, J.; Hockman, E. Body composition in neonates: Relationship between measured and derived anthropometry with dual-energy X-ray absorptiometry measurements. Pediatr. Res. 2004, 56, 694–700. [Google Scholar] [CrossRef] [Green Version]
- Demarini, S.; Koo, W.; Hockman, E. Bone, lean and fat mass of newborn twins versus singletons. Acta Paediatr. 2006, 95, 594–599. [Google Scholar] [CrossRef]
- Modi, N.; Thomas, E.; Harrington, T.; Uthaya, S.; Doré, C.; Bell, J. Determinants of adiposity during preweaning postnatal growth in appropriately grown and growth-restricted term infants. Pediatr. Res. 2006, 60, 345–348. [Google Scholar] [CrossRef] [PubMed] [Green Version]
- Verkauskiene, R.; Beltrand, J.; Claris, O.; Chevenne, D.; Deghmoun, S.; Dorgeret, S.; Alison, M.; Gaucherand, P.; Sibony, O.; Lévy-Marchal, C. Impact of fetal growth restriction on body composition and hormonal status at birth in infants of small and appropriate weight for gestational age. Eur. J. Clin. Endocrinol. 2007, 157, 605–612. [Google Scholar] [CrossRef] [PubMed]
- Ibáñez, L.; Sebastiani, G.; Lopez-Bermejo, A.; Díaz, M.; Gómez-Roig, M.; de Zegher, F. Gender specificity of body adiposity and circulating adiponectin, visfatin, insulin, and insulin growth factor-I at term birth: Relation to prenatal growth. J. Clin. Endocrinol. Metab. 2008, 93, 2774–2778. [Google Scholar] [CrossRef]
- Ibáñez, L.; Sebastiani, G.; Diaz, M.; Gómez-Roig, M.; Lopez-Bermejo, A.; de Zegher, F. Low body adiposity and high leptinemia in breast-fed infants born small-for-gestational-age. J. Pediatr. 2010, 156, 145–147. [Google Scholar] [CrossRef] [PubMed]
- Moyer-Mileur, L.; Slater, H.; Thomson, J.; Mihalopoulos, N.; Byrne, J.; Varner, M. Newborn adiposity measured by plethysmography is not predicted by late gestation two-dimensional ultrasound measures of fetal growth. J. Nutr. 2009, 139, 1772–1778. [Google Scholar] [CrossRef] [PubMed] [Green Version]
- Law, T.; Korte, J.; Katikaneni, L.; Wagner, C.; Ebeling, M.; Newman, R. Ultrasound assessment of intrauterine growth restriction: Relationship to neonatal body composition. Am. J. Obstet. Gynecol. 2011, 205, 255.e1–255.e6. [Google Scholar] [CrossRef]
- deZegher, F.; Sebastiani, G.; Diaz, M.; Sánchez-Infantes, D.; Lopez-Bermejo, A.; Ibáñez, L. Body composition and circulating high-molecular-weight adiponectin and IGF-I in infants born small for gestational age: Breast-versus formula-feeding. Diabetes 2012, 61, 1969–1973. [Google Scholar] [CrossRef] [Green Version]
- Law, T.; Katikaneni, L.; Taylor, S.; Korte, J.; Ebeling, M.; Wagner, C.; Newman, R. Customized versus population-based growth curves: Prediction of low body fat percent at term corrected gestational age following preterm birth. J. Matern. Neonatal Med. 2012, 25, 1142–1147. [Google Scholar] [CrossRef]
- Mazarico, E.; Martinez-Cumplido, R.; Díaz, M.; Sebastiani, G.; Ibáñez, L.; Gómez-Roig, M.D. Postnatal anthropometric and body composition profiles in infants with intrauterine growth restriction identified by prenatal doppler. PLoS ONE 2016, 11, e0150152. [Google Scholar] [CrossRef] [Green Version]
- Villela, L.; Méio, M.; Gomes Junior, S.; de Abranches, A.; Soares, F.; Moreira, M. Body composition in preterm infants with intrauterine growth restriction: A cohort study. J. Perinat. Med. 2018, 46, 804–810. [Google Scholar] [CrossRef]
- Schmelzle, H.; Quang, D.; Fusch, G.; Fusch, C. Birth weight categorization according to gestational age does not reflect percentage body fat in term and preterm newborns. Eur. J. Pediatr. 2007, 166, 161–167. [Google Scholar] [CrossRef] [PubMed]
- Larsson, A.; Ottosson, P.; Törnqvist, C.; Olhager, E. Body composition and growth in full-term small for gestational age and large for gestational age Swedish infants assessed with air displacement plethysmography at birth and at 3-4 months of age. PLoS ONE 2019, 14, e0207978. [Google Scholar] [CrossRef] [PubMed] [Green Version]
- Kuriyan, R.; Naqvi, S.; Bhat, K.G.; Ghosh, S.; Rao, S.; Preston, T.; Sachdev, H.S.; Kurpad, A.V. The thin but fat phenotype is uncommon at birth in Indian babies. J. Nutr. 2020, 150, 826–832. [Google Scholar] [CrossRef] [PubMed]
- Roggero, P.; Giannì, M.L.; Liotto, N.; Taroni, F.; Orsi, A.; Amato, O.; Morlacchi, L.; Piemontese, P.; Agosti, M.; Mosca, F. Rapid recovery of fat mass in small for gestational age preterm infants after term. PLoS ONE 2011, 6, e14489. [Google Scholar] [CrossRef] [Green Version]
- Rigo, J.; Nyamugabo, K.; Picaud, J.C.; Gerard, P.; Pieltain, C.; De Curtis, M. Reference values of body composition obtained by dual energy X-ray absorptiometry in preterm and term neonates. J. Pediatr. Gastroenterol. Nutr. 1998, 27, 184–190. [Google Scholar] [CrossRef]
- Hamatschek, C.; Yousuf, E.I.; Möllers, L.S.; So, H.Y.; Morrison, K.M.; Fusch, C.; Rochow, N. Fat and fat-free mass of preterm and term infants from birth to six months: A review of current evidence. Nutrients 2020, 12, 288. [Google Scholar] [CrossRef] [Green Version]
- Ibáñez, L.; Ong, K.; Dunger, D.B.; de Zegher, F. Early development of adiposity and insulin resistance after catch-up weight gain in small-for-gestational-age children. J. Clin. Endocrinol. Metab. 2006, 91, 2153–2158. [Google Scholar] [CrossRef] [Green Version]
- Harder, T.; Roepke, K.; Diller, N.; Stechling, Y.; Dudenhausen, J.W.; Plagemann, A. Birth weight, early weight gain, and subsequent risk of type 1 diabetes: Systematic review and meta-analysis. Am. J. Epidemiol. 2009, 169, 1428–1436. [Google Scholar] [CrossRef] [Green Version]
- Burrows, R.; Correa-Burrows, P.; Reyes, M.; Blanco, E.; Albala, C.; Gahagan, S. Low muscle mass is associated with cardiometabolic risk regardless of nutritional status in adolescents: A cross-sectional study in a Chilean birth cohort. Pediatr. Diabetes 2017, 18, 895–902. [Google Scholar] [CrossRef]
- Kim, J.H.; Park, Y.S. Low muscle mass is associated with metabolic syndrome in Korean adolescents: The Korea National Health and Nutrition Examination Survey 2009-2011. Nutr. Res. 2016, 36, 1423–1428. [Google Scholar] [CrossRef]
- Wells, J.C. The programming effects of early growth. Early Hum. Dev. 2007, 83, 743–748. [Google Scholar] [CrossRef] [PubMed]
- Agrogiannis, G.D.; Sifakis, S.; Patsouris, E.S.; Konstantinidou, A.E. Insulin-like growth factors in embryonic and fetal growth and skeletal development. Mol. Med. Rep. 2014, 10, 579–584. [Google Scholar] [CrossRef] [PubMed] [Green Version]
- Frondas-Chauty, A.; Simon, L.; Flamant, C.; Hanf, M.; Darmaun, D.; Rozé, J.-C. Deficit of Fat Free Mass in Very Preterm Infants at Discharge is Associated with Neurological Impairment at Age 2 Years. J. Pediatr. 2018, 196, 301–304. [Google Scholar] [CrossRef] [PubMed]
- Bell, K.A.; Matthews, L.G.; Cherkerzian, S.; Palmer, C.; Drouin, K.; Pepin, H.L.; Ellard, D.; Inder, T.E.; Ramel, S.E.; Belfort, M.B. Associations of Growth and Body Composition with Brain Size in Preterm Infants. J. Pediatr. 2019, 214, 20–26.e2. [Google Scholar] [CrossRef]
- McLeod, G.; Sherriff, J.; Hartmann, P.E.; Nathan, E.; Geddes, D.; Simmer, K. Comparing different methods of human breast milk fortification using measured v. assumed macronutrient composition to target reference growth: A randomised controlled trial. Br. J. Nutr. 2016, 115, 431–439. [Google Scholar] [CrossRef] [Green Version]
- Sung, I.-K.; Vohr, B.; Oh, W. Growth and neurodevelopmental outcome of very low birth weight infants with intrauterine growth retardation: Comparison with control subjects matched by birth weight and gestational age. J. Pediatr. 1993, 123, 618–624. [Google Scholar] [CrossRef]
- Wells, J.C.K. Toward body composition reference data for infants, children, and adolescents. Adv. Nutr. 2014, 5, 320S–329S. [Google Scholar] [CrossRef] [Green Version]
- Martin, C.R.; Brown, Y.F.; Ehrenkranz, R.A.; O’Shea, T.M.; Allred, E.N.; Belfort, M.B.; McCormick, M.C.; Leviton, A. Nutritional practices and growth velocity in the first month of life in extremely premature infants. Pediatrics 2009, 124, 649–657. [Google Scholar] [CrossRef] [Green Version]
- Kumar, P.; Perino, J.; Bowers, L.; Welch, B.; Albert, V.; Drenckpohl, D.; Wolfe, D. Cumulative impact of multiple evidence based strategies on postnatal growth of extremely-low-birth-weight infants. Clin. Nutr. 2021, 40, 3908–3913. [Google Scholar] [CrossRef]
- Goswami, I.; Rochow, N.; Fusch, G.; Liu, K.; Marrin, M.L.; Heckmann, M.; Nelle, M.; Fusch, C. Length Normalized Indices for Fat Mass and Fat-Free Mass in Preterm and Term Infants during the First Six Months of Life. Nutrients 2016, 8, 417. [Google Scholar] [CrossRef] [Green Version]
- Pereira-da-Silva, L.; Virella, D. Accurate Direct Measures Are Required to Validate Derived Measures. Neonatology 2018, 113, 266. [Google Scholar] [CrossRef] [PubMed]
- VanItallie, T.B.; Yang, M.U.; Heymsfield, S.B.; Funk, R.C.; Boileau, R.A. Height-normalized indices of the body’s fat-free mass and fat mass: Potentially useful indicators of nutritional status. Am. J. Clin. Nutr. 1990, 52, 953–959. [Google Scholar] [CrossRef] [PubMed] [Green Version]
- Wells, J.C.K.; Victora, C.G. Indices of whole-body and central adiposity for evaluating the metabolic load of obesity. Int. J. Obes. 2005, 29, 483–489. [Google Scholar] [CrossRef] [PubMed] [Green Version]
Figure 1.
PRISMA screening flowchart.

Figure 2.
Forest plot showing mean differences between IUGR and normal intrauterine growth infants, in (a) FFM-neonatal period; (b) FFM-from 6 weeks to 6 months of age; (c) FM-neonatal period; (d) FM-from 6 weeks to 6 months of age.
Figure 2.
Forest plot showing mean differences between IUGR and normal intrauterine growth infants, in (a) FFM-neonatal period; (b) FFM-from 6 weeks to 6 months of age; (c) FM-neonatal period; (d) FM-from 6 weeks to 6 months of age.


Figure 3.
Forest plot showing mean difference FM at term age, between SGA and AGA infants.


Table 1.
Description of included studies.
| Study | Method | Country | IUGR | Sample Size | Gestational Age (Weeks) of Index Group | Gestational Age (Weeks) of Control Group | Birth Weight (g) Index Group | Birth Weight (g) Control Group | Age at Follow-Up Assessment | Outcomes |
|---|---|---|---|---|---|---|---|---|---|---|
| Mean (SD) | Mean (SD) | Mean (SD) | Mean (SD) | |||||||
| Koo W, 2004 [23] | DEXA | USA | No | 90 | 36.5 (2.6) | 35.9 (2.9) | 1971 (522) | 2454 (634) | 3 to 5 days after birth | FFM, FM, FM% |
| Demarini S, 2006 [24] | DEXA | Italy | Yes | 40 | 36.09/2.3 | 32.89/3.3 | 1886 (495) | 2 weeks | FFM, FM | |
| Modi N, 2006 [25] | MRI | UK | Yes | 29 | Term | Term | 3.26 (0.43) | 2.27 (0.28) | Day 76 weeks | %FM, weight, length |
| Verkauskiene R, 2007 [26] | DEXA | France | No | 248 | 38.5 (2) | 39 (2) | 2480 (464) | 3227 (449) | Day 3 | FFM, %FM, weight, length, head circumference |
| Ibañez L, 2008 [27] | DEXA | Spain | No | 96 | 39 (0.3) | 40 (0.2) | 2300 (400) | 3400 (400) | 14 days | FFM, FM, %FM |
| Ibañez L, 2010 [28] | DEXA | Spain | No | 74 | Term | Term | 2281 (107) | 3409 (92) | 15 days, 4 months | FFM, FM, %FM |
| Moyer-Mileur H, 2009 [29] | ADP | USA | No | 43 | Term | Term | 2535 (246) | 3319 (67.6) | Neonatal period | %FM, weight, length, head circumference |
| Law TL, 2011 [30] | ADP | USA | Yes | 87 | 37.7 (1.5) | 38.5 (1.5) | 2677 (348) | 3273 (591) | Within 7 days | %FM, Weight, length, head circumference |
| de Zegher F, 2012 [31] | DEXA | Spain | No | 174 | Term | Term | 2900 | 3900 | 2 weeks, 4 months | FFM, FM, weight, length, head circumference |
| Law TL, 2012 [32] | ADP | USA | No | 214 | 30.4 (3.1) | 28.4 (3.2) | 1148 (421) | 1277 (535) | Term age (~10 weeks) | %FM |
| van de Langemaat M, 2014 [13] | DEXA | England | Yes | 98 | 31.1 (1.6) | 30.1 (2.0) | 1465 (371) | 1182 (220) | Term age, 6 months | FFM, FM, %FM, weight, length |
| Giannì M, 2016 [12] | ADP | Italy | No | 122 | 35.4 (0.77) | 35.4 (0.77) | 2111 (102) | 2468 (331) | 5th day of life | FM, %FM, FMI, FFMI, weight, length, head circumference |
| Mazarico R, 2016 [33] | DEXA | Spain | Yes | 48 | 38.2 (0.2) | 37.7 (0.2) | 2279 (290) | 2208 (210) | 10 days, 4 months, 12 months | FM, FFM, weight |
| Villela L, 2018 [34] | ADP | Germany | No | 92 | 31.8 (1.8) | 29.7 (1.5) | 1270 | 1270 | Term age, 1, 3, and 5 months | FFM, FM, %FM, %FFM, LM/FM |
| Schmelzle H, 2007 [35] | DEXA | Germany | No | 21 | 38.2 (2.7) | 38.3 (3.0) | 2320 (660) | 3150 (680) | Within 10 days | %FM, weight, length |
| Larsson A, 2019 [36] | ADP | Sweden | No | 50 | 38.9 (1.6) | 4.1 (1.5) | 2499 (209) | 4617 (366) | Within 10 days, 4 months | FFM, FM, %FM |
| Kuriyan R, 2020 [37] | ADP | India | No | 153 | 39 (1.0) | 39.5 (1.0) | 2700 (100) | 3000 (100) | Within 10 days of birth | FFM, FM, %FM |
| Roggero P, 2011 [38] | ADP | Italy | Yes | 195 | 29.4 (2.2) | 29.3(1.8) | 1204.8 (253) | 1260.8 (198) | Term corrected age, 3 months and 5 months after term | %FM change |
Publisher’s Note: MDPI stays neutral with regard to jurisdictional claims in published maps and institutional affiliations. |
© 2022 by the authors. Licensee MDPI, Basel, Switzerland. This article is an open access article distributed under the terms and conditions of the Creative Commons Attribution (CC BY) license (https://creativecommons.org/licenses/by/4.0/).
Share and Cite
MDPI and ACS Style
Manapurath, R.; Gadapani, B.; Pereira-da-Silva, L. Body Composition of Infants Born with Intrauterine Growth Restriction: A Systematic Review and Meta-Analysis. Nutrients 2022, 14, 1085. https://0-doi-org.brum.beds.ac.uk/10.3390/nu14051085
AMA Style
Manapurath R, Gadapani B, Pereira-da-Silva L. Body Composition of Infants Born with Intrauterine Growth Restriction: A Systematic Review and Meta-Analysis. Nutrients. 2022; 14(5):1085. https://0-doi-org.brum.beds.ac.uk/10.3390/nu14051085
Chicago/Turabian StyleManapurath, Rukman, Barsha Gadapani, and Luís Pereira-da-Silva. 2022. "Body Composition of Infants Born with Intrauterine Growth Restriction: A Systematic Review and Meta-Analysis" Nutrients 14, no. 5: 1085. https://0-doi-org.brum.beds.ac.uk/10.3390/nu14051085
Note that from the first issue of 2016, this journal uses article numbers instead of page numbers. See further details here.