
Dendropanax trifidus Sap-Mediated Suppression of Obese Mouse Body Weight and the Metabolic Changes Related with Estrogen Receptor Alpha and AMPK-ACC Pathways in Muscle Cells

 , and
, and 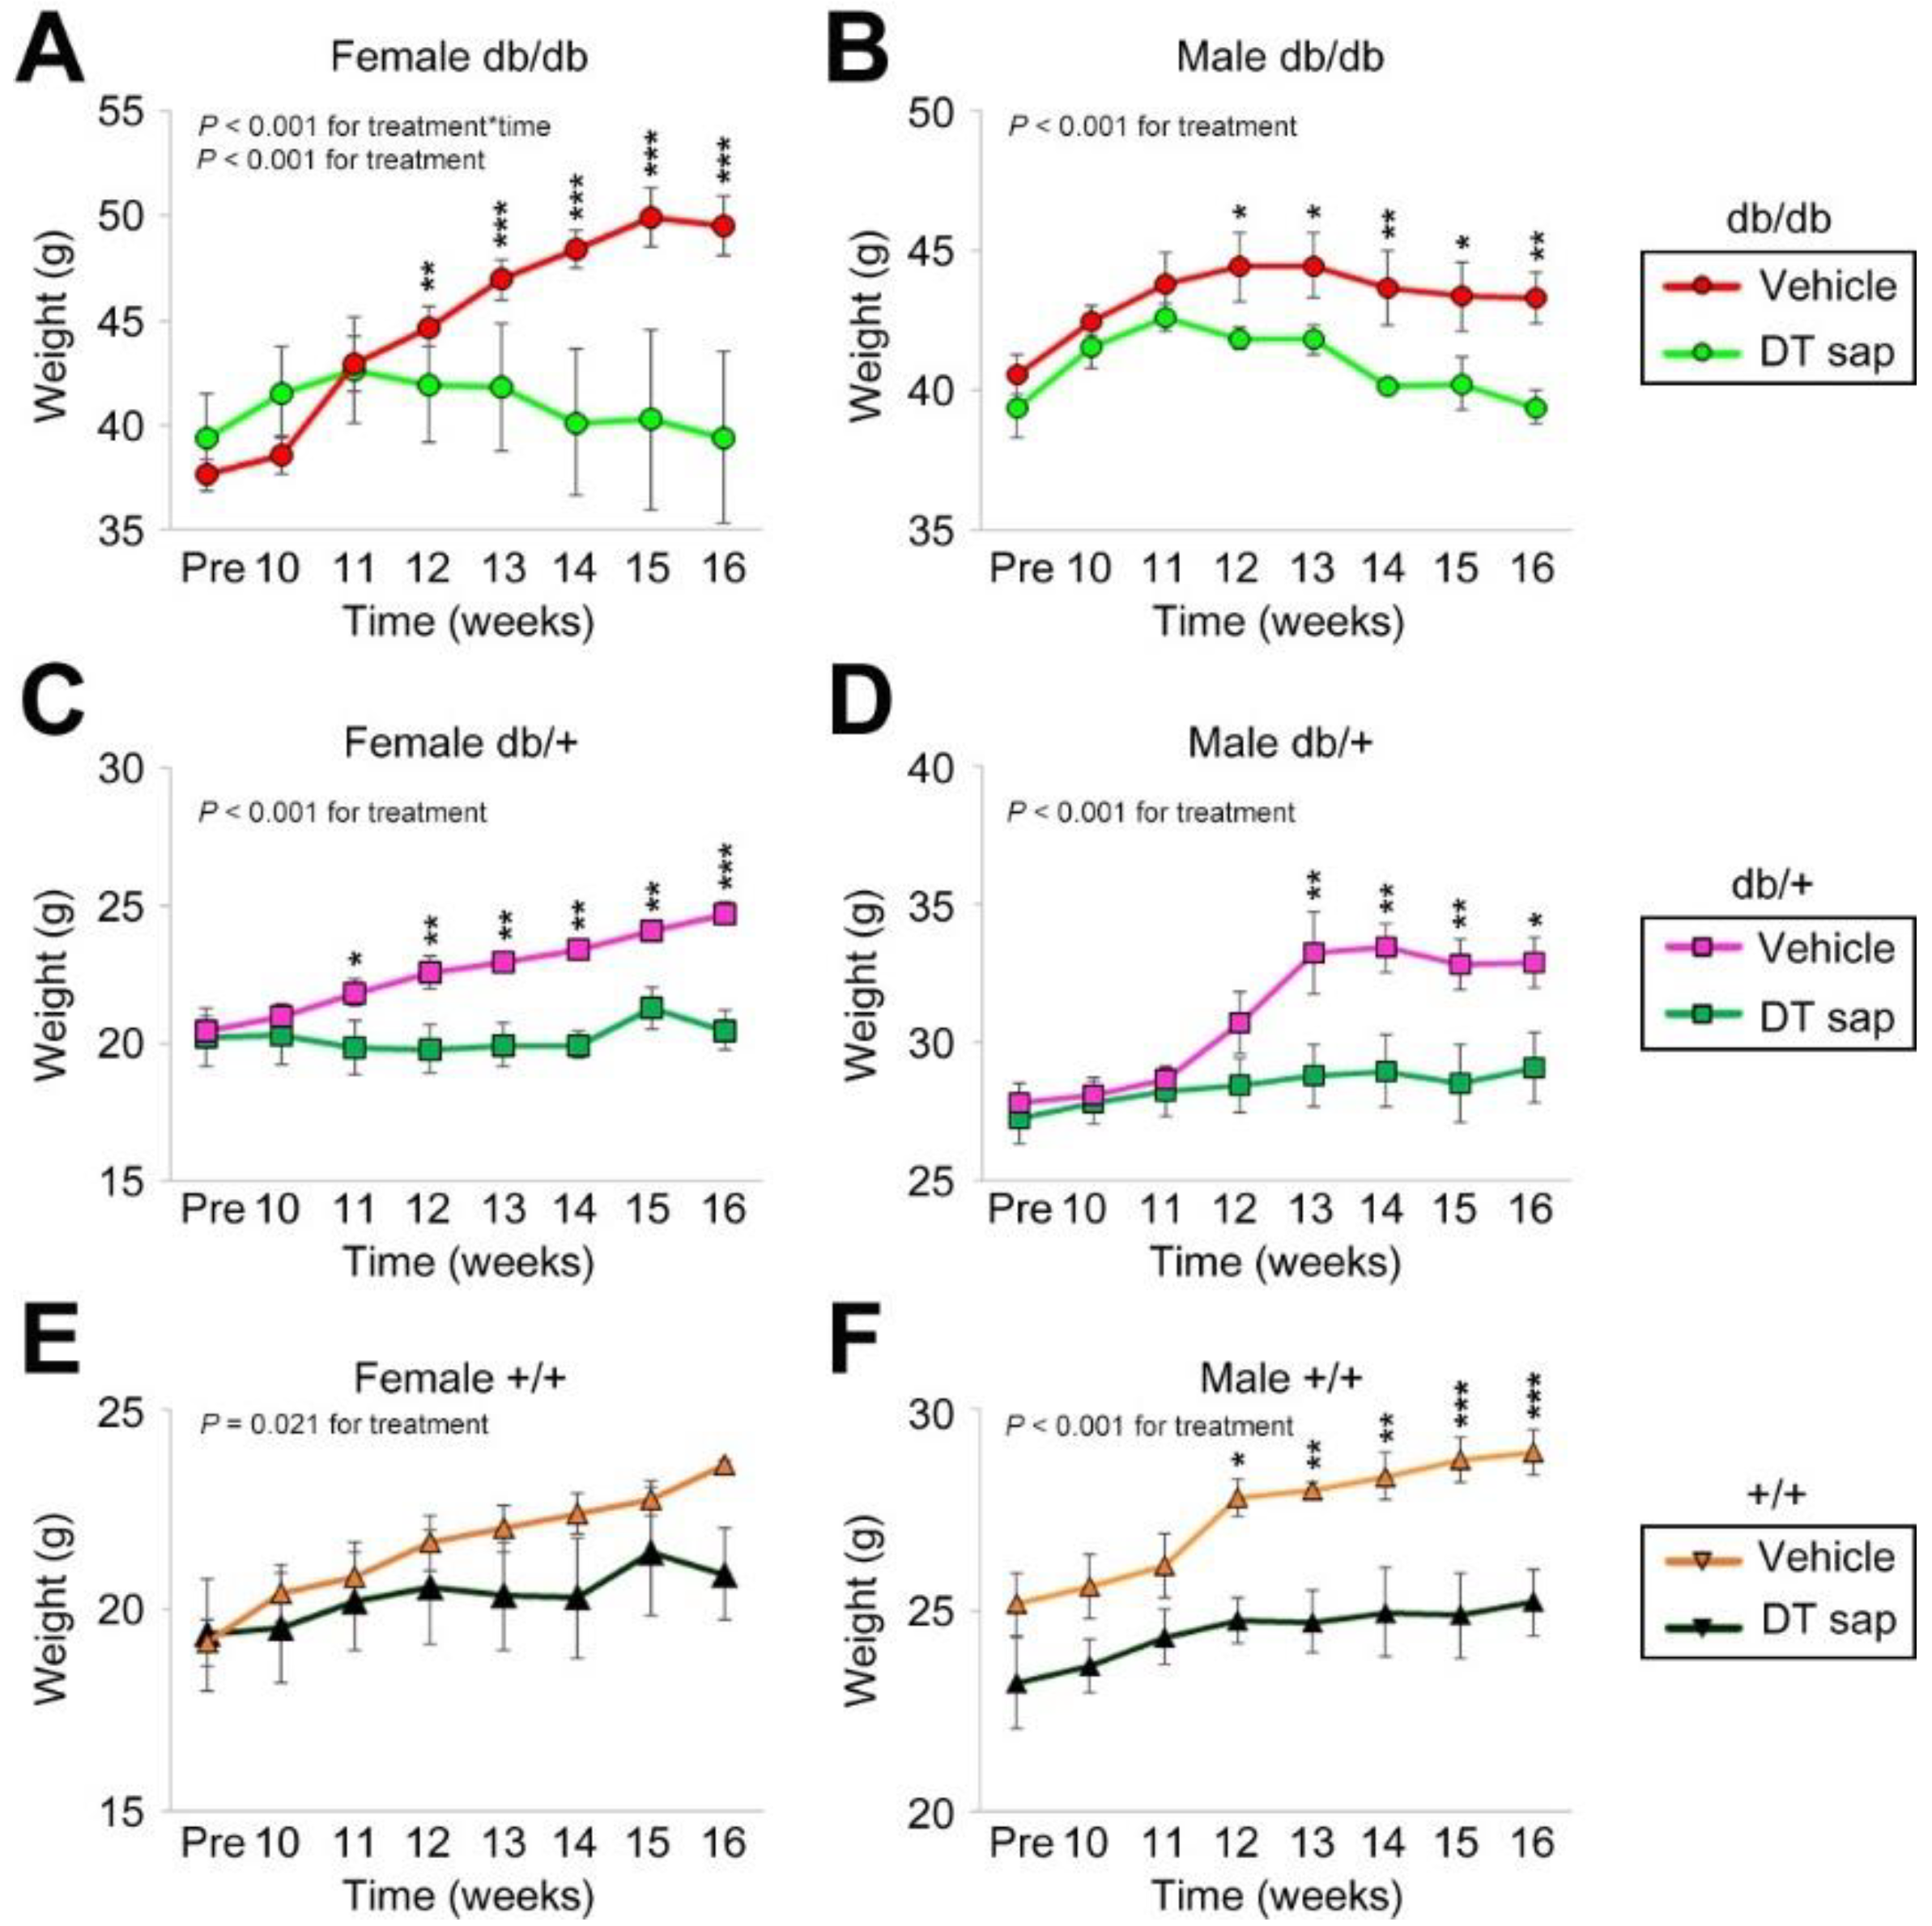
Abstract
:1. Introduction
2. Materials and Methods
2.1. Mice
2.2. Reagents
2.3. Antibodies
2.4. C2C12 Cell Culture
2.5. Western Blot
2.6. Luciferase Assay and Cell Viability Test
2.7. Glycolysis, Mitochondrial Stress Test, and Energy Map
2.8. Statistics
3. Results
3.1. Dendropanax trifidus Sap Suppresses Body Weight Increase in db/db, db/+, +/+ Mice of Both Sexes
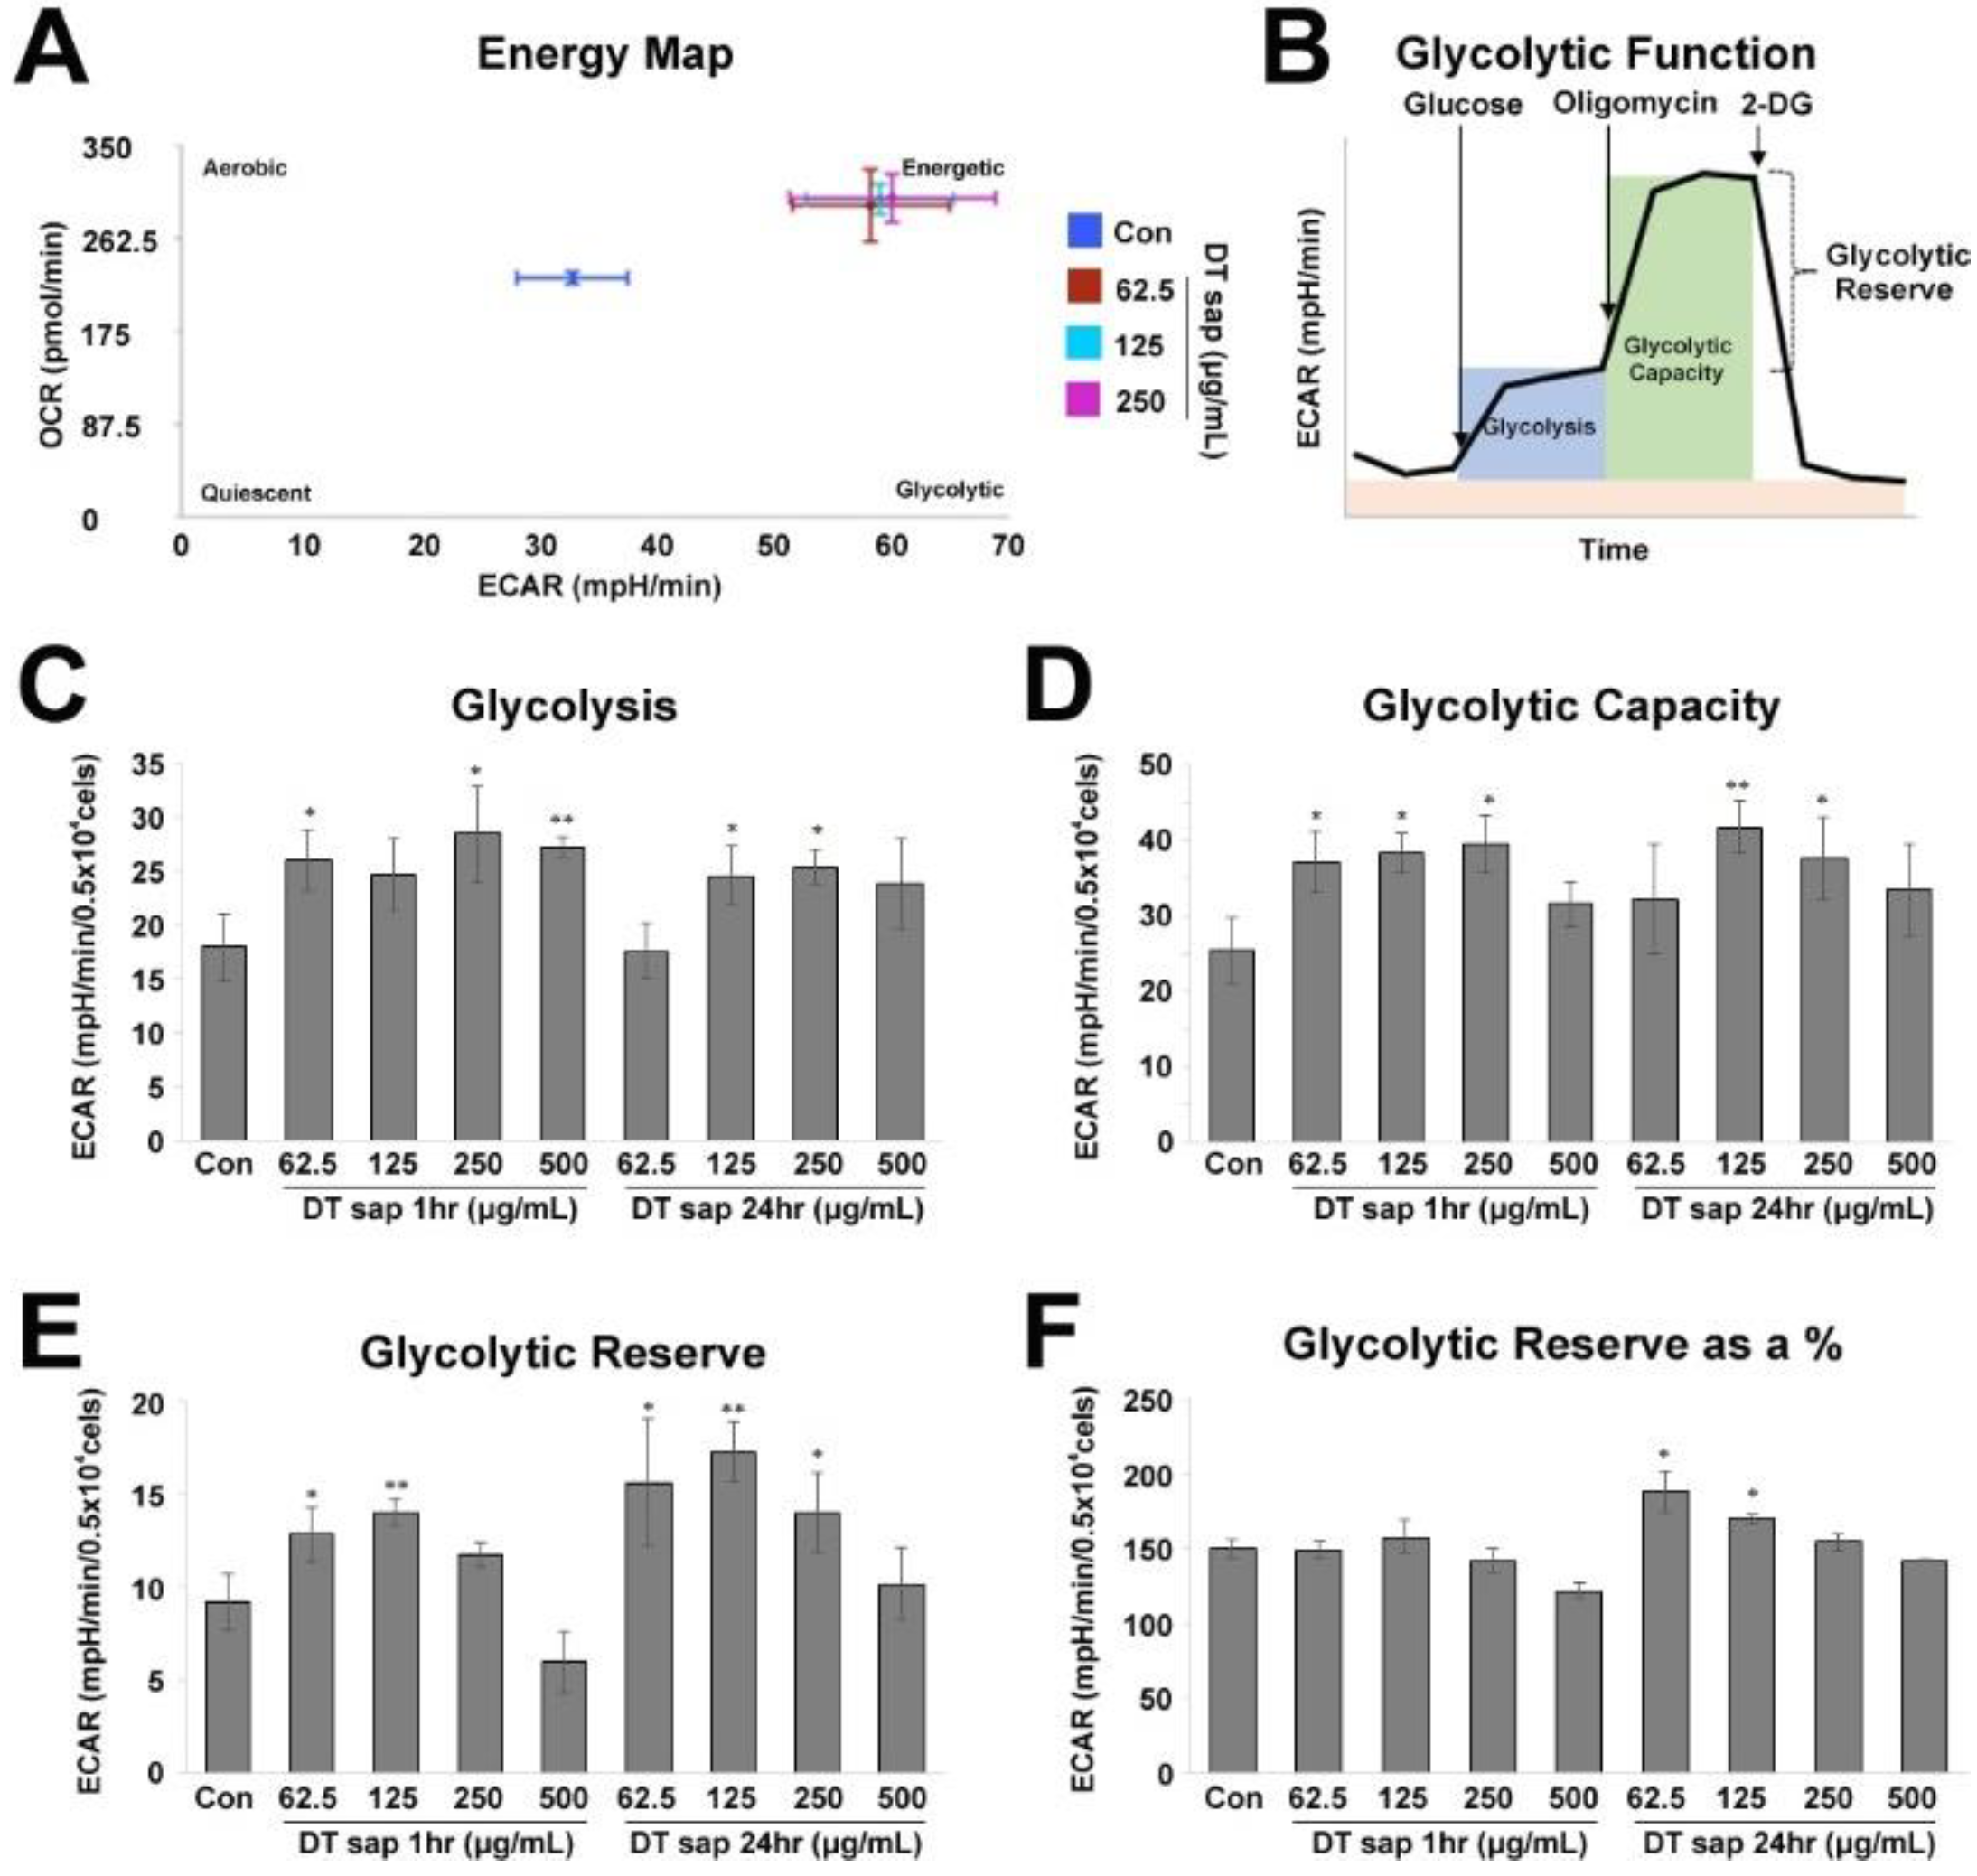
3.2. Glycolysis Stress Test in Skeletal Muscle Cells Treated with Dendropanax trifidus Sap
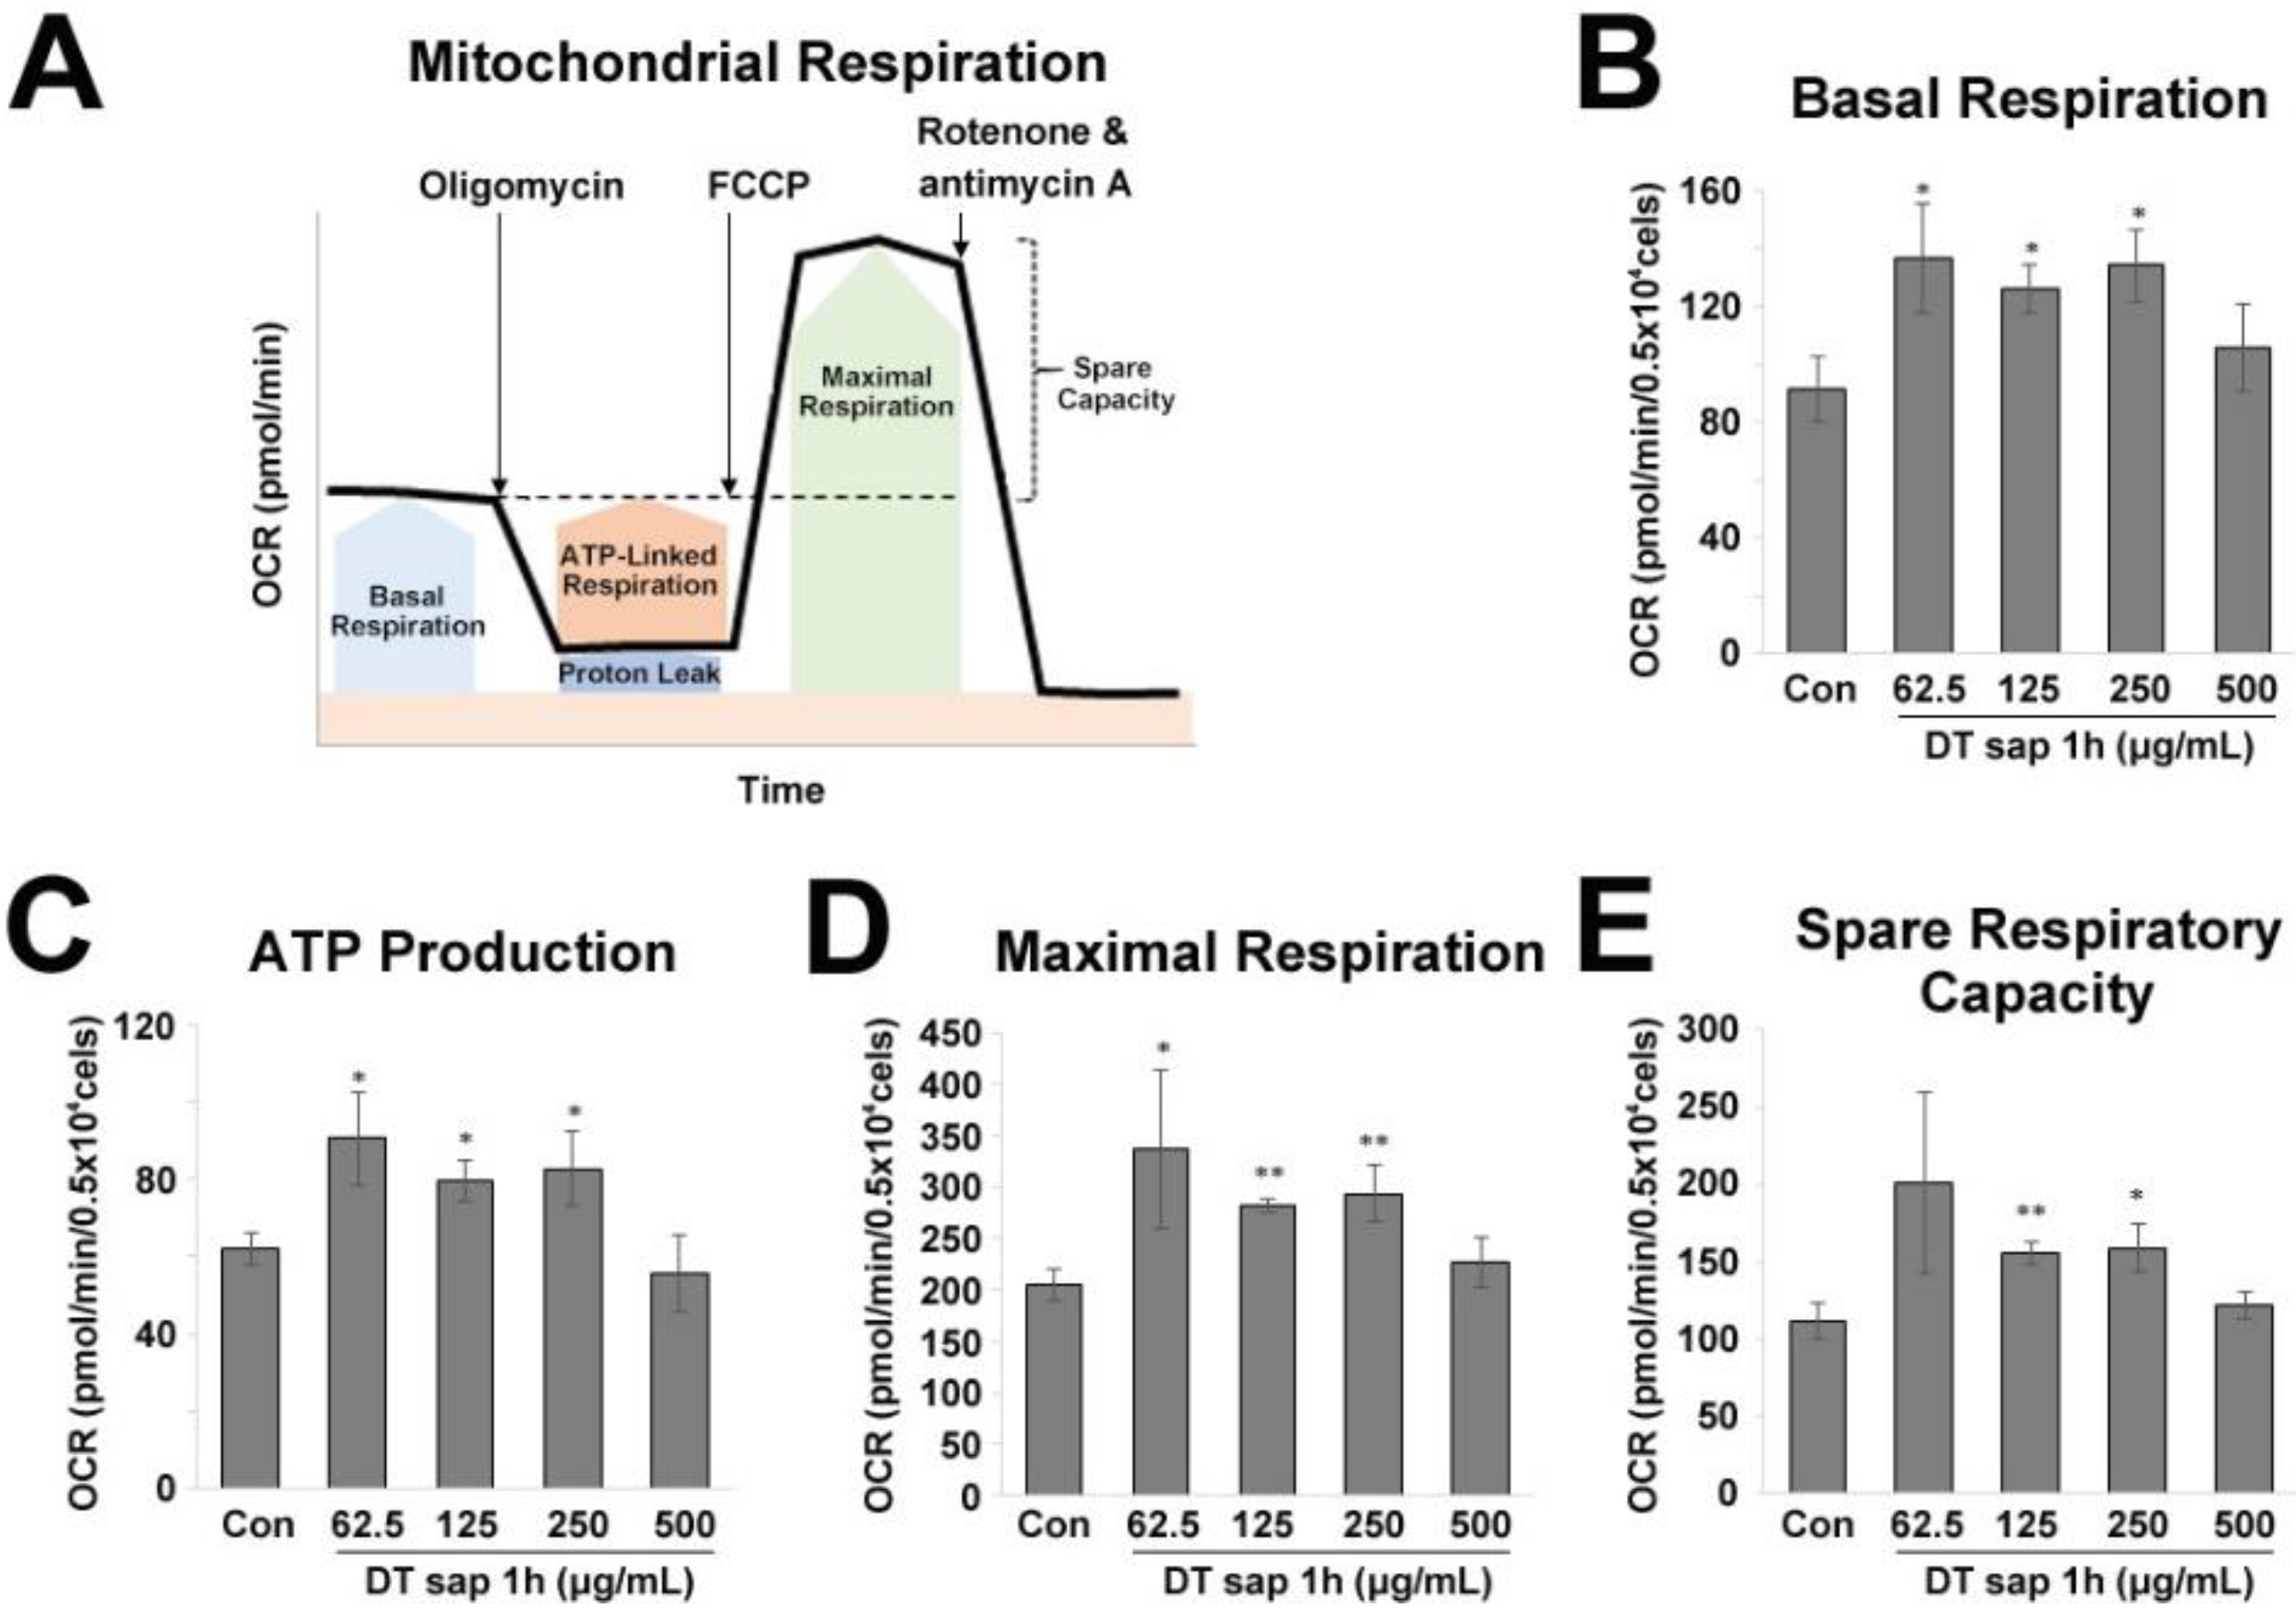
3.3. Mitochondrial Stress Test in C2C12 Muscle Cells Treated with Dendropanax trifidus Sap
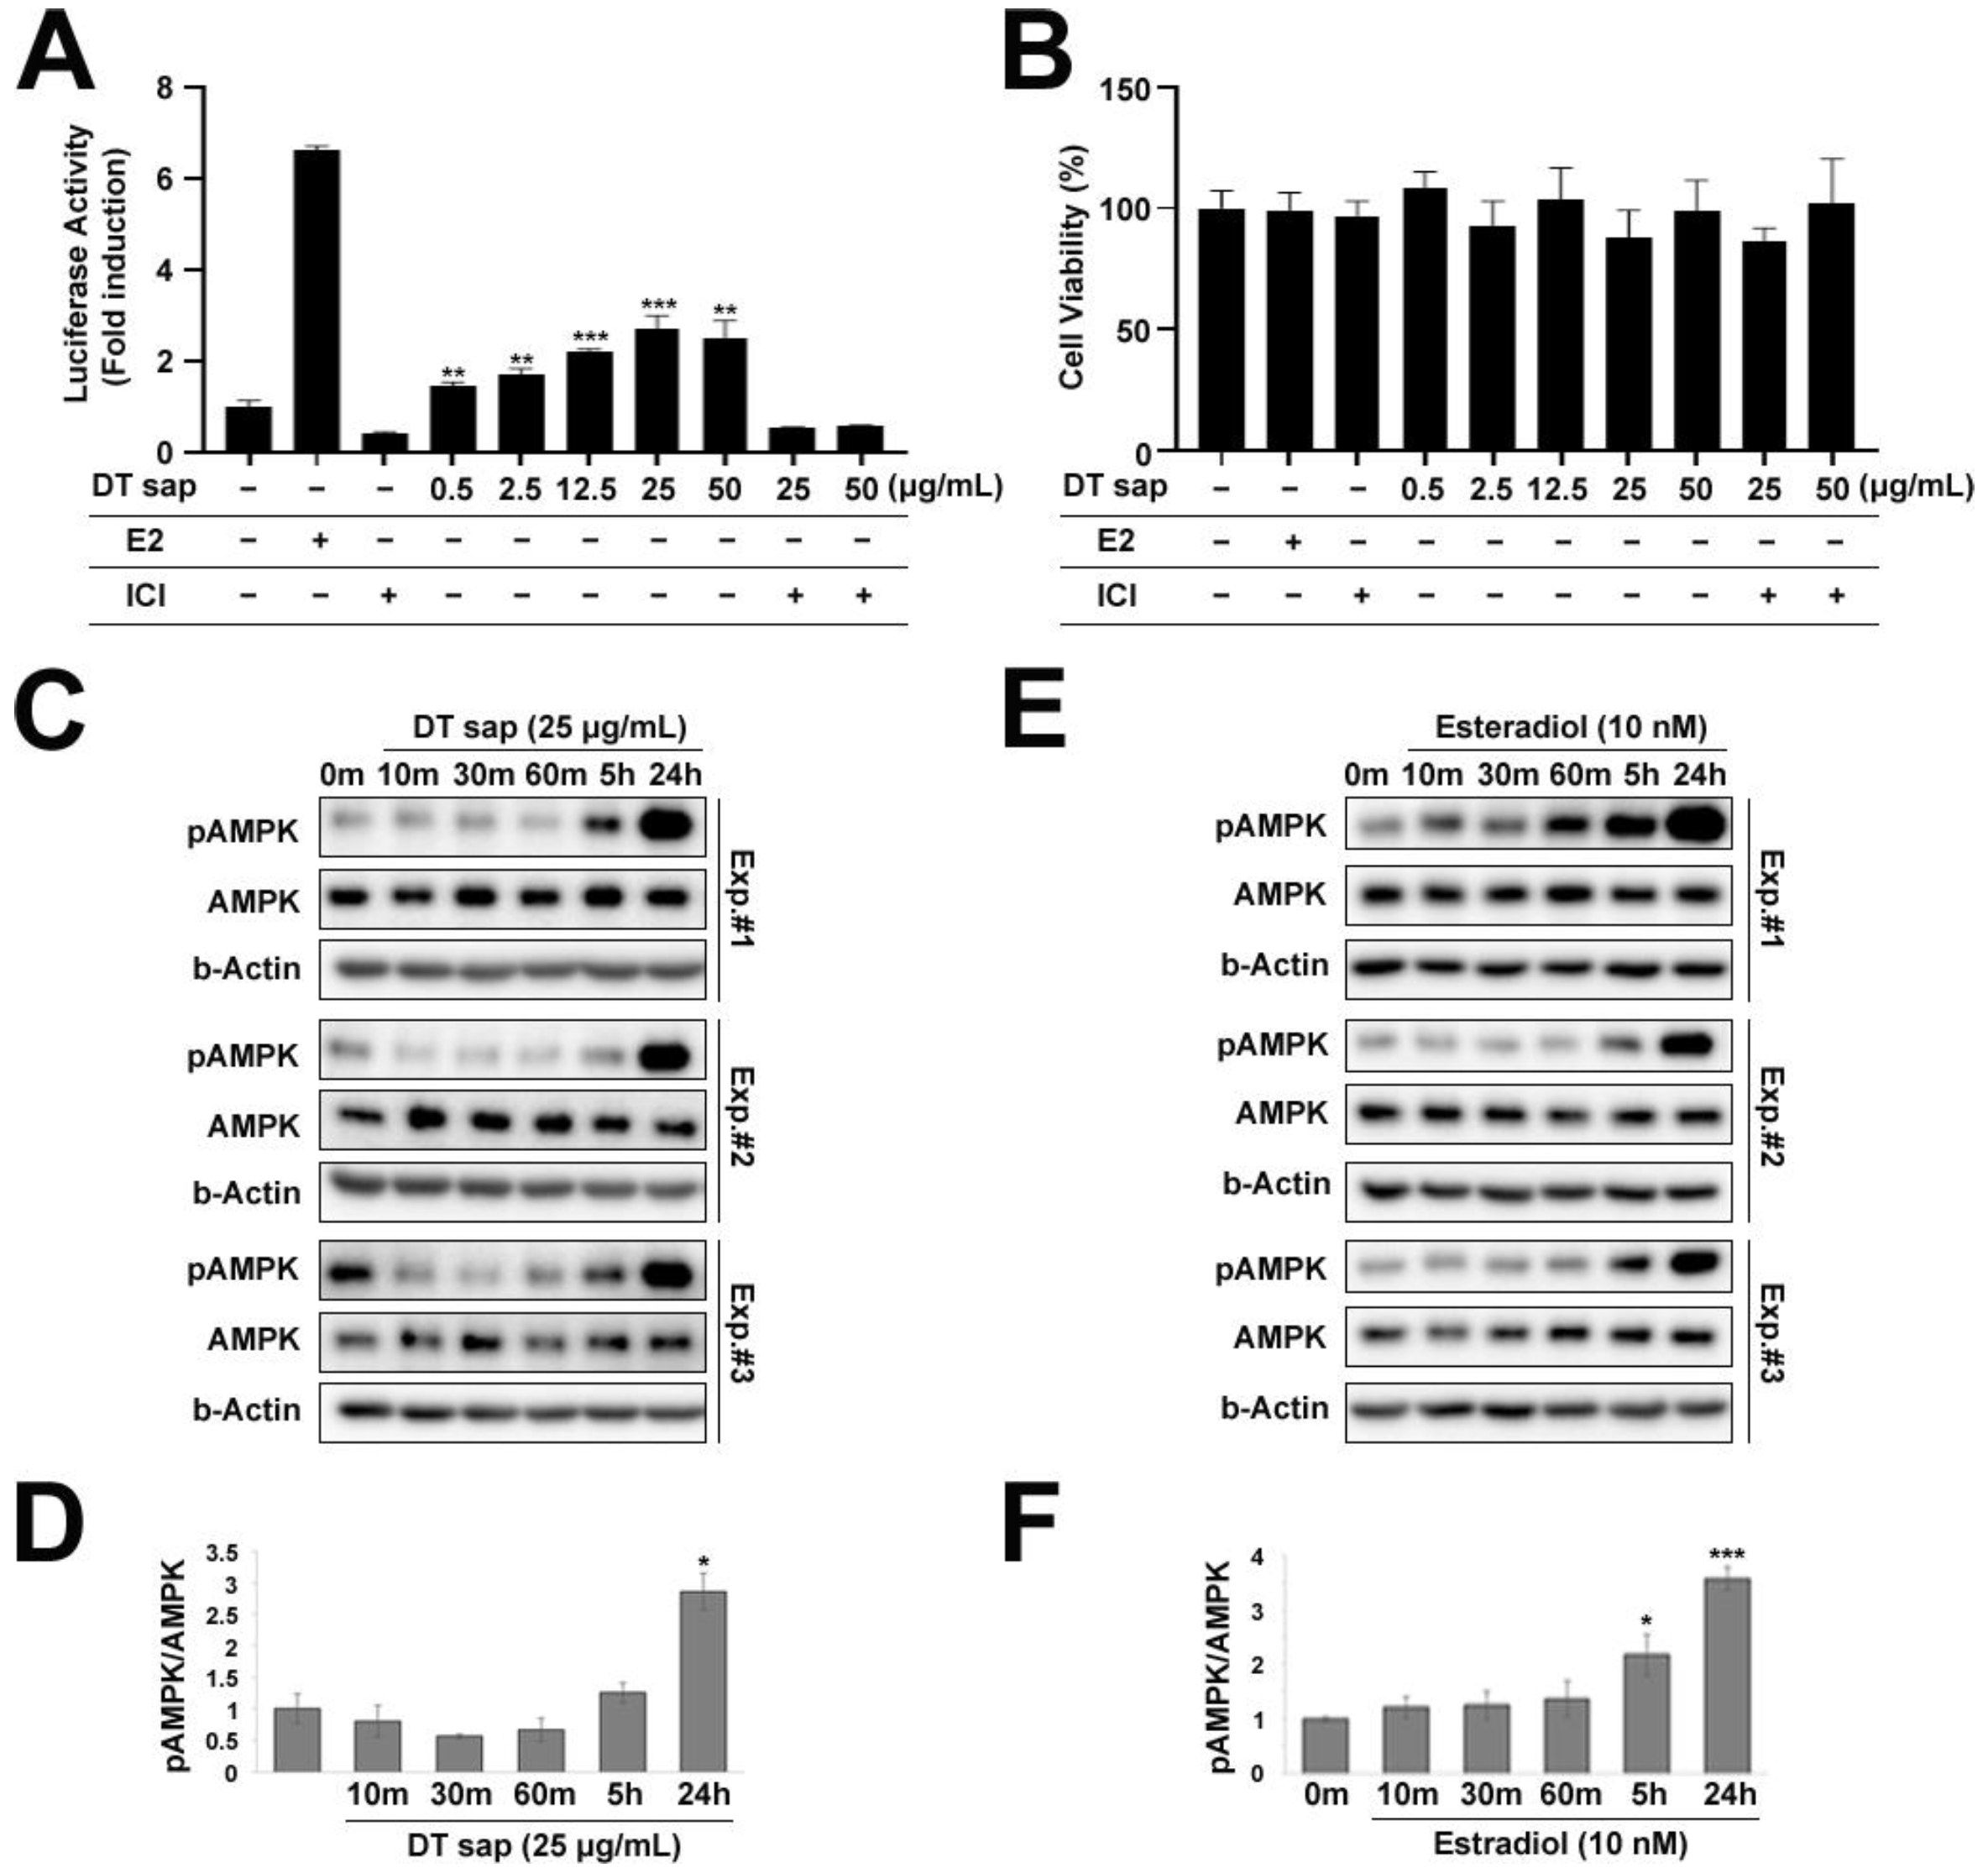
3.4. Estrogen Receptor Activation by Dendropanax trifidus Sap
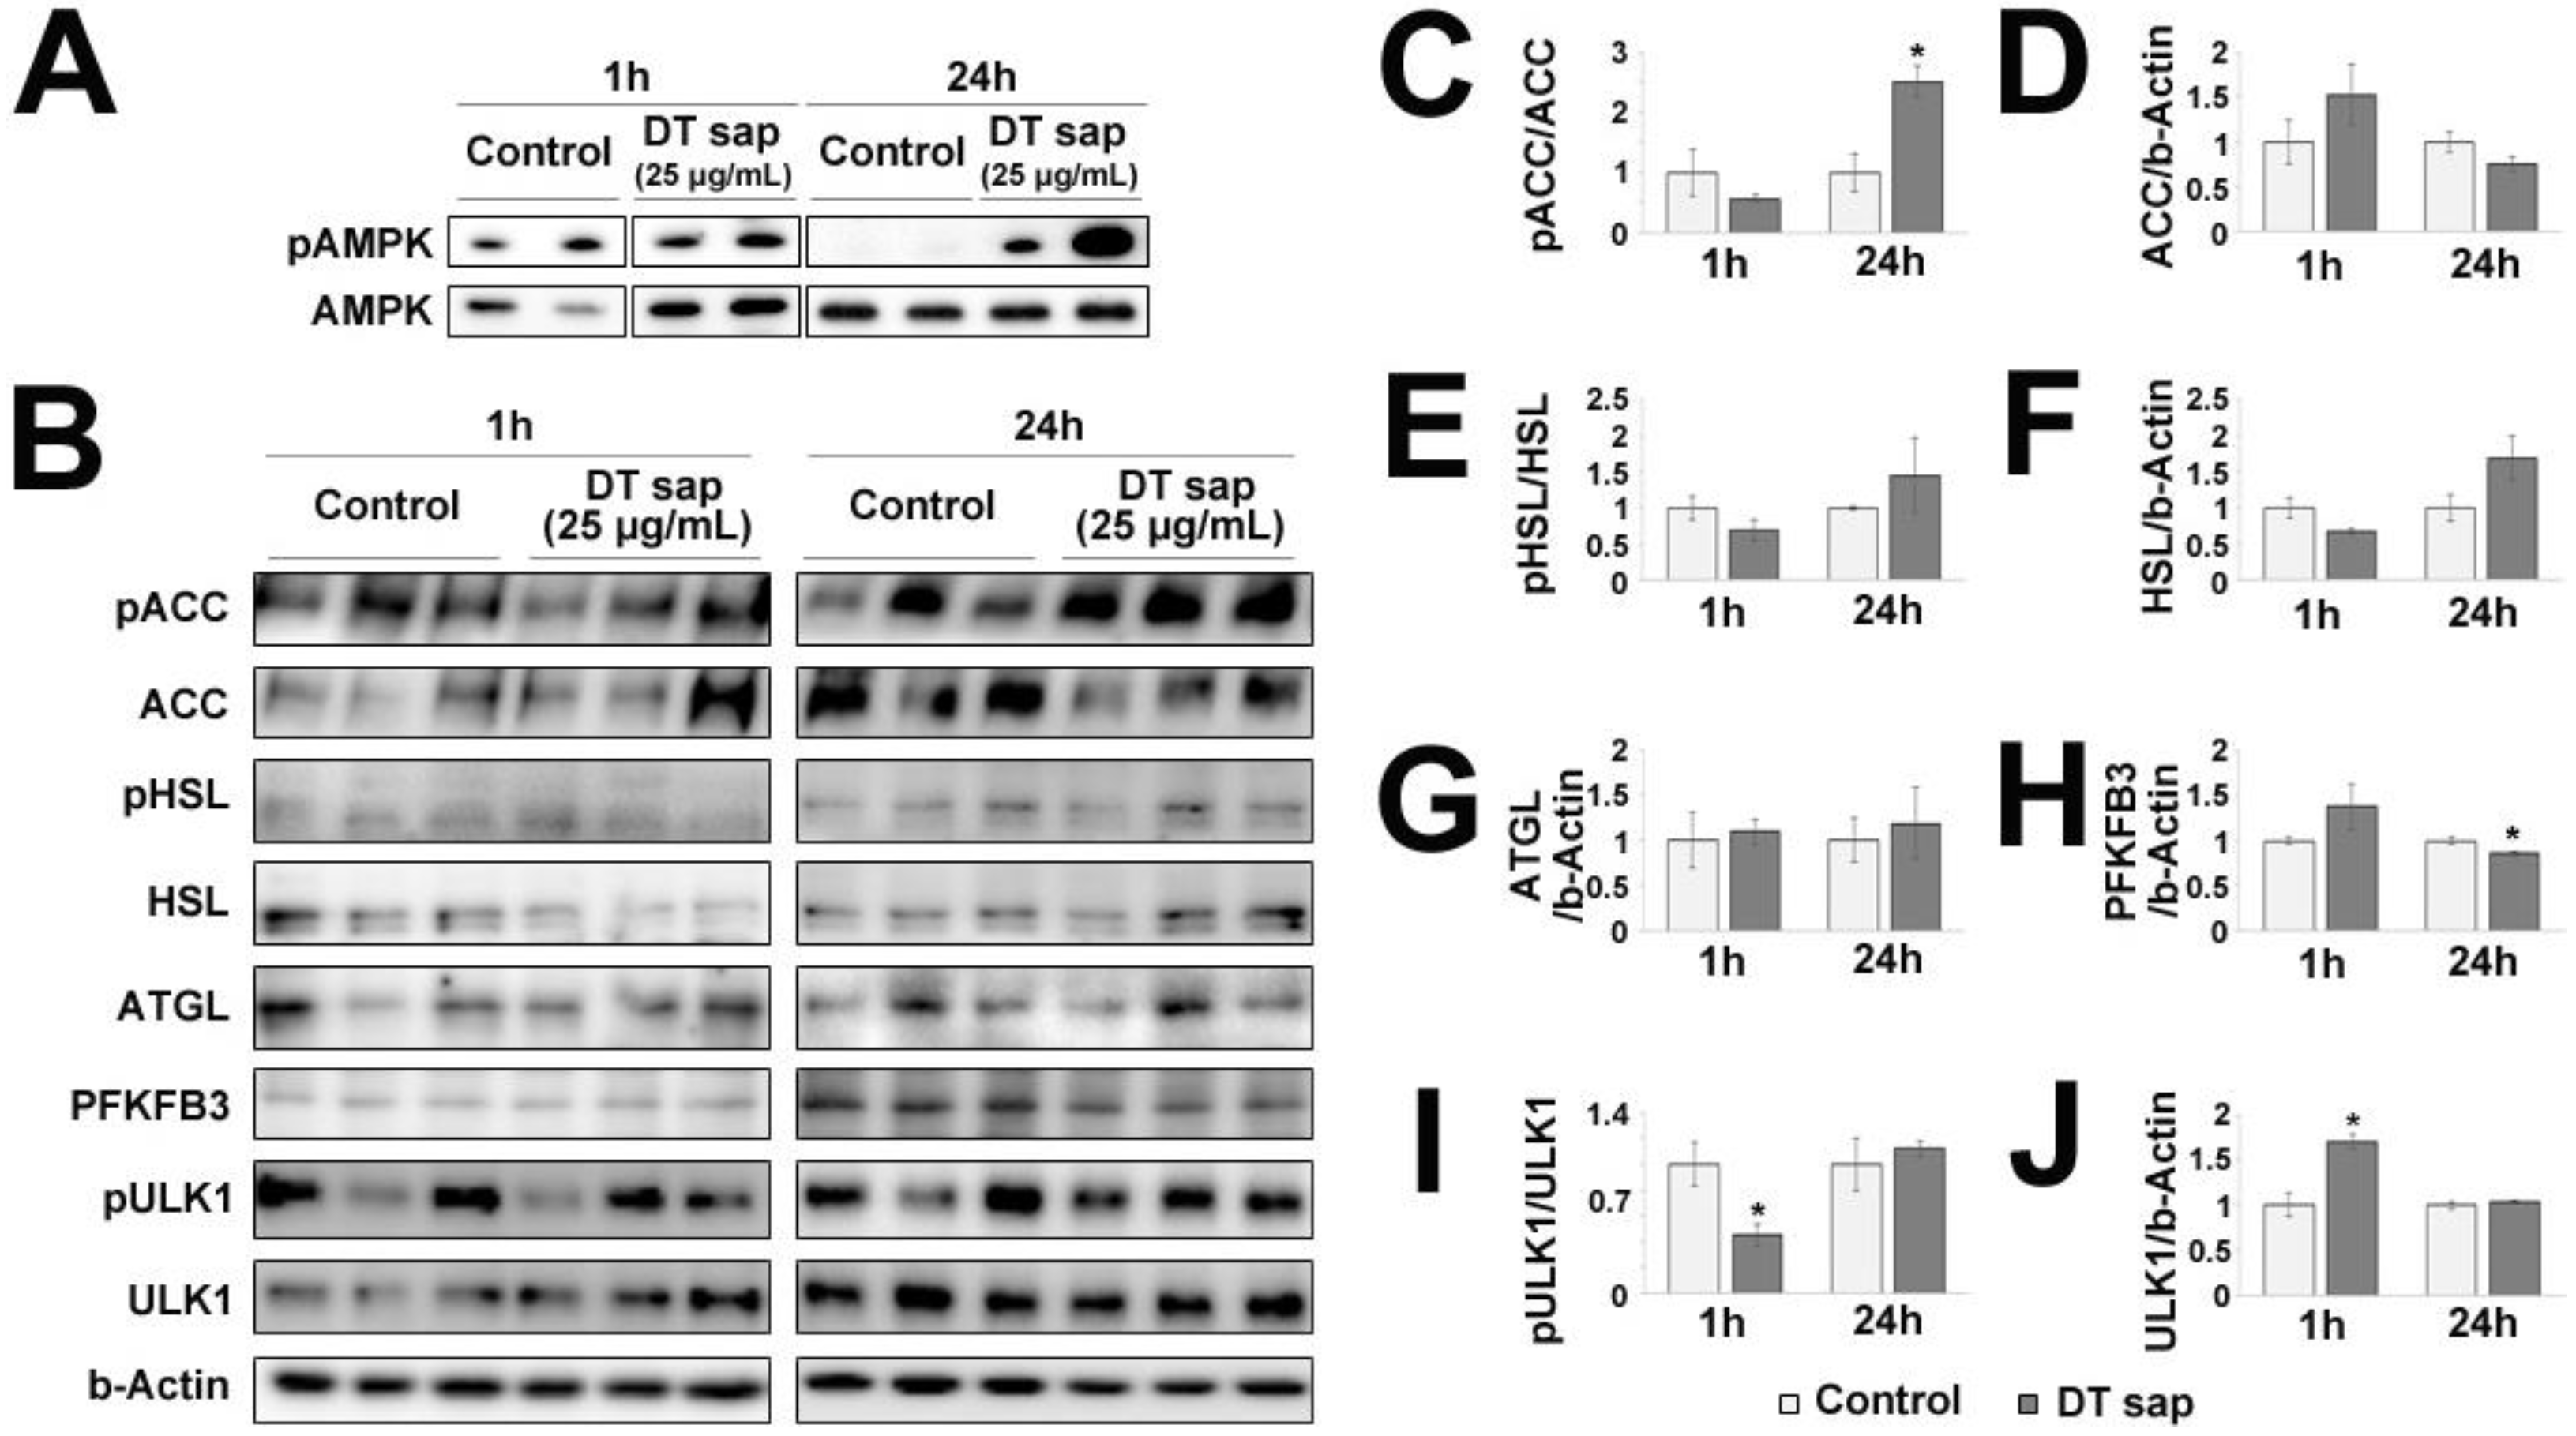
3.5. AMPK/ACC Pathway Was Activated in C2C12 Muscle Cells by Dendropanax trifidus Sap Treatment
4. Discussion
Supplementary Materials
Author Contributions
Funding
Institutional Review Board Statement
Informed Consent Statement
Data Availability Statement
Acknowledgments
Conflicts of Interest
References
- Ravussin, E.; Lillioja, S.; Knowler, W.C.; Christin, L.; Freymond, D.; Abbott, W.G.; Boyce, V.; Howard, B.V.; Bogardus, C. Reduced rate of energy expenditure as a risk factor for body-weight gain. N. Engl. J. Med. 1988, 318, 467–472. [Google Scholar] [CrossRef] [PubMed]
- Roberts, S.B.; Savage, J.; Coward, W.A.; Chew, B.; Lucas, A. Energy expenditure and intake in infants born to lean and overweight mothers. N. Engl. J. Med. 1988, 318, 461–466. [Google Scholar] [CrossRef] [PubMed]
- Gheller, B.J.; Riddle, E.S.; Lem, M.R.; Thalacker-Mercer, A.E. Understanding Age-Related Changes in Skeletal Muscle Metabolism: Differences Between Females and Males. Annu. Rev. Nutr. 2016, 36, 129–156. [Google Scholar] [CrossRef] [PubMed]
- Owen, E.; Reichard, G.A., Jr.; Boden, G.; Patel, M.S.; Trapp, V.E. Interrelationships among key tissues in the utilization of metabolic substrate. Adv. Mod. Nutr. 1978, 2, 517–550. [Google Scholar]
- Wade, L.; Bishop, A.J.M. Cardiac Output and Regional Blood Flow; Blackwell Scientific Publications: Oxford, UK, 1962. [Google Scholar]
- Zurlo, F.; Larson, K.; Bogardus, C.; Ravussin, E. Skeletal muscle metabolism is a major determinant of resting energy expenditure. J. Clin. Investig. 1990, 86, 1423–1427. [Google Scholar] [CrossRef] [Green Version]
- Gowans, G.J.; Hardie, D.G. AMPK: A cellular energy sensor primarily regulated by AMP. Biochem. Soc. Trans. 2014, 42, 71–75. [Google Scholar] [CrossRef] [Green Version]
- Kjobsted, R.; Hingst, J.R.; Fentz, J.; Foretz, M.; Sanz, M.N.; Pehmoller, C.; Shum, M.; Marette, A.; Mounier, R.; Treebak, J.T.; et al. AMPK in skeletal muscle function and metabolism. FASEB J. 2018, 32, 1741–1777. [Google Scholar] [CrossRef] [Green Version]
- Castle, J.C.; Hara, Y.; Raymond, C.K.; Garrett-Engele, P.; Ohwaki, K.; Kan, Z.; Kusunoki, J.; Johnson, J.M. ACC2 is expressed at high levels in human white adipose and has an isoform with a novel N-terminus [corrected]. PLoS ONE 2009, 4, e4369. [Google Scholar] [CrossRef]
- Ha, J.; Daniel, S.; Broyles, S.S.; Kim, K.H. Critical phosphorylation sites for acetyl-CoA carboxylase activity. J. Biol. Chem. 1994, 269, 22162–22168. [Google Scholar] [CrossRef]
- Levert, K.L.; Waldrop, G.L.; Stephens, J.M. A biotin analog inhibits acetyl-CoA carboxylase activity and adipogenesis. J. Biol. Chem. 2002, 277, 16347–16350. [Google Scholar] [CrossRef] [Green Version]
- Abu-Elheiga, L.; Matzuk, M.M.; Abo-Hashema, K.A.; Wakil, S.J. Continuous fatty acid oxidation and reduced fat storage in mice lacking acetyl-CoA carboxylase 2. Science 2001, 291, 2613–2616. [Google Scholar] [CrossRef] [PubMed]
- Bartrons, R.; Rodriguez-Garcia, A.; Simon-Molas, H.; Castano, E.; Manzano, A.; Navarro-Sabate, A. The potential utility of PFKFB3 as a therapeutic target. Expert Opin. Ther. Targets 2018, 22, 659–674. [Google Scholar] [CrossRef] [PubMed]
- Steinberg, G.R.; Carling, D. AMP-activated protein kinase: The current landscape for drug development. Nat. Rev. Drug Discov. 2019, 18, 527–551. [Google Scholar] [CrossRef] [PubMed]
- Rogers, N.H.; Witczak, C.A.; Hirshman, M.F.; Goodyear, L.J.; Greenberg, A.S. Estradiol stimulates Akt, AMP-activated protein kinase (AMPK) and TBC1D1/4, but not glucose uptake in rat soleus. Biochem. Biophys. Res. Commun. 2009, 382, 646–650. [Google Scholar] [CrossRef] [Green Version]
- D’Eon, T.M.; Rogers, N.H.; Stancheva, Z.S.; Greenberg, A.S. Estradiol and the estradiol metabolite, 2-hydroxyestradiol, activate AMP-activated protein kinase in C2C12 myotubes. Obesity 2008, 16, 1284–1288. [Google Scholar] [CrossRef]
- Ikeda, K.; Horie-Inoue, K.; Inoue, S. Functions of estrogen and estrogen receptor signaling on skeletal muscle. J. Steroid Biochem. Mol. Biol. 2019, 191, 105375. [Google Scholar] [CrossRef]
- Han, S.H.; Jung, Y.H.; Oh, M.H.; Ko, M.H.; Oh, Y.S.; Koh, S.C.; Kim, M.H.; Oh, M.Y. Phytogenetic relationships of the Dendropanax morbifera and D. trifidus based on PCR-RAPD. Kor. J. Genet. 1998, 20, 173–181. [Google Scholar]
- Moon, M.O.; SIhm, B.S.; Chung, Y.C.; Kang, Y.J. Taxonomic Appraisal of Dendropanax morbifera Leveille and D. trifidus (Thunb. ex Murray) Makino based on Morphological Characters. Korean J. Plant Taxon. 1999, 29, 231–248. [Google Scholar] [CrossRef]
- Lee, H.S.; Jeon, J.I.; Chang, C.S. Foliar flavonoids of two sections of genus dendropanax in China, Japan, and Korea. For. Sci. Technol. 2005, 1, 45–50. [Google Scholar]
- Song, J.H.; Kang, H.B.; Kim, J.H.; Kwak, S.; Sung, G.J.; Park, S.H.; Jeong, J.H.; Kim, H.; Lee, J.; Jun, W.; et al. Antiobesity and Cholesterol-Lowering Effects of Dendropanax morbifera Water Extracts in Mouse 3T3-L1 Cells. J. Med. Food 2018, 21, 793–800. [Google Scholar] [CrossRef]
- Song, J.H.; Kim, H.; Jeong, M.; Kong, M.J.; Choi, H.K.; Jun, W.; Kim, Y.; Choi, K.C. In Vivo Evaluation of Dendropanax morbifera Leaf Extract for Anti-Obesity and Cholesterol-Lowering Activity in Mice. Nutrients 2021, 13, 1424. [Google Scholar] [CrossRef] [PubMed]
- Kang, M.J.; Kwon, E.B.; Ryu, H.W.; Lee, S.; Lee, J.W.; Kim, D.Y.; Lee, M.K.; Oh, S.R.; Lee, H.S.; Lee, S.U.; et al. Polyacetylene From Dendropanax morbifera Alleviates Diet-Induced Obesity and Hepatic Steatosis by Activating AMPK Signaling Pathway. Front. Pharmacol. 2018, 9, 537. [Google Scholar] [CrossRef] [PubMed] [Green Version]
- Jun, J.E.; Hwang, Y.-C.; Ahn, K.J.; Chung, H.Y.; Choung, S.Y.; Jeong, I.-K. The efficacy and safety of Dendropanax morbifera leaf extract on the metabolic syndrome: A 12-week, placebo controlled, double blind, and randomized controlled trial. Nutr. Res. Pract. 2021, 15, e46. [Google Scholar] [CrossRef]
- Lee, A.; Sugiura, Y.; Cho, I.H.; Setou, N.; Koh, E.; Song, G.J.; Lee, S.; Yang, H.J. In Vivo Hypoglycemic Effects, Potential Mechanisms and LC-MS/MS Analysis of Dendropanax trifidus Sap Extract. Nutrients 2021, 13, 4332. [Google Scholar] [CrossRef]
- Bogardus, C.; Lillioja, S.; Ravussin, E.; Abbott, W.; Zawadzki, J.K.; Young, A.; Knowler, W.C.; Jacobowitz, R.; Moll, P.P. Familial dependence of the resting metabolic rate. N. Engl. J. Med. 1986, 315, 96–100. [Google Scholar] [CrossRef] [PubMed]
- Bouchard, C.; Tremblay, A.; Nadeau, A.; Despres, J.P.; Theriault, G.; Boulay, M.R.; Lortie, G.; Leblanc, C.; Fournier, G. Genetic effect in resting and exercise metabolic rates. Metabolism 1989, 38, 364–370. [Google Scholar] [CrossRef]
- Herzig, S.; Shaw, R.J. AMPK: Guardian of metabolism and mitochondrial homeostasis. Nat. Rev. Mol. Cell Biol. 2018, 19, 121–135. [Google Scholar] [CrossRef] [Green Version]
- Hawley, S.A.; Davison, M.; Woods, A.; Davies, S.P.; Beri, R.K.; Carling, D.; Hardie, D.G. Characterization of the AMP-activated protein kinase kinase from rat liver and identification of threonine 172 as the major site at which it phosphorylates AMP-activated protein kinase. J. Biol. Chem. 1996, 271, 27879–27887. [Google Scholar] [CrossRef] [Green Version]
- Lizcano, J.M.; Goransson, O.; Toth, R.; Deak, M.; Morrice, N.A.; Boudeau, J.; Hawley, S.A.; Udd, L.; Makela, T.P.; Hardie, D.G.; et al. LKB1 is a master kinase that activates 13 kinases of the AMPK subfamily, including MARK/PAR-1. EMBO J. 2004, 23, 833–843. [Google Scholar] [CrossRef] [Green Version]
- Shaw, R.J.; Kosmatka, M.; Bardeesy, N.; Hurley, R.L.; Witters, L.A.; DePinho, R.A.; Cantley, L.C. The tumor suppressor LKB1 kinase directly activates AMP-activated kinase and regulates apoptosis in response to energy stress. Proc. Natl. Acad. Sci. USA 2004, 101, 3329–3335. [Google Scholar] [CrossRef] [Green Version]
- O’Neill, H.M.; Holloway, G.P.; Steinberg, G.R. AMPK regulation of fatty acid metabolism and mitochondrial biogenesis: Implications for obesity. Mol. Cell. Endocrinol. 2013, 366, 135–151. [Google Scholar] [CrossRef]
- Marcinko, K.; Bujak, A.L.; Lally, J.S.; Ford, R.J.; Wong, T.H.; Smith, B.K.; Kemp, B.E.; Jenkins, Y.; Li, W.; Kinsella, T.M.; et al. The AMPK activator R419 improves exercise capacity and skeletal muscle insulin sensitivity in obese mice. Mol. Metab. 2015, 4, 643–651. [Google Scholar] [CrossRef] [PubMed]
- Wojtaszewski, J.F.; Nielsen, P.; Hansen, B.F.; Richter, E.A.; Kiens, B. Isoform-specific and exercise intensity-dependent activation of 5′-AMP-activated protein kinase in human skeletal muscle. J. Physiol. 2000, 528 Pt 1, 221–226. [Google Scholar] [CrossRef]
- Egan, B.; Carson, B.P.; Garcia-Roves, P.M.; Chibalin, A.V.; Sarsfield, F.M.; Barron, N.; McCaffrey, N.; Moyna, N.M.; Zierath, J.R.; O’Gorman, D.J. Exercise intensity-dependent regulation of peroxisome proliferator-activated receptor coactivator-1 mRNA abundance is associated with differential activation of upstream signalling kinases in human skeletal muscle. J. Physiol. 2010, 588, 1779–1790. [Google Scholar] [CrossRef] [PubMed]
- Kreuz, S.; Schoelch, C.; Thomas, L.; Rist, W.; Rippmann, J.F.; Neubauer, H. Acetyl-CoA carboxylases 1 and 2 show distinct expression patterns in rats and humans and alterations in obesity and diabetes. Diabetes Metab. Res. Rev. 2009, 25, 577–586. [Google Scholar] [CrossRef]
- Xiang, C.; Zhang, Y.; Chen, Q.; Sun, A.; Peng, Y.; Zhang, G.; Zhou, D.; Xie, Y.; Hou, X.; Zheng, F.; et al. Increased glycolysis in skeletal muscle coordinates with adipose tissue in systemic metabolic homeostasis. J. Cell. Mol. Med. 2021, 25, 7840–7854. [Google Scholar] [CrossRef] [PubMed]
- Riera, L.; Obach, M.; Navarro-Sabate, A.; Duran, J.; Perales, J.C.; Vinals, F.; Rosa, J.L.; Ventura, F.; Bartrons, R. Regulation of ubiquitous 6-phosphofructo-2-kinase by the ubiquitin-proteasome proteolytic pathway during myogenic C2C12 cell differentiation. FEBS Lett. 2003, 550, 23–29. [Google Scholar] [CrossRef] [Green Version]
- McGraw, T.E.; Mittal, V. Metabolism regulates differentiation. Nat. Chem. Biol. 2010, 6, 176–177. [Google Scholar] [CrossRef]
- Kim, J.; Kundu, M.; Viollet, B.; Guan, K.L. AMPK and mTOR regulate autophagy through direct phosphorylation of Ulk1. Nat. Cell. Biol. 2011, 13, 132–141. [Google Scholar] [CrossRef] [Green Version]
- Kwon, K.Y.; Viollet, B.; Yoo, O.J. CCCP induces autophagy in an AMPK-independent manner. Biochem. Biophys. Res. Commun. 2011, 416, 343–348. [Google Scholar] [CrossRef]
- Hevener, A.L.; Zhou, Z.; Moore, T.M.; Drew, B.G.; Ribas, V. The impact of ERalpha action on muscle metabolism and insulin sensitivity—Strong enough for a man, made for a woman. Mol. Metab. 2018, 15, 20–34. [Google Scholar] [CrossRef] [PubMed]
- Heine, P.A.; Taylor, J.A.; Iwamoto, G.A.; Lubahn, D.B.; Cooke, P.S. Increased adipose tissue in male and female estrogen receptor-alpha knockout mice. Proc. Natl. Acad. Sci. USA 2000, 97, 12729–12734. [Google Scholar] [CrossRef] [PubMed] [Green Version]
- Ribas, V.; Nguyen, M.T.; Henstridge, D.C.; Nguyen, A.K.; Beaven, S.W.; Watt, M.J.; Hevener, A.L. Impaired oxidative metabolism and inflammation are associated with insulin resistance in ERalpha-deficient mice. Am. J. Physiol. Endocrinol. Metab. 2010, 298, E304–E319. [Google Scholar] [CrossRef] [PubMed] [Green Version]
- Bryzgalova, G.; Gao, H.; Ahren, B.; Zierath, J.R.; Galuska, D.; Steiler, T.L.; Dahlman-Wright, K.; Nilsson, S.; Gustafsson, J.A.; Efendic, S.; et al. Evidence that oestrogen receptor-alpha plays an important role in the regulation of glucose homeostasis in mice: Insulin sensitivity in the liver. Diabetologia 2006, 49, 588–597. [Google Scholar] [CrossRef] [Green Version]
- Ribas, V.; Drew, B.G.; Zhou, Z.; Phun, J.; Kalajian, N.Y.; Soleymani, T.; Daraei, P.; Widjaja, K.; Wanagat, J.; de Aguiar Vallim, T.Q.; et al. Skeletal muscle action of estrogen receptor alpha is critical for the maintenance of mitochondrial function and metabolic homeostasis in females. Sci. Transl. Med. 2016, 8, 334ra354. [Google Scholar] [CrossRef] [Green Version]


Publisher’s Note: MDPI stays neutral with regard to jurisdictional claims in published maps and institutional affiliations. |
© 2022 by the authors. Licensee MDPI, Basel, Switzerland. This article is an open access article distributed under the terms and conditions of the Creative Commons Attribution (CC BY) license (https://creativecommons.org/licenses/by/4.0/).
Share and Cite
Lee, A.; Koh, E.; Kim, D.; Lee, N.; Cho, S.M.; Lee, Y.J.; Cho, I.-H.; Yang, H.-J. Dendropanax trifidus Sap-Mediated Suppression of Obese Mouse Body Weight and the Metabolic Changes Related with Estrogen Receptor Alpha and AMPK-ACC Pathways in Muscle Cells. Nutrients 2022, 14, 1098. https://0-doi-org.brum.beds.ac.uk/10.3390/nu14051098
Lee A, Koh E, Kim D, Lee N, Cho SM, Lee YJ, Cho I-H, Yang H-J. Dendropanax trifidus Sap-Mediated Suppression of Obese Mouse Body Weight and the Metabolic Changes Related with Estrogen Receptor Alpha and AMPK-ACC Pathways in Muscle Cells. Nutrients. 2022; 14(5):1098. https://0-doi-org.brum.beds.ac.uk/10.3390/nu14051098
Chicago/Turabian StyleLee, Ahreum, Eugene Koh, Dalnim Kim, Namkyu Lee, Soo Min Cho, Young Joo Lee, Ik-Hyun Cho, and Hyun-Jeong Yang. 2022. "Dendropanax trifidus Sap-Mediated Suppression of Obese Mouse Body Weight and the Metabolic Changes Related with Estrogen Receptor Alpha and AMPK-ACC Pathways in Muscle Cells" Nutrients 14, no. 5: 1098. https://0-doi-org.brum.beds.ac.uk/10.3390/nu14051098