
Dietary Sodium and Potassium Intake and Risk of Non-Fatal Cardiovascular Diseases: The Million Veteran Program

Abstract
:1. Introduction
2. Methods
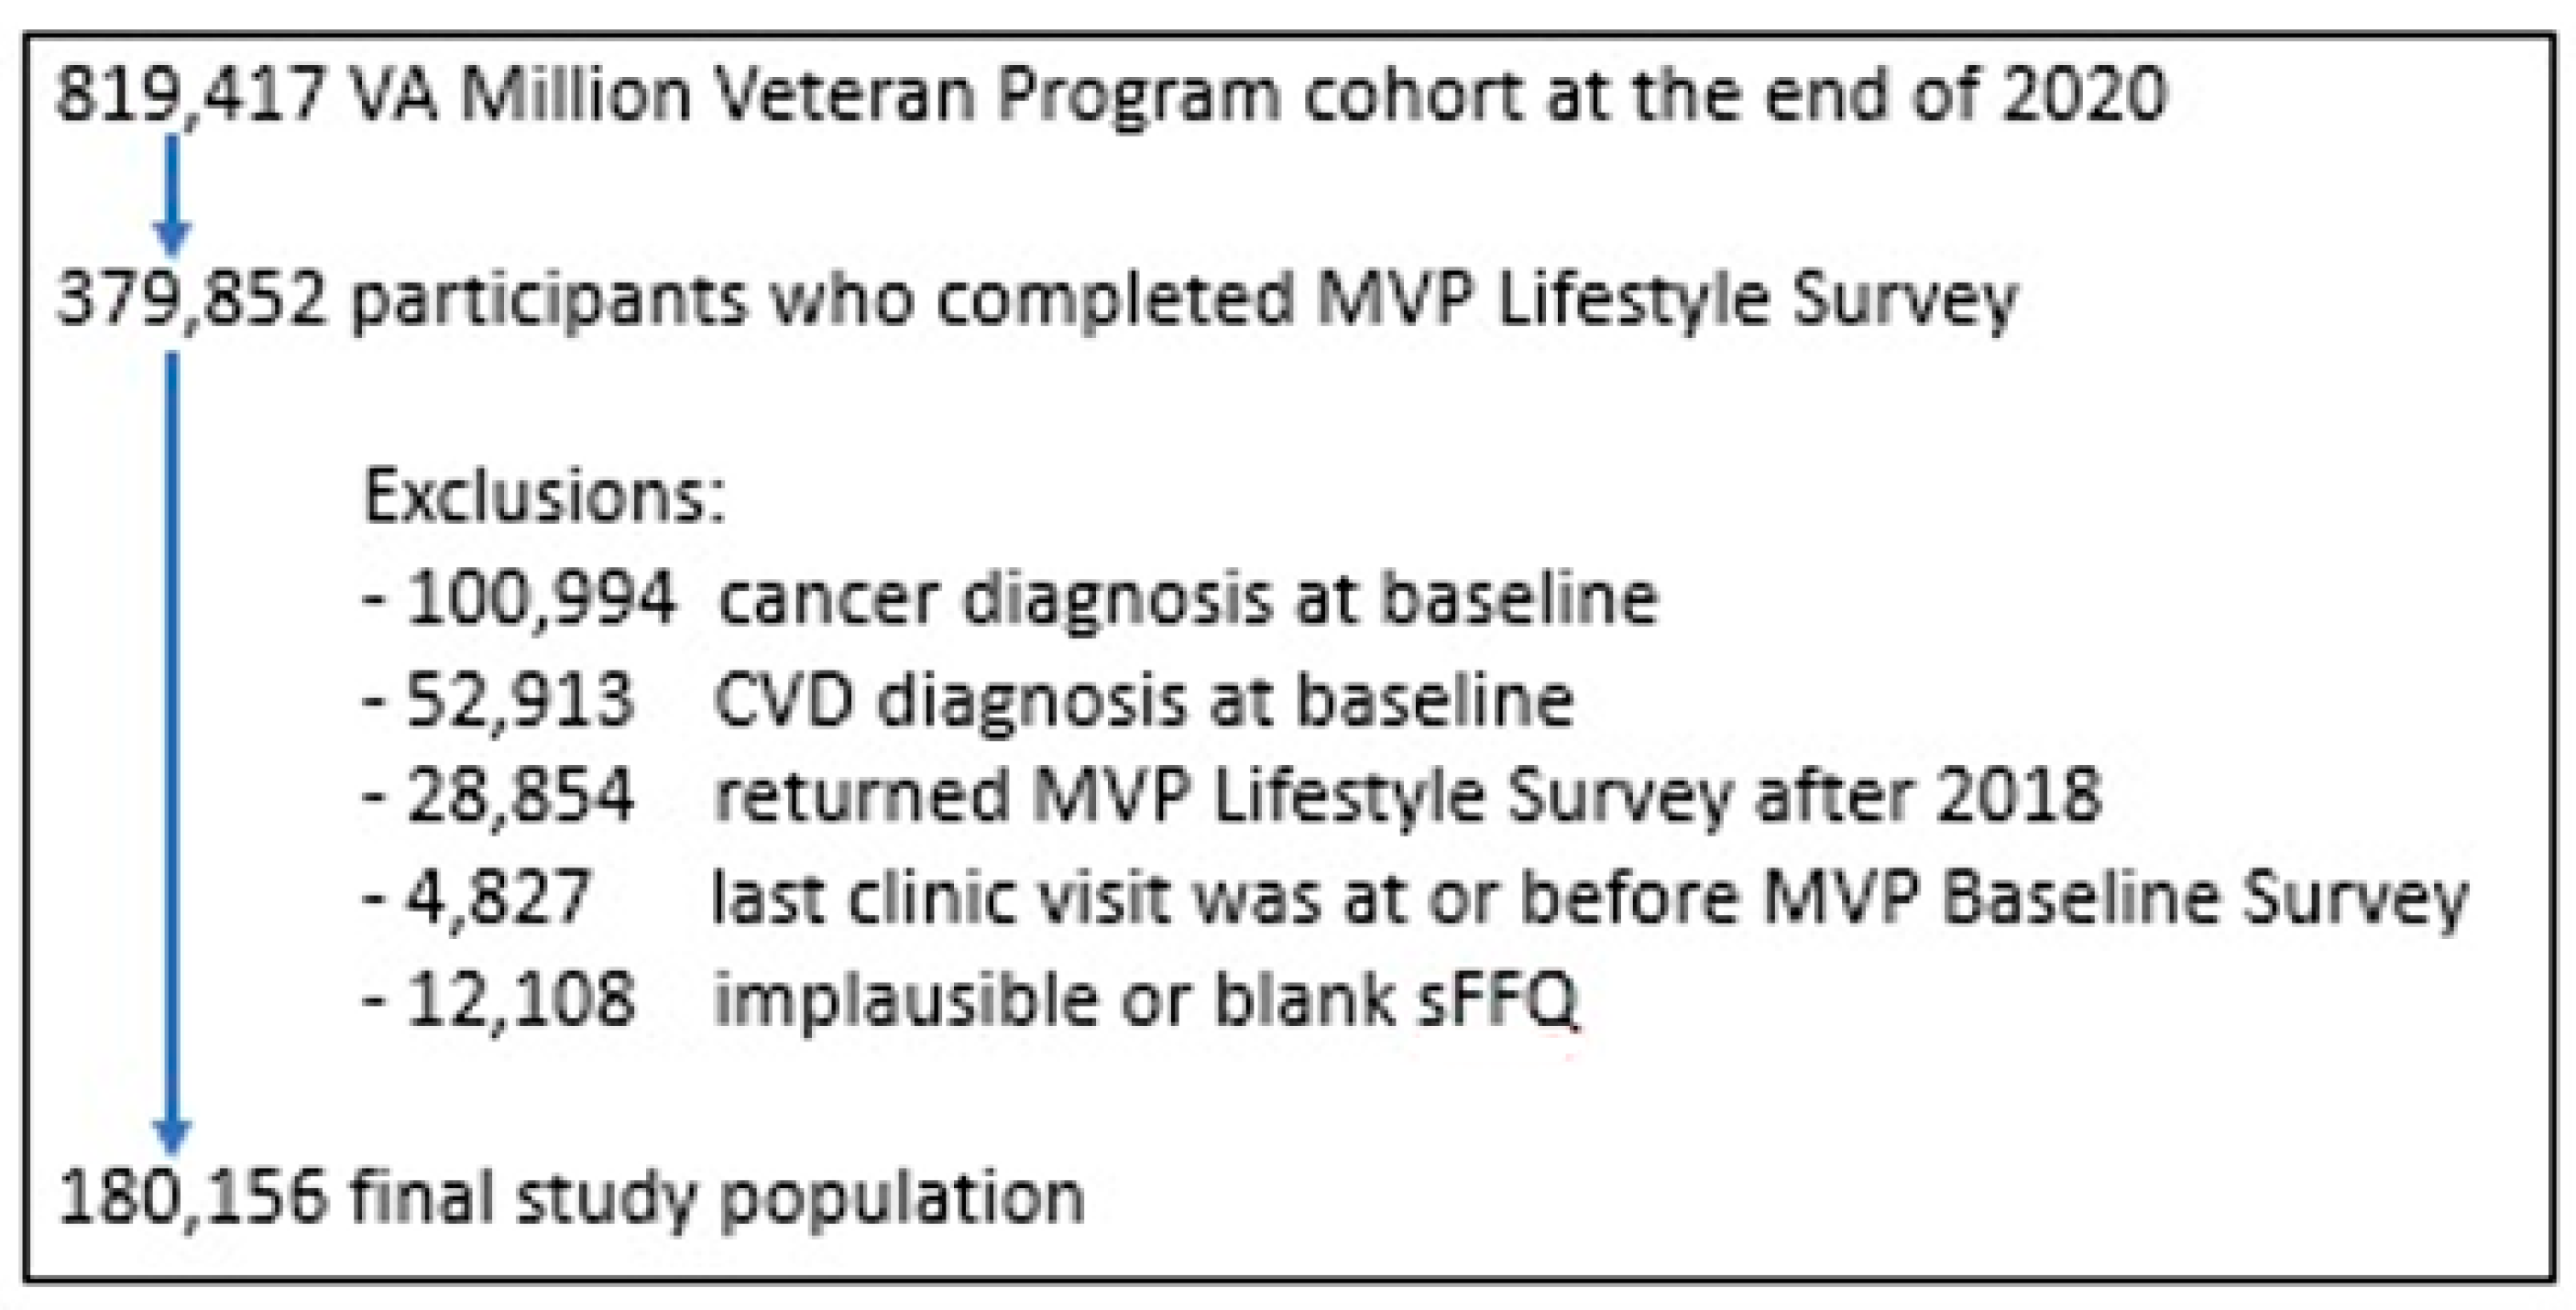
2.1. Study Population
2.2. Assessment of Exposure and Covariates
2.3. Assessment of Cardiovascular Diseases
2.4. Statistical Analysis
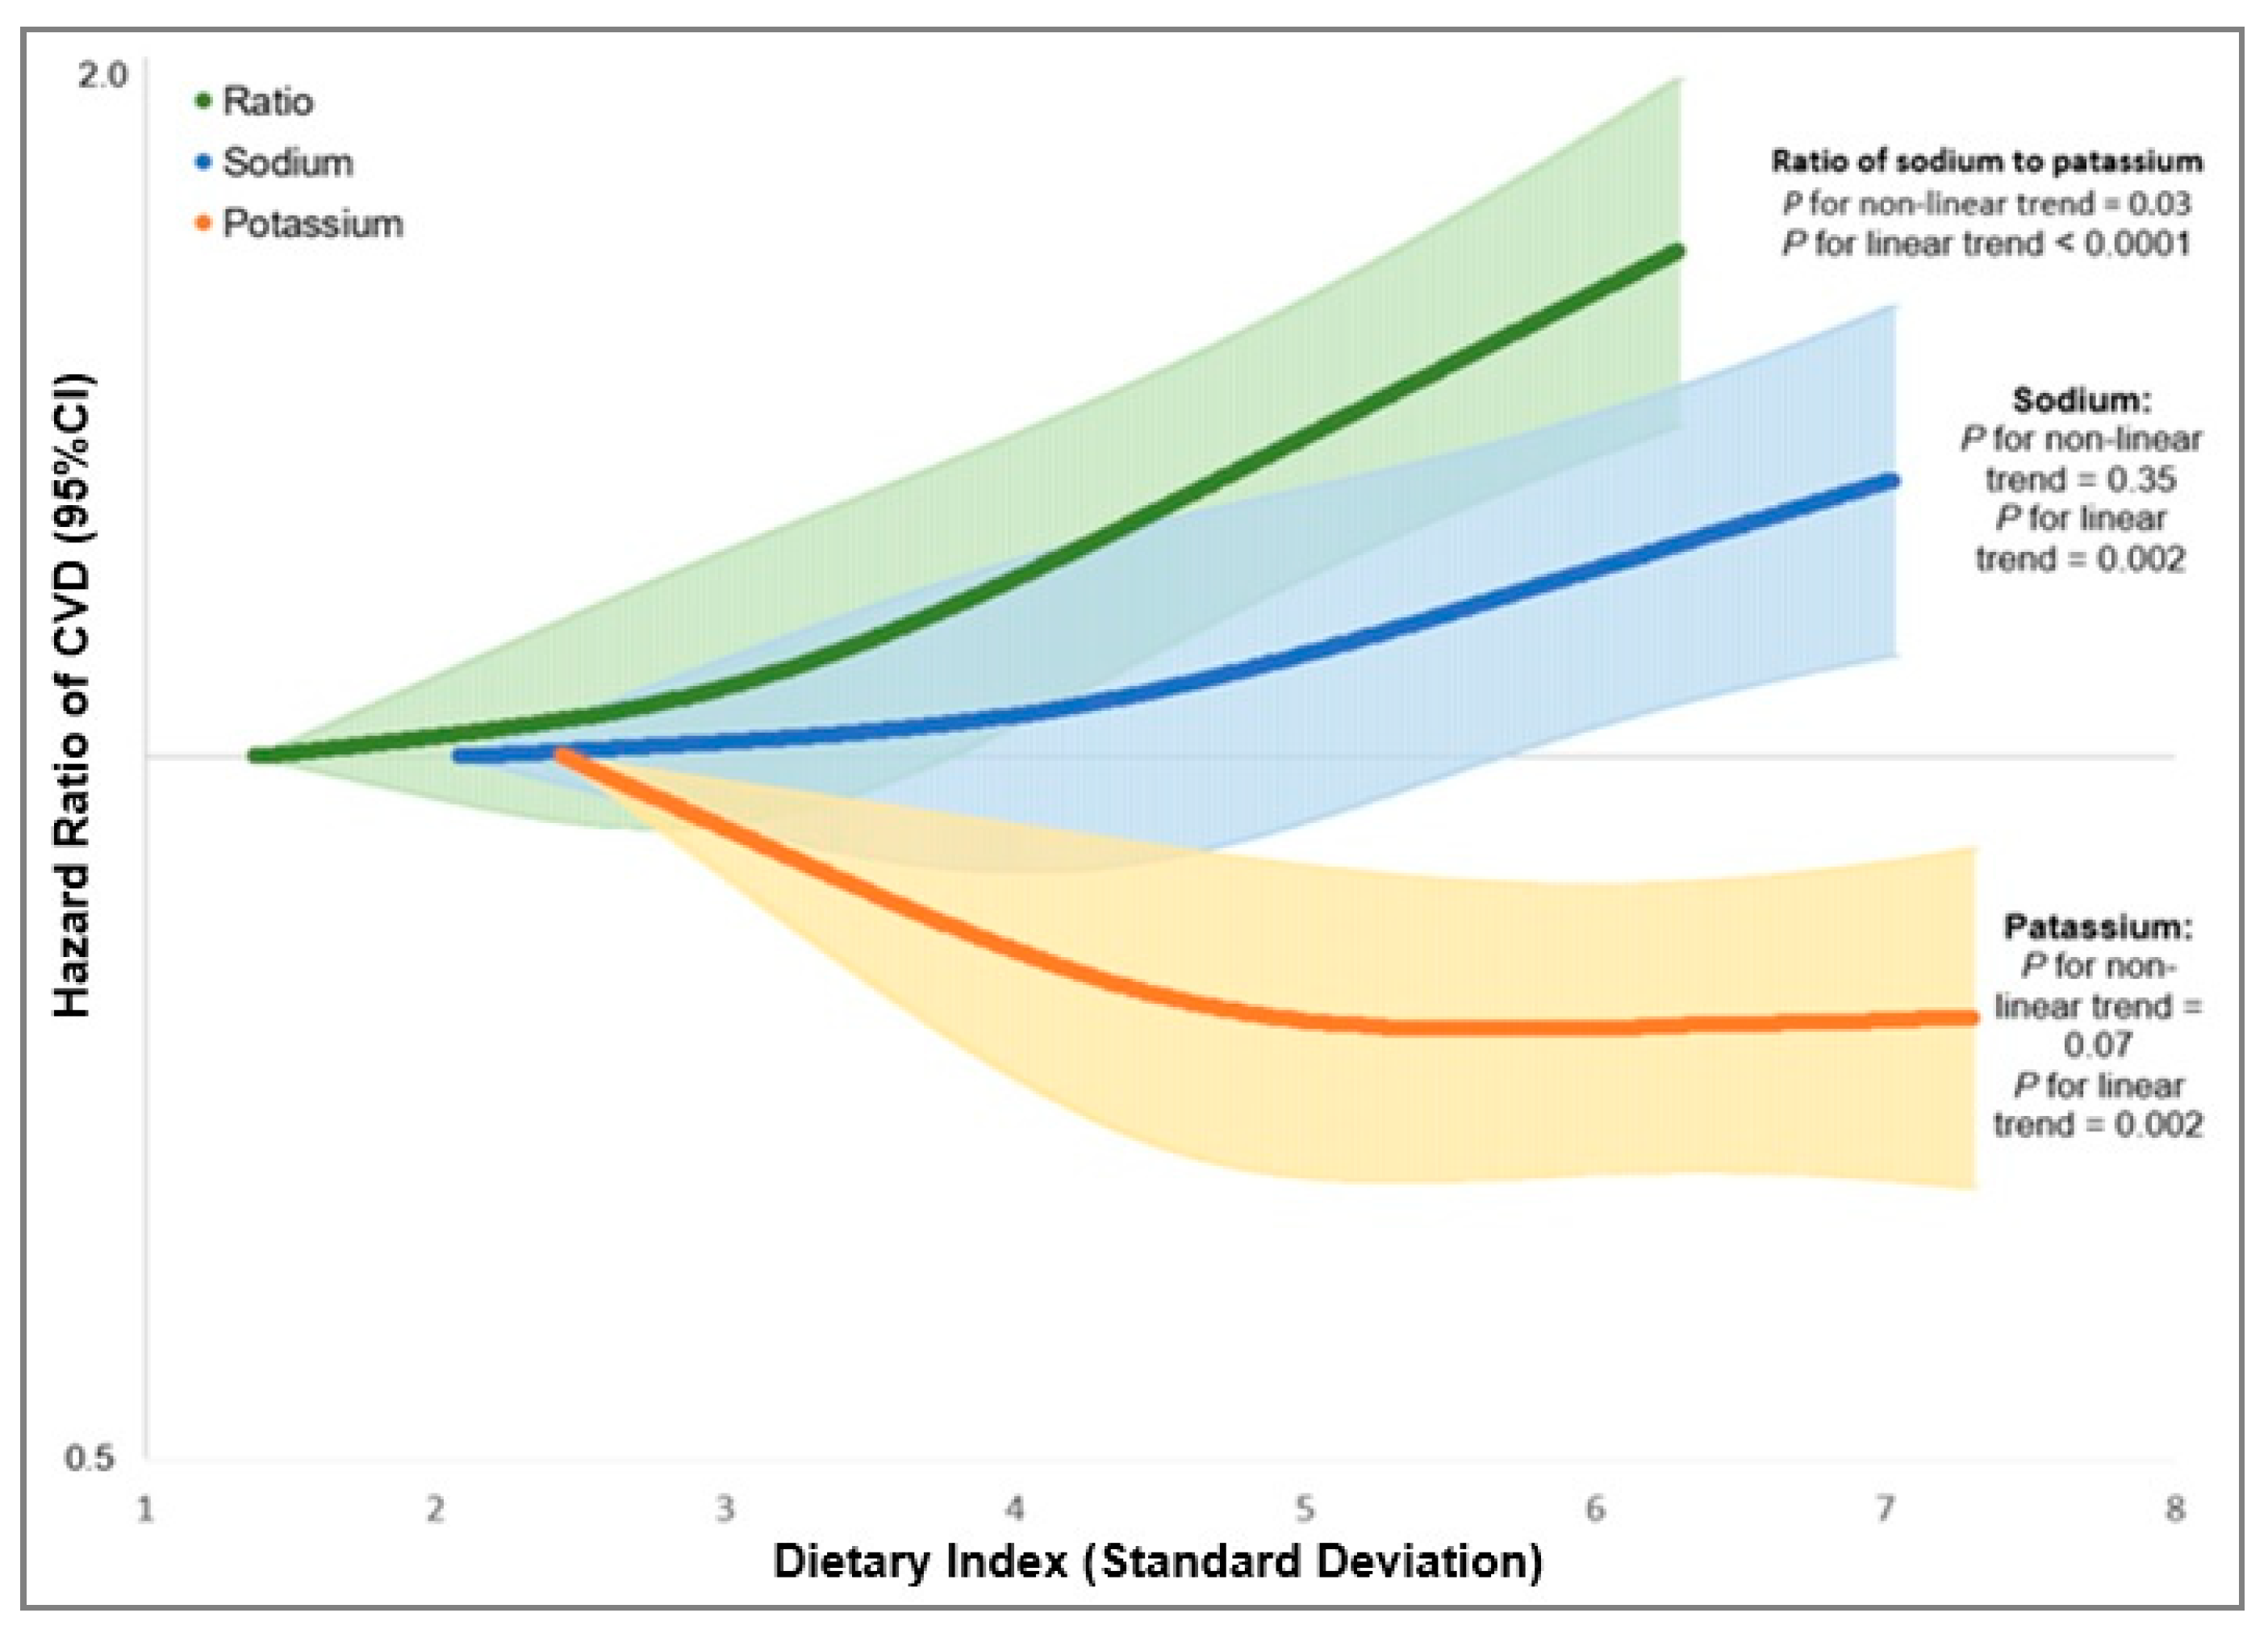
3. Results
4. Discussion
Supplementary Materials
Author Contributions
Funding
Institutional Review Board Statement
Informed Consent Statement
Data Availability Statement
Acknowledgments
Conflicts of Interest
References
- Mozaffarian, D.; Fahimi, S.; Singh, G.M.; Micha, R.; Khatibzadeh, S.; Engell, R.E.; Lim, S.; Danaei, G.; Ezzati, M.; Powles, J.; et al. Global sodium consumption and death from cardiovascular causes. N. Engl. J. Med. 2014, 371, 624–634. [Google Scholar] [CrossRef] [PubMed] [Green Version]
- Bibbins-Domingo, K.; Chertow, G.M.; Coxson, P.G.; Moran, A.; Lightwood, J.M.; Pletcher, M.J.; Goldman, L. Projected effect of dietary salt reductions on future cardiovascular disease. N. Engl. J. Med. 2010, 362, 590–599. [Google Scholar] [CrossRef] [PubMed] [Green Version]
- Ma, Y.; He, F.J.; Sun, Q.; Yuan, C.; Kieneker, L.M.; Curhan, G.C.; MacGregor, G.A.; Bakker, S.J.; Campbell, N.R.; Wang, M.; et al. 24-Hour Urinary Sodium and Potassium Excretion and Cardiovascular Risk. N. Engl. J. Med. 2022, 386, 252–263. [Google Scholar] [CrossRef] [PubMed]
- Jayedi, A.; Ghomashi, F.; Zargar, M.S.; Shab-Bidar, S. Dietary sodium, sodium-to-potassium ratio, and risk of stroke: A systematic review and nonlinear dose-response meta-analysis. Clin. Nutr. 2019, 38, 1092–1100. [Google Scholar] [CrossRef] [PubMed]
- Kieneker, L.M.; Eisenga, M.F.; Gansevoort, R.T.; de Boer, R.A.; Navis, G.; Dullaart, R.P.; Joosten, M.M.; Bakker, S.J. Association of Low Urinary Sodium Excretion With Increased Risk of Stroke. Mayo Clin. Proc. 2018, 93, 1803–1809. [Google Scholar] [CrossRef]
- O’Donnell, M.; Mente, A.; Rangarajan, S.; McQueen, M.J.; Wang, X.; Liu, L.; Yan, H.; Lee, S.F.; Mony, P.; Devanath, A. Urinary sodium and potassium excretion, mortality, and cardiovascular events. N. Engl. J. Med. 2014, 371, 612–623. [Google Scholar] [CrossRef] [Green Version]
- Mente, A.; O’Donnell, M.; Rangarajan, S.; Dagenais, G.; Lear, S.; McQueen, M.; Diaz, R.; Avezum, A.; Lopez-Jaramillo, P.; Lanas, F. Associations of urinary sodium excretion with cardiovascular events in individuals with and without hypertension: A pooled analysis of data from four studies. Lancet 2016, 388, 465–475. [Google Scholar] [CrossRef]
- Gaziano, J.M.; Concato, J.; Brophy, M.; Fiore, L.; Pyarajan, S.; Breeling, J.; Whitbourne, S.; Deen, J.; Shannon, C.; Humphries, D.; et al. Million Veteran Program: A mega-biobank to study genetic influences on health and disease. J. Clin. Epidemiol. 2016, 70, 214–223. [Google Scholar] [CrossRef] [PubMed] [Green Version]
- Salvini, S.; Hunter, D.J.; Sampson, L.; Stampfer, M.J.; Colditz, G.A.; Rosner, B.; Willett, W.C. Food-based validation of a dietary questionnaire: The effects of week-to-week variation in food consumption. Int. J. Epidemiol. 1989, 18, 858–867. [Google Scholar] [CrossRef]
- Harvard, T.H. Chan School of Public Health Nutrition Department. Food Composition Table. 15 January 2015. Available online: https://regepi.bwh.harvard.edu/health/nutrition/ (accessed on 16 July 2021).
- Willett, W.C.; Howe, G.R.; Kushi, L.H. Adjustment for total energy intake in epidemiologic studies. Am. J. Clin. Nutr. 1997, 65 (Suppl. 4), 1220S–1228S. [Google Scholar] [CrossRef]
- US Department of Veterans Affairs. System of Records Notice 97va10p1: Consolidated Data Information System-VA. 76 fr 25409; 4 May 2011. Amended 3 March 2015; US Department of Veterans Affairs: Washington, DC, USA, 2015.
- Center of Excellence for Suicide Prevention. Joint Department of Veterans Affairs (VA) and Department of Defense (DoD) Suicide Data Repository–National Death Index (NDI). Available online: http://vaww.virec.research.va.gov/Mortality/Overview.htm (accessed on 30 March 2021).
- Vassy, J.L.; Lu, B.; Ho, Y.-L.; Galloway, A.; Raghavan, S.; Honerlaw, J.; Tarko, L.; Russo, J.; Qazi, S.; Orkaby, A.R.; et al. Estimation of Atherosclerotic Cardiovascular Disease Risk Among Patients in the Veterans Affairs Health Care System. JAMA Netw. Open 2020, 3, e208236. [Google Scholar] [CrossRef] [PubMed]
- Price, L.E.; Shea, K.; Gephart, S. The Veterans Affairs’s corporate data Warehouse: Uses and implications for nursing research and practice. Nurs. Adm. Q. 2015, 39, 311–318. [Google Scholar] [CrossRef] [PubMed]
- US Department of Veterans Affairs. Frequently Asked Questions—2019 National Veteran Suicide Prevention Annual Report; US Department of Veterans Affairs: Washington, DC, USA, 2019.
- Yu, S.; Chakrabortty, A.; Liao, K.P.; Cai, T.; Ananthakrishnan, A.N.; Gainer, V.S.; Churchill, S.E.; Szolovits, P.; Murphy, S.N.; Kohane, I.S.; et al. Surrogate-assisted feature extraction for high-throughput phenotyping. J. Am. Med. Inform. Assoc. 2016, 24, e143–e149. [Google Scholar] [CrossRef] [PubMed]
- Zhang, Y.; Cai, T.; Yu, S.; Cho, K.; Hong, C.; Sun, J.; Huang, J.; Ho, Y.-L.; Ananthakrishnan, A.N.; Xia, Z.; et al. High-throughput phenotyping with electronic medical record data using a common semi-supervised approach (PheCAP). Nat. Protoc. 2019, 14, 3426–3444. [Google Scholar] [CrossRef]
- Durrleman, S.; Simon, R. Flexible regression models with cubic splines. Stat. Med. 1989, 8, 551–561. [Google Scholar] [CrossRef]
- Djoussé, L.; Ho, Y.; Nguyen, X.T.; Gagnon, D.R.; Wilson, P.W.; Cho, K.; Gaziano, J.M.; Halasz, I.; Federman, D.; Beckham, J.; et al. DASH Score and Subsequent Risk of Coronary Artery Disease: The Findings From Million Veteran Program. J. Am. Heart Assoc. 2018, 7, e008089. [Google Scholar] [CrossRef]
- Scicchitano, P.; Cameli, M.; Maiello, M.; Modesti, P.A.; Muiesan, M.L.; Novo, S.; Palmiero, P.; Saba, P.S.; Pedrinelli, R.; Ciccone, M.M. Nutraceuticals and dyslipidaemia: Beyond the common therapeutics. J. Funct. Foods 2014, 6, 11–32. [Google Scholar] [CrossRef]
- Cook, N.R.; Appel, L.J.; Whelton, P.K. Lower Levels of Sodium Intake and Reduced Cardiovascular Risk. Circulation 2014, 129, 981–989. [Google Scholar] [CrossRef] [Green Version]
- Mills, K.T.; Chen, J.; Yang, W.; Appel, L.J.; Kusek, J.W.; Alper, A.; Delafontaine, P.; Keane, M.G.; Mohler, E.; Ojo, A.; et al. Sodium Excretion and the Risk of Cardiovascular Disease in Patients With Chronic Kidney Disease. JAMA J. Am. Med. Assoc. 2016, 315, 2200–2210. [Google Scholar] [CrossRef]
- Fuchs, F.D.; Whelton, P.K. High Blood Pressure and Cardiovascular Disease. Hypertension 2020, 75, 285–292. [Google Scholar] [CrossRef] [PubMed]
- Sacks, F.M.; Svetkey, L.P.; Vollmer, W.M.; Appel, L.J.; Bray, G.A.; Harsha, D.; Obarzanek, E.; Conlin, P.R.; Miller, E.R.; Simons-Morton, D.G.; et al. Effects on Blood Pressure of Reduced Dietary Sodium and the Dietary Approaches to Stop Hypertension (DASH) Diet. N. Engl. J. Med. 2001, 344, 3–10. [Google Scholar] [CrossRef] [PubMed]
- Institute of Medicine. Sodium Intake in Populations: Assessment of Evidence; The National Academies Press: Washington, DC, USA, 2013. [Google Scholar] [CrossRef]
- Newberry, S.J.; Chung, M.; Anderson, C.A.M.; Chen, C.; Fu, Z.; Tang, A.; Zhao, N.; Booth, M.; Marks, J.; Hollands, S.; et al. Sodium and Potassium Intake: Effects on Chronic Disease Outcomes and Risks; Agency for Healthcare Research and Quality (US): Rockville, MD, USA, 2018.
- Okayama, A.; Okuda, N.; Miura, K.; Okamura, T.; Hayakawa, T.; Akasaka, H.; Ohnishi, H.; Saitoh, S.; Arai, Y.; Kiyohara, Y.; et al. Dietary sodium-to-potassium ratio as a risk factor for stroke, cardiovascular disease and all-cause mortality in Japan: The NIPPON DATA80 cohort study. BMJ Open 2016, 6, e011632. [Google Scholar] [CrossRef] [PubMed]
- Yang, Q.; Liu, T.; Kuklina, E.V.; Flanders, W.D.; Hong, Y.; Gillespie, C.; Chang, M.-H.; Gwinn, M.; Dowling, N.; Khoury, M.J.; et al. Sodium and potassium intake and mortality among US adults: Prospective data from the Third National Health and Nutrition Examination Survey. Arch. Intern. Med. 2011, 171, 1183–1191. [Google Scholar] [CrossRef] [PubMed] [Green Version]
- Cook, N.R.; Obarzanek, E.; Cutler, J.A.; Buring, J.E.; Rexrode, K.M.; Kumanyika, S.K.; Appel, L.J.; Whelton, P.K. Joint effects of sodium and potassium intake on subsequent cardiovascular disease: The Trials of Hypertension Prevention follow-up study. Arch. Intern. Med. 2009, 169, 32–40. [Google Scholar] [CrossRef] [PubMed] [Green Version]
- Prentice, R.L.; Huang, Y.; Neuhouser, M.L.; Manson, J.E.; Mossavar-Rahmani, Y.; Thomas, F.; Tinker, L.F.; Allison, M.; Johnson, K.C.; Wassertheil-Smoller, S.; et al. Associations of biomarker-calibrated sodium and potassium intakes with cardiovascular disease risk among postmenopausal women. Am. J. Epidemiol. 2017, 186, 1035–1043. [Google Scholar] [CrossRef] [PubMed]
- Firestone, M.J.; Beasley, J.M.; Kwon, S.C.; Ahn, J.; Trinh-Shevrin, C.; Yi, S.S. Asian American dietary sources of sodium and salt behaviors compared with other racial/ethnic groups, NHANES, 2011–2012. Ethn. Dis. 2017, 27, 241. [Google Scholar] [CrossRef] [PubMed]
- Bailey, R.L.; Parker, E.; Rhodes, D.G.; Goldman, J.D.; Clemens, J.C.; Moshfegh, A.J.; Thuppal, S.V.; Weaver, C.M. Estimating Sodium and Potassium Intakes and Their Ratio in the American Diet: Data from the 2011–2012 NHANES. J. Nutr. 2015, 146, 745–750. [Google Scholar] [CrossRef]
- US Department of Health and Human Services and US Department of Agriculture. Dietary Guidelines for Americans. 2015. Available online: https://health.gov/our-work/nutrition-physical-activity/dietary-guidelines/previous-dietary-guidelines/2015 (accessed on 12 October 2020).
- World Health Organization. Guideline: Sodium Intake for Adults and Children; World Health Organization: Geneva, Switzerland, 2012. [Google Scholar]
- World Health Organization. Guideline: Potassium Intake for Adults and Children; World Health Organization: Geneva, Switzerland, 2012. [Google Scholar]


| Sodium | Potassium | Ratio of Sodium to Potassium | |||||||
|---|---|---|---|---|---|---|---|---|---|
| Q1 | Q3 | Q5 | Q1 | Q3 | Q5 | Q1 | Q3 | Q5 | |
| N | 36,031 | 36,032 | 36,031 | 36,031 | 36,032 | 36,031 | 36,031 | 36,032 | 36,031 |
| Sodium, mg/d | 865 | 1231 | 1666 | 1181 | 1271 | 1251 | 973 | 1242 | 1532 |
| Potassium, mg/d | 2478 | 2634 | 2628 | 1857 | 2575 | 3406 | 3102 | 2596 | 2112 |
| Ratio of sodium to potassium | 0.4 | 0.5 | 0.7 | 0.6 | 0.5 | 0.4 | 0.3 | 0.5 | 0.7 |
| Age, years | 59.9 | 62.3 | 64.2 | 59.3 | 62.6 | 64.2 | 62.2 | 62.4 | 61.9 |
| Men, % | 80.8 | 90.5 | 95.7 | 87.0 | 89.6 | 90.8 | 84.0 | 89.9 | 92.8 |
| White, % | 75.4 | 83.0 | 86.7 | 75.1 | 83.5 | 85.4 | 79.3 | 83.5 | 80.9 |
| Black, % | 18.3 | 13.1 | 10.1 | 20.0 | 12.5 | 10.3 | 14.9 | 12.4 | 15.6 |
| Married, % | 51.9 | 60.2 | 59.5 | 49.1 | 61.0 | 60.9 | 56.3 | 61.0 | 54.1 |
| Education level, % | |||||||||
| ≤High school or GED | 19.3 | 21.4 | 28.1 | 27.4 | 20.9 | 21.0 | 17.6 | 21.6 | 29.2 |
| Some colleague | 29.3 | 30.1 | 31.9 | 32.6 | 29.4 | 29.2 | 28.0 | 30.4 | 32.6 |
| College or above | 51.4 | 48.5 | 39.9 | 40.0 | 49.7 | 49.8 | 54.4 | 48.0 | 38.3 |
| Annual family income, % | |||||||||
| <30,000 | 32.9 | 31.9 | 39.1 | 40.8 | 31.5 | 32.8 | 31.4 | 31.5 | 41.2 |
| 30,000–59,000 | 33.8 | 35.6 | 35.9 | 33.7 | 35.5 | 35.5 | 34.0 | 35.9 | 34.5 |
| ≥60,000 | 33.3 | 32.4 | 24.9 | 25.6 | 33.0 | 31.7 | 34.6 | 32.6 | 24.2 |
| Smoking status, % | |||||||||
| Never smoking | 35.7 | 33.4 | 27.8 | 30.3 | 33.3 | 32.6 | 36.6 | 32.5 | 29.1 |
| Former smoker | 56.7 | 59.1 | 64.5 | 59.7 | 59.5 | 61.3 | 57.4 | 60.0 | 62.0 |
| Current smoking | 7.6 | 7.5 | 7.7 | 10.0 | 7.2 | 6.1 | 6.0 | 7.5 | 8.9 |
| Vigorously exercise 1, % | |||||||||
| Never/rarely | 27.1 | 26.5 | 33.7 | 37.4 | 26.2 | 24.2 | 22.6 | 27.6 | 36.9 |
| 1–4 times/month | 24.5 | 27.3 | 27.2 | 27.8 | 27.8 | 23.9 | 23.0 | 27.7 | 27.5 |
| 2–4 times/week | 31.9 | 31.9 | 26.5 | 23.7 | 31.9 | 33.5 | 35.0 | 31.0 | 24.1 |
| ≥5 times/week | 16.5 | 14.3 | 12.7 | 11.1 | 14.1 | 18.4 | 19.4 | 13.7 | 11.6 |
| Alcohol drinking, % | |||||||||
| Never | 34.0 | 39.1 | 50.7 | 37.5 | 39.2 | 48.1 | 40.2 | 39.1 | 46.5 |
| <1 times/week | 23.7 | 29.6 | 30.3 | 24.3 | 28.5 | 30.5 | 27.1 | 28.6 | 28.2 |
| ≥1 times/week | 42.3 | 31.3 | 19.0 | 38.2 | 32.3 | 21.4 | 32.7 | 32.3 | 25.3 |
| Energy intake, kcal/day | 1432 | 1438 | 1441 | 1431 | 1457 | 1419 | 1410 | 1459 | 1425 |
| BMI, kg/m2 | 28.6 | 29.6 | 30.6 | 29.4 | 29.7 | 29.6 | 28.8 | 29.7 | 30.3 |
| Hypertension, % | 48.5 | 54.4 | 62.1 | 54.2 | 54.4 | 55.2 | 49.5 | 55.4 | 58.9 |
| High cholesterol, % | 45.4 | 50.0 | 54.9 | 47.0 | 50.2 | 51.9 | 47.5 | 50.9 | 51.4 |
| Diabetes, % | 12.9 | 20.7 | 35.6 | 17.3 | 23.2 | 26.2 | 17.2 | 22.8 | 27.7 |
| DASH score | 21.7 | 21.8 | 20.7 | 16.9 | 21.9 | 25.5 | 24.9 | 21.7 | 18.0 |
| Number of baseline diseases and conditions | |||||||||
| 0–2 | 32.1 | 29.9 | 28.1 | 30.6 | 29.3 | 29.5 | 31.7 | 29.2 | 29.2 |
| 3–4 | 24.8 | 26.3 | 25.6 | 25.1 | 26.0 | 25.4 | 25.1 | 25.8 | 25.3 |
| 5–6 | 18.4 | 19.1 | 19.8 | 18.8 | 19.3 | 19.2 | 18.5 | 19.6 | 19.5 |
| ≥7 | 24.7 | 24.7 | 26.5 | 25.4 | 25.3 | 25.9 | 24.8 | 25.5 | 26.0 |
| Number of medication types | |||||||||
| 0 | 31.4 | 29.6 | 27.3 | 28.9 | 29.1 | 29.8 | 31.6 | 28.5 | 27.8 |
| 1 | 22.0 | 22.7 | 23.2 | 22.4 | 22.7 | 22.3 | 22.2 | 22.9 | 22.9 |
| 2 | 15.5 | 16.7 | 16.7 | 16.0 | 16.8 | 16.0 | 15.4 | 16.5 | 16.5 |
| ≥3 | 31.0 | 30.9 | 32.8 | 32.7 | 31.4 | 32.0 | 30.7 | 32.1 | 32.7 |
| Number of dietary supplement types | |||||||||
| 0 | 24.3 | 25.3 | 27.1 | 31.3 | 24.7 | 21.7 | 20.9 | 25.3 | 30.1 |
| 1 | 21.1 | 22.6 | 24.6 | 24.6 | 22.8 | 21.5 | 20.2 | 23.0 | 25.2 |
| 2–3 | 29.0 | 29.4 | 29.1 | 26.9 | 29.8 | 29.8 | 29.9 | 29.8 | 27.7 |
| ≥4 | 25.5 | 22.7 | 19.2 | 17.2 | 22.7 | 27.0 | 28.9 | 21.9 | 17.0 |
| Quintiles of Dietary Indices | ptrend | HR (95%CI) | |||||
|---|---|---|---|---|---|---|---|
| Q1 | Q2 | Q3 | Q4 | Q5 | Per 1-SD Increment | ||
| Sodium Intakes | |||||||
| Median | 898 | 1095 | 1231 | 1373 | 1605 | ||
| Cases | 679 | 705 | 766 | 888 | 1052 | ||
| IR (/103 PYs) | 5.47 | 5.66 | 6.16 | 7.12 | 8.45 | ||
| Model 1 | 1.0 (ref.) | 0.98 (0.88, 1.09) | 1.02 (0.92, 1.14) | 1.15 (1.04, 1.27) | 1.33 (1.21, 1.46) | <0.0001 | 1.16 (1.11, 1.21) |
| Model 2 | 1.0 (ref.) | 0.97 (0.88, 1.08) | 1.00 (0.90, 1.11) | 1.10 (0.99, 1.21) | 1.19 (1.07, 1.31) | <0.0001 | 1.10 (1.05, 1.14) |
| Model 3 | 1.0 (ref.) | 0.97 (0.87, 1.08) | 0.99 (0.90, 1.10) | 1.08 (0.98, 1.20) | 1.17 (1.05, 1.29) | 0.0001 | 1.09 (1.04, 1.13) |
| Model 4 | 1.0 (ref.) | 0.96 (0.86, 1.06) | 0.97 (0.88, 1.08) | 1.04 (0.94, 1.16) | 1.09 (0.99, 1.21) | 0.01 | 1.06 (1.01, 1.10) |
| Potassium Intakes | |||||||
| Median | 1920 | 2306 | 2575 | 2854 | 3299 | ||
| Cases | 830 | 808 | 767 | 833 | 852 | ||
| IR (/103 PYs) | 6.85 | 6.62 | 6.21 | 6.60 | 6.59 | ||
| Model 1 | 1.0 (ref.) | 0.90 (0.82, 1.00) | 0.81 (0.74, 0.90) | 0.84 (0.76, 0.93) | 0.83 (0.75, 0.91) | <0.0001 | 0.93 (0.90, 0.96) |
| Model 2 | 1.0 (ref.) | 0.97 (0.88, 1.07) | 0.89 (0.81, 0.99) | 0.93 (0.85, 1.03) | 0.90 (0.82, 0.99) | 0.03 | 0.96 (0.93, 1.00) |
| Model 3 | 1.0 (ref.) | 0.96 (0.87, 1.06) | 0.89 (0.80, 0.98) | 0.92 (0.84, 1.02) | 0.89 (0.81, 0.98) | 0.02 | 0.96 (0.92, 0.99) |
| Model 4 | 1.0 (ref.) | 0.95 (0.86, 1.05) | 0.87 (0.79, 0.96) | 0.90 (0.82, 1.00) | 0.87 (0.79, 0.96) | 0.005 | 0.95 (0.91, 0.98) |
| Ratio of Sodium to Potassium | |||||||
| Median | 0.33 | 0.41 | 0.48 | 0.55 | 0.69 | ||
| Cases | 698 | 785 | 756 | 832 | 1019 | ||
| IR (/103 PYs) | 5.48 | 6.26 | 6.07 | 6.75 | 8.37 | ||
| Model 1 | 1.0 (ref.) | 1.12 (1.01, 1.24) | 1.09 (0.98, 1.20) | 1.21 (1.10, 1.34) | 1.52 (1.38, 1.67) | <0.0001 | 1.23 (1.18, 1.29) |
| Model 2 | 1.0 (ref.) | 1.12 (1.01, 1.24) | 1.04 (0.94, 1.16) | 1.12 (1.01, 1.24) | 1.31 (1.19, 1.45) | <0.0001 | 1.14 (1.08, 1.19) |
| Model 3 | 1.0 (ref.) | 1.12 (1.01, 1.24) | 1.04 (0.94, 1.15) | 1.11 (1.00, 1.23) | 1.30 (1.18, 1.43) | <0.0001 | 1.13 (1.08, 1.18) |
| Model 4 | 1.0 (ref.) | 1.10 (0.99, 1.22) | 1.02 (0.92, 1.13) | 1.08 (0.98, 1.20) | 1.26 (1.14, 1.39) | <0.0001 | 1.11 (1.06, 1.16) |
| Quintile of Dietary Indices | ptrend | HR (95%CI) | ||||||
|---|---|---|---|---|---|---|---|---|
| Q1 | Q2 | Q3 | Q4 | Q5 | Per 1-SD Increment | |||
| Sodium | ||||||||
| Non-fatal MI | Cases | 393 | 422 | 489 | 554 | 641 | ||
| Model1 | 1.0 (ref.) | 1.01 (0.88, 1.15) | 1.12 (0.98, 1.28) | 1.23 (1.08, 1.40) | 1.38 (1.21, 1.56) | <0.0001 | 1.17 (1.11, 1.24) | |
| Model2 | 1.0 (ref.) | 0.99 (0.86, 1.14) | 1.07 (0.94, 1.23) | 1.13 (1.00, 1.29) | 1.18 (1.04, 1.35) | 0.001 | 1.09 (1.04, 1.15) | |
| Model3 | 1.0 (ref.) | 0.98 (0.86, 1.13) | 1.06 (0.93, 1.21) | 1.11 (0.98, 1.27) | 1.15 (1.01, 1.31) | 0.005 | 1.08 (1.02, 1.14) | |
| Model4 | 1.0 (ref.) | 0.97 (0.85, 1.12) | 1.04 (0.91, 1.19) | 1.08 (0.95, 1.23) | 1.09 (0.96, 1.24) | 0.06 | 1.05 (1.00, 1.11) | |
| Non-fatal AIS | Cases | 306 | 300 | 297 | 363 | 446 | ||
| Model1 | 1.0 (ref.) | 0.93 (0.79, 1.09) | 0.89 (0.76, 1.05) | 1.06 (0.91, 1.23) | 1.27 (1.1, 1.47) | <0.0001 | 1.14 (1.07, 1.22) | |
| Model2 | 1.0 (ref.) | 0.94 (0.8, 1.11) | 0.9 (0.77, 1.06) | 1.05 (0.9, 1.23) | 1.2 (1.04, 1.4) | 0.0018 | 1.11 (1.04, 1.18) | |
| Model3 | 1.0 (ref.) | 0.94 (0.8, 1.11) | 0.9 (0.77, 1.06) | 1.05 (0.9, 1.22) | 1.2 (1.03, 1.39) | 0.0026 | 1.11 (1.04, 1.18) | |
| Model4 | 1.0 (ref.) | 0.93 (0.79, 1.09) | 0.88 (0.75, 1.03) | 1 (0.85, 1.17) | 1.1 (0.94, 1.28) | 0.0754 | 1.06 (0.99, 1.13) | |
| Potassium | ||||||||
| Non-Fatal MI | Cases | 502 | 490 | 464 | 554 | 489 | ||
| Model1 | 1.0 (ref.) | 0.91 (0.80, 1.03) | 0.82 (0.72, 0.93) | 0.93 (0.82, 1.05) | 0.79 (0.70, 0.89) | 0.001 | 0.93 (0.88, 0.97) | |
| Model2 | 1.0 (ref.) | 0.96 (0.85, 1.09) | 0.89 (0.78, 1.01) | 1.01 (0.89, 1.14) | 0.84 (0.74, 0.96) | 0.03 | 0.95 (0.91, 0.99) | |
| Model3 | 1.0 (ref.) | 0.96 (0.84, 1.08) | 0.88 (0.77, 1.00) | 1.00 (0.88, 1.13) | 0.83 (0.73, 0.95) | 0.02 | 0.94 (0.90, 0.99) | |
| Model3 | 1.0 (ref.) | 0.95 (0.84, 1.07) | 0.86 (0.76, 0.98) | 0.98 (0.87, 1.11) | 0.82 (0.72, 0.93) | 0.007 | 0.94 (0.89, 0.98) | |
| Non-fatal AIS | Cases | 348 | 342 | 326 | 316 | 380 | ||
| Model1 | 1.0 (ref.) | 0.91 (0.78, 1.06) | 0.82 (0.71, 0.95) | 0.75 (0.65, 0.88) | 0.87 (0.75, 1.01) | 0.02 | 0.94 (0.88, 0.99) | |
| Model2 | 1.0 (ref.) | 0.99 (0.85, 1.15) | 0.92 (0.79, 1.08) | 0.87 (0.74, 1.01) | 0.98 (0.85, 1.14) | 0.49 | 0.98 (0.93, 1.04) | |
| Model3 | 1.0 (ref.) | 0.99 (0.85, 1.15) | 0.92 (0.79, 1.07) | 0.86 (0.74, 1.01) | 0.98 (0.85, 1.14) | 0.48 | 0.98 (0.93, 1.04) | |
| Model3 | 1.0 (ref.) | 0.97 (0.84, 1.13) | 0.90 (0.77, 1.05) | 0.84 (0.72, 0.98) | 0.95 (0.82, 1.11) | 0.26 | 0.97 (0.91, 1.02) | |
| Ratio of Sodium to Potassium | ||||||||
| Non-fatal MI | Cases | 404 | 470 | 468 | 542 | 615 | ||
| Model1 | 1.0 (ref.) | 1.16 (1.01, 1.32) | 1.15 (1.01, 1.32) | 1.35 (1.18, 1.53) | 1.55 (1.37, 1.76) | <0.0001 | 1.25 (1.18, 1.32) | |
| Model2 | 1.0 (ref.) | 1.14 (1.00, 1.30) | 1.09 (0.95, 1.25) | 1.23 (1.08, 1.40) | 1.32 (1.17, 1.50) | <0.0001 | 1.14 (1.08, 1.21) | |
| Model3 | 1.0 (ref.) | 1.13 (0.99, 1.30) | 1.08 (0.95, 1.24) | 1.22 (1.07, 1.38) | 1.31 (1.15, 1.49) | <0.0001 | 1.14 (1.07, 1.21) | |
| Model3 | 1.0 (ref.) | 1.12 (0.98, 1.28) | 1.06 (0.93, 1.22) | 1.19 (1.04, 1.35) | 1.27 (1.12, 1.45) | 0.0001 | 1.12 (1.06, 1.19) | |
| Non-Fatal AIS | Cases | 312 | 330 | 314 | 317 | 439 | ||
| Model1 | 1.0 (ref.) | 1.06 (0.91, 1.24) | 1.02 (0.87, 1.19) | 1.05 (0.90, 1.23) | 1.49 (1.29, 1.72) | <0.0001 | 1.22 (1.14, 1.31) | |
| Model2 | 1.0 (ref.) | 1.08 (0.92, 1.26) | 1.00 (0.86, 1.17) | 0.99 (0.85, 1.16) | 1.32 (1.14, 1.53) | 0.0005 | 1.13 (1.06, 1.22) | |
| Model3 | 1.0 (ref.) | 1.08 (0.92, 1.26) | 1.00 (0.85, 1.17) | 0.98 (0.84, 1.15) | 1.31 (1.13, 1.52) | 0.0006 | 1.13 (1.05, 1.21) | |
| Model4 | 1.0 (ref.) | 1.06 (0.91, 1.24) | 0.97 (0.83, 1.14) | 0.95 (0.81, 1.11) | 1.26 (1.08, 1.46) | 0.005 | 1.11 (1.03, 1.19) | |
| Quintiles of Dietary Indices | ptrend | HR (95%CI) | |||||
|---|---|---|---|---|---|---|---|
| Q1 | Q2 | Q3 | Q4 | Q5 | Per 1-SD Increment | ||
| Sex | p for interaction = 0.99 | ||||||
| Female | 1.0 (ref.) | 0.96 (0.64, 1.42) | 0.66 (0.41, 1.04) | 0.96 (0.62, 1.49) | 1.36 (0.90, 2.06) | 0.23 | 1.14 (0.92, 1.42) |
| Male | 1.0 (ref.) | 1.12 (1.00, 1.24) | 1.04 (0.94, 1.16) | 1.09 (0.98, 1.21) | 1.26 (1.14, 1.40) | <0.0001 | 1.11 (1.06, 1.16) |
| Race | p for interaction = 0.92 | ||||||
| White | 1.0 (ref.) | 1.09 (0.98, 1.23) | 1.03 (0.92, 1.15) | 1.08 (0.97, 1.21) | 1.28 (1.15, 1.43) | <0.0001 | 1.12 (1.07, 1.18) |
| Black | 1.0 (ref.) | 1.25 (0.95, 1.64) | 0.96 (0.72, 1.28) | 1.18 (0.90, 1.54) | 1.29 (1.00, 1.66) | 0.07 | 1.12 (0.99, 1.26) |
| Baseline diabetes | p for interaction = 0.99 | ||||||
| No | 1.0 (ref.) | 1.02 (0.89, 1.17) | 0.94 (0.82, 1.08) | 1.04 (0.91, 1.19) | 1.21 (1.06, 1.38) | 0.002 | 1.11 (1.04, 1.18) |
| Yes | 1.0 (ref.) | 1.20 (0.97, 1.48) | 1.08 (0.88, 1.33) | 1.15 (0.94, 1.40) | 1.29 (1.06, 1.56) | 0.02 | 1.11 (1.01, 1.21) |
| Baseline high cholesterol | p for interaction = 0.24 | ||||||
| No | 1.0 (ref.) | 1.17 (0.99, 1.38) | 1.02 (0.85, 1.21) | 1.06 (0.89, 1.26) | 1.37 (1.17, 1.61) | 0.0004 | 1.15 (1.06, 1.24) |
| Yes | 1.0 (ref.) | 1.00 (0.86, 1.16) | 0.96 (0.82, 1.11) | 1.07 (0.92, 1.24) | 1.12 (0.97, 1.30) | 0.04 | 1.07 (1.00, 1.15) |
| Baseline hypertension | p for interaction = 0.41 | ||||||
| No | 1.0 (ref.) | 0.99 (0.82, 1.20) | 0.89 (0.73, 1.09) | 0.96 (0.79, 1.16) | 1.27 (1.06, 1.53) | 0.008 | 1.13 (1.03, 1.24) |
| Yes | 1.0 (ref.) | 1.12 (0.97, 1.28) | 1.03 (0.90, 1.19) | 1.12 (0.98, 1.29) | 1.22 (1.06, 1.39) | 0.005 | 1.09 (1.03, 1.16) |
| DASH score | p for interaction = 0.07 | ||||||
| Low (≤21) | 1.0 (ref.) | 1.07 (0.87, 1.32) | 0.99 (0.81, 1.21) | 1.07 (0.88, 1.29) | 1.25 (1.04, 1.49) | 0.0003 | 1.14 (1.06, 1.22) |
| High (>21) | 1.0 (ref.) | 1.09 (0.97, 1.23) | 1.00 (0.88, 1.13) | 1.02 (0.89, 1.17) | 1.10 (0.94, 1.28) | 0.50 | 1.02 (0.95, 1.10) |
Publisher’s Note: MDPI stays neutral with regard to jurisdictional claims in published maps and institutional affiliations. |
© 2022 by the authors. Licensee MDPI, Basel, Switzerland. This article is an open access article distributed under the terms and conditions of the Creative Commons Attribution (CC BY) license (https://creativecommons.org/licenses/by/4.0/).
Share and Cite
Wang, D.D.; Li, Y.; Nguyen, X.-M.T.; Song, R.J.; Ho, Y.-L.; Hu, F.B.; Willett, W.C.; Wilson, P.W.F.; Cho, K.; Gaziano, J.M.; et al. Dietary Sodium and Potassium Intake and Risk of Non-Fatal Cardiovascular Diseases: The Million Veteran Program. Nutrients 2022, 14, 1121. https://0-doi-org.brum.beds.ac.uk/10.3390/nu14051121
Wang DD, Li Y, Nguyen X-MT, Song RJ, Ho Y-L, Hu FB, Willett WC, Wilson PWF, Cho K, Gaziano JM, et al. Dietary Sodium and Potassium Intake and Risk of Non-Fatal Cardiovascular Diseases: The Million Veteran Program. Nutrients. 2022; 14(5):1121. https://0-doi-org.brum.beds.ac.uk/10.3390/nu14051121
Chicago/Turabian StyleWang, Dong D., Yanping Li, Xuan-Mai T. Nguyen, Rebecca J. Song, Yuk-Lam Ho, Frank B. Hu, Walter C. Willett, Peter W. F. Wilson, Kelly Cho, J. Michael Gaziano, and et al. 2022. "Dietary Sodium and Potassium Intake and Risk of Non-Fatal Cardiovascular Diseases: The Million Veteran Program" Nutrients 14, no. 5: 1121. https://0-doi-org.brum.beds.ac.uk/10.3390/nu14051121