
Chicory: Understanding the Effects and Effectors of This Functional Food

 , , , , , , , , , and
Abstract
:
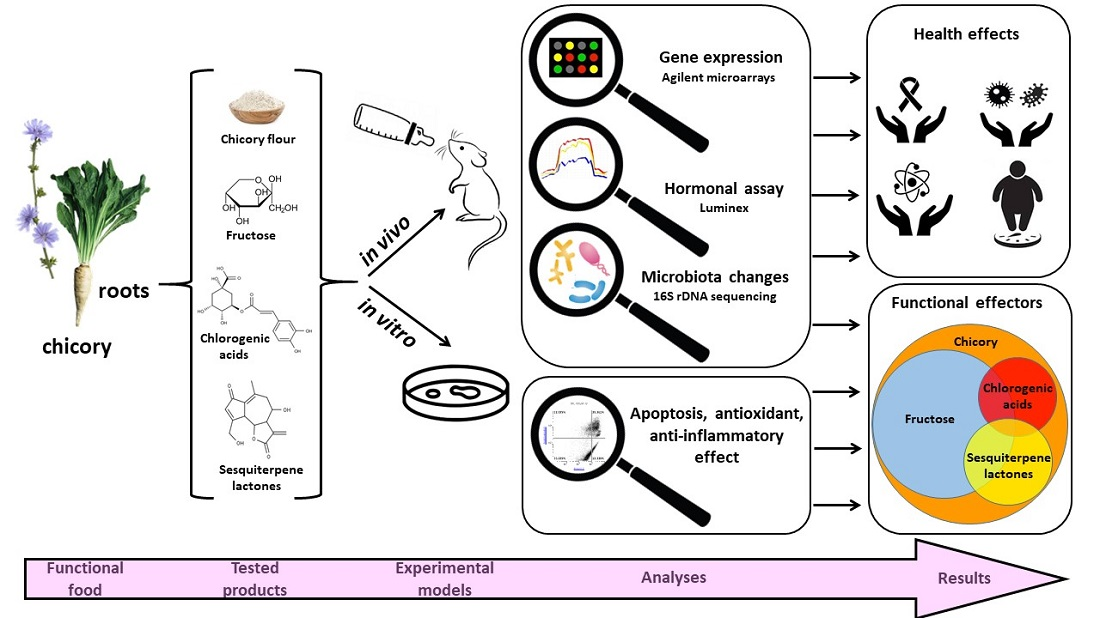
1. Introduction
2. Materials and Methods
- Chicory product obtaining and chemical analysis of their composition
- Animal experiments and ethical statements
2.1. RNA Extraction and Microarray Analysis
2.2. In Vivo Hormone Detection
2.3. Microbiota Analysis
2.4. In Vitro Cytotoxicity Studies
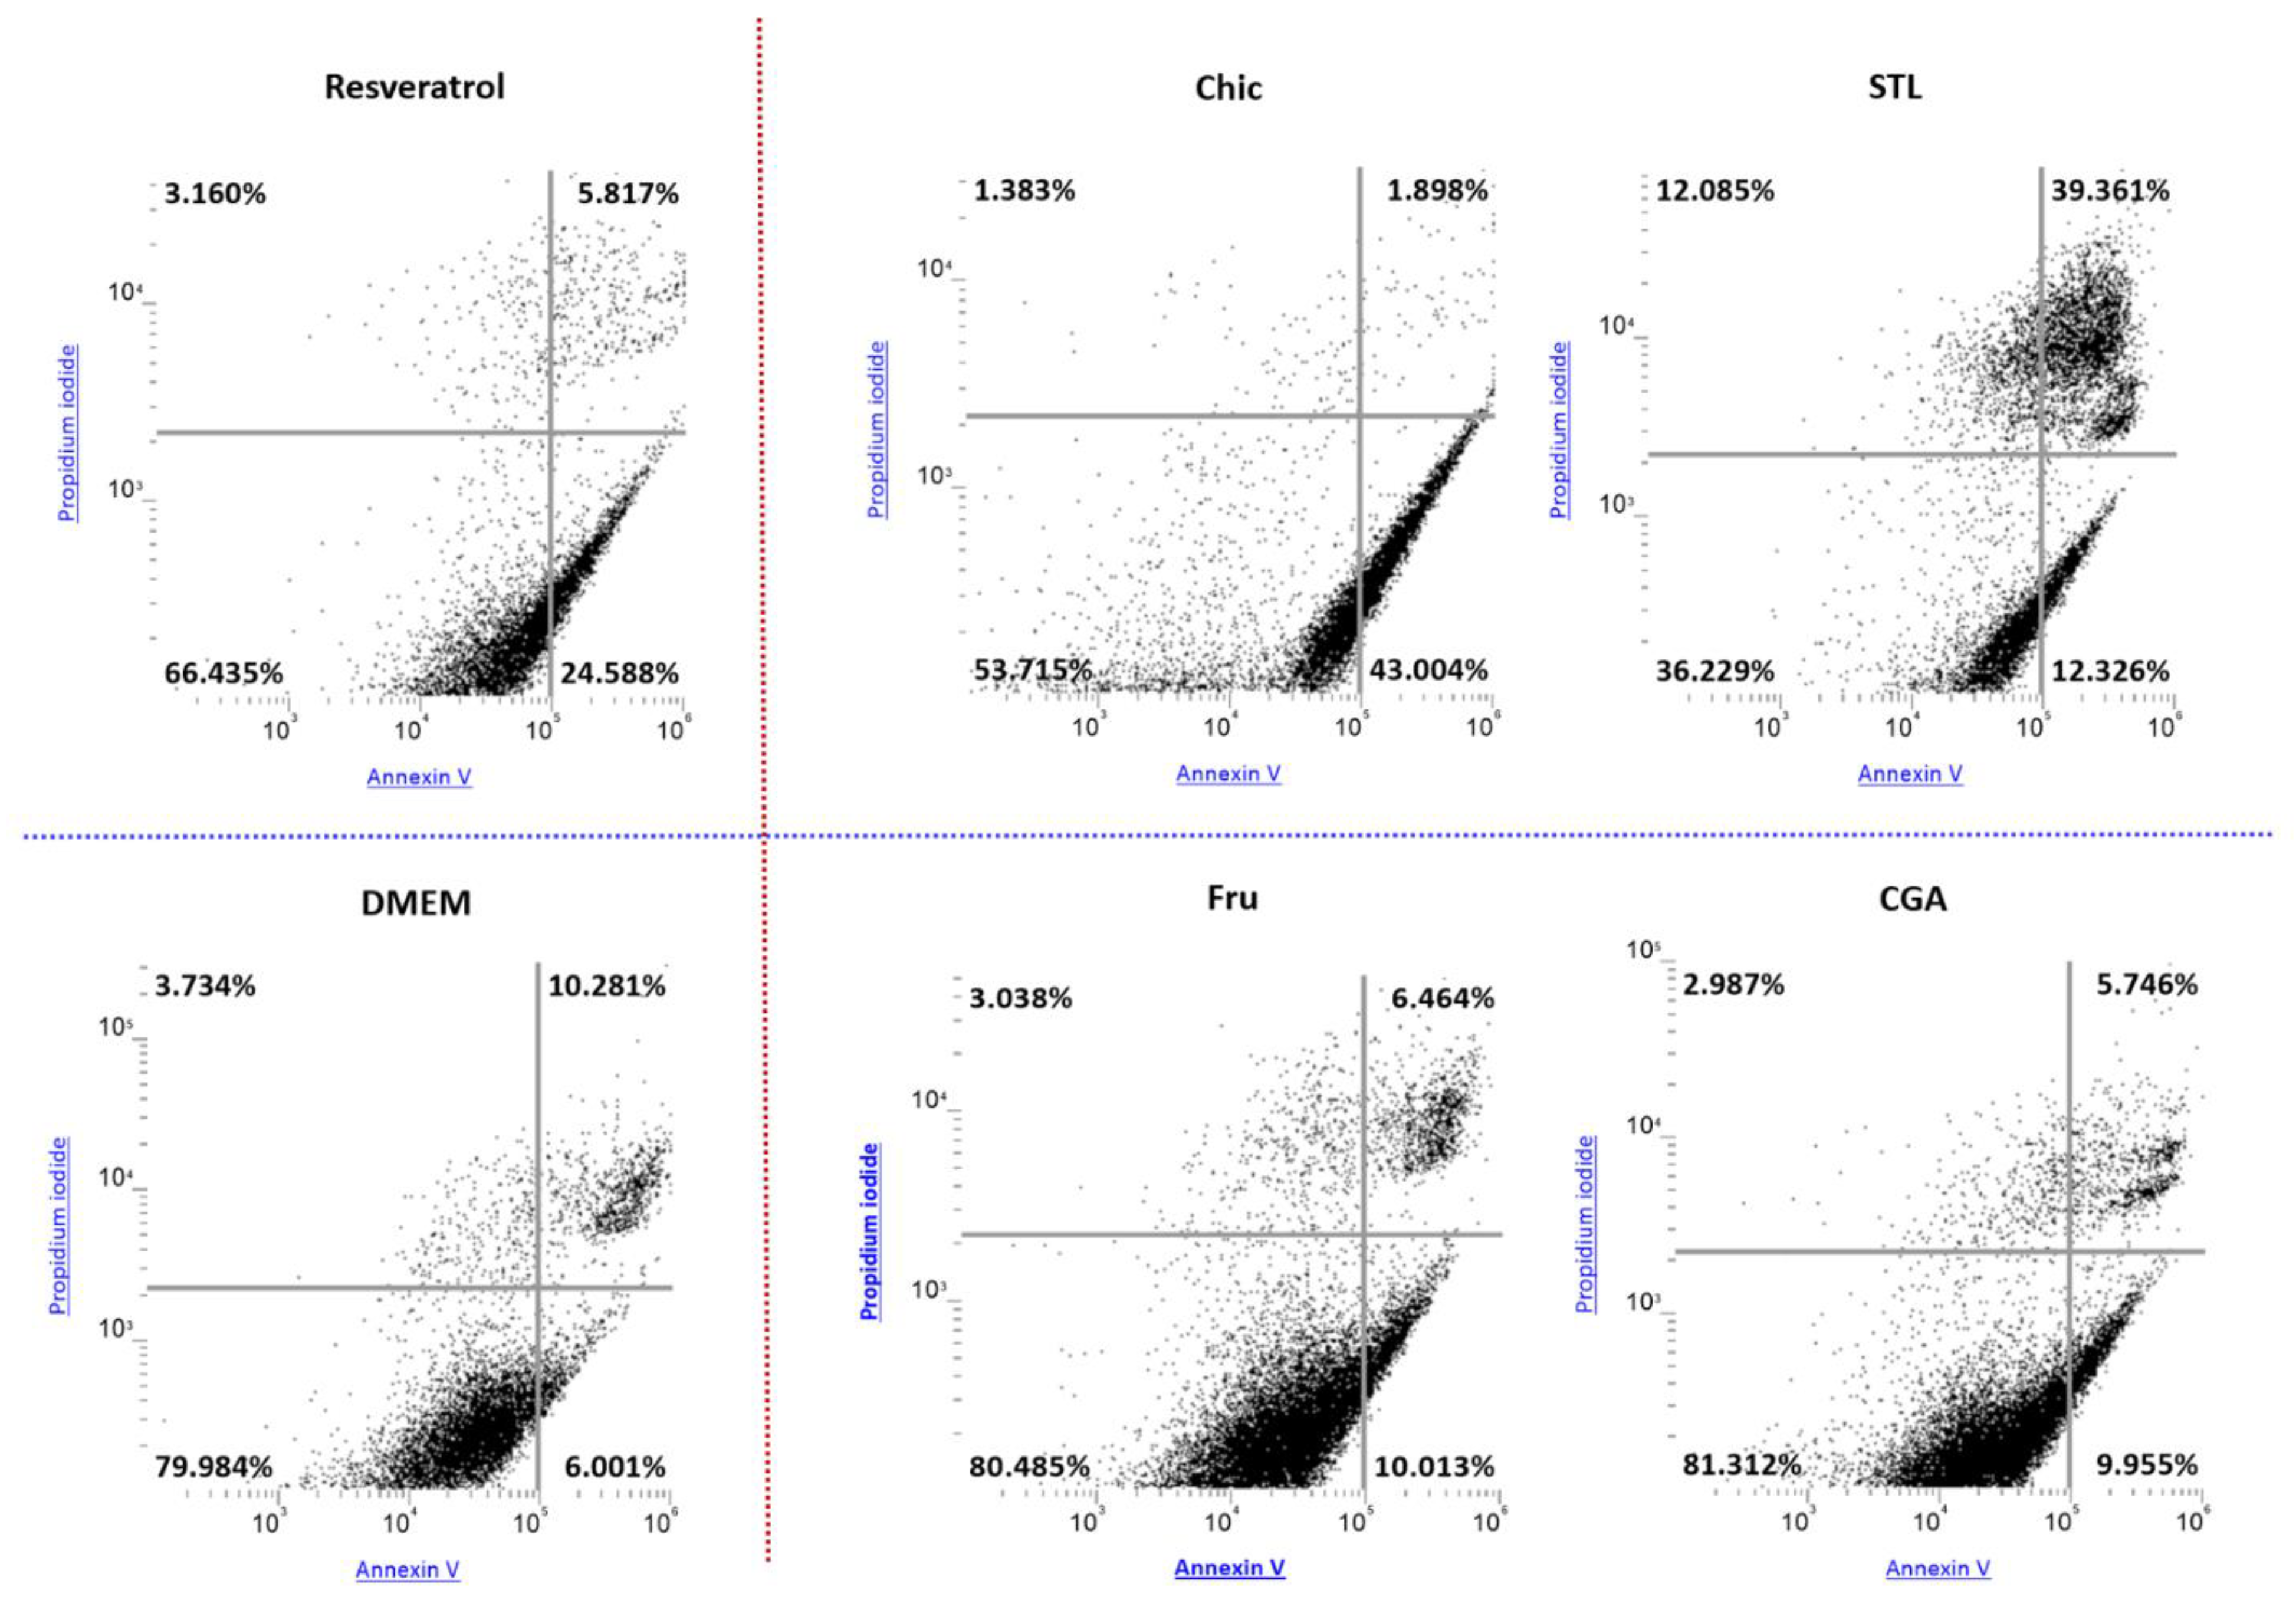
2.5. In Vitro Apoptosis Assay
2.6. In Vitro Inflammatory Cytokines Secretion Assay
2.7. Cell-Free Systems Evaluating Antioxidative Sample Effects
3. Results
3.1. Composition of Chicory Products
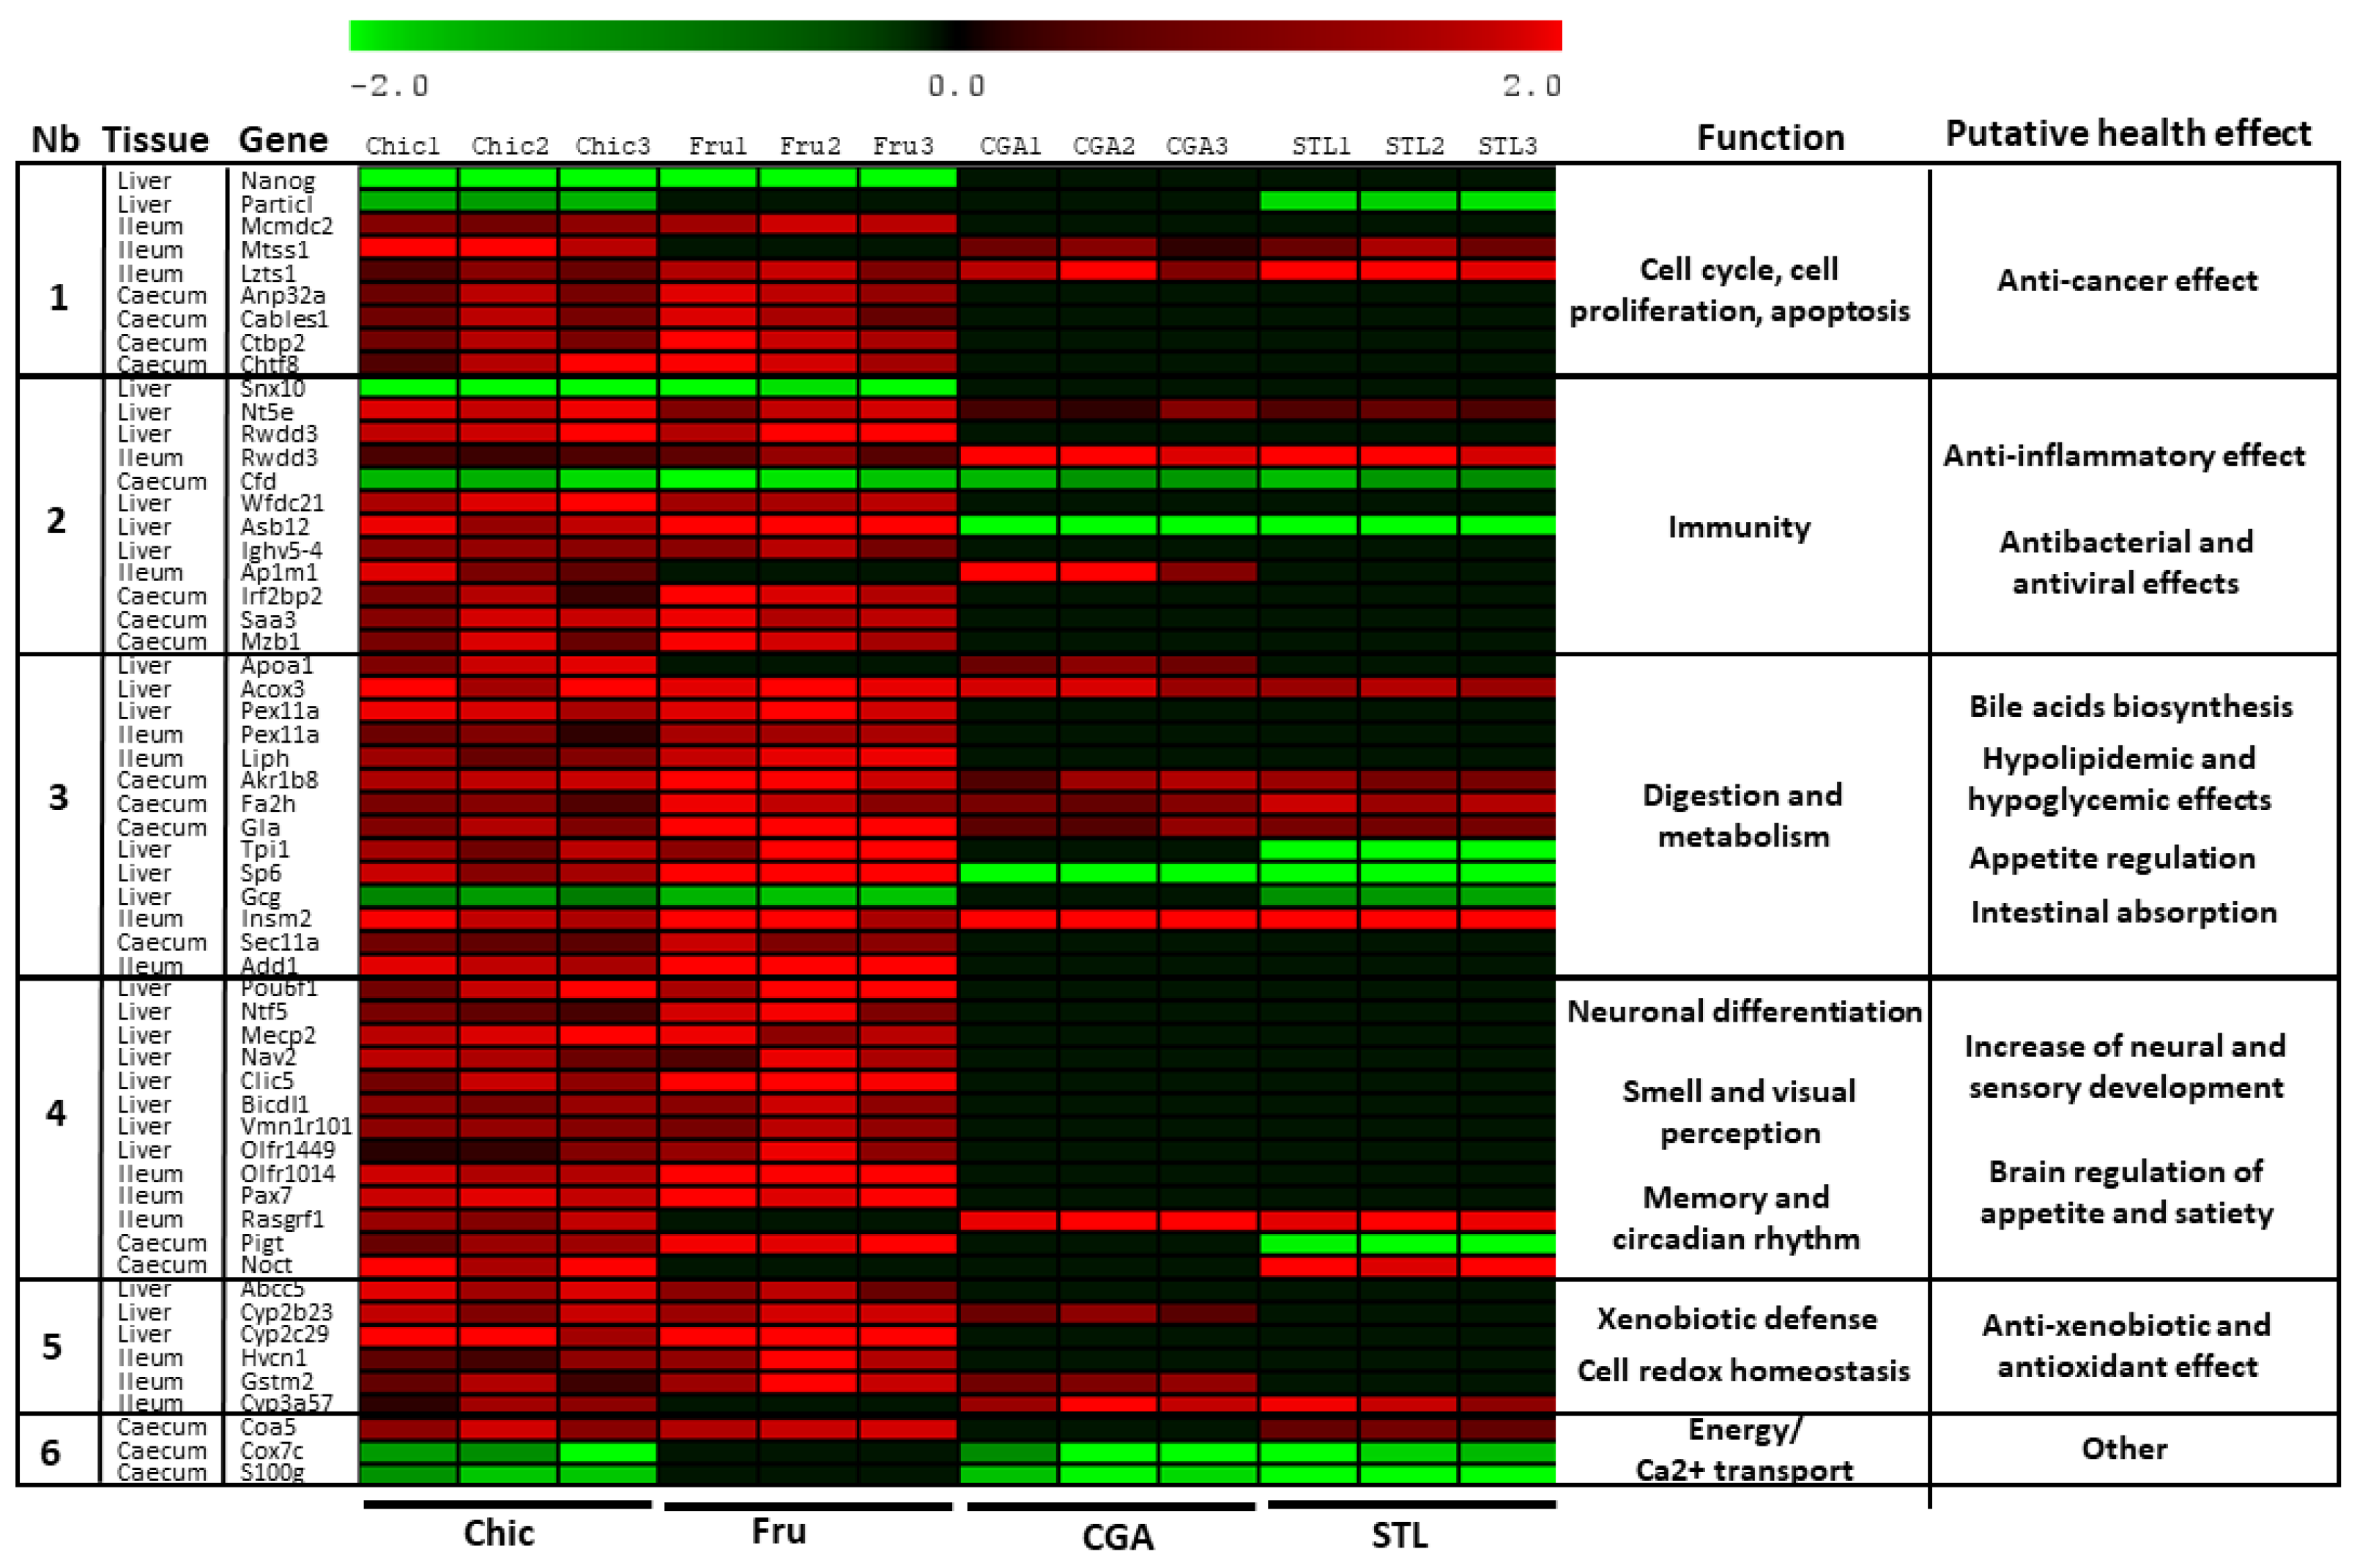
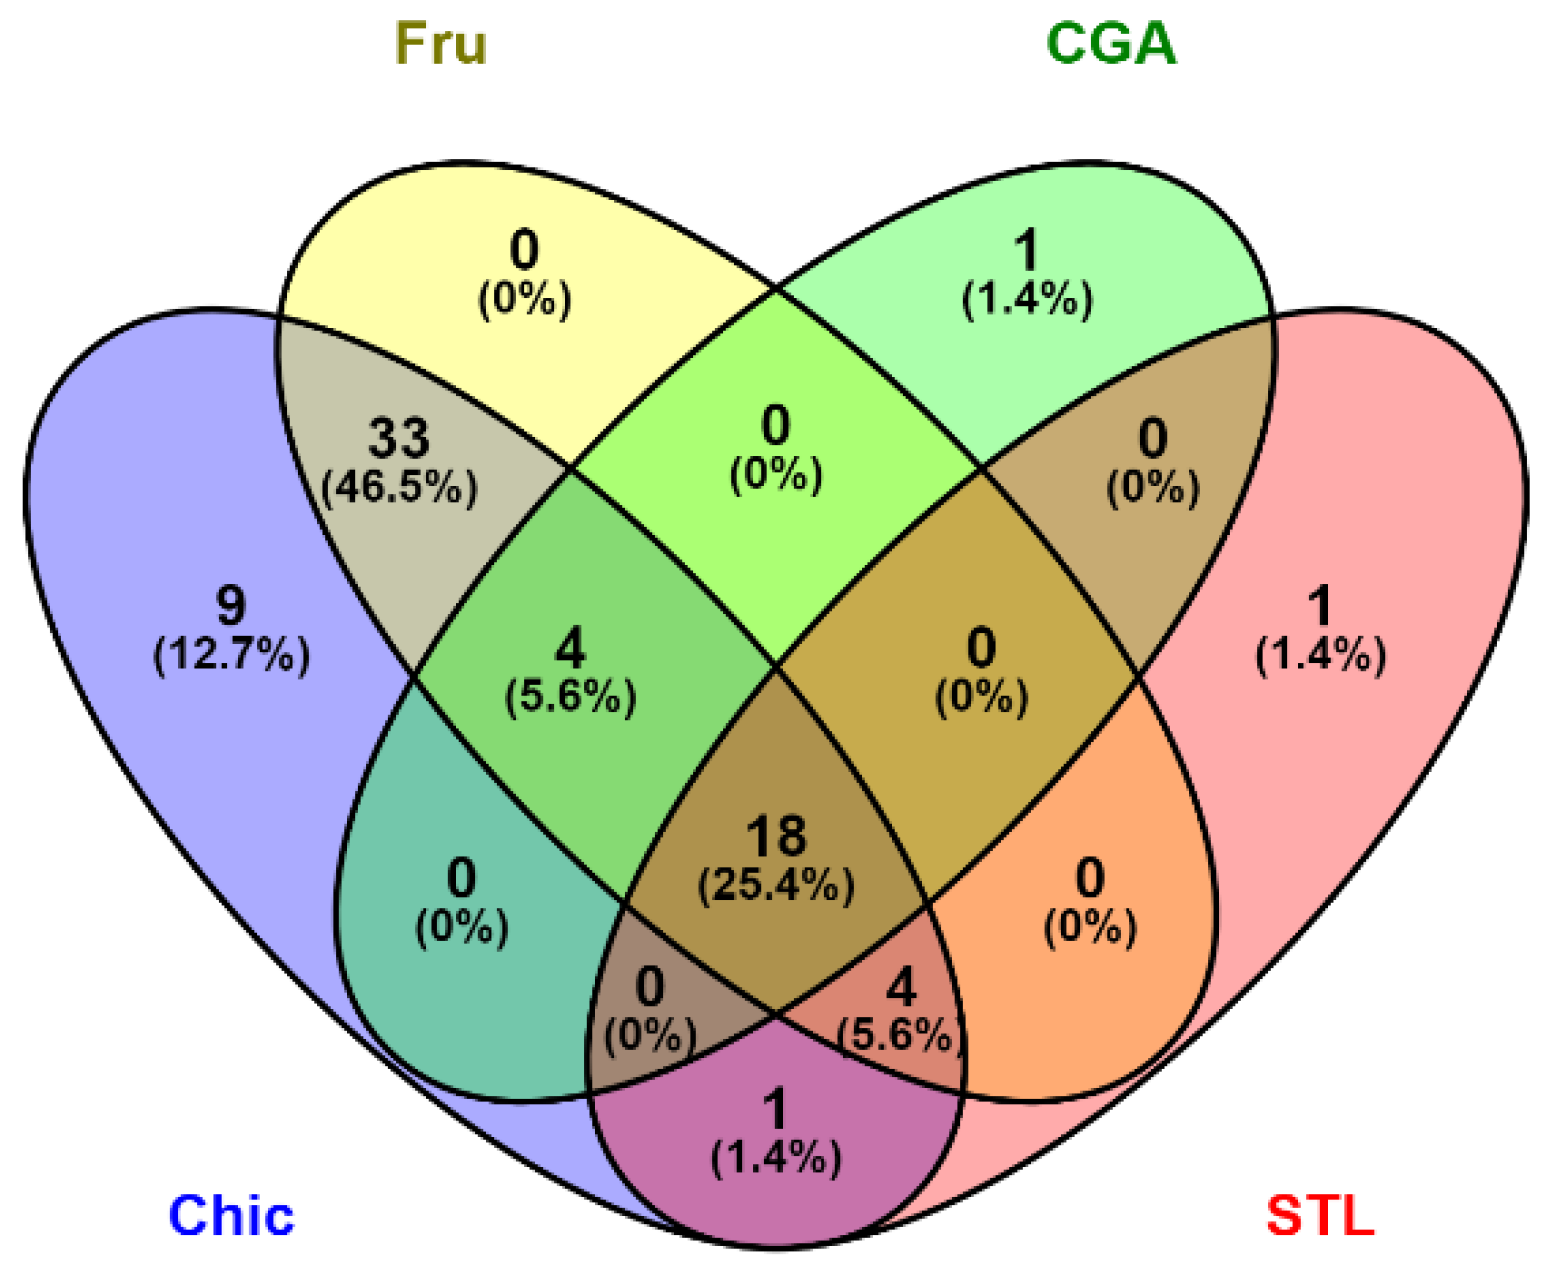
3.2. Nutrigenomic Analyses
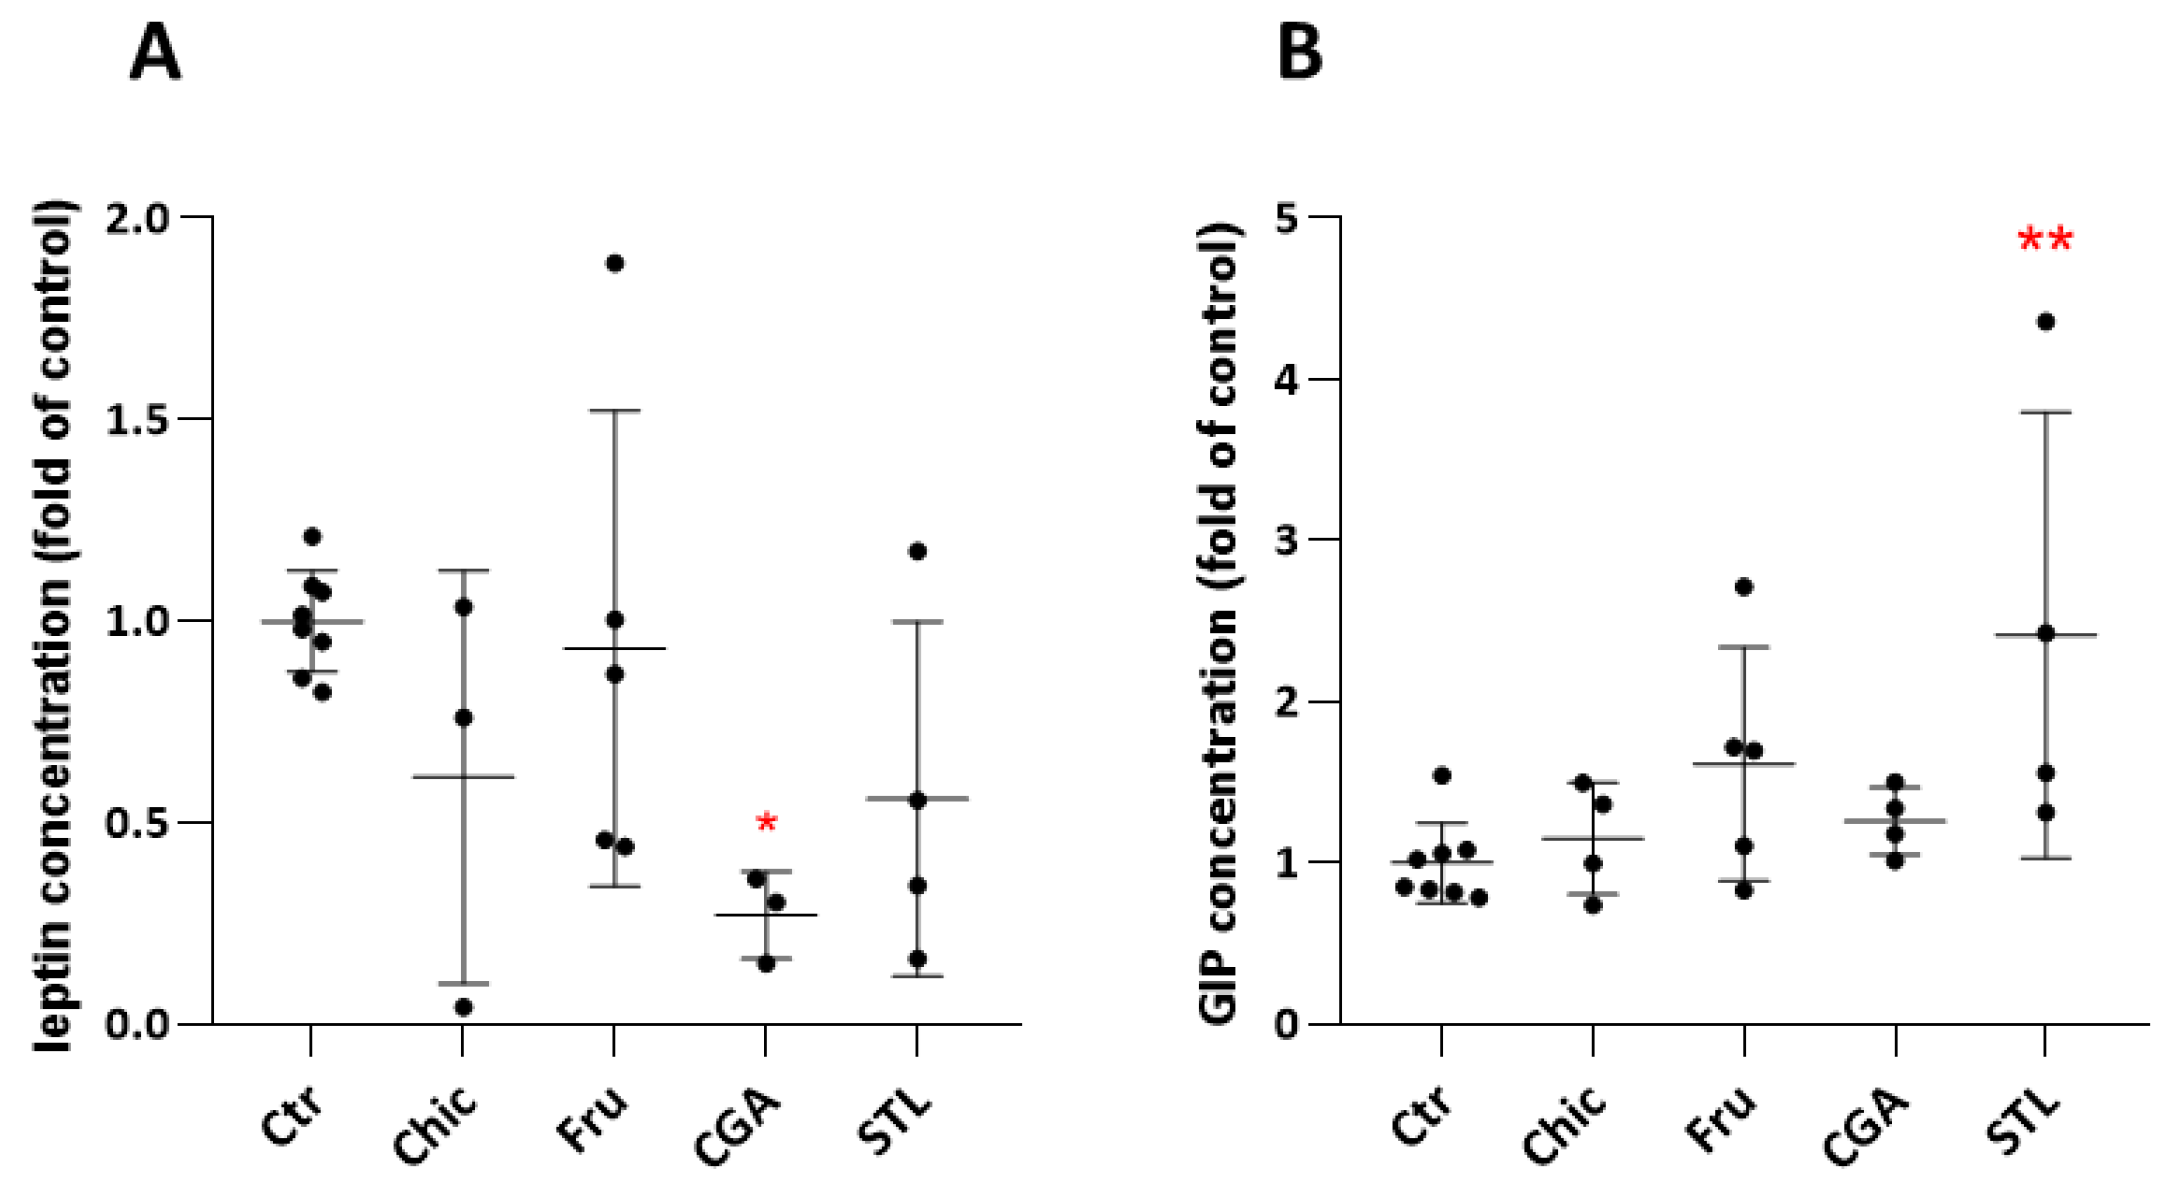
3.3. In Vivo Hormonal Assays
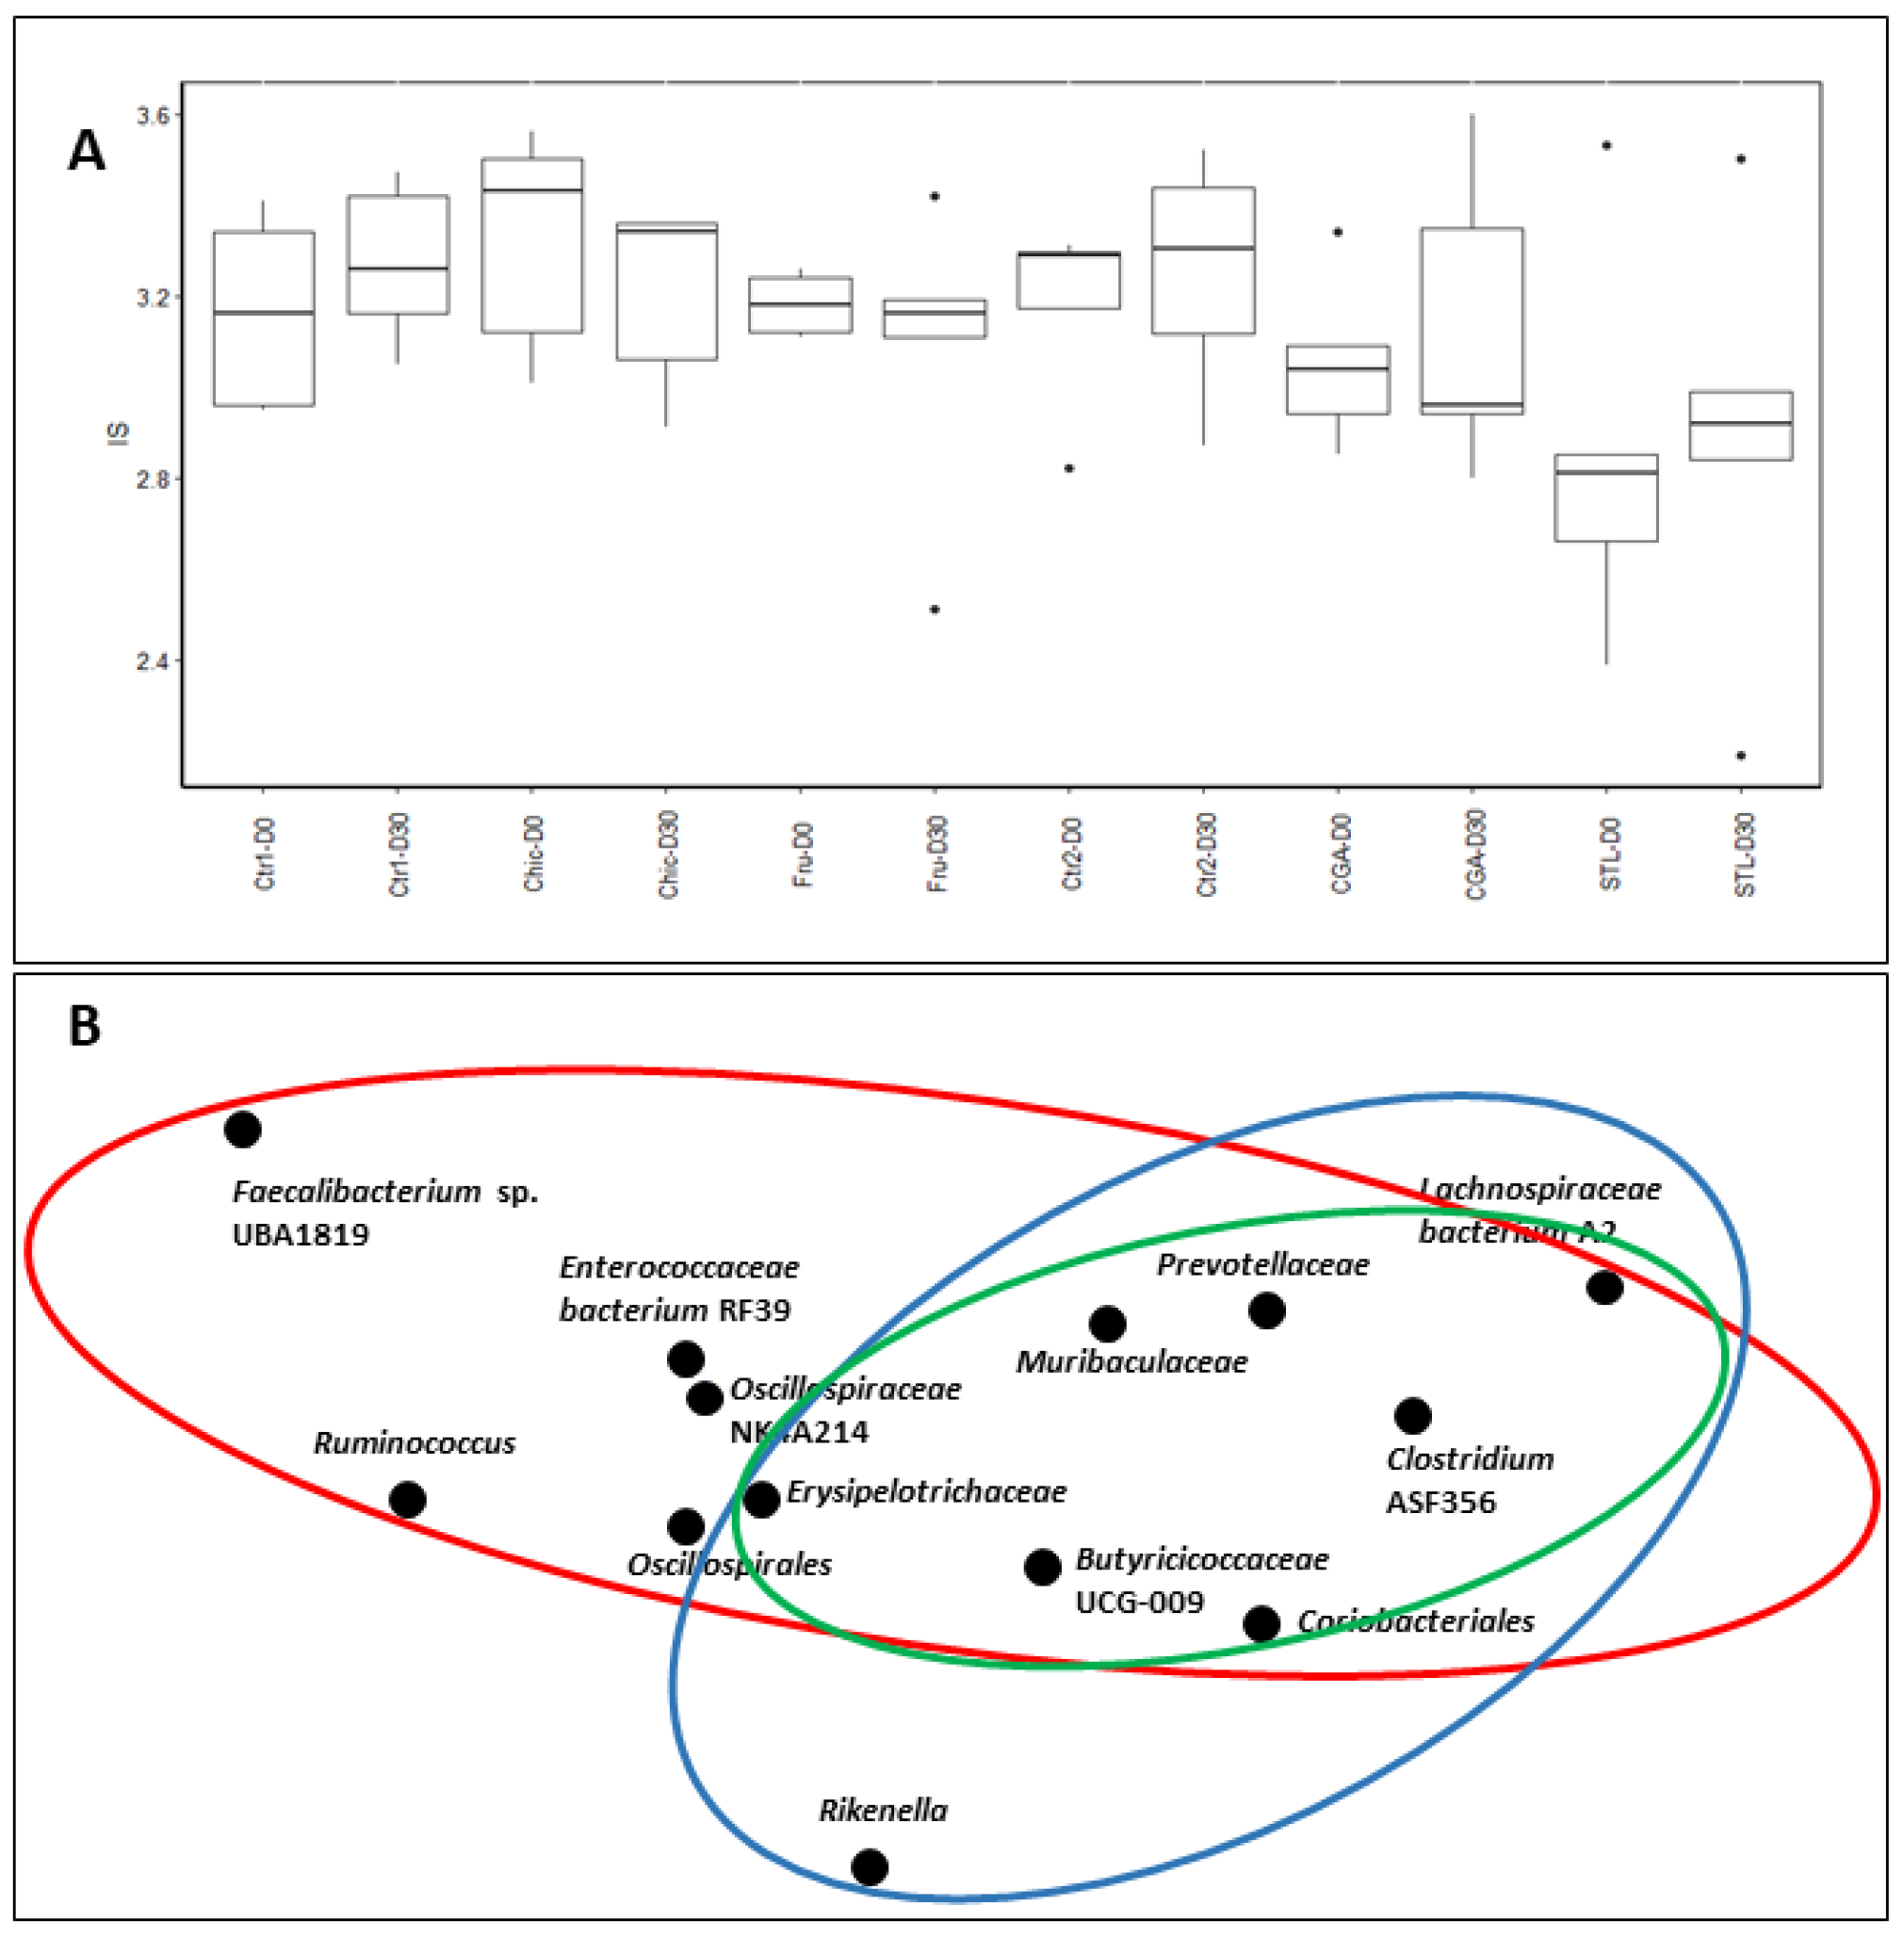
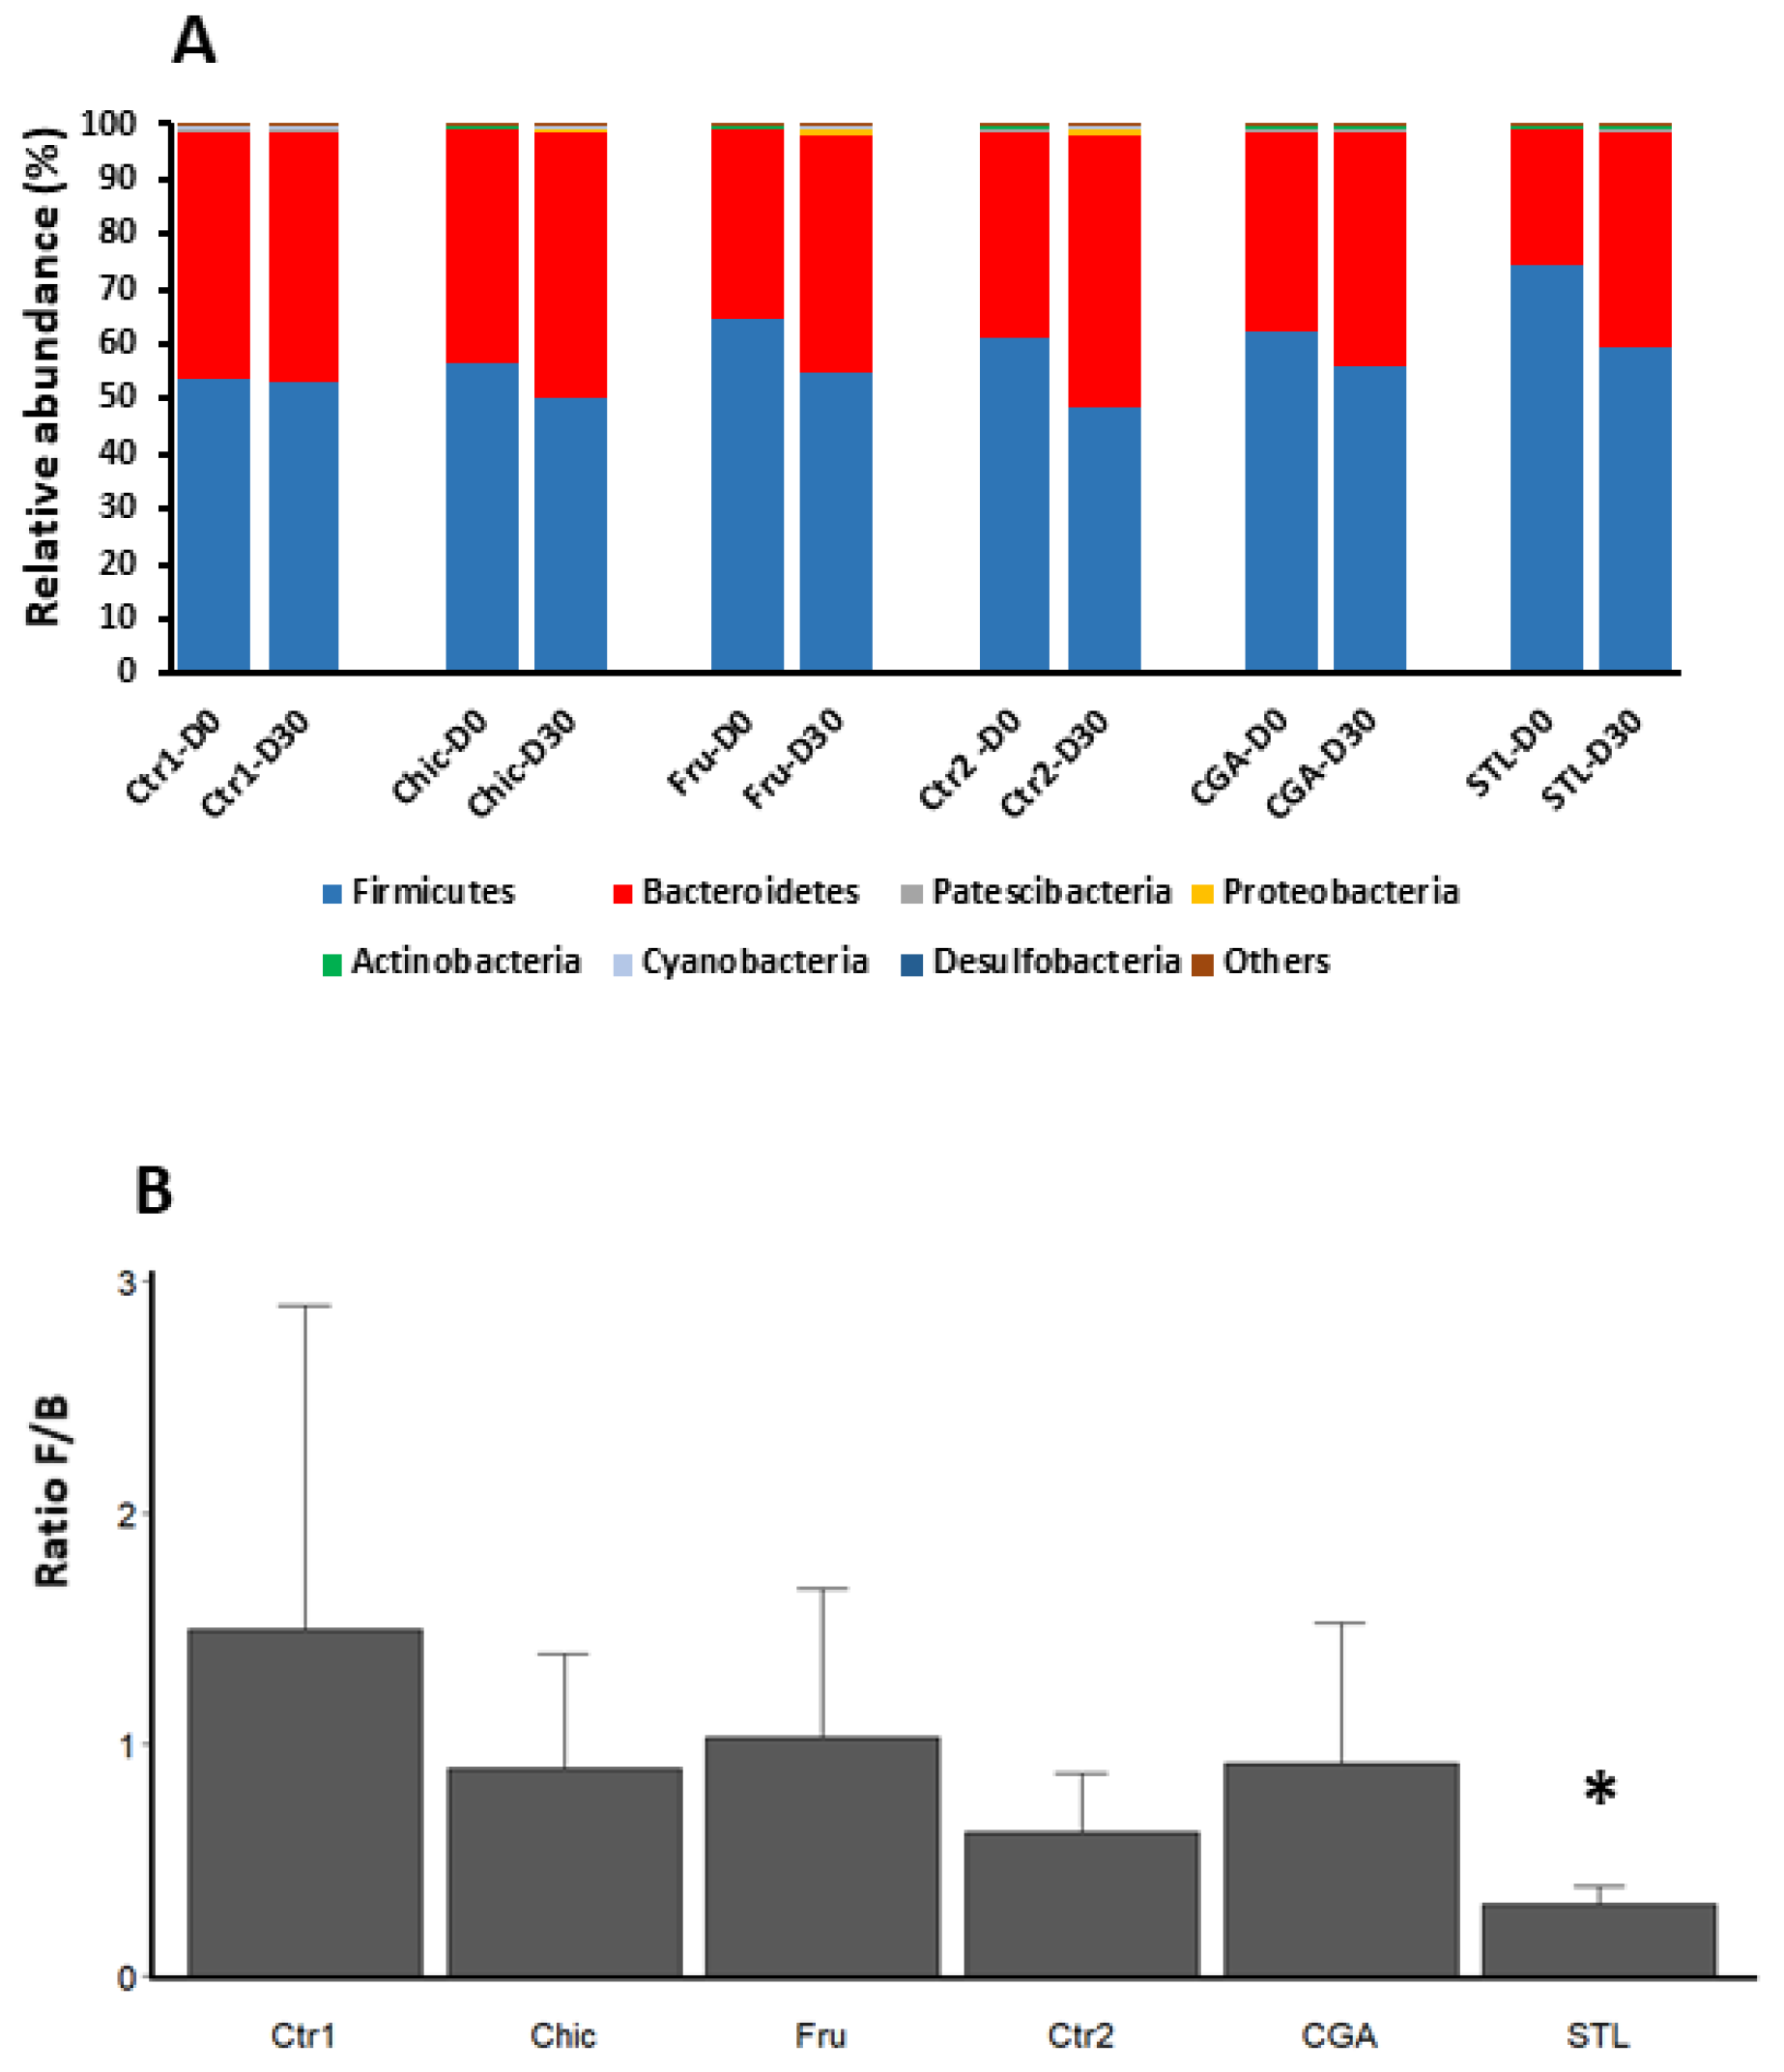
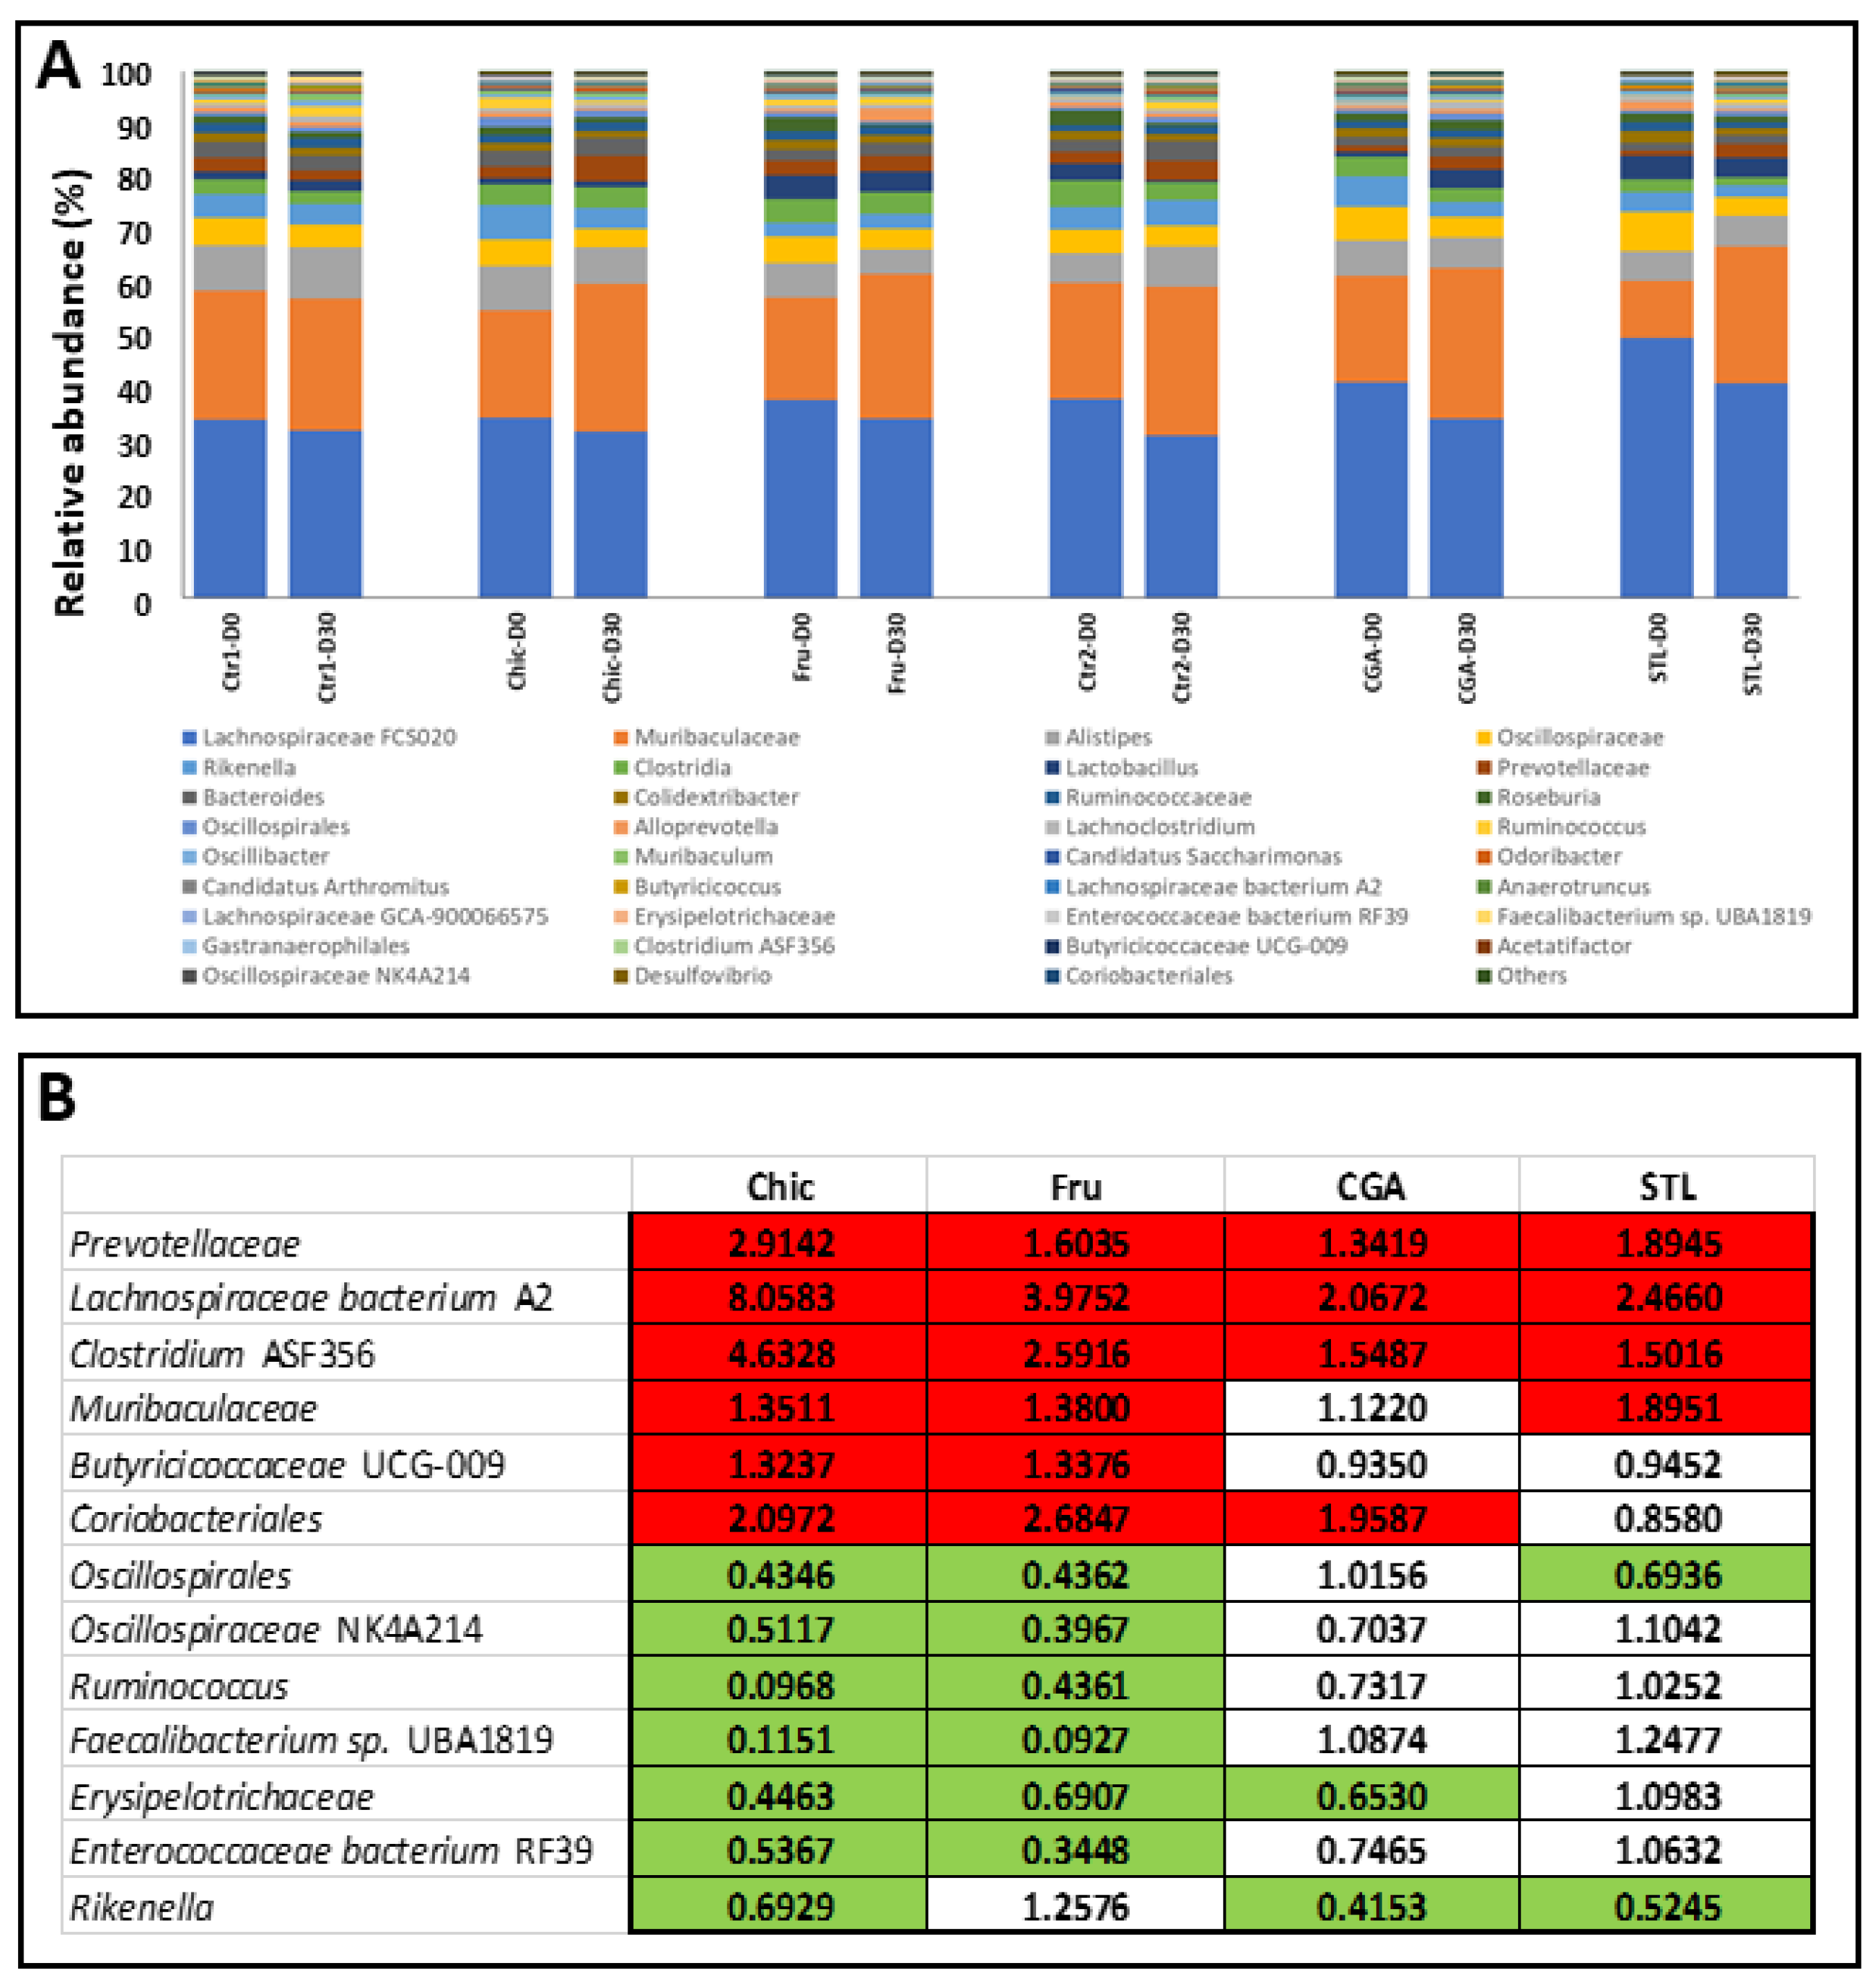
3.4. Metagenetic Analysis of Mice Microbiota
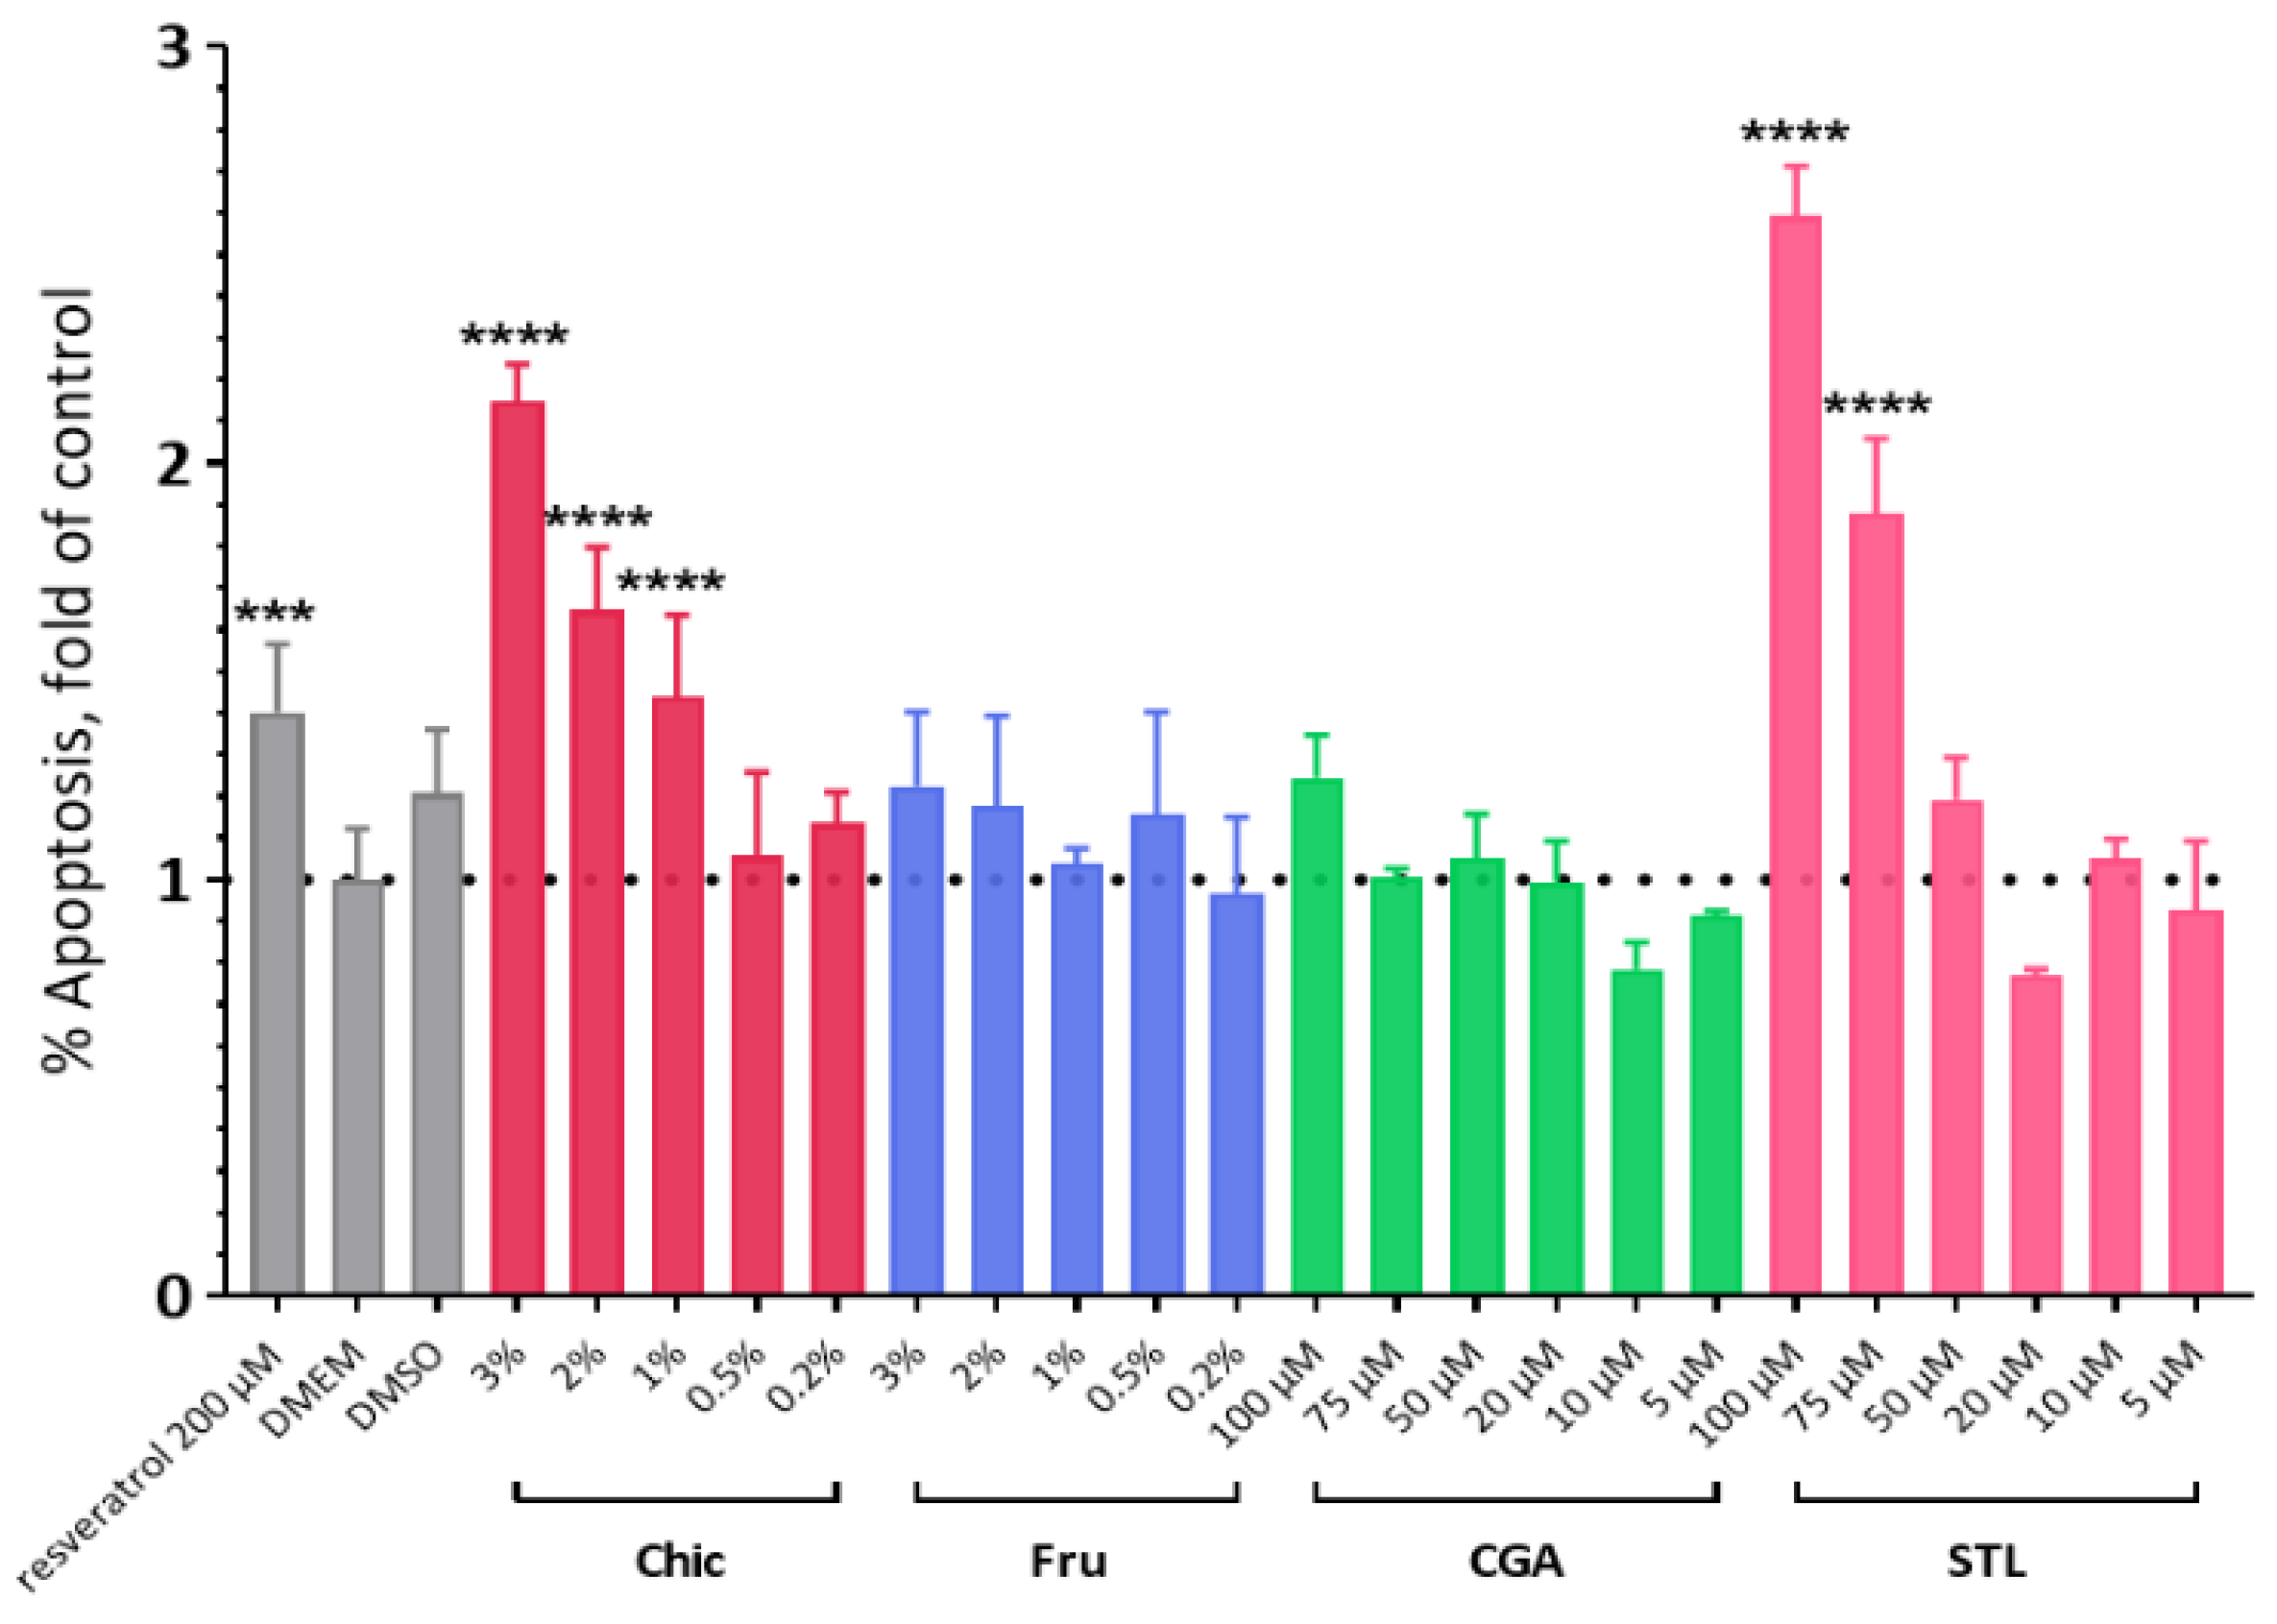
3.5. In Vitro Evaluation of the Apoptotic Effect
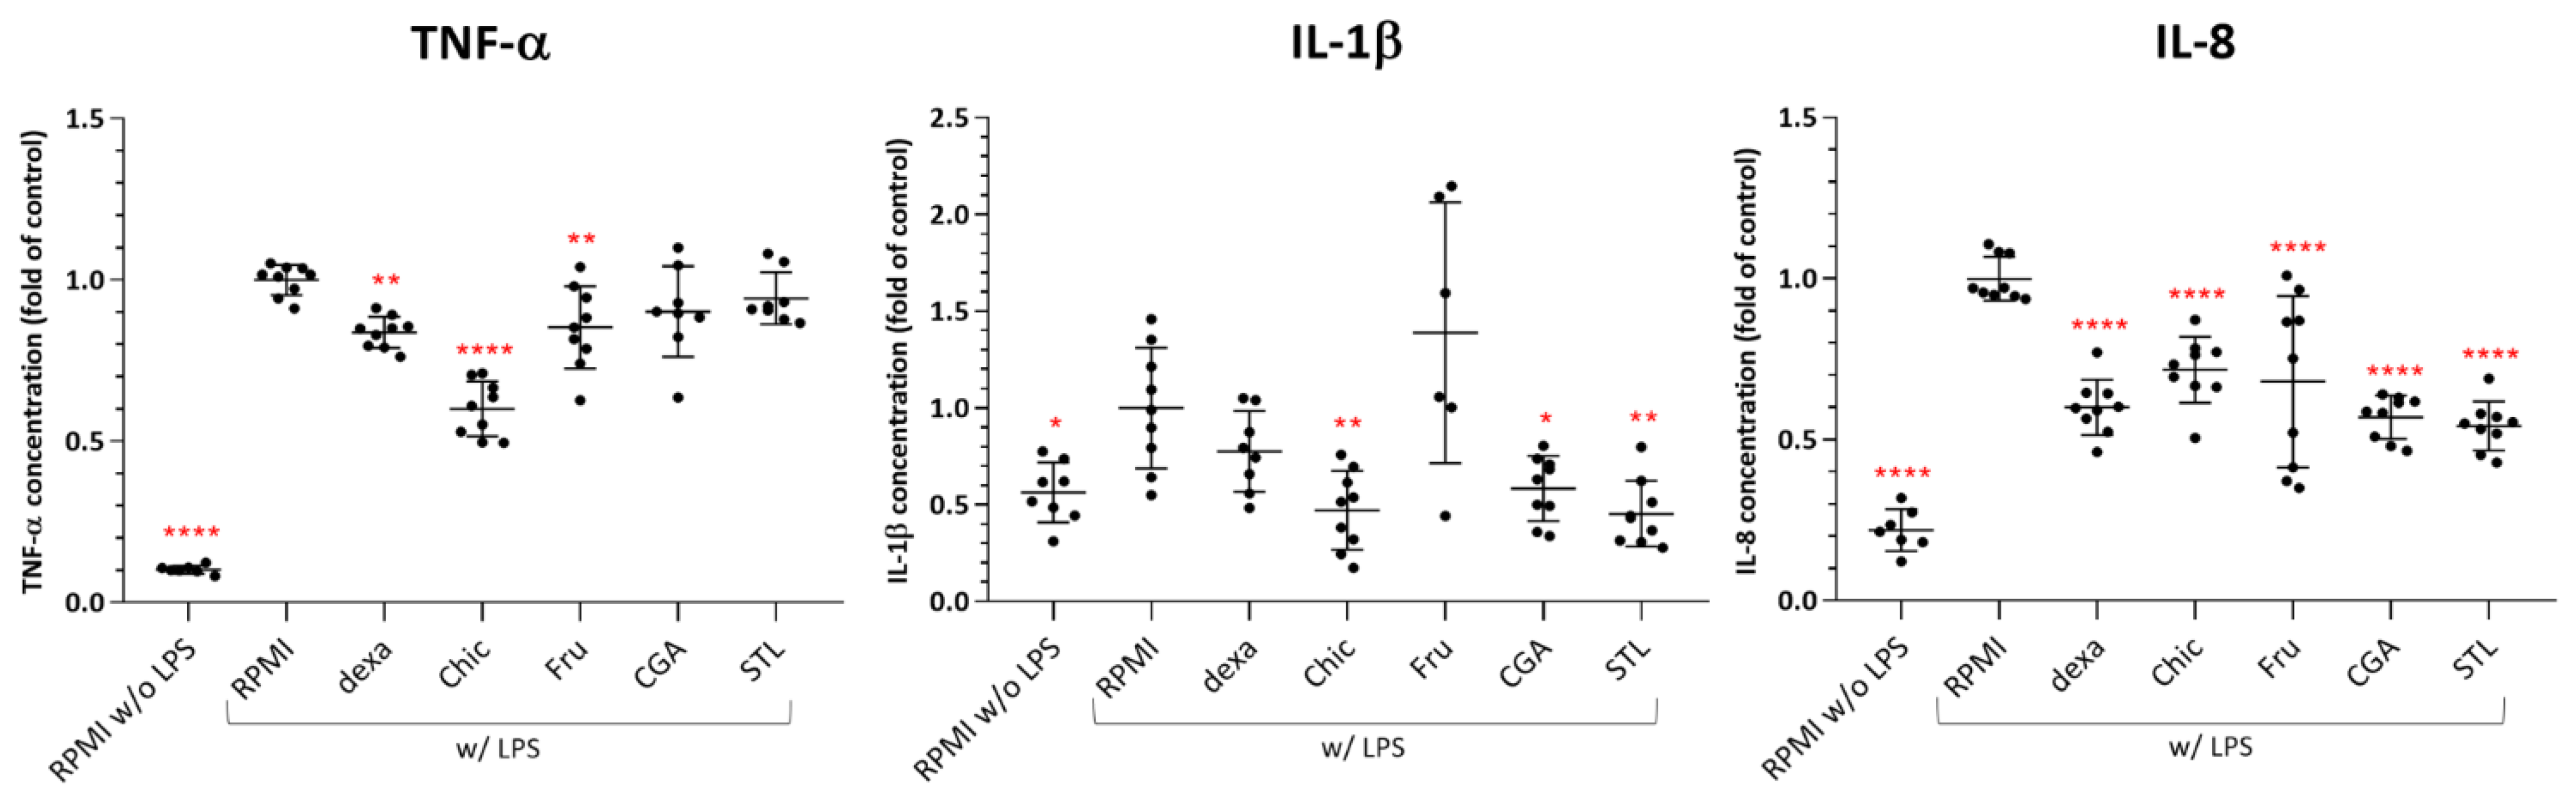
3.6. In Vitro Anti-Inflammatory Effect
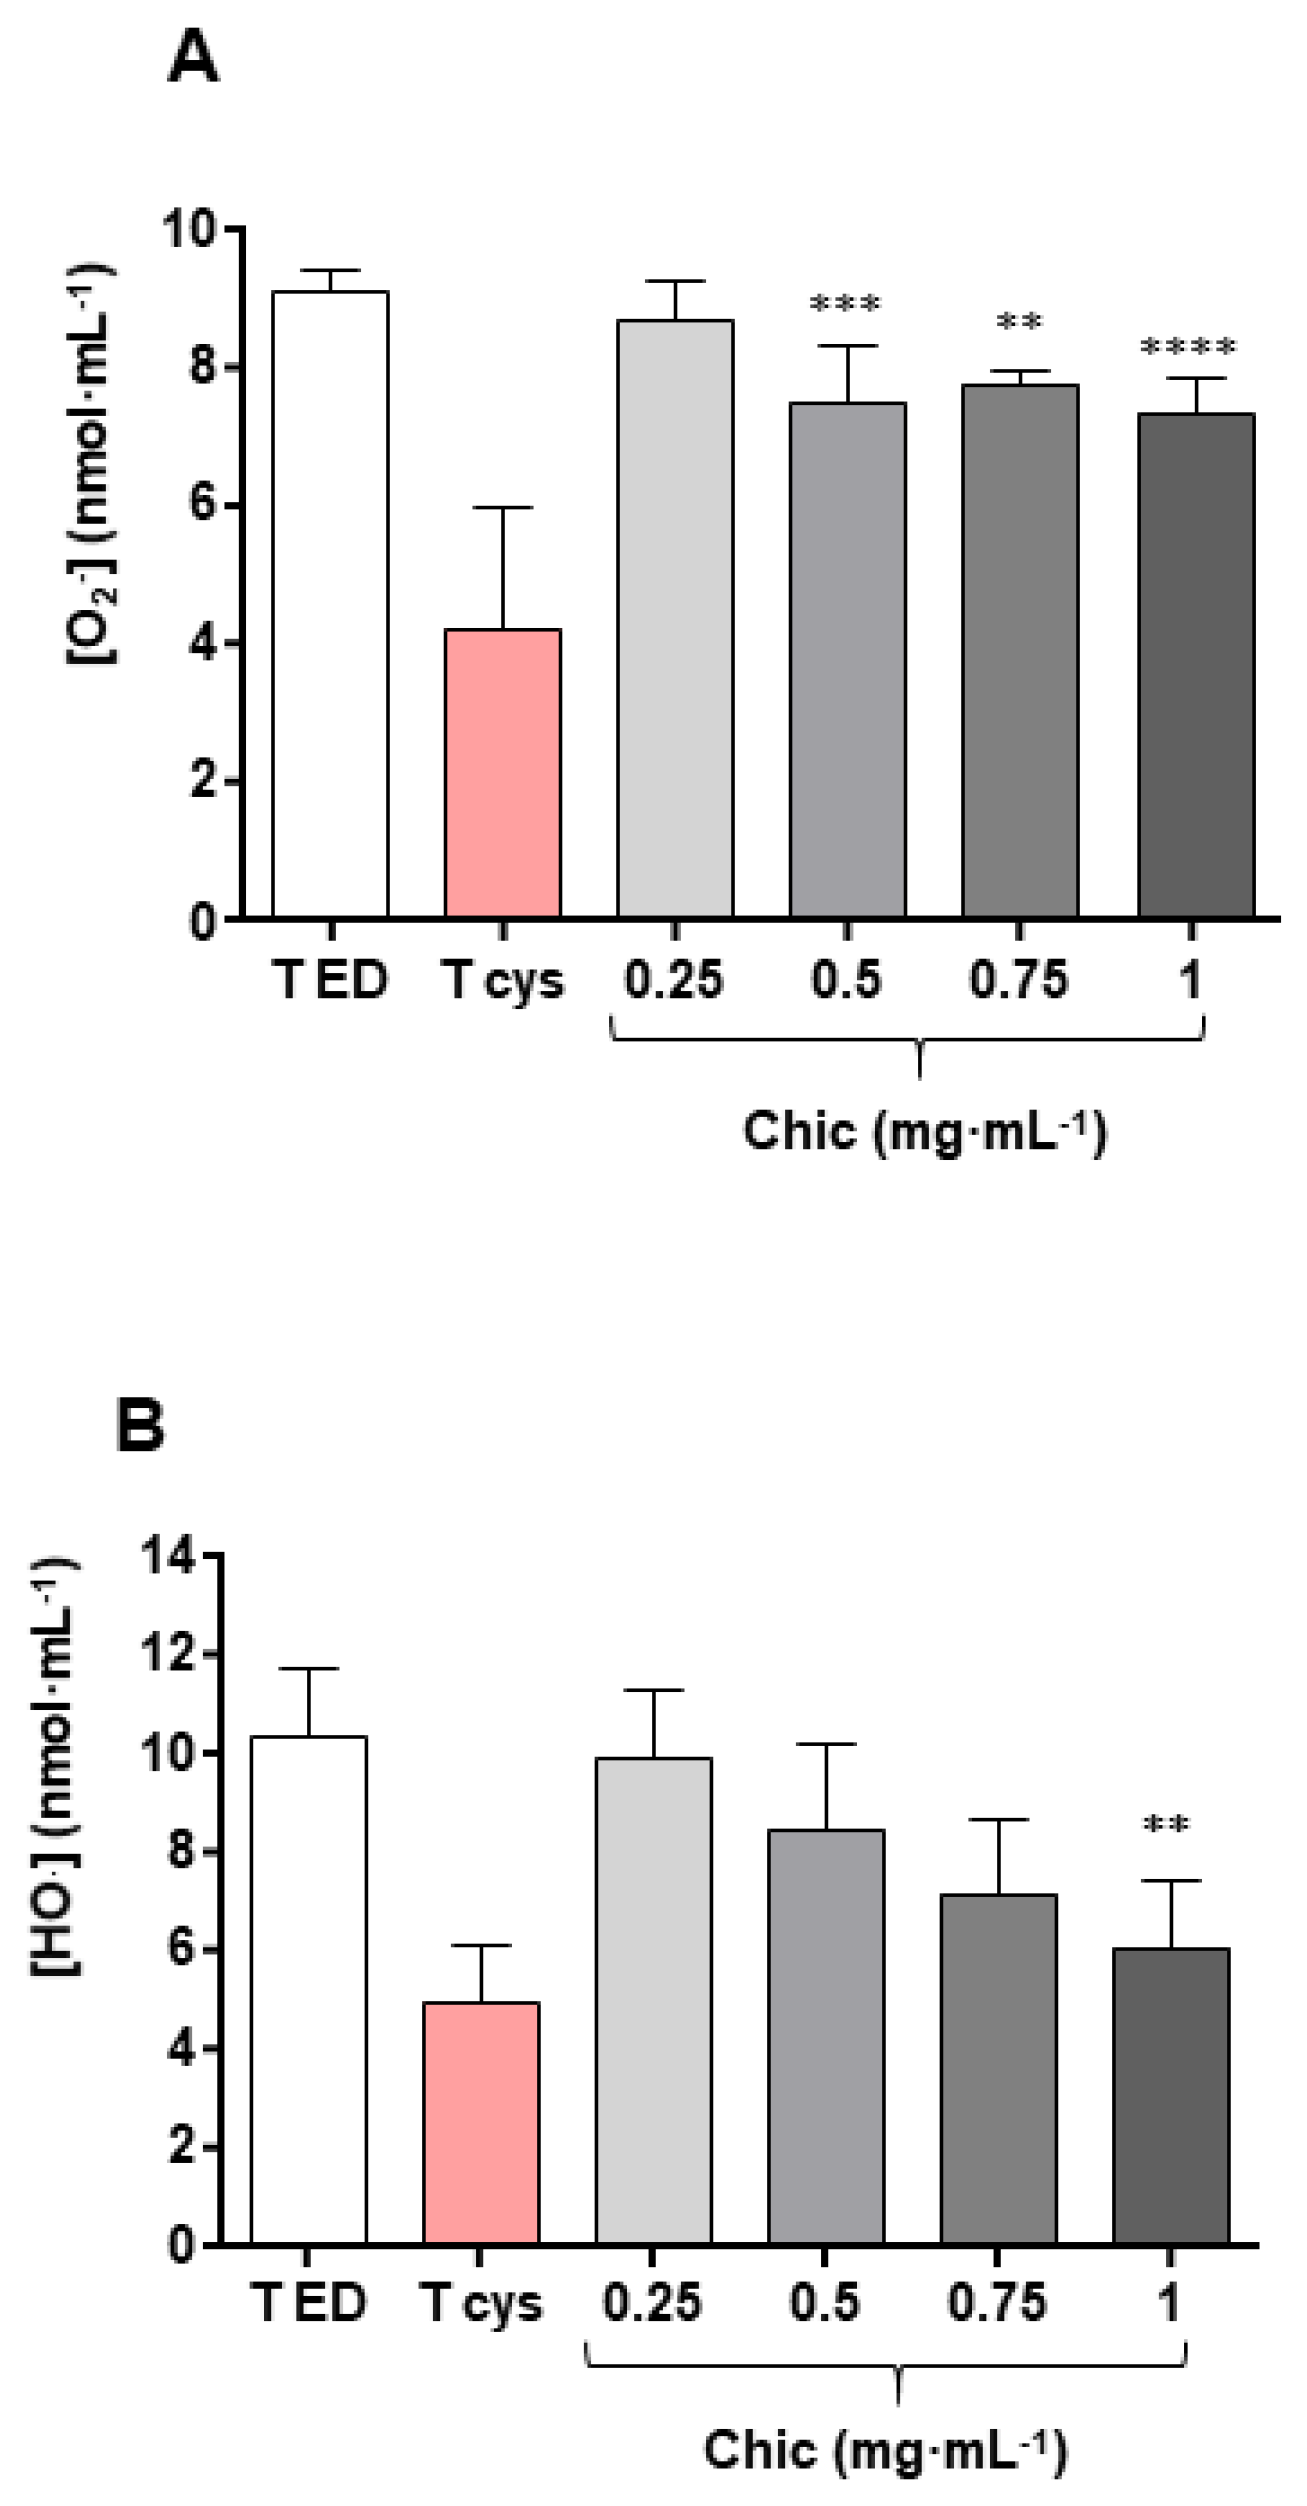
3.7. In Vitro Antioxidant Effect
4. Discussion
4.1. The Anti-Cancer Effect of the Chicory Roots as Observed in an In Vivo Murine and In Vitro Human Cell Models
4.2. The Anti-Inflammatory Effect as Observed in an In Vivo Murine and In Vitro Human Cell Models
4.3. Antibacterial and Antiviral Effect as Observed in an In Vivo Murine Model
4.4. Hypolipidemic and Hypoglycemic Effects, Appetite Regulation and Intestinal Absorption as Observed in an In Vivo Murine Model
4.5. Neural and Sensory Development as Observed in an In Vivo Murine Model
4.6. Anti-Xenobiotic and Antioxidant Effect as Observed in Both In Vivo Murine and In Vitro Cell-Free Models
4.7. Microbiota Modifications
5. Conclusions
Supplementary Materials
Author Contributions
Funding
Institutional Review Board Statement
Informed Consent Statement
Data Availability Statement
Conflicts of Interest
References
- Perović, J.; Tumbas Šaponjac, V.; Kojić, J.; Krulj, J.; Moreno, D.A.; García-Viguera, C.; Bodroža-Solarov, M.; Ilić, N. Chicory (Cichorium intybus L.) as a food ingredient—Nutritional composition, bioactivity, safety, and health claims: A review. Food Chem. 2021, 336, 127676. [Google Scholar] [CrossRef] [PubMed]
- Pouille, C.L.; Jegou, D.; Dugardin, C.; Cudennec, B.; Ravallec, R.; Hance, P.; Rambaud, C.; Hilbert, J.L.; Lucau-Danila, A. Chicory root flour—A functional food with potential multiple health benefits evaluated in a mice model. J. Funct. Foods 2020, 74, 104174. [Google Scholar] [CrossRef]
- Reimer, R.A.; Soto-Vaca, A.; Nicolucci, A.C.; Mayengbam, S.; Park, H.; Madsen, K.L.; Menon, R.; Vaughan, E.E. Effect of chicory inulin-type fructan–containing snack bars on the human gut microbiota in low dietary fiber consumers in a randomized crossover trial. Am. J. Clin. Nutr. 2020, 111, 1286–1296. [Google Scholar] [CrossRef]
- EFSA Panel on Nutrition, Novel Foods and Food Allergens (NDA). Frutalose®, a mixture of fructans obtained from enzymatic hydrolysis of chicory inulin, and normal defecation: Evaluation of a health claim pursuant to Article 13 of Regulation (EC) No 1924/2006. EFSA J. 2021, 19, e06775. [Google Scholar] [CrossRef]
- Ferrare, K.; Bidel, L.P.; Awwad, A.; Poucheret, P.; Cazals, G.; Lazennec, F.; Azay-Milhau, J.; Tournier, M.; Lajoix, A.D.; Tousch, D. Increase in insulin sensitivity by the association of chicoric acid and chlorogenic acid contained in a natural chicoric acid extract (NCRAE) of chicory (Cichorium intybus L.) for an antidiabetic effect. J. Ethnopharmacol. 2018, 215, 241–248. [Google Scholar] [CrossRef] [PubMed] [Green Version]
- Epure, A.; Pârvu, A.E.; Vlase, L.; Benedec, D.; Hanganu, D.; Gheldiu, A.M.; Toma, V.A.; Oniga, I. Phytochemical profile, antioxidant, cardioprotective and nephroprotective activity of romanian chicory extract. Plants 2021, 10, 64. [Google Scholar] [CrossRef] [PubMed]
- Bernard, G.; Alves Dos Santos, H.A.D.; Etienne, A.; Samaillie, J.; Neut, C.; Sahpaz, S.; Hilbert, J.L.; Gagneul, D.; Jullian, N.; Tahrioui, A.; et al. MeJA elicitation of chicory hairy roots promotes efficient increase of 3,5-diCQA accumulation, a potent antioxidant and antibacterial molecule. Antibiotics 2020, 9, 659. [Google Scholar] [CrossRef]
- Peña-Espinoza, M.; Williams, A.R.; Thamsborg, S.M.; Simonsen, H.T.; Enemark, H.L. Anthelmintic effects of forage chicory (Cichorium intybus) against free-living and parasitic stages of Cooperia oncophora. Vet. Parasitol. 2017, 243, 204–207. [Google Scholar] [CrossRef] [Green Version]
- Peña-Espinoza, M.; Valente, A.H.; Bornancin, L.; Simonsen, H.T.; Thamsborg, S.M.; Williams, A.R.; López-Muñoz, R. Anthelmintic and metabolomic analyses of chicory (Cichorium intybus) identify an industrial by-product with potent in vitro antinematodal activity. Vet. Parasitol. 2020, 280, 109088. [Google Scholar] [CrossRef]
- Valente, A.H.; de Roode, M.; Ernst, M.; Peña-Espinoza, M.; Bornancin, L.; Bonde, C.S.; Martínez-Valladares, M.; Ramünke, S.; Krücken, J.; Simonsen, H.T.; et al. Identification of compounds responsible for the anthelmintic effects of chicory (Cichorium intybus) by molecular networking and bio-guided fractionation. Int. J. Parasitol. Drugs Drug Resist. 2021, 15, 105–114. [Google Scholar] [CrossRef]
- Karadeniz, F.; Oh, J.H.; Kong, C.-S. Sesquiterpene lactones: A review of biological activities. J. Life Sci. 2021, 31, 430–441. [Google Scholar] [CrossRef]
- Matos, M.S.; Anastácio, J.D.; Santos, C.N.D. Sesquiterpene lactones: Promising natural compounds to fight inflammation. Pharmaceutics 2021, 13, 991. [Google Scholar] [CrossRef]
- Abbas, Z.K.; Saggu, S.; Sakeran, M.I.; Zidan, N.; Rehman, H.; Ansari, A.A. Phytochemical, antioxidant and mineral composition of hydroalcoholic extract of chicory (Cichorium intybus L.) leaves. Saudi J. Biol. Sci. 2015, 22, 322–326. [Google Scholar] [CrossRef] [PubMed] [Green Version]
- Hoste, H.; Jackson, F.; Athanasiadou, S.; Thamsborg, S.M.; Hoskin, S.O. The effects of tannin-rich plants on parasitic nematodes in ruminants. Trends Parasitol. 2006, 22, 253–261. [Google Scholar] [CrossRef] [PubMed]
- Tchoumtchoua, J.; Mathiron, D.; Pontarin, N.; Gagneul, D.; van Bohemen, A.-I.; Otogo N’nang, E.; Mesnard, F.; Petit, E.; Fontaine, J.-X.; Molinié, R.; et al. Phenolic profiling of flax highlights contrasting patterns in winter and spring varieties. Molecules 2019, 24, 4303. [Google Scholar] [CrossRef] [PubMed] [Green Version]
- Deborde, C.; Fontaine, J.-X.; Jacob, D.; Botana, A.; Nicaise, V.; Richard-Forget, F.; Lecomte, S.; Decourtil, C.; Hamade, K.; Mesnard, F.; et al. Optimizing 1D 1H-NMR profiling of plant samples for high throughput analysis: Extract preparation, standardization, automation and spectra processing. Metabolomics 2019, 15, 28. [Google Scholar] [CrossRef] [PubMed] [Green Version]
- Jacob, D.; Deborde, C.; Lefebvre, M.; Maucourt, M.; Moing, A. NMRProcFlow: A graphical and interactive tool dedicated to 1D spectra processing for NMR-based metabolomics. Metabolomics 2017, 13, 36. [Google Scholar] [CrossRef] [PubMed] [Green Version]
- Fouré, M.; Dugardin, C.; Foligné, B.; Hance, P.; Cadalen, T.; Delcourt, A.; Taminiau, B.; Daube, G.; Ravallec, R.; Cudennec, B.; et al. Chicory roots for prebiotics and appetite regulation: A pilot study in mice. J. Agric. Food Chem. 2018, 66, 6439–6449. [Google Scholar] [CrossRef] [Green Version]
- Willeman, H. Contribution à la Recherche des Composés Impliqués dans L’amertume de la Racine de Chicorée: Approches Métabolomique et Sensorielle de L’influence de la Torréfaction. Ph.D. Thesis, University of Lille, Lille, France, 2016. Available online: https://www.theses.fr/2016LIL10222 (accessed on 21 January 2022).
- Obafemi, C.A.; Sulaimon, T.O.; Akinpelu, D.A.; Olugbade, T.A. Antimicrobial activity of extracts and a germacranolidetype sesquiterpene lactone from Tithonia diversifolia leaf extract. Afr. J. Biotechnol. 2006, 5, 1254–1258. [Google Scholar] [CrossRef]
- Passos, C.P.; Costa, R.M.; Ferreira, S.S.; Lopes, G.R.; Cruz, M.T.; Coimbra, M.A. Role of coffee caffeine and chlorogenic acids adsorption to polysaccharides with impact on brew immunomodulation effects. Foods 2021, 10, 378. [Google Scholar] [CrossRef]
- Rognes, T.; Flouri, T.; Nichols, B.; Quince, C.; Mahé, F. VSEARCH: A versatile open source tool for metagenomics. Peer J. 2016, 4, e2584. [Google Scholar] [CrossRef] [PubMed]
- Gérard, A.; El-Hajjaji, S.; Burteau, S.; Fall, P.A.; Pirard, B.; Taminiau, B.; Daube, G.; Sindic, M. Study of the microbial diversity of a panel of Belgian artisanal cheeses associated with challenge studies for Listeria monocytogenes. Food Microbiol. 2021, 100, 103861. [Google Scholar] [CrossRef] [PubMed]
- Ma, X.; Tian, X.; Huang, X.; Yan, F.; Qiao, D. Resveratrol-induced mitochondrial dysfunction and apoptosis are associated with Ca2+ and mCICR-mediated MPT activation in HepG2 cells. Mol. Cell. Biochem. 2007, 302, 99–109. [Google Scholar] [CrossRef] [PubMed]
- Aruoma, O.I.; Halliwell, B.; Hoey, B.M.; Butler, J. The antioxidant action of N-acetylcysteine: Its reaction with hydrogen peroxide, hydroxyl radical, superoxide, and hypochlorous acid. Free Radical Biol. Med. 1989, 6, 593–597. [Google Scholar] [CrossRef]
- Halliwell, B.; Gutteridge, J.M.; Aruoma, O.I. The deoxyribose method: A simple “test-tube” assay for determination of rate constants for reactions of hydroxyl radicals. Anal. Biochem. 1987, 165, 215–219. [Google Scholar] [CrossRef]
- Heurtier, V.; Owens, N.; Gonzalez, I.; Mueller, F.; Proux, C.; Mornico, D.; Clerc, P.; Dubois, A.; Navarro, P. The molecular logic of Nanog-induced self-renewal in mouse embryonic stem cells. Nat. Commun. 2019, 10, 1109. [Google Scholar] [CrossRef] [Green Version]
- Gong, S.; Li, Q.; Jeter, C.R.; Fan, Q.; Tang, D.G.; Liu, B. Regulation of NANOG in cancer cells. Mol. Carcinog. 2015, 54, 679–687. [Google Scholar] [CrossRef] [Green Version]
- Gawlik-Rzemieniewska, N.; Bednarek, I. The role of NANOG transcriptional factor in the development of malignant phenotype of cancer cells. Cancer Biol. Ther. 2016, 17, 1–10. [Google Scholar] [CrossRef] [Green Version]
- Santaliz-Ruiz, L.E.; Xie, X.; Old, M.; Teknos, T.N.; Pan, Q. Emerging role of nanog in tumorigenesis and cancer stem cells. Int. J. Cancer 2014, 135, 2741–2748. [Google Scholar] [CrossRef]
- O’Leary, V.B.; Ovsepian, S.V.; Smida, J.; Atkinson, M.J. PARTICLE–The RNA podium for genomic silencers. J. Cell. Physiol. 2019, 234, 19464–19470. [Google Scholar] [CrossRef]
- O’Leary, V.B.; Hain, S.; Maugg, D.; Smida, J.; Azimzadeh, O.; Tapio, S.; Ovsepian, S.V.; Atkinson, M.J. Long non-coding RNA PARTICLE bridges histone and DNA methylation. Sci. Rep. 2017, 7, 1790. [Google Scholar] [CrossRef] [PubMed] [Green Version]
- O’Leary, V.B.; Smida, J.; Buske, F.A.; Carrascosa, L.G.; Azimzadeh, O.; Maugg, D.; Hain, S.; Tapio, S.; Heidenreich, W.; Kerr, J.; et al. PARTICLE triplexes cluster in the tumor suppressor WWOX and may extend throughout the human genome. Sci. Rep. 2017, 7, 7163. [Google Scholar] [CrossRef] [PubMed] [Green Version]
- Delbridge, A.R.D.; Valente, L.J.; Strasser, A. The role of the apoptotic machinery in tumor suppression. Cold Spring Harbor Perspect. Biol. 2012, 4, a008789. [Google Scholar] [CrossRef] [PubMed]
- Finsterbusch, F.; Ravindranathan, R.; Dereli, I.; Stanzione, M.; Tränkner, D.; Tóth, A. Alignment of homologous chromosomes and effective repair of programmed DNA double-strand breaks during mouse meiosis require the minichromosome maintenance domain containing 2 (MCMDC2) protein. PLoS Genet. 2016, 12, e1006393. [Google Scholar] [CrossRef] [Green Version]
- Parr, C.; Jiang, W.G. Metastasis suppressor 1 (MTSS1) demonstrates prognostic value and anti-metastatic properties in breast cancer. Eur. J. Cancer 2009, 45, 1673–1683. [Google Scholar] [CrossRef] [PubMed]
- Du, P.; Ye, L.; Yang, Y.; Jiang, W.G. The tumour suppressive role of metastasis suppressor-1, MTSS1, in human kidney cancer, a possible connection with the SHH pathway. J. Exp. Ther. Oncol. 2012, 10, 91–99. [Google Scholar]
- Wang, X.X.; Liu, B.B.; Wu, X.; Su, D.; Zhu, Z.; Fu, L. Loss of leucine zipper putative tumor suppressor 1 (LZTS1) expression contributes to lymph node metastasis of breast invasive micropapillary carcinoma. Pathol. Oncol. Res. 2015, 21, 1021–1026. [Google Scholar] [CrossRef] [Green Version]
- Yan, W.; Bai, Z.; Wang, J.; Li, X.; Chi, B.; Chen, X. ANP32A modulates cell growth by regulating p38 and Akt activity in colorectal cancer. Oncol. Rep. 2017, 38, 1605–1612. [Google Scholar] [CrossRef] [Green Version]
- Shi, Z.; Li, Z.; Li, Z.J.; Cheng, K.; Du, Y.; Fu, H.; Khuri, F.R. Cables1 controls p21/Cip1 protein stability by antagonizing proteasome subunit alpha type 3. Oncogene 2015, 34, 2538–2545. [Google Scholar] [CrossRef] [Green Version]
- Murakami, T.; Takano, R.; Takeo, S.; Taniguchi, R.; Ogawa, K.; Ohashi, E.; Tsurimoto, T. Stable interaction between the human proliferating cell nuclear antigen loader complex Ctf18-replication factor C (RFC) and DNA polymerase ϵ is mediated by the cohesion-specific subunits, Ctf18, Dcc1, and Ctf8. J. Biol. Chem. 2010, 285, 34608–34615. [Google Scholar] [CrossRef] [Green Version]
- Saleem, M.; Abbas, K.; Naseer, F.; Ahmad, M.; Syed, N.H.; Javed, F.; Hussain, K.; Asima, S. Anticancer activity of n-hexane extract of Cichorium intybus on lymphoblastic leukemia cells (Jurkat cells). Afr. J. Plant Sci. 2014, 8, 315–319. [Google Scholar] [CrossRef] [Green Version]
- Mehrandish, R.; Awsat Mellati, A.; Rahimipour, A.; Dehghan Nayeri, N. Anti-cancer activity of methanol extracts of Cichorium intybus on human breast cancer SKBR3 cell line. Razavi Int. J. Med. 2016, 5, 1–4. [Google Scholar] [CrossRef]
- You, Y.; Zhou, C.; Li, D.; Cao, Z.L.; Shen, W.; Li, W.Z.; Zhang, S.; Hu, B.; Shen, X. Sorting nexin 10 acting as a novel regulator of macrophage polarization mediates inflammatory response in experimental mouse colitis. Sci. Rep. 2016, 6, 20630. [Google Scholar] [CrossRef] [PubMed]
- Eichin, D.; Pessia, A.; Takeda, A.; Laakkonen, J.; Bellmann, L.; Kankainen, M.; Imhof, B.A.; Stoitzner, P.; Tang, J.; Salmi, M.; et al. CD73 contributes to anti-inflammatory properties of afferent lymphatic endothelial cells in humans and mice. Eur. J. Immunol. 2021, 51, 231–246. [Google Scholar] [CrossRef] [PubMed]
- Liu, B.; Yang, R.; Wong, K.A.; Getman, C.; Stein, N.; Teitell, M.A.; Cheng, G.; Wu, H.; Shuai, K. Negative regulation of NF-κB signaling by PIAS1. Mol. Cell Biol. 2005, 25, 1113–1123. [Google Scholar] [CrossRef] [Green Version]
- Narayana, S.V.; Carson, M.; el-Kabbani, O.; Kilpatrick, J.M.; Moore, D.; Chen, X.; Bugg, C.E.; Volanakis, J.E.; DeLucas, L.J. Structure of human factor D. A complement system protein at 2.0 A resolution. J. Mol. Biol. 1994, 235, 695–708. [Google Scholar] [CrossRef]
- Ripoll, C.; Schmidt, B.M.; Ilic, N.; Poulev, A.; Dey, M.; Kurmukov, A.G.; Raskin, I. Anti-inflammatory effects of a sesquiterpene lactone extract from chicory (Cichorium intybus L.) roots. Nat. Prod. Commun. 2007, 2, 1934578X0700200. [Google Scholar] [CrossRef] [Green Version]
- Matos, M.S.; Anastácio, J.D.; Allwood, J.W.; Carregosa, D.; Marques, D.; Sungurtas, J.; McDougall, G.J.; Menezes, R.; Matias, A.A.; Stewart, D.; et al. Assessing the intestinal permeability and anti-inflammatory potential of sesquiterpene lactones from chicory. Nutrients 2020, 12, 3547. [Google Scholar] [CrossRef]
- Meo, S.A.; Al-Asiri, S.A.; Mahesar, A.L.; Ansari, M.J. Role of honey in modern medicine. Saudi J. Biol. Sci. 2017, 24, 975–978. [Google Scholar] [CrossRef]
- Nowrouzi, P.; Mazani, M.; Rezagholizadeh, L.; Banaei, S. Mechanism and clinical aspects of the effects of chicory on diabetes. Asian J. Res. Med. Pharm. Sci. 2017, 1, 1–11. [Google Scholar] [CrossRef]
- Nishimura, M.; Ohkawara, T.; Kanayama, T.; Kitagawa, K.; Nishimura, H.; Nishihira, J. Effects of the extract from roasted chicory (Cichorium intybus L.) root containing inulin-type fructans on blood glucose, lipid metabolism, and fecal properties. J. Tradit. Complement. Med. 2015, 5, 161–167. [Google Scholar] [CrossRef] [PubMed] [Green Version]
- Minneé, E.; Waghorn, G.; Lee, J.; Clark, C. Including chicory or plantain in a perennial ryegrass/white clover-based diet of dairy cattle in late lactation: Feed intake, milk production and rumen digestion. Anim. Feed Sci. Technol. 2017, 227, 52–61. [Google Scholar] [CrossRef]
- Niderkorn, V.; Martin, C.; Bernard, M.; le Morvan, A.; Rochette, Y.; Baumont, R. Effect of increasing the proportion of chicory in forage-based diets on intake and digestion by sheep. Animal 2019, 13, 718–726. [Google Scholar] [CrossRef] [PubMed]
- Khoobani, M.; Hasheminezhad, S.H.; Javandel, F.; Nosrati, M.; Seidavi, A.; Kadim, I.T.; Laudadio, V.; Tufarelli, V. Effects of dietary chicory (Chicorium intybus L.) and probiotic blend as natural feed additives on performance traits, blood biochemistry, and gut microbiota of broiler chickens. Antibiotics 2019, 9, 5. [Google Scholar] [CrossRef] [PubMed] [Green Version]
- Chien, K.L.; Fang, W.H.; Wen, H.C.; Lin, H.P.; Lin, Y.L.; Lin, S.W.; Wu, J.H.; Kao, J.T. APOA1/C3/A5 haplotype and risk of hypertriglyceridemia in Taiwanese. Clin. Chim. Acta 2008, 390, 56–62. [Google Scholar] [CrossRef]
- Plump, A.S.; Azrolan, N.; Odaka, H.; Wu, L.; Jiang, X.; Tall, A.; Eisenberg, S.; Breslow, J.L. ApoA-I knockout mice: Characterization of HDL metabolism in homozygotes and identification of a post-RNA mechanism of apoA-I up-regulation in heterozygotes. J. Lipid Res. 1997, 38, 1033–1047. [Google Scholar] [CrossRef]
- Vanhooren, J.C.T.; Fransen, M.; Bethune, B.; Baumgart, E.; Baes, M.; Torrekens, S.; Leuven, F.; Mannaerts, G.P.; Veldhoven, P.P. Rat Pristanoyl-CoA Oxidase. cDNA Cloning and recognition of its C-Terminal (SQL) by the peroxisomal-targeting signal 1 receptor. Eur. J. Biochem. 1996, 239, 302–309. [Google Scholar] [CrossRef]
- Aoki, J.; Inoue, A.; Okudaira, S. Two pathways for lysophosphatidic acid production. Biochim. Biophys. Acta Mol. Cell Biol. Lipids 2008, 1781, 513–518. [Google Scholar] [CrossRef]
- Chen, C.; Wang, H.; Chen, B.; Chen, D.; Lu, C.; Li, H.; Qian, Y.; Tan, Y.; Weng, H.; Cai, L. Pex11a deficiency causes dyslipidaemia and obesity in mice. J. Cell. Mol. Med. 2018, 23, 2020–2031. [Google Scholar] [CrossRef]
- Weng, H.; Ji, X.; Naito, Y.; Endo, K.; Ma, X.; Takahashi, R.; Shen, C.; Hirokawa, G.; Fukushima, Y.; Iwai, N. Pex11α deficiency impairs peroxisome elongation and division and contributes to nonalcoholic fatty liver in mice. Am. J. Physiol. Endocrinol. Metab. 2013, 304, E187–E196. [Google Scholar] [CrossRef] [Green Version]
- Joshi, A.; Rajput, S.; Wang, C.; Ma, J.; Cao, D. Murine aldo-keto reductase family 1 subfamily B: Identification of AKR1B8 as an ortholog of human AKR1B10. Biol. Chem. 2010, 391, 1371–1378. [Google Scholar] [CrossRef] [PubMed]
- Zoöller, I.; Meixner, M.; Hartmann, D.; Bussow, H.; Meyer, R.; Gieselmann, V.; Eckhardt, M. Absence of 2-hydroxylated sphingolipids is compatible with normal neural development but causes late-onset axon and myelin sheath degeneration. J. Neurosci. 2008, 28, 9741–9754. [Google Scholar] [CrossRef] [PubMed] [Green Version]
- Garman, S.C.; Garboczi, D.N. The molecular defect leading to Fabry disease: Structure of human α-galactosidase. J. Mol. Biol. 2004, 337, 319–335. [Google Scholar] [CrossRef] [PubMed]
- Prolo, P.; Wong, M.L.; Licinio, J. Leptin. Int. J. Biochem. Cell Biol. 1998, 30, 1285–1290. [Google Scholar] [CrossRef]
- van Wijk, R.; van Solinge, W.W. The energy-less red blood cell is lost: Erythrocyte enzyme abnormalities of glycolysis. Blood 2005, 106, 4034–4042. [Google Scholar] [CrossRef]
- Wang, L.; Tong, X.; Gu, F.; Zhang, L.; Chen, W.; Cheng, X.; Xie, L.; Chang, Y.; Zhang, H. The KLF14 transcription factor regulates hepatic gluconeogenesis in mice. J. Biol. Chem. 2017, 292, 21631–21642. [Google Scholar] [CrossRef] [Green Version]
- Erejuwa, O.O.; Sulaiman, S.A.; Wahab, M.S.A. Fructose might contribute to the hypoglycemic effect of honey. Molecules 2012, 17, 1900–1915. [Google Scholar] [CrossRef] [Green Version]
- Jin, T. Mechanisms underlying proglucagon gene expression. J. Endocrinol. 2008, 198, 17–28. [Google Scholar] [CrossRef]
- Cai, T.; Chen, X.; Wang, R.; Xu, H.; You, Y.; Zhang, T.; Lan, M.S.; Notkins, A.L. Expression of insulinoma-associated 2 (INSM2) in pancreatic islet cells is regulated by the transcription factors Ngn3 and NeuroD1. Endocrinology 2011, 152, 1961–1969. [Google Scholar] [CrossRef] [Green Version]
- Jassal, B.; Matthews, L.; Viteri, G.; Gong, C.; Lorente, P.; Fabregat, A.; Sidiropoulos, K.; Cook, J.; Gillespie, M.; Haw, R.; et al. The reactome pathway knowledgebase. Nucleic Acids Res. 2020, 48, D498–D503. [Google Scholar] [CrossRef]
- Seino, Y.; Fukushima, M.; Yabe, D. GIP and GLP-1, the two incretin hormones: Similarities and differences. J. Diabetes Investig. 2010, 1, 8–23. [Google Scholar] [CrossRef] [PubMed] [Green Version]
- Lepczyński, A.; Herosimczyk, A.; Ożgo, M.; Barszcz, M.; Taciak, M.; Skomiał, J. Modification of ileal proteome in growing pigs by dietary supplementation with inulin or dried chicory root. J. Anim. Feed Sci. 2019, 28, 177–186. [Google Scholar] [CrossRef]
- Matsuoka, Y.; Li, X.; Bennett, V. Adducin: Structure, function and regulation. Cell. Mol. Life Sci. 2000, 57, 884–895. [Google Scholar] [CrossRef] [PubMed]
- Kiang, K.M.Y.; Leung, G.K.K. A review on adducin from functional to pathological mechanisms: Future direction in cancer. BioMed Res. Int. 2018, 2018, 3465929. [Google Scholar] [CrossRef] [PubMed]
- McClard, C.K.; Kochukov, M.Y.; Herman, I.; Liu, Z.; Eblimit, A.; Moayedi, Y.; Ortiz-Guzman, J.; Colchado, D.; Pekarek, B.; Panneerselvam, S.; et al. POU6f1 mediates neuropeptide-dependent plasticity in the adult brain. J. Neurosci. 2018, 38, 1443–1461. [Google Scholar] [CrossRef]
- Berkemeier, L.R.; Winslow, J.W.; Kaplan, D.R.; Nikolics, K.; Goeddel, D.V.; Rosenthal, A. Neurotrophin-5: A novel neurotrophic factor that activates trk and trkB. Neuron 1991, 7, 857–866. [Google Scholar] [CrossRef]
- Liebl, D.J.; Mbiene, J.P.; Parada, L.F. NT4/5 mutant mice have deficiency in gustatory papillae and taste bud formation. Dev. Biol. 1999, 213, 378–389. [Google Scholar] [CrossRef]
- Moretti, P.; Levenson, J.M.; Battaglia, F.; Atkinson, R.; Teague, R.; Antalffy, B.; Armstrong, D.; Arancio, O.; Sweatt, J.D.; Zoghbi, H.Y. Learning and memory and synaptic plasticity are impaired in a mouse model of Rett syndrome. J. Neurosci. 2006, 26, 319–327. [Google Scholar] [CrossRef] [Green Version]
- Schlager, M.A.; Kapitein, L.C.; Grigoriev, I.; Burzynski, G.M.; Wulf, P.S.; Keijzer, N.; de Graaff, E.; Fukuda, M.; Shepherd, I.T.; Akhmanova, A.; et al. Pericentrosomal targeting of Rab6 secretory vesicles by bicaudal-D-related protein 1 (BICDR-1) regulates neuritogenesis. EMBO J. 2010, 29, 1637–1651. [Google Scholar] [CrossRef] [Green Version]
- Peeters, P.J.; Baker, A.; Goris, I.; Daneels, G.; Verhasselt, P.; Luyten, W.H.; Geysen, J.J.; Kass, S.U.; Moechars, D.W. Sensory deficits in mice hypomorphic for a mammalian homologue of unc-53. Dev. Brain Res. 2004, 150, 89–101. [Google Scholar] [CrossRef]
- Seco, C.Z.; Oonk, A.M.; Domínguez-Ruiz, M.; Draaisma, J.M.; Gandía, M.; Oostrik, J.; Neveling, K.; Kunst, H.P.; Hoefsloot, L.H.; del Castillo, I.; et al. Progressive hearing loss and vestibular dysfunction caused by a homozygous nonsense mutation in CLIC5. Eur. J. Hum. Genet. 2014, 23, 189–194. [Google Scholar] [CrossRef] [PubMed] [Green Version]
- Shirokova, E.; Raguse, J.D.; Meyerhof, W.; Krautwurst, D. The human vomeronasal type-1 receptor family—Detection of volatiles and cAMP signaling in HeLa/Olf cells. FASEB J. 2008, 22, 1416–1425. [Google Scholar] [CrossRef] [PubMed]
- Young, J.M.; Shykind, B.M.; Lane, R.P.; Tonnes-Priddy, L.; Ross, J.A.; Walker, M.; Williams, E.M.; Trask, B.J. Odorant receptor expressed sequence tags demonstrate olfactory expression of over 400 genes, extensive alternate splicing and unequal expression levels. Genome Biol. 2003, 4, R71. [Google Scholar] [CrossRef] [PubMed] [Green Version]
- Basch, M.L.; Bronner-Fraser, M.; García-Castro, M.I. Specification of the neural crest occurs during gastrulation and requires Pax7. Nature 2006, 441, 218–222. [Google Scholar] [CrossRef] [PubMed]
- Barman, A.; Assmann, A.; Richter, S.; Soch, J.; Schütze, H.; Wüstenberg, T.; Deibele, A.; Klein, M.; Richter, A.; Behnisch, G.; et al. Genetic variation of the RASGRF1 regulatory region affects human hippocampus-dependent memory. Front. Hum. Neurosci. 2014, 8, 260. [Google Scholar] [CrossRef] [PubMed] [Green Version]
- Li, H.L.; Li, Z.; Qin, L.Y.; Liu, S.; Lau, L.T.; Han, J.S.; Yu, A.C.H. The novel neurotrophin-regulated neuronal development-associated protein, NDAP, mediates apoptosis. FEBS Lett. 2006, 580, 1723–1728. [Google Scholar] [CrossRef] [PubMed] [Green Version]
- Niu, S.; Shingle, D.L.; Garbarino-Pico, E.; Kojima, S.; Gilbert, M.; Green, C.B. The circadian deadenylase nocturnin is necessary for stabilization of the iNOS mRNA in mice. PLoS ONE 2011, 6, e26954. [Google Scholar] [CrossRef]
- Payant, M.A.; Chee, M.J. Neural mechanisms underlying the role of fructose in overfeeding. Neurosci. Biobehav. Rev. 2021, 128, 346–357. [Google Scholar] [CrossRef]
- Wijlens, A.; Mars, M.; Dull, D.; de Graaf, K. Short term effect of chicory root fibre on appetite ratings and energy intake. Appetite 2013, 71, 490. [Google Scholar] [CrossRef]
- Crean, D.; Bellwon, P.; Aschauer, L.; Limonciel, A.; Moenks, K.; Hewitt, P.; Schmidt, T.; Herrgen, K.; Dekant, W.; Lukas, A.; et al. Development of an in vitro renal epithelial disease state model for xenobiotic toxicity testing. Toxicol. Vitr. 2015, 30, 128–137. [Google Scholar] [CrossRef]
- Capasso, M.; Bhamrah, M.K.; Henley, T.; Boyd, R.S.; Langlais, C.; Cain, K.; Dinsdale, D.; Pulford, K.; Khan, M.; Musset, B.; et al. HVCN1 modulates BCR signal strength via regulation of BCR-dependent generation of reactive oxygen species. Nat. Immunol. 2010, 11, 265–272. [Google Scholar] [CrossRef] [PubMed]
- Zhou, S.G.; Wang, P.; Pi, R.B.; Gao, J.; Fu, J.J.; Fang, J.; Qin, J.; Zhang, H.J.; Li, R.F.; Chen, S.R.; et al. Reduced expression of GSTM2 and increased oxidative stress in spontaneously hypertensive rat. Mol. Cell. Biochem. 2008, 309, 99–107. [Google Scholar] [CrossRef] [PubMed]
- Tornio, A.; Backman, J.T. Cytochrome P450 in pharmacogenetics: An update. Adv. Pharmacol. 2018, 83, 3–32. [Google Scholar] [CrossRef] [PubMed] [Green Version]
- Jasim, R.S. Antioxidant, antimicrobial activities and phytochemical constituents of Cichorium intybus L. Aerial Parts. Int. J. Bot. 2018, 14, 24–29. [Google Scholar] [CrossRef]
- Turnbaugh, P.J.; Bäckhed, F.; Fulton, L.; Gordon, J.I. Diet-induced obesity is linked to marked but reversible alterations in the mouse distal gut microbiome. Cell Host Microbe 2008, 3, 213–223. [Google Scholar] [CrossRef] [Green Version]
- Wen, L.; Ley, R.E.; Volchkov, P.Y.; Stranges, P.B.; Avanesyan, L.; Stonebraker, A.C.; Hu, C.; Wong, F.S.; Szot, G.L.; Bluestone, J.A.; et al. Innate immunity and intestinal microbiota in the development of Type 1 diabetes. Nature 2008, 455, 1109–1113. [Google Scholar] [CrossRef]
- Braak, H.; de Vos, R.A.; Bohl, J.; del Tredici, K. Gastric α-synuclein immunoreactive inclusions in Meissner’s and Auerbach’s plexuses in cases staged for Parkinson’s disease-related brain pathology. Neurosci. Lett. 2006, 396, 67–72. [Google Scholar] [CrossRef]
- Jin, M.; Li, J.; Liu, F.; Lyu, N.; Wang, K.; Wang, L.; Liang, S.; Tao, H.; Zhu, B.; Alkasir, R. Analysis of the gut microflora in patients with Parkinson’s disease. Front. Neurosci. 2019, 13, 1184. [Google Scholar] [CrossRef] [Green Version]
- Trzeciak, P.; Herbet, M. Role of the Intestinal microbiome, intestinal barrier and psychobiotics in depression. Nutrients 2021, 13, 927. [Google Scholar] [CrossRef]
- Sarkar, A.; Lehto, S.M.; Harty, S.; Dinan, T.G.; Cryan, J.F.; Burnet, P.W. Psychobiotics and the manipulation of bacteria–gut–brain signals. Trends Neurosci. 2016, 39, 763–781. [Google Scholar] [CrossRef] [Green Version]
- Medlock, G.L.; Carey, M.A.; McDuffie, D.G.; Mundy, M.B.; Giallourou, N.; Swann, J.R.; Kolling, G.L.; Papin, J.A. Inferring metabolic mechanisms of interaction within a defined gut microbiota. Cell Syst. 2018, 7, 245–257.e7. [Google Scholar] [CrossRef] [Green Version]
- Ignacio, A.; Fernandes-Terra, F.; Watanabe, I.; Basso, P.J.; Câmara, N. Role of the microbiome in intestinal barrier function and immune defense. In Microbiome and Metabolome in Diagnosis, Therapy, and Other Strategic Applications, 1st ed.; Faintuch, J., Faintuch, S., Eds.; Academic Press: Boston, MA, USA, 2019; pp. 127–138. [Google Scholar] [CrossRef]
- Clavel, T.; Lepage, P.; Charrier, C. The family Coriobacteriaceae. In The Prokaryotes, 1st ed.; Rosenberg, E., DeLong, E.F., Lory, S., Stackebrandt, E., Thompson, F., Eds.; Springer: Berlin/Heidelberg, Germany, 2014; pp. 201–238. [Google Scholar] [CrossRef]
- Kim, H.N.; Joo, E.J.; Cheong, H.S.; Kim, Y.; Kim, H.L.; Shin, H.; Chang, Y.; Ryu, S. Gut microbiota and risk of persistent nonalcoholic fatty liver diseases. J. Clin. Med. 2019, 8, 1089. [Google Scholar] [CrossRef] [PubMed] [Green Version]
- Liu, G.; Zhao, Q.; Wei, H. Characteristics of intestinal bacteria with fatty liver diseases and cirrhosis. Ann. Hepatol. 2019, 18, 796–803. [Google Scholar] [CrossRef]
- Ruuskanen, M.O.; Åberg, F.; Männistö, V.; Havulinna, A.S.; Méric, G.; Liu, Y.; Loomba, R.; Vázquez-Baeza, Y.; Tripathi, A.; Valsta, L.M.; et al. Links between gut microbiome composition and fatty liver disease in a large population sample. Gut Microbes 2021, 13, 1–22. [Google Scholar] [CrossRef] [PubMed]
- Maki, K.A.; Burke, L.A.; Calik, M.W.; Watanabe-Chailland, M.; Sweeney, D.; Romick-Rosendale, L.E.; Green, S.J.; Fink, A.M. Sleep fragmentation increases blood pressure and is associated with alterations in the gut microbiome and fecal metabolome in rats. Physiol. Genom. 2020, 52, 280–292. [Google Scholar] [CrossRef]
- Kaakoush, N.O. Insights into the role of Erysipelotrichaceae in the human host. Front. Cell. Infect. Microbiol. 2015, 5, 84. [Google Scholar] [CrossRef] [Green Version]
- Dinh, D.M.; Volpe, G.E.; Duffalo, C.; Bhalchandra, S.; Tai, A.K.; Kane, A.V.; Wanke, C.A.; Ward, H.D. Intestinal microbiota, microbial translocation, and systemic inflammation in chronic HIV infection. J. Infect. Dis. 2015, 211, 19–27. [Google Scholar] [CrossRef] [Green Version]
- Bernard, G.; Gagneul, D.; Alves Dos Santos, H.; Etienne, A.; Hilbert, J.L.; Rambaud, C. Efficient genome editing using CRISPR/Cas9 technology in chicory. Int. J. Mol. Sci. 2019, 20, 1155. [Google Scholar] [CrossRef] [Green Version]


| Treatment | Fru | CGA | STL | ||||
|---|---|---|---|---|---|---|---|
| Compound | Fructose | 3-CGA | 3,5-CGA | DHLc | Lc | DHLp | Lp |
| µg/day of each compound | 166.35 | 2.52 | 3.44 | 1.83 | 3.88 | 0.29 | 2.22 |
| µg/day of total mix | 166.35 | 5.90 | 8.20 | ||||
| Compounds (mg/g Dry Matter) | Flour | Decoction | ||
|---|---|---|---|---|
| Mean | SD | Mean | SD | |
| Fructose a | 3.43 | 0.12 | 2.60 | 0.26 |
| 3-CGA b | 0.55 | 0.02 | 0.66 | 0.01 |
| 3,5-diCGA b | 0.43 | 0.01 | 0.43 | 0.01 |
| Lc c | 0.05 | 0.01 | 0.11 | 0.01 |
| Lp c | 0.23 | 0.02 | 0.21 | 0.01 |
| DHLc c | 0.14 | 0.01 | 0.17 | 0.01 |
| DHLp c | 0.05 | 0.01 | 0.03 | 0.01 |
Publisher’s Note: MDPI stays neutral with regard to jurisdictional claims in published maps and institutional affiliations. |
© 2022 by the authors. Licensee MDPI, Basel, Switzerland. This article is an open access article distributed under the terms and conditions of the Creative Commons Attribution (CC BY) license (https://creativecommons.org/licenses/by/4.0/).
Share and Cite
Pouille, C.L.; Ouaza, S.; Roels, E.; Behra, J.; Tourret, M.; Molinié, R.; Fontaine, J.-X.; Mathiron, D.; Gagneul, D.; Taminiau, B.; et al. Chicory: Understanding the Effects and Effectors of This Functional Food. Nutrients 2022, 14, 957. https://0-doi-org.brum.beds.ac.uk/10.3390/nu14050957
Pouille CL, Ouaza S, Roels E, Behra J, Tourret M, Molinié R, Fontaine J-X, Mathiron D, Gagneul D, Taminiau B, et al. Chicory: Understanding the Effects and Effectors of This Functional Food. Nutrients. 2022; 14(5):957. https://0-doi-org.brum.beds.ac.uk/10.3390/nu14050957
Chicago/Turabian StylePouille, Céline L., Souad Ouaza, Elise Roels, Josette Behra, Melissa Tourret, Roland Molinié, Jean-Xavier Fontaine, David Mathiron, David Gagneul, Bernard Taminiau, and et al. 2022. "Chicory: Understanding the Effects and Effectors of This Functional Food" Nutrients 14, no. 5: 957. https://0-doi-org.brum.beds.ac.uk/10.3390/nu14050957