
Polyphenols from Olive-Mill Wastewater and Biological Activity: Focus on Irritable Bowel Syndrome †


 , , , , ,
  and
and
Abstract
: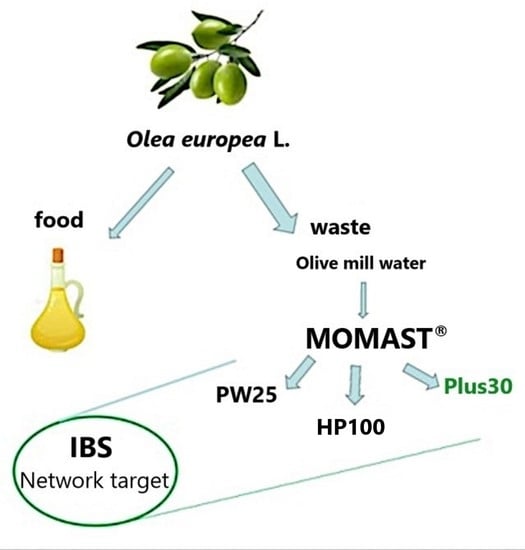
1. Introduction
2. Materials and Methods
2.1. Wastewater Plant Material
2.1.1. Chemical Analysis
2.1.2. Determination of the Total Phenolic Content (TPC)
2.2. Antioxidant Activity
2.3. Ex Vivo Contractility Studies
2.3.1. Animals
2.3.2. Spontaneous Contractility
2.3.3. Induced Contractility
2.3.4. Statistical Analysis
2.4. Antimicrobial Activity
2.4.1. Microorganisms
2.4.2. Agar Disk-Diffusion Method
2.4.3. Determination of the Minimum Inhibitory Concentration (MIC)
2.4.4. FICI Determination
2.4.5. Microdiluition Checkerboard Method
3. Results
3.1. Chemical Composition of MOMASTs
3.2. Antioxidant Activity
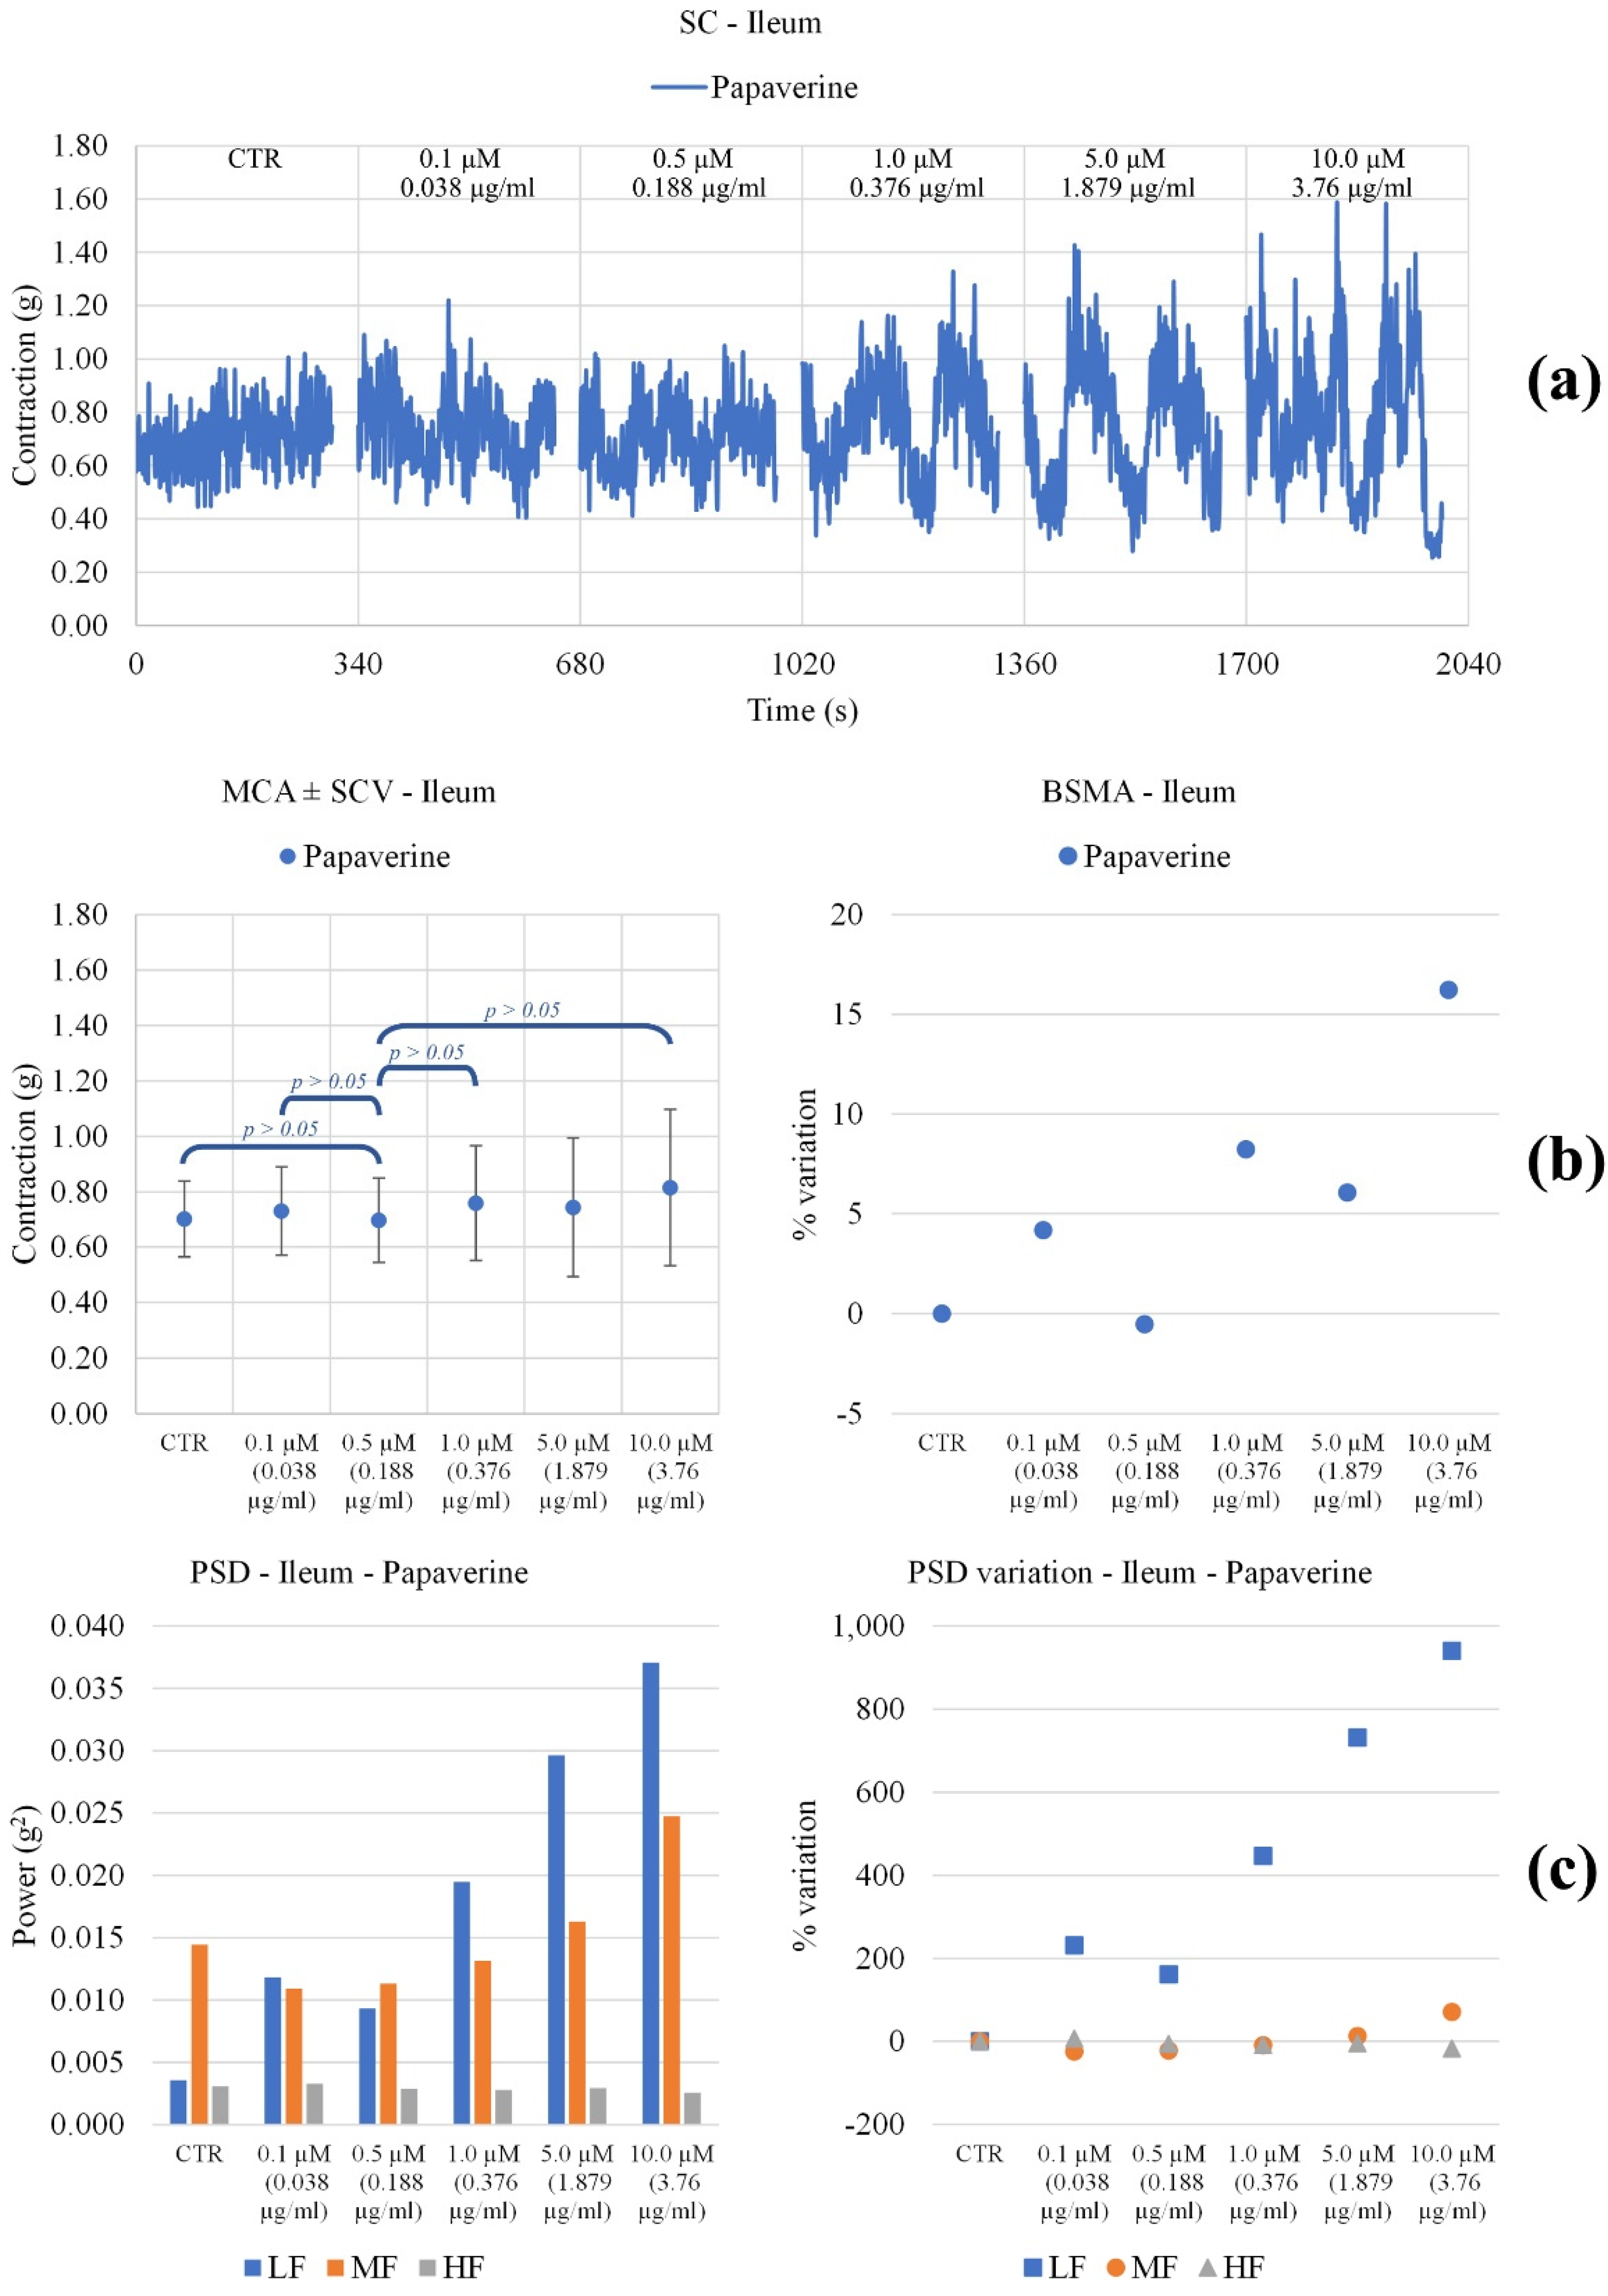
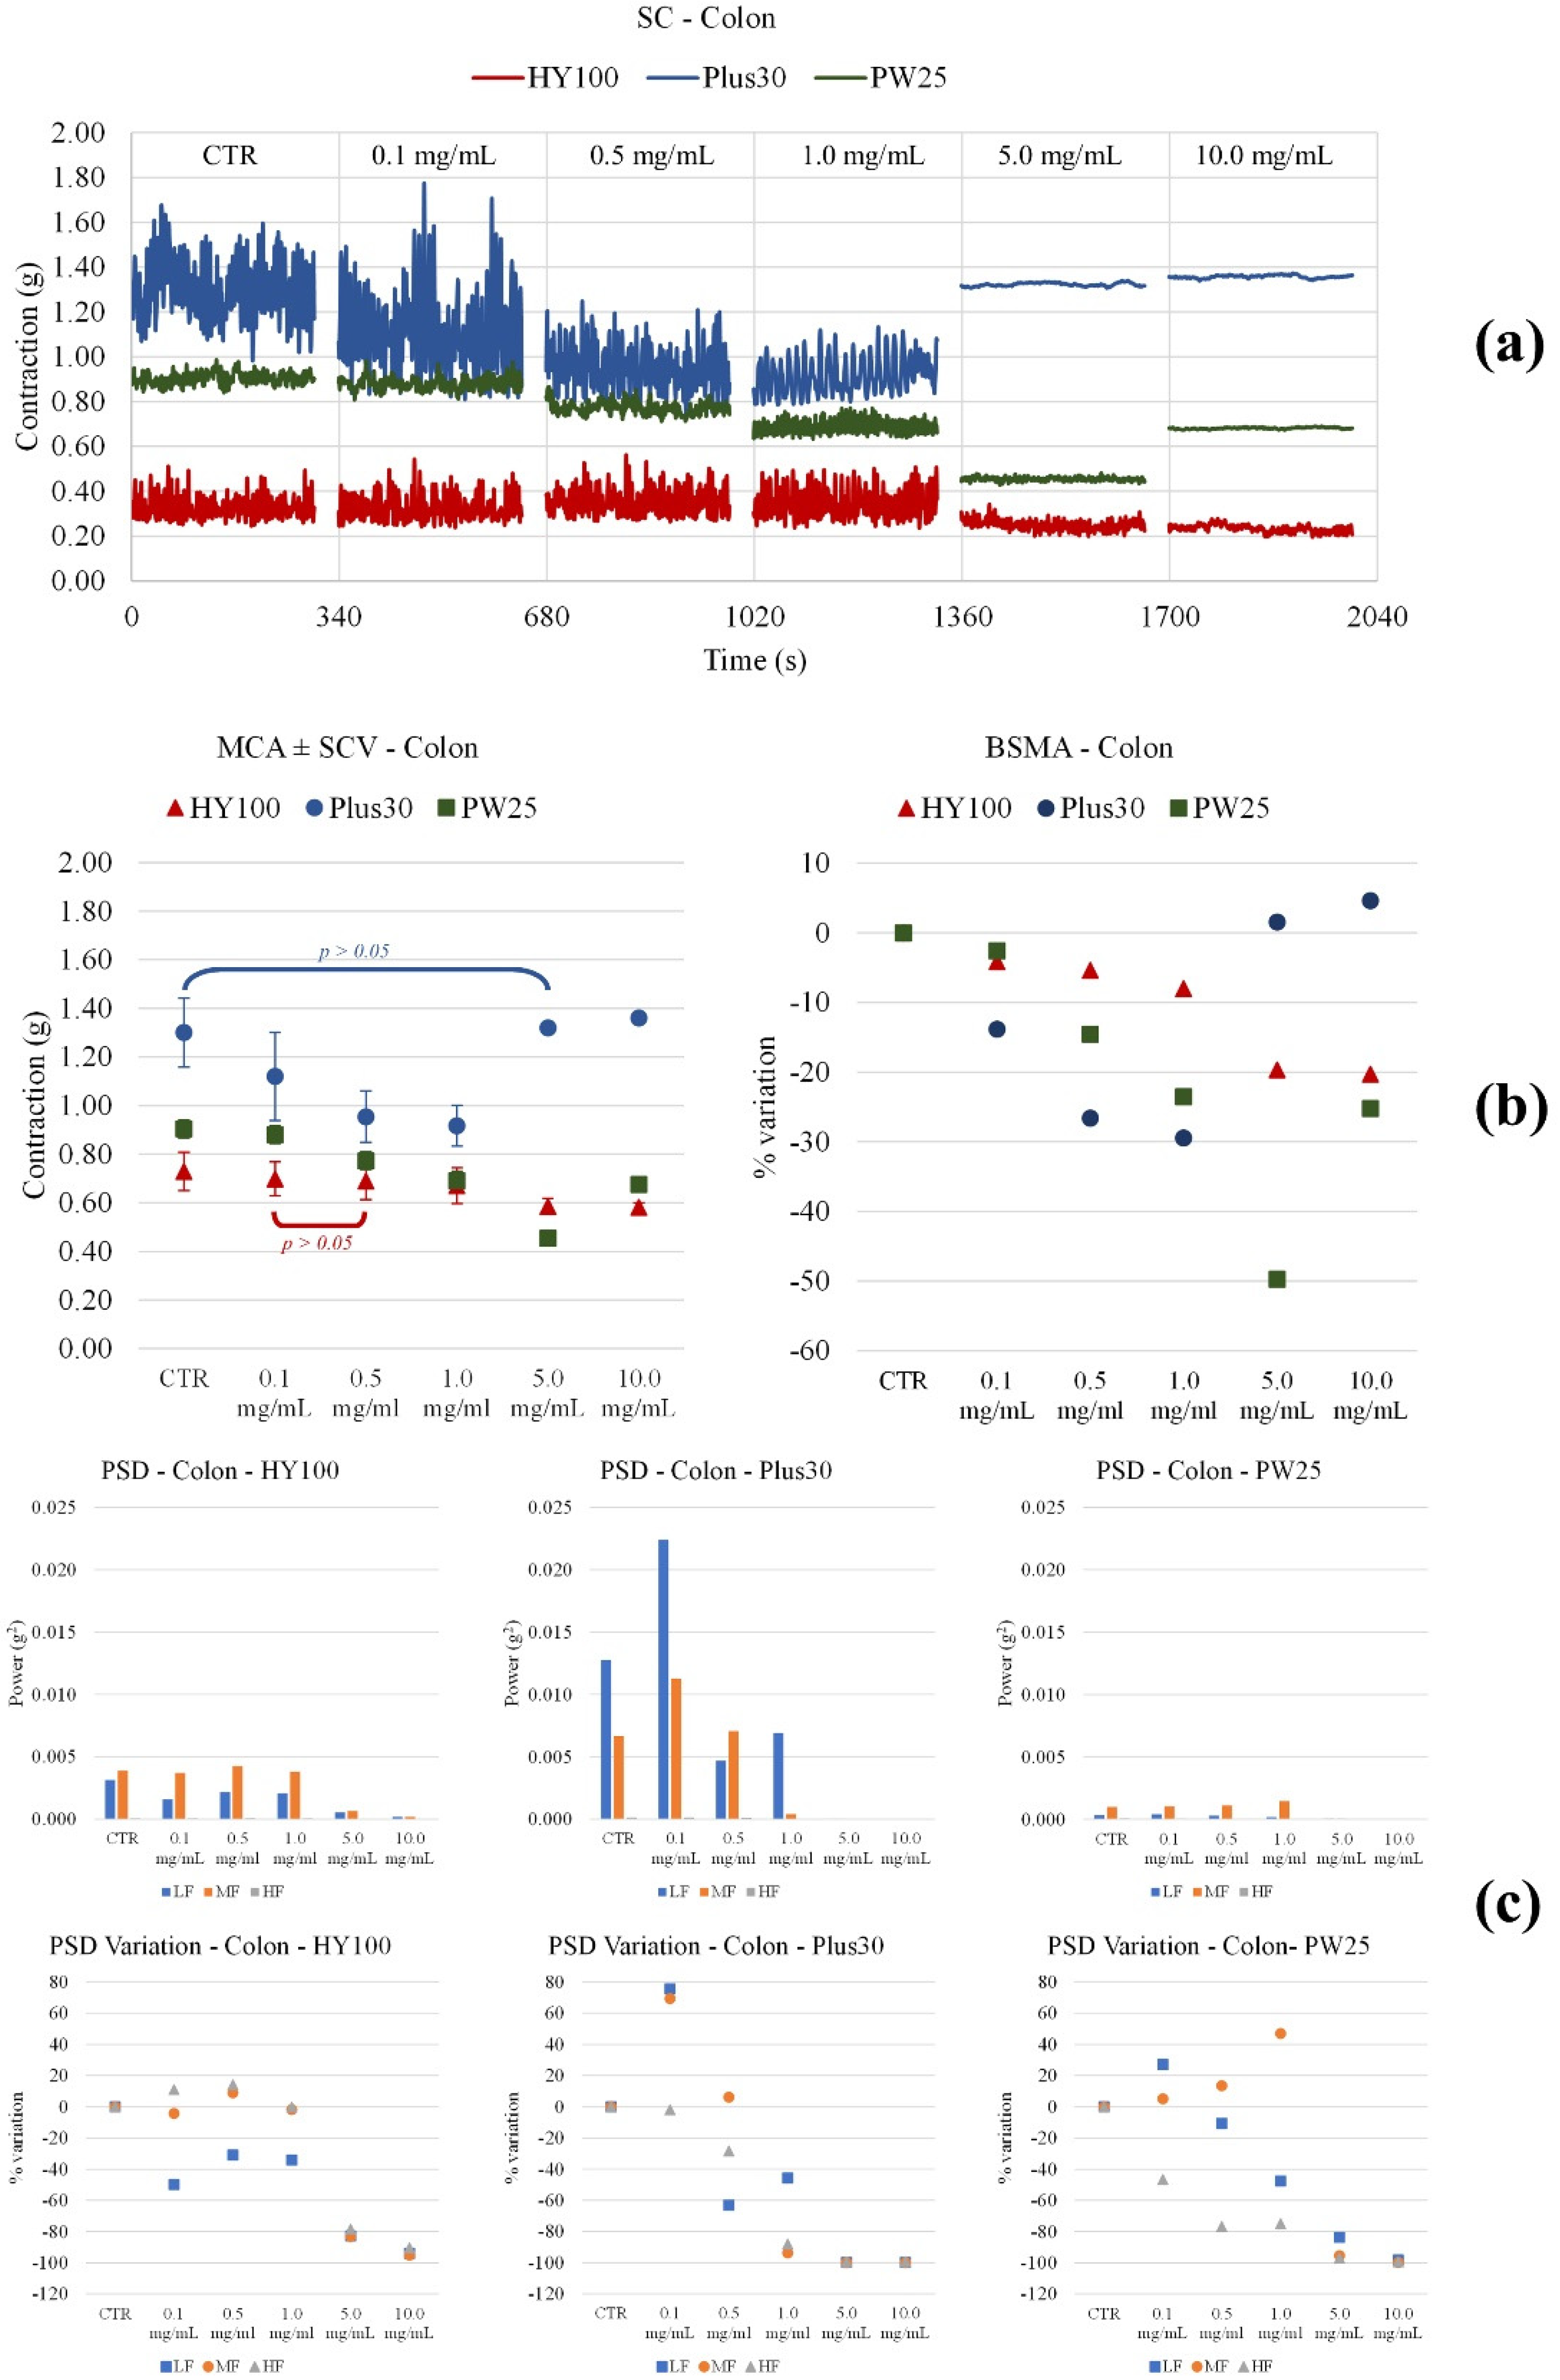
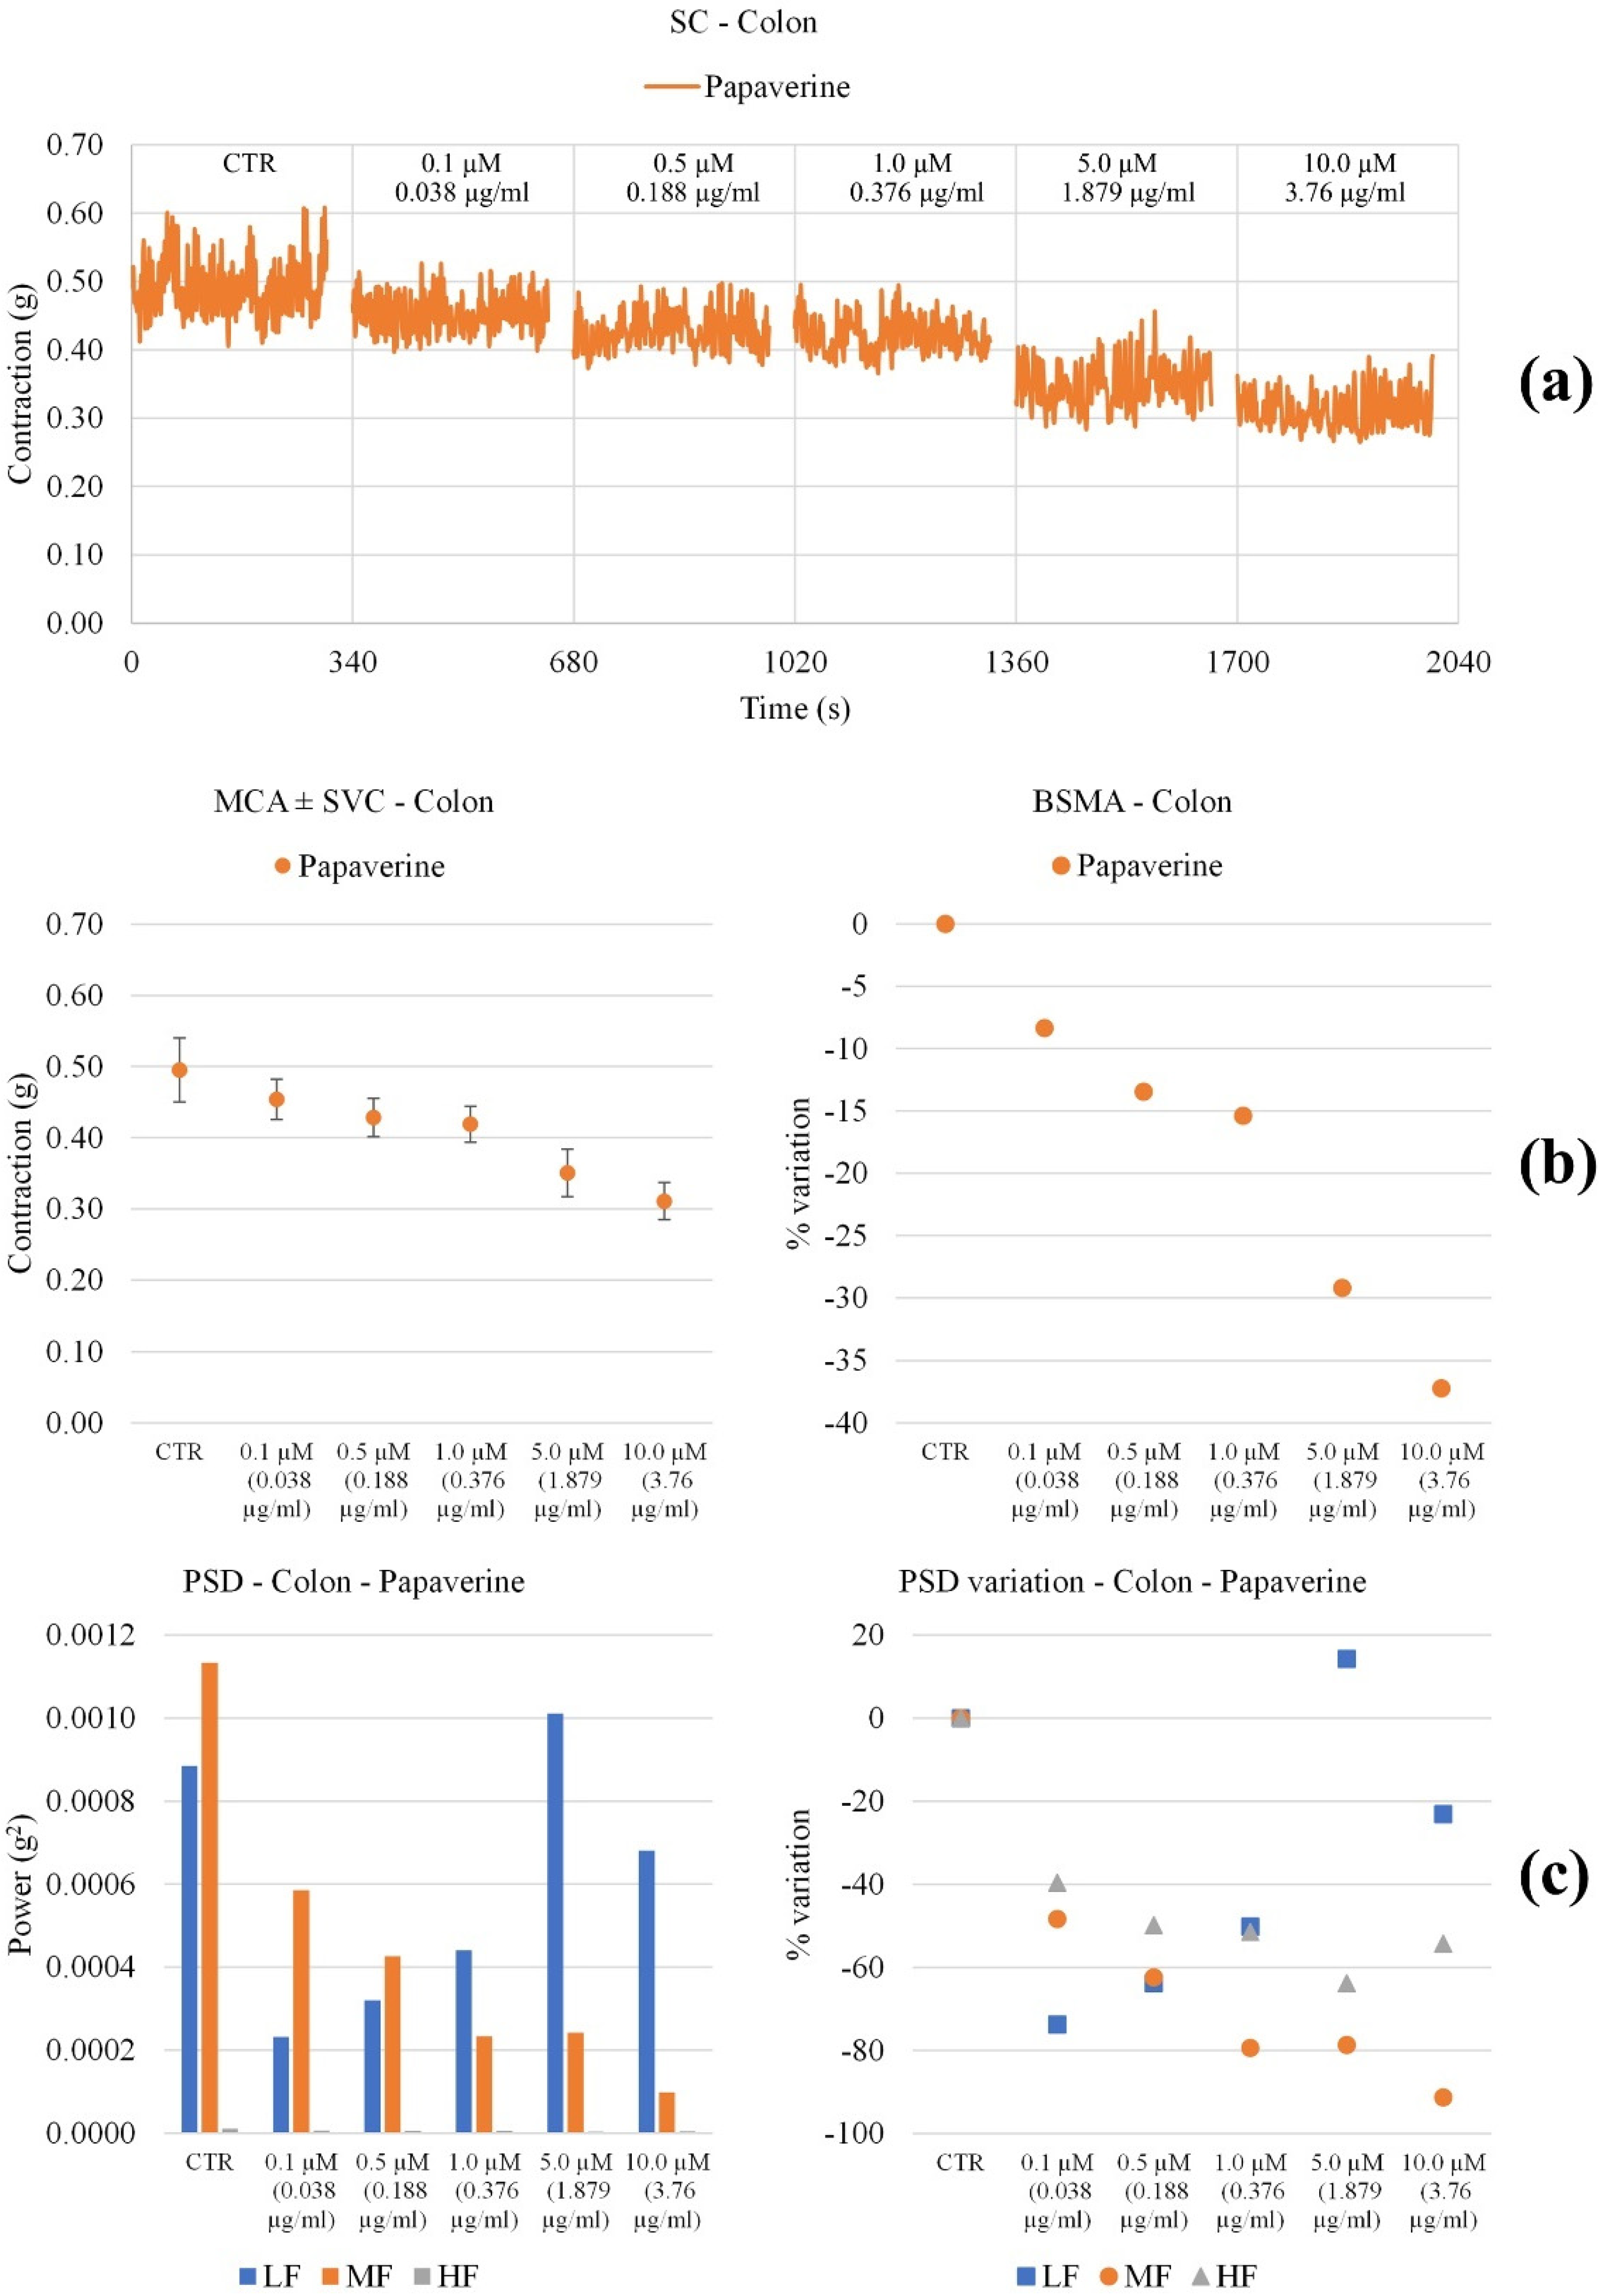
3.3. Effect on Ileum and Colon Ex Vivo Contractility
3.3.1. Induced
3.3.2. Spontaneously
3.4. Effect of MOMAST® Plus30 against Bacteria
3.4.1. Determination of the Minimum Inhibitory Concentration (MIC)
3.4.2. FICI Determination
4. Discussion
5. Conclusions
Author Contributions
Funding
Institutional Review Board Statement
Informed Consent Statement
Data Availability Statement
Conflicts of Interest
References
- Rokkas, T.; Niv, Y.; Gisbert, J.P.; Franceschi, F.; Gasbarrini, A.; Hold, G.L.; O’Morain, C.; Malfertheiner, P.; Megraud, F. The role of Rifaximin in Irritable Bowel Syndrome derived from a network meta-analysis of randomized control trials. Microb. Health Dis. 2020, 2, e333. [Google Scholar] [CrossRef]
- Chey, W.D.; Shah, E.D.; Dupont, H.L. Mechanism of action and therapeutic benefit of rifaximin in patients with irritable bowel syndrome: A narrative review. Ther. Adv. Gastroenterol. 2020, 13, 1756284819897531. [Google Scholar] [CrossRef] [PubMed] [Green Version]
- Sinagra, E.; Morreale, G.C.; Mohammadian, G.; Fusco, G.; Guarnotta, V.; Tomasello, G.; Cappello, F.; Rossi, F.; Amvrosiadis, G.; Raimondo, D. New therapeutic perspectives in irritable bowel syndrome: Targeting low-grade inflammation, immuno-neuroendocrine axis, motility, secretion and beyond. World J. Gastroenterol. 2017, 23, 6593–6627. [Google Scholar] [CrossRef] [PubMed] [Green Version]
- Andrews, C.N.; Sidani, S.; Marshall, J.K. Clinical Management of the Microbiome in Irritable Bowel Syndrome. J. Can. Assoc. Gastroenterol. 2020, 4, 36–43. [Google Scholar] [CrossRef] [Green Version]
- Pimentel, M.; Lembo, A. Microbiome and Its Role in Irritable Bowel Syndrome. Dig. Dis. Sci. 2020, 65, 829–839. [Google Scholar] [CrossRef] [PubMed] [Green Version]
- Bhattarai, Y.; Pedrogo, D.A.M.; Kashyap, P.C. Irritable bowel syndrome: A gut microbiota-related disorder? Am. J. Physiol.-Gastrointest. Liver Physiol. 2017, 312, G52–G62. [Google Scholar] [CrossRef]
- Vezza, T.; Algieri, F.; Rodríguez-Nogales, A.; Garrido-Mesa, J.; Utrilla, M.P.; Talhaoui, N.; Gómez-Caravaca, A.M.; Segura-Carretero, A.; Rodriguez-Cabezas, M.E.; Monteleone, G.; et al. Immunomodulatory properties of Olea europaea leaf extract in intestinal inflammation. Mol. Nutr. Food Res. 2017, 61, 1601066. [Google Scholar] [CrossRef]
- Farzaei, M.H.; Singh, A.K.; Kumar, R.; Croley, C.R.; Pandey, A.K.; Coy-Barrera, E.; Patra, J.K.; Das, G.; Kerry, R.G.; Annunziata, G.; et al. Targeting Inflammation by Flavonoids: Novel Therapeutic Strategy for Metabolic Disorders. Int. J. Mol. Sci. 2019, 20, 4957. [Google Scholar] [CrossRef] [Green Version]
- Mallamaci, R.; Budriesi, R.; Clodoveo, M.L.; Biotti, G.; Micucci, M.; Ragusa, A.; Curci, F.; Muraglia, M.; Corbo, F.; Franchini, C. Olive Tree in Circular Economy as a Source of Secondary Metabolites Active for Human and Animal Health Beyond Oxidative Stress and Inflammation. Molecules 2021, 26, 1072. [Google Scholar] [CrossRef]
- Roudsari, N.M.; Lashgari, N.-A.; Momtaz, S.; Farzaei, M.H.; Marques, A.M.; Abdolghaffari, A.H. Natural polyphenols for the prevention of irritable bowel syndrome: Molecular mechanisms and targets; a comprehensive review. DARU J. Pharm. Sci. 2019, 27, 755–780. [Google Scholar] [CrossRef]
- Marcelino, G.; Hiane, P.A.; Freitas, K.D.C.; Santana, L.F.; Pott, A.; Donadon, J.R.; Guimarães, R.D.C.A. Effects of Olive Oil and Its Minor Components on Cardiovascular Diseases, Inflammation, and Gut Microbiota. Nutrients 2019, 11, 1826. [Google Scholar] [CrossRef] [PubMed] [Green Version]
- Micucci, M.; Malaguti, M.; Toschi, T.G.; Di Lecce, G.; Aldini, R.; Angeletti, A.; Chiarini, A.; Budriesi, R.; Hrelia, S. Cardiac and Vascular Synergic Protective Effect of Olea europea L. Leaves and Hibiscus sabdariffa L. Flower Extracts. Oxid. Med. Cell. Longev. 2015, 2015, 318125. [Google Scholar] [CrossRef] [PubMed] [Green Version]
- Micucci, M.; Angeletti, A.; Cont, M.; Corazza, I.; Aldini, R.; Donadio, E.; Chiarini, A.; Budriesi, R. Hibiscus Sabdariffa L. Flowers and Olea Europea L. Leaves Extract-Based Formulation for Hypertension Care: In Vitro Efficacy and Toxicological Profile. J. Med. Food 2016, 19, 504–512. [Google Scholar] [CrossRef] [PubMed]
- LaRussa, T.; Imeneo, M.; Luzza, F. Olive Tree Biophenols in Inflammatory Bowel Disease: When Bitter is Better. Int. J. Mol. Sci. 2019, 20, 1390. [Google Scholar] [CrossRef] [PubMed] [Green Version]
- Mattioli, L.B.; Frosini, M.; Amoroso, R.; Maccallini, C.; Chiano, E.; Aldini, R.; Urso, F.; Corazza, I.; Micucci, M.; Budriesi, R. Olea europea L. Leaves and Hibiscus sabdariffa L. Petals Extracts: Herbal Mix from Cardiovascular Network Target to Gut Motility Dysfunction Application. Nutrients 2022, 14, 463. [Google Scholar] [CrossRef] [PubMed]
- Zeka, K.; Marrazzo, P.; Micucci, M.; Ruparelia, K.C.; Arroo, R.R.J.; Macchiarelli, G.; Nottola, S.A.; Continenza, M.A.; Chiarini, A.; Angeloni, C.; et al. Activity of Antioxidants from Crocus sativus L. Petals: Potential Preventive Effects towards Cardiovascular System. Antioxidants 2020, 9, 1102. [Google Scholar] [CrossRef] [PubMed]
- Cardinali, A.; Cicco, N.; Linsalata, V.; Minervini, F.; Pati, S.; Pieralice, M.; Tursi, N.; Lattanzio, V. Biological Activity of High Molecular Weight Phenolics from Olive Mill Wastewater. J. Agric. Food Chem. 2010, 58, 8585–8590. [Google Scholar] [CrossRef]
- Aggoun, M.; Arhab, R.; Cornu, A.; Portelli, J.; Barkat, M.; Graulet, B. Olive mill wastewater microconstituents composition according to olive variety and extraction process. Food Chem. 2016, 209, 72–80. [Google Scholar] [CrossRef]
- Recinella, L.; Chiavaroli, A.; Orlando, G.; Menghini, L.; Ferrante, C.; Di Cesare Mannelli, L.; Ghelardini, C.; Brunetti, L.; Leone, S. Protective Effects Induced by Two Polyphenolic Liquid Complexes from Olive (Olea europaea, mainly Cultivar Coratina) Pressing Juice in Rat Isolated Tissues Challenged with LPS. Molecules 2019, 24, 3002. [Google Scholar] [CrossRef] [Green Version]
- Bassani, B.; Rossi, T.; De Stefano, D.; Pizzichini, D.; Corradino, P.; Macrì, N.; Noonan, D.M.; Albini, A.; Bruno, A. Potential chemopreventive activities of a polyphenol rich purified extract from olive mill wastewater on colon cancer cells. J. Funct. Foods 2016, 27, 236–248. [Google Scholar] [CrossRef]
- Pantano, D.; Luccarini, I.; Nardiello, P.; Servili, M.; Stefani, M.; Casamenti, F. Oleuropein aglycone and polyphenols from olive mill waste water ameliorate cognitive deficits and neuropathology. Br. J. Clin. Pharmacol. 2016, 83, 54–62. [Google Scholar] [CrossRef] [PubMed]
- Visioli, F.; Galli, C.; Bornet, F.; Mattei, A.; Patelli, R.; Galli, G.; Caruso, D. Olive oil phenolics are dose-dependently absorbed in humans. FEBS Lett. 2000, 468, 159–160. [Google Scholar] [CrossRef]
- Moretti, P.; Massari, C.; Moretti, U.; Franchini, C.; Corbo, F.; Lentini, G.; Pisano, I.; Mallamaci, R.; Clodoveo, M.L.; De Palma, A.; et al. Fitocomplesso Polifenolico Standardizzato Per La Prevenzione Delle Patologie Correlate All’esposizione da Sostanze Reattive Dell’ossigeno E Relativo Metodo Di Produzione. Bioenutra Srl 2017, 102017000118607. [Google Scholar]
- Arnoldi, A.; Clodoveo, M.L.; Corbo, F.; Franchini, C.; Lammi, C.; Lentini, G.; Lorenzo, V.; Massari, C.; Milani, G.; Moretti, P.; et al. Processo produttivo di complessi polifenolici da acque di vegetazione olearie con processo fermentativo e relativi complessi polifenolici prodotti. Bioenutra srl 2021, 102021000019226. [Google Scholar]
- International Olive Council. IOC/T.20/Doc No. 29] IOC/T.20/Doc No. 29. Official Method of Analysis. In Determination of Biophenols in Olive Oil by HPLC; International Olive Council: Madrid, Spain, 2009. [Google Scholar]
- Blainski, A.; Lopes, G.C.; De Mello, J.C.P. Application and Analysis of the Folin Ciocalteu Method for the Determination of the Total Phenolic Content from Limonium brasiliense L. Molecules 2013, 18, 6852–6865. [Google Scholar] [CrossRef] [PubMed] [Green Version]
- Clodoveo, M.L.; Dipalmo, T.; Crupi, P.; Durante, V.; Pesce, V.; Maiellaro, I.; Lovece, A.; Mercurio, A.; Laghezza, A.; Corbo, F.; et al. Comparison Between Different Flavored Olive Oil Production Techniques: Healthy Value and Process Efficiency. Plant Foods Hum. Nutr. 2016, 71, 81–87. [Google Scholar] [CrossRef] [PubMed]
- Micucci, M.; Protti, M.; Aldini, R.; Frosini, M.; Corazza, I.; Marzetti, C.; Mattioli, L.B.; Tocci, G.; Chiarini, A.; Mercolini, L.; et al. Thymus vulgaris L. Essential Oil Solid Formulation: Chemical Profile and Spasmolytic and Antimicrobial Effects. Biomolecules 2020, 10, 860. [Google Scholar] [CrossRef]
- Budriesi, R.; Vivarelli, F.; Canistro, D.; Aldini, R.; Marquillas, C.B.; Corazza, I.; Fato, R.; Cirillo, S.; Bergamini, C.; D’Errico, A.; et al. Liver and intestinal protective effects of Castanea sativa Mill. bark extract in high-fat diet rats. PLoS ONE 2018, 13, e0201540. [Google Scholar] [CrossRef]
- Tallarida, R.J.; Murray, R.B. Manual of Pharmacologic Calculations with Computer Programs, 2nd ed.; Springer: New York, NY, USA, 1987; pp. 31–35. [Google Scholar]
- Motulsky, H.; Christopoulos, A. Fitting Models to Biological Data Using Linear and Non-Linear Regression. 2003. Available online: https://www.facm.ucl.ac.be/cooperation/Vietnam/WBI-Vietnam-October-2011/Modelling/RegressionBook.pdf (accessed on 4 June 2021).
- Motulsky, H.J. Prism 5 Statistics Guide; GraphPad Software Inc.: San Diego, CA, USA, 2007; Available online: https://cdn.graphpad.com/faq/2/file/Prism_v5_Statistics_Guide.pdf (accessed on 7 June 2021).
- Clinical and Laboratory Standards Institute (CLSI). Methods for Dilution Antimicrobial Susceptibility Tests for Bacteria That Grow Aerobically; Approves Standard, 10th ed.; CLSI document M07-A10; CLSI: Wayne, PA, USA, 2015; p. 35. ISBN 1-56238-988. [Google Scholar]
- Rosato, A.; Vitali, C.; De Laurentis, N.; Armenise, D.; Milillo, M.A. Antibacterial effect of some essential oils administered alone or in combination with Norfloxacin. Phytomedicine 2007, 14, 727–732. [Google Scholar] [CrossRef] [PubMed]
- EUCAST. Terminology Related to Methods for the Determination of Susceptibility of Bacteria to Antimicrobial Agents, Eucast Definitive Document 2.1, European Committee for Antimicrobial Susceptibility Testing; European Society of Clinical Microbiology and Infectious Diseases (ESCMID): Basel, Switzerland, 2000; Volume 6, pp. 503–508. [Google Scholar]
- White, R.L.; Burgess, D.S.; Manduru, M.; Bosso, J.A. Comparison of three different in vitro methods of detecting synergy: Time-kill, checkerboard, and E test. Antimicrob. Agents Chemother. 1996, 40, 1914–1918. [Google Scholar] [CrossRef] [Green Version]
- Nediani, C.; Ruzzolini, J.; Romani, A.; Calorini, L. Oleuropein, a Bioactive Compound from Olea europaea L., as a Potential Preventive and Therapeutic Agent in Non-Communicable Diseases. Antioxidants 2019, 8, 578. [Google Scholar] [CrossRef] [Green Version]
- Ahamad, J.; Toufeeq, I.; Khan, M.A.; Ameen, M.S.M.; Anwer, E.T.; Uthirapathy, S.; Mir, S.R.; Ahmad, J. Oleuropein: A natural antioxidant molecule in the treatment of metabolic syndrome. Phytother. Res. 2019, 33, 3112–3128. [Google Scholar] [CrossRef] [PubMed]
- Castejón, M.L.; Alarcón-de-la-Lastra, C.; Rosillo, M.Á.; Montoya, T.; Fernández-Bolaños, J.G.; González-Benjumea, A.; Sánchez-Hidalgo, M. A new peracetylated oleuropein derivative ameliorates joint inflammation and destruction in a murine collagen-induced arthritis model via activation of the Nrf-2/Ho-1 antioxidant pathway and suppression of MAPKs and NF-κB activation. Nutrients 2021, 13, 311. [Google Scholar] [CrossRef] [PubMed]
- Zheng, S.; Wang, Y.; Fang, J.; Geng, R.; Li, M.; Zhao, Y.; Kang, S.-G.; Huang, K.; Tong, T. Oleuropein Ameliorates Advanced Stage of Type 2 Diabetes in db/db Mice by Regulating Gut Microbiota. Nutrients 2021, 13, 2131. [Google Scholar] [CrossRef] [PubMed]
- Budriesi, R.; Ioan, P.; Micucci, M.; Micucci, E.; Limongelli, V.; Chiarini, A. Stop Fitan: Antispasmodic Effect of Natural Extract of Chestnut Wood in Guinea Pig Ileum and Proximal Colon Smooth Muscle. J. Med. Food 2010, 13, 1104–1110. [Google Scholar] [CrossRef] [PubMed]
- Tian, T.; Wang, Z.; Zhang, J. Pathomechanisms of Oxidative Stress in Inflammatory Bowel Disease and Potential Antioxidant Therapies. Oxid. Med. Cell. Longev. 2017, 2017, 4535194. [Google Scholar] [CrossRef] [PubMed]
- Triantafillidis, J.K.; Triantafyllidi, A.; Vagianos, C.; Papalois, A. Favorable results from the use of herbal and plant products in inflammatory bowel disease: Evidence from experimental animal studies. Ann. Gastroenterol. 2016, 29, 268–281. [Google Scholar] [CrossRef] [PubMed]
- Oliveras-López, M.-J.; Berna, G.; Carneiro, E.M.; De La Serrana, H.L.-G.; Martin, F.; López, M.C. An Extra-Virgin Olive Oil Rich in Polyphenolic Compounds Has Antioxidant Effects in Of1 Mice. J. Nutr. 2008, 138, 1074–1078. [Google Scholar] [CrossRef] [Green Version]
- Choi, H.G.; Je, I.-G.; Kim, G.J.; Choi, H.; Kim, S.H.; Kim, J.A.; Lee, K.S.H. Anti-allergic inflammatory activities of compounds of amomi fructus. Nat. Prod. Commun. 2015, 10, 631–632. [Google Scholar] [CrossRef] [Green Version]
- Church, M.K.; Levi-Schaffer, F. The human mast cell. J. Allergy Clin. Immunol. 1997, 99, 155–160. [Google Scholar] [CrossRef]
- Petersen, L.J.; Mosbech, H.; Skov, P.S. Allergen-induced histamine release in intact human skin in vivo assessed by skin microdialysis technique: Characterization of factors influencing histamine releasability. J. Allergy Clin. Immunol. 1996, 97, 672–679. [Google Scholar] [CrossRef]
- Uranga, J.A.; Martínez, V.; Abalo, R. Mast Cell Regulation and Irritable Bowel Syndrome: Effects of Food Components with Potential Nutraceutical Use. Molecules 2020, 25, 4314. [Google Scholar] [CrossRef] [PubMed]
- Wouther, M.M.; Vicario, M.; Santos, I. The role of mast cells in functional gut disorders. Gut 2016, 65, 155–168. [Google Scholar] [CrossRef] [Green Version]
- Wouters, M.M.; Balemans, D.; Van Wanrooy, S.; Dooley, J.; Cibert-Goton, V.; Alpizar, Y.A.; Valdez-Morales, E.E.; Nasser, Y.; Van Veldhoven, P.P.; Vanbrabant, W.; et al. Histamine Receptor H1-Mediated Sensitization of TRPV1 Mediates Visceral Hypersensitivity and Symptoms in Patients with Irritable Bowel Syndrome. Gastroenterology 2016, 150, 875–887. [Google Scholar] [CrossRef] [PubMed] [Green Version]
- Mendonça, L.A.B.M.; Dos Santos Ferreira, R.; de Cássia Avellaneda Guimarães, R.; de Castro, A.; Franco, O.L.; Matias, R.; Carvalho, C. The Complex Puzzle of Interactions Among Functional Food, Gut Microbiota, and Colorectal Cancer. Front. Oncol. 2018, 8, 325. [Google Scholar] [CrossRef] [PubMed]
- Quigliey, E.M.M. The spectrum of Small Intestinal Bacterial Overgrowth. Curr. Gastroenterol. Rep. 2019, 21, 3. [Google Scholar] [CrossRef]
- Takakura, W.; Pimentel, M. Small Intestinal Bacterial Overgrowth and Irritable Bowel Syndrome—An Update. Front. Psychiatry 2020, 11, 664. [Google Scholar] [CrossRef]
- Enck, P.; Aziz, Q.; Barbara, G.; Farmer, A.D.; Fukudo, S.; Mayer, E.A.; Niesler, B.; Quigley, E.M.M.; Rajilić-Stojanović, M.; Schemann, M.; et al. Irritable bowel syndrome. Nat. Rev. Dis. Primers 2016, 2, 16014. [Google Scholar] [CrossRef] [Green Version]
- Hawrelak, J.A.; Wohlmuth, H.; Pattinson, M.; Myers, S.P.; Goldenberg, J.Z.; Harnett, J.; Cooley, K.; Van De Venter, C.; Reid, R.; Whitten, D.L. Western herbal medicines in the treatment of irritable bowel syndrome: A systematic review and meta-analysis. Complement. Ther. Med. 2020, 48, 102233. [Google Scholar] [CrossRef]


| MOMAST® | TPC a | Total Phenols b | Hydroxytyrosol b | Tyrosol b | Oleuropein b |
|---|---|---|---|---|---|
| Plus30 | 85.61 ± 2.33 | 36.9 ± 0.19 | 25.88 ± 0.11 | 5.04 ± 0.02 | 1.80 ± 0.20 |
| HY100 | 70.54 ± 1.95 | 53.4 ± 1.21 | 38.32 ± 0.03 | 8.40 ± 0.03 | - |
| PW25 | 0.48 ± 0.01 | 29.31 ± 0.62 | 21.46 ± 0.03 | 3.20 ± 0.01 | - |
| DPPH a | ||
|---|---|---|
| MOMAST® | Plus30 | 5.44 ± 0.30 |
| HY100 | 4.65 ± 0.22 | |
| PW25 | 6.29 ± 0.05 | |
| GA b | 2.85 ± 0.01 |
| Ileum | Colon | |||||
|---|---|---|---|---|---|---|
| MOMAST® | Activity a | IC50 b (mg/mL) | 95% conf lim | Activity a | IC50 b (mg/mL) | 95% conf lim |
| Plus30 | 81 ± 2.7 | 2.30 | 1.10−2.80 | 75 ± 3.9 | 2.02 | 1.93−2.51 |
| HY100 | 76 ± 3.9 | 4.26 | 3.10−5.18 | 92 ± 2.4 | 3.56 | 2.78−3.70 |
| PW25 | 92 ± 2.4 | 1.15 | 0.96−1.37 | 15 ± 1.2 | ||
| (5) | ||||||
| Papaverine | 68 ± 3.3 | 0.0026 | 0.0022–0.0027 | 80 ± 4.1 | 0.00038 | 0.00033–0.00046 |
| (0.0037 mg/mL) | (mg/mL) | (mg/mL) | (0.011 mg/mL) | (mg/mL) | (mg/mL) | |
| (10 μM) | 6.86 | 5.96–6.34 | (8 μM) | 1.02 | 0.89–1.24 | |
| (μM) | (μM) | (μM) | (μM) | |||
| MOMAST® | Parameter | Ileum | Colon |
|---|---|---|---|
| Plus30 | Contraction amplitude | Increases significantly from 0.5 mg/mL | Decreases significantly up to 1.0 mg/mL, then returns to initial values |
| LF Band Power | Increases up to 0.5 mg/mL, then decreases | Increases at 0.1mg/mL, then decreases | |
| MF Band Power | Slightly increases at 0.1mg/mL, then decreases | Increases at 0.1mg/mL, then decreases | |
| HF Band Power | Increases significantly from 0.5 mg/mL | Decreases from 0.1 mg/mL | |
| HY100 | Contraction amplitude | Increases significantly with concentration | Slightly decreases up to 5.0 mg/mL |
| LF Band Power | No important modifications | Decreases from 5.0 mg/mL | |
| MF Band Power | Increases up to 5.0 mg/mL | Decreases from 5.0 mg/mL | |
| HF Band Power | No important modifications | Decreases from 5.0 mg/mL | |
| PW25 | Contraction amplitude | Increases at 0.1 mg/mL, then decreases | Decreases from 0.1 mg/mL |
| LF Band Power | Increases at 0.1 mg/mL, then decreases | Increases up to 1 mg/mL | |
| MF Band Power | Increases at 0.1 mg/mL, then decreases | Decreases up to 5.0 mg/mL | |
| HF Band Power | Increases at 0.1 mg/mL, then decreases | Decreases significantly with concentration | |
| Papaverine | Contraction amplitude | Not significant modifications | Decreases significantly with concentration |
| LF Band Power | Slightly decreases up to 0.5 µM, then increases | Decreases up to 5.0 µM, then increases | |
| MF Band Power | Increases with concentration | Decreases up to 1.0 µM, then increases | |
| HF Band Power | No important modifications | Decreases up to 5.0 µM then increases |
| Strain | Plus30 a | Norfloxacin a |
|---|---|---|
| ATCC | ||
| Gram + | ||
| Bacillus cereus (10876) | 2.1 | 1.9 |
| Enterococcus faecalis (29212) | 2.0 | 1.9 |
| Staphylococcus aureus (25923) | 2.5 | 2.2 |
| Staphylococcus aureus (29213) | 2.5 | 2.1 |
| Staphylococcus aureus (43300) | 2.5 | 2.0 |
| Staphylococcus aureus (6538P) | 2.5 | 2.3 |
| Gram − | ||
| Acinetobacter baumannii (19606) | 1.6 | 1.5 |
| Escherichia coli (25922) | 1.9 | 3.0 |
| Escherichia coli (35218) | 1.9 | 2.8 |
| Klebsiella pneumoniae (13883) | 1.8 | 1.6 |
| Pseudomonas aeruginosa (27853) | 1.8 | 2.5 |
| Clinical isolation b | ||
| Gram + | ||
| Enterococcus faecalis BS | 1.9 | 2.0 |
| Enterococcus faecalis RM 1011 | 1.8 | 2.0 |
| Enterococcus faecalis RM 2011 | 1.8 | 2.0 |
| Staphylococcus aureus 23 | 2.0 | 2.0 |
| Staphylococcus aureus 24 | 2.0 | 2.0 |
| Staphylococcus aureus DEL | 2.0 | 2.0 |
| Staphylococcus aureus IAC | 2.0 | 2.0 |
| Staphylococcus aureus TER | 2.0 | 2.0 |
| Gram − | ||
| Acinetobacter baumannii BSR | 1.5 | 1.5 |
| Citrobacter freundii BS | 1.9 | 1.5 |
| Escherichia coli ESBL | 1.0 | 2.5 |
| Klebsiella pneumoniae BSR | 1.2 | 1.6 |
| Proteus mirabilis BS | 1.7 | 1.4 |
| Strain | Plus30 (mg/mL) | Rifaximin (μg/mL) |
|---|---|---|
| ATCC | ||
| Gram + | ||
| Bacillus cereus (10876) | 16.20 | 0.05 |
| Enterococcus faecalis (29212) | 16.20 | 0.05 |
| Staphylococcus aureus (25923) | 4.00 | 0.10 |
| Staphylococcus aureus (29213) | 4.00 | 0.05 |
| Staphylococcus aureus (43300) | 2.00 | 3.12 |
| Staphylococcus aureus (6538P) | 2.00 | 0.05 |
| Gram − | ||
| Acinetobacter baumannii (19606) | 16.20 | 12.50 |
| Escherichia coli (25922) | 32.50 | 6.25 |
| Escherichia coli (35218) | 32.50 | 6.25 |
| Klebsiella pneumoniae (13883) | 4.00 | 12.50 |
| Pseudomonas aeruginosa (27853) | 32.50 | 6.25 |
| Clinical isolation a | ||
| Gram + | ||
| Enterococcus faecalis BS | 16.20 | 0.40 |
| Enterococcus faecalis RM 1011 | 16.20 | 0.10 |
| Enterococcus faecalis RM 2011 | 16.20 | 0.10 |
| Staphylococcus aureus 23 | 32.50 | 0.40 |
| Staphylococcus aureus 24 | 32.50 | 0.40 |
| Staphylococcus aureus DEL | 32.50 | 0.02 |
| Staphylococcus aureus IAC | 32.50 | 0.05 |
| Staphylococcus aureus TER | 32.50 | 0.05 |
| Gram − | ||
| Acinetobacter baumannii BSR | 65.00 | 25.00 |
| Citrobacter freundii BS | 32.50 | 12.50 |
| Escherichia coli ESBL | 32.50 | 6.20 |
| Klebsiella pneumoniae BSR | 65.00 | 25.00 |
| Proteus mirabilis BS | 16.20 | 6.20 |
| Strain | Plus30 (mg) | Rfx (μg) | Plus30 % | Rfx % | FICI | Reduction Plus30 | Reduction Rfx |
|---|---|---|---|---|---|---|---|
| ATCC | |||||||
| Gram + | |||||||
| Bacillus cereus (10876) | 16.25 | 0.05 | 5.00 | 0.20 | 0.05 | 20.00 | 500.00 |
| Enterococcus faecalis (2921) | 16.25 | 0.05 | 1.25 | 0.20 | 0.01 | 80.00 | 500.00 |
| Staphylococcus aureus (25923) | 4.00 | 0.10 | 0.30 | 0.80 | 0.01 | 333.30 | 125.00 |
| Staphylococcus aureus (29213) | 4.00 | 0.05 | 0.60 | 0.40 | 0.01 | 166.70 | 250.00 |
| Staphylococcus aureus (43300) | 2.00 | 3.12 | 0.30 | 0.20 | 0.01 | 333.30 | 500.00 |
| Staphylococcus aureus (6538P) | 2.00 | 0.05 | 1.25 | 0.40 | 0.02 | 80.00 | 250.00 |
| Gram − | |||||||
| Acinetobacter baumanni (19606) | 16.25 | 12.50 | 1.25 | 3.12 | 0.04 | 80.00 | 32.00 |
| Escherichia coli (25922) | 32.50 | 6.25 | 2.5 | 0.80 | 0.03 | 40.00 | 128.20 |
| Escherichia coli (35218) | 32.50 | 6.25 | 5.02 | 0.20 | 0.05 | 19.90 | 526.30 |
| Klebsiella pneumoniae (13883) | 4.00 | 12.50 | 5.00 | 0.20 | 0.05 | 20.00 | 500.00 |
| Pseudomonas aeruginosa (27853) | 32.5 | 6.25 | 2.5 | 0.20 | 0.03 | 40.00 | 526.30 |
| Clinical isolation a | |||||||
| Gram + | |||||||
| Enterococcus faecalis 1011 | 16.25 | 0.10 | 5. 00 | 0.20 | 0.05 | 20.00 | 500.00 |
| Enterococcus faecalis 2011 | 16.25 | 0.10 | 5. 00 | 0.20 | 0.05 | 20.00 | 500.00 |
| Enterococcus faecalis BS | 16.25 | 0.40 | 5. 00 | 0.20 | 0.05 | 20.00 | 500.00 |
| Staphylococcus aureus DEL | 32.50 | 0.02 | 2.50 | 0.20 | 0.03 | 40.00 | 500.00 |
| Staphylococcus aureus 23 | 32.50 | 0.40 | 0.30 | 0.80 | 0.01 | 333.30 | 125.00 |
| Staphylococcus aureus 24 | 32.50 | 0.40 | 0.30 | 0.80 | 0.01 | 333.30 | 125.00 |
| Staphylococcus aureus IAC | 32.50 | 0.05 | 2.50 | 0.20 | 0.03 | 40.00 | 500.00 |
| Staphylococcus aureus TER | 32.50 | 0.05 | 2.50 | 0.40 | 0.03 | 40.00 | 250.00 |
| Gram − | |||||||
| Acinetobacter baumanni BS | 65. 00 | 25. 00 | 0.60 | 0.20 | 0.01 | 166.70 | 526.30 |
| Citrobacter freundii BS | 32.50 | 12.50 | 2.50 | 0.20 | 0.03 | 40. 00 | 526.30 |
| Escherichia coli ESBL | 32.50 | 6.25 | 5. 00 | 0.20 | 0.05 | 20. 00 | 526.30 |
| Klebsiella pneumoniae BS | 65. 00 | 25. 00 | 0.20 | 1.25 | 0.01 | 500.00 | 80. 00 |
| Proteus mirabilis BS | 16.25 | 6.25 | 2.50 | 0.20 | 0.03 | 40.00 | 526.30 |
Publisher’s Note: MDPI stays neutral with regard to jurisdictional claims in published maps and institutional affiliations. |
© 2022 by the authors. Licensee MDPI, Basel, Switzerland. This article is an open access article distributed under the terms and conditions of the Creative Commons Attribution (CC BY) license (https://creativecommons.org/licenses/by/4.0/).
Share and Cite
Curci, F.; Corbo, F.; Clodoveo, M.L.; Salvagno, L.; Rosato, A.; Corazza, I.; Budriesi, R.; Micucci, M.; Mattioli, L.B. Polyphenols from Olive-Mill Wastewater and Biological Activity: Focus on Irritable Bowel Syndrome. Nutrients 2022, 14, 1264. https://0-doi-org.brum.beds.ac.uk/10.3390/nu14061264
Curci F, Corbo F, Clodoveo ML, Salvagno L, Rosato A, Corazza I, Budriesi R, Micucci M, Mattioli LB. Polyphenols from Olive-Mill Wastewater and Biological Activity: Focus on Irritable Bowel Syndrome. Nutrients. 2022; 14(6):1264. https://0-doi-org.brum.beds.ac.uk/10.3390/nu14061264
Chicago/Turabian StyleCurci, Francesca, Filomena Corbo, Maria Lisa Clodoveo, Lara Salvagno, Antonio Rosato, Ivan Corazza, Roberta Budriesi, Matteo Micucci, and Laura Beatrice Mattioli. 2022. "Polyphenols from Olive-Mill Wastewater and Biological Activity: Focus on Irritable Bowel Syndrome" Nutrients 14, no. 6: 1264. https://0-doi-org.brum.beds.ac.uk/10.3390/nu14061264