Dietary Intake according to Gender and Education: A Twenty-Year Trend in a Swiss Adult Population


 ,
,
Abstract
:1. Introduction
2. Experimental Section
2.1. Study Design and Sampling
2.2. Data Collected
2.3. Dietary Intake
2.4. Exclusion Criteria
2.5. Ethics Statement
2.6. Statistical Analysis
3. Results
3.1. Selection of Participants and Characteristics of the Final Sample

| 1993–1999 | 2000–2005 | 2006–2012 | p-Value | |
|---|---|---|---|---|
| Sample size | 6922 | 6034 | 4307 | |
| Women (%) | 3665 (53.0) | 3175 (52.6) | 2169 (50.4) | 0.02 |
| Age (years) | 51.8 ± 10.4 | 52.1 ± 10.7 | 52.3 ± 10.9 | 0.08 |
| BMI (kg/m2) | 24.5 ± 3.9 | 24.8 ± 4.0 | 25.1 ± 4.1 | <0.001 |
| Marital status (%) | ||||
| Single | 623 (9.0) | 631 (10.5) | 430 (10.0) | |
| Married/cohabitating | 5173 (74.7) | 4362 (72.3) | 3140 (72.9) | <0.001 |
| Divorced | 848 (12.3) | 806 (13.4) | 629 (14.6) | |
| Widowed | 278 (4.0) | 235 (3.9) | 108 (2.5) | |
| Education (%) | ||||
| University | 2111 (30.5) | 2105 (34.9) | 1872 (43.5) | <0.001 |
| Lower than university | 4811 (69.5) | 3929 (65.1) | 2435 (56.5) | |
| Smoking status (%) | ||||
| Never Smoked | 3070 (44.4) | 2690 (44.6) | 2015 (46.8) | 0.005 |
| Ex-Smoker | 2202 (31.8) | 1943 (32.2) | 1393 (32.3) | |
| Current smoker | 1650 (23.8) | 1401 (23.2) | 899 (20.9) | |
| Country of birth (%) | ||||
| Switzerland | 3946 (57.0) | 3300 (54.7) | 2252 (52.3) | <0.001 |
| Other | 2976 (43.0) | 2734 (45.3) | 2055 (47.7) |
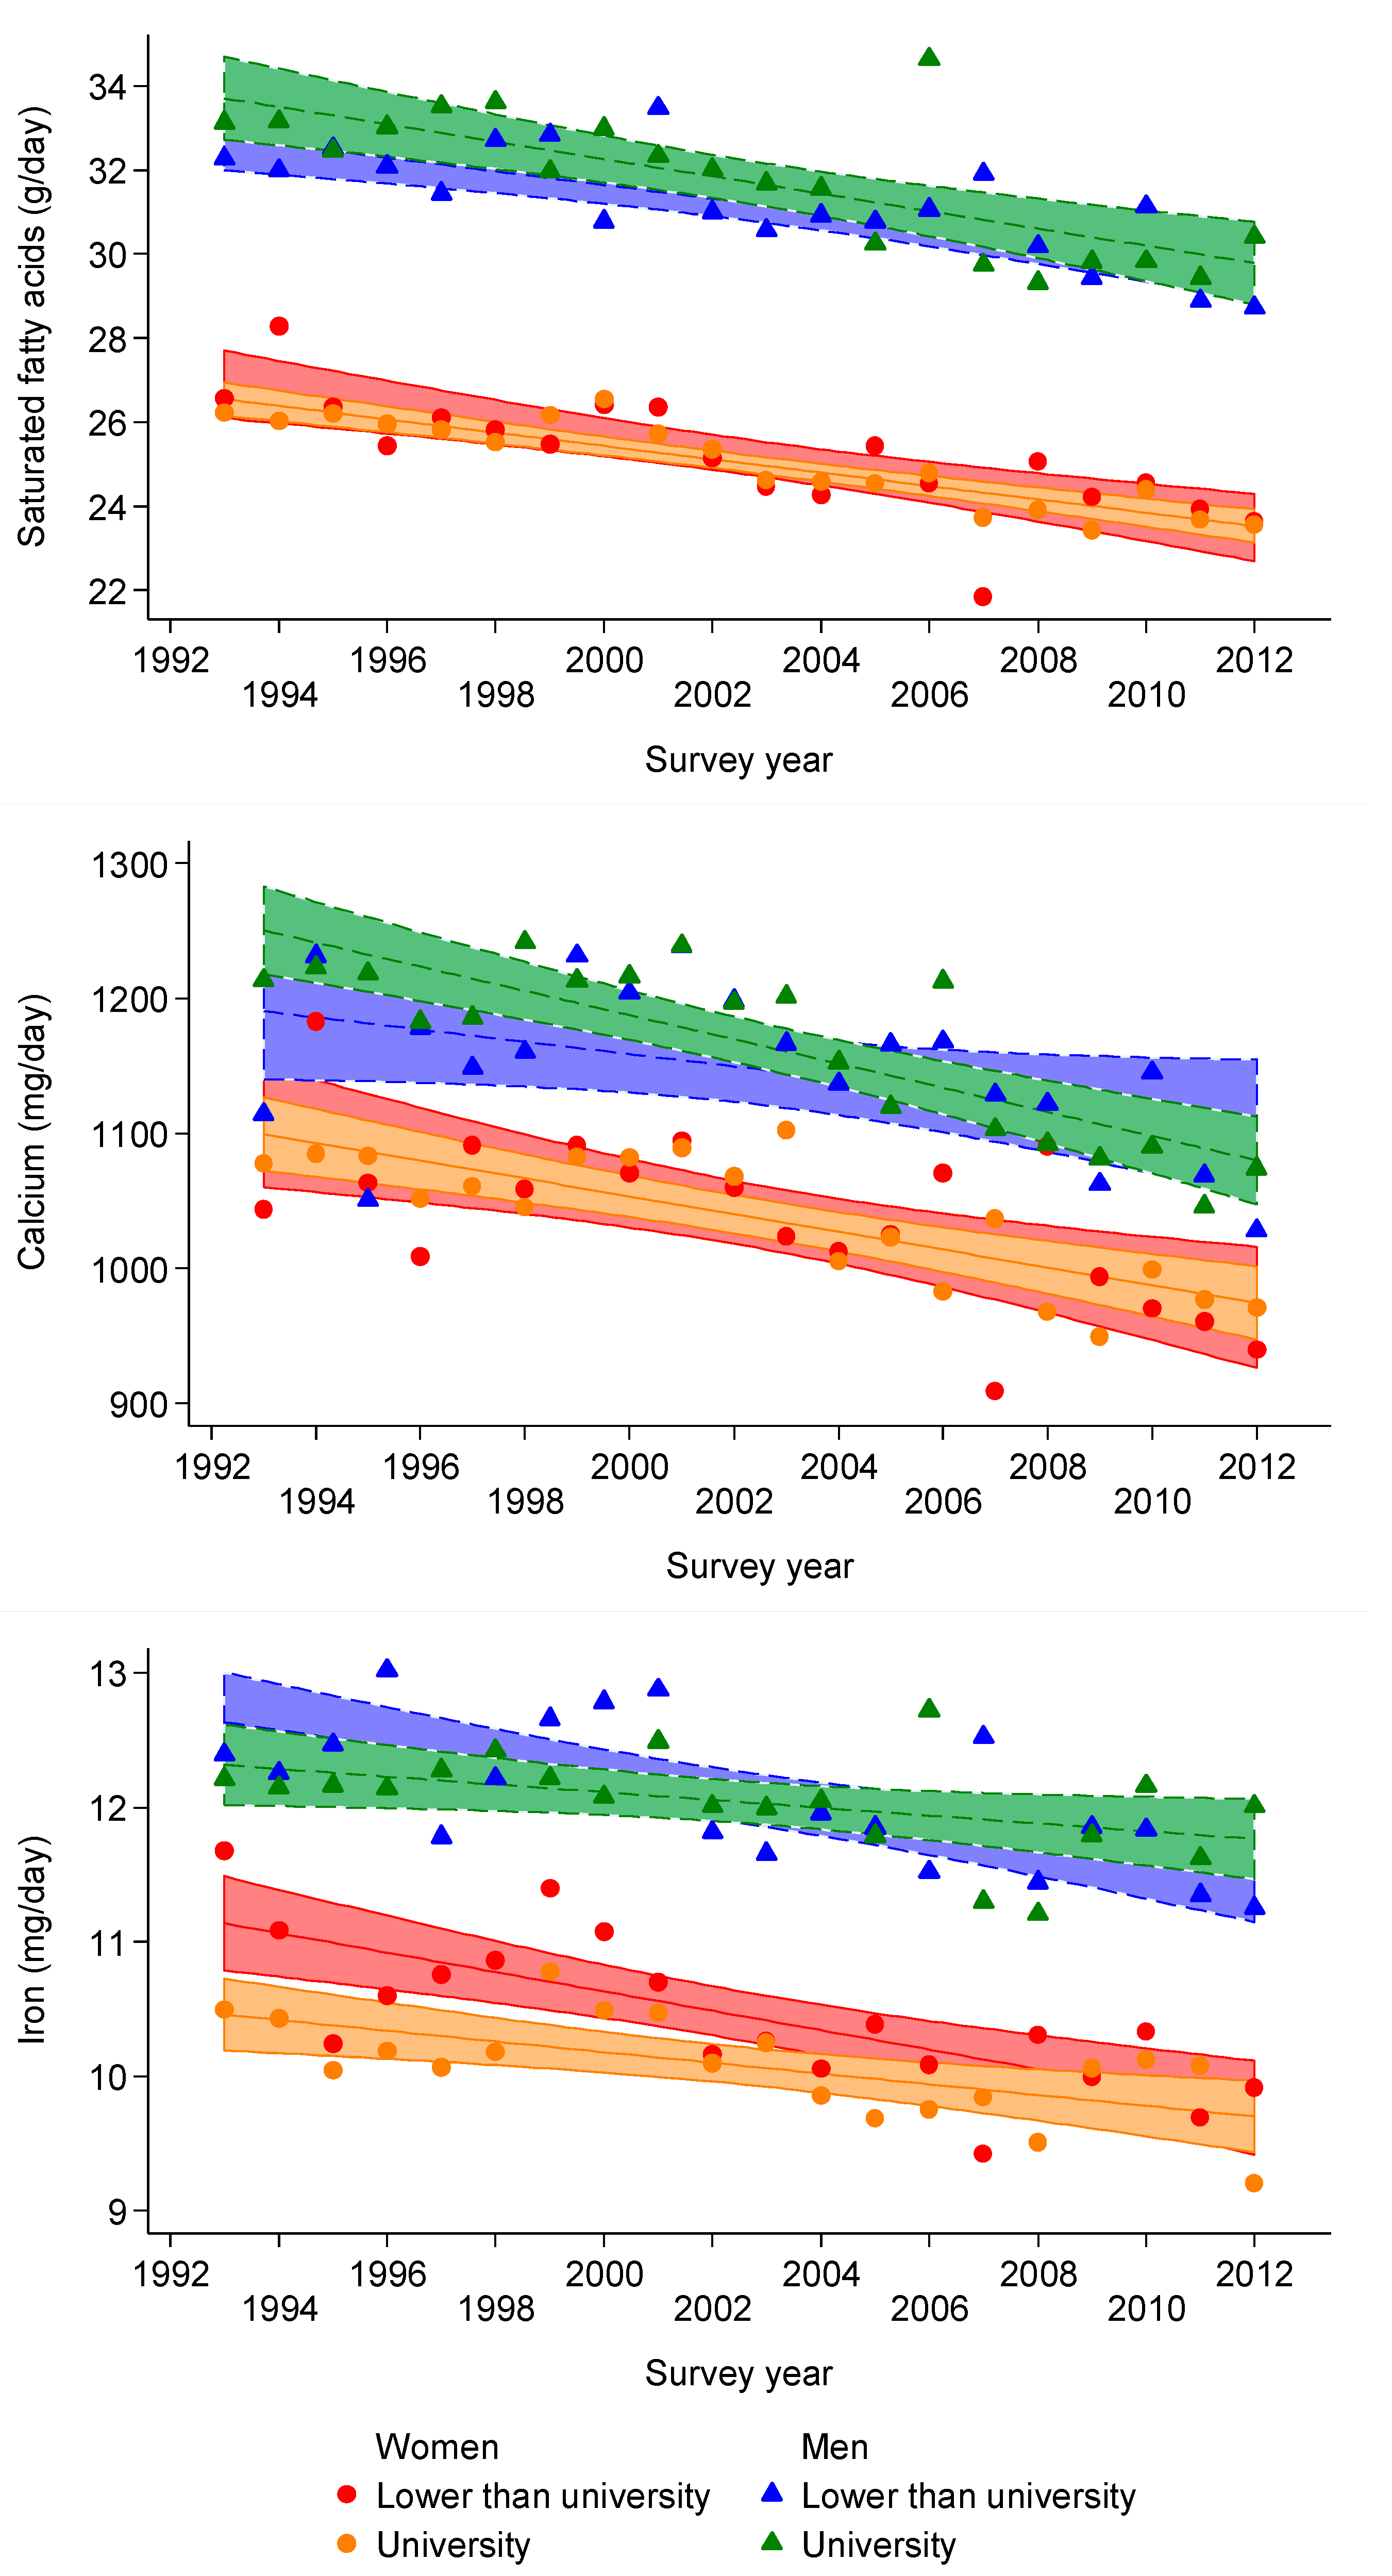
3.2. Trends in Energy and Nutrient Intake
| Men | Women | |||||||||||||
|---|---|---|---|---|---|---|---|---|---|---|---|---|---|---|
| 1993–1999 | 2000–2005 | 2006–2012 | 1993–1999 | 2000–2005 | 2006–2012 | |||||||||
| Sample Size | 3257 | 2859 | 2138 | 3665 | 3175 | 2169 | ||||||||
| Mean | SE | Mean | SE | Mean | SE | p-Value | Mean | SE | Mean | SE | Mean | SE | p-Value | |
| Total energy (Kcal/day) | 2195 | 11 | 2185 | 12 | 2104 | 14 | <0.001 | 1808 | 9 | 1799 | 10 | 1734 | 12 | <0.001 |
| Macronutrients (g/day) | ||||||||||||||
| Proteins | ||||||||||||||
| Total | 82.5 | 0.3 | 83.5 | 0.3 | 83.8 | 0.3 | 0.005 | 69.6 | 0.2 | 70.0 | 0.2 | 70.0 | 0.3 | 0.31 |
| Vegetal | 24.9 | 0.1 | 25.1 | 0.1 | 25.2 | 0.1 | 0.35 | 21.6 | 0.1 | 21.5 | 0.1 | 21.8 | 0.1 | 0.04 |
| Animal | 57.6 | 0.3 | 58.4 | 0.3 | 58.7 | 0.4 | 0.06 | 48.0 | 0.3 | 48.6 | 0.3 | 48.2 | 0.3 | 0.33 |
| Carbohydrates | ||||||||||||||
| Total | 239 | 1 | 241 | 1 | 244 | 1 | 0.002 | 205 | 1 | 205 | 1 | 208 | 1 | 0.02 |
| Mono/disaccharides | 102 | 1 | 104 | 1 | 108 | 1 | <0.001 | 99 | 0.6 | 101 | 1 | 103 | 1 | 0.003 |
| Polysaccharides | 136 | 1 | 136 | 1 | 135 | 1 | 0.66 | 106 | 1 | 104 | 1 | 105 | 1 | 0.12 |
| Fibers | ||||||||||||||
| Total | 16.1 | 0.1 | 16.3 | 0.1 | 16.6 | 0.1 | <0.001 | 16.6 | 0.1 | 16.5 | 0.1 | 16.8 | 0.1 | 0.34 |
| Cereal | 8.6 | 0.1 | 8.7 | 0.1 | 8.3 | 0.1 | 0.03 | 7.8 | 0.1 | 7.3 | 0.1 | 7.3 | 0.1 | <0.001 |
| Fruits and vegetables | 6.8 | 0.1 | 7.1 | 0.1 | 7.7 | 0.1 | <0.001 | 8.3 | 0.1 | 8.7 | 0.1 | 9.0 | 0.1 | <0.001 |
| Fat | ||||||||||||||
| Total | 82.7 | 0.3 | 82.5 | 0.3 | 83.2 | 0.4 | 0.36 | 70.2 | 0.2 | 70.6 | 0.3 | 70.4 | 0.3 | 0.48 |
| SFA | 32.2 | 0.1 | 31.6 | 0.2 | 31.2 | 0.2 | <0.001 | 25.6 | 0.1 | 25.3 | 0.1 | 24.8 | 0.1 | <0.001 |
| MUFA | 31.5 | 0.1 | 32.3 | 0.2 | 33.4 | 0.2 | <0.001 | 27.6 | 0.1 | 28.8 | 0.1 | 29.3 | 0.2 | <0.001 |
| PUFA | 12.5 | 0.1 | 12 | 0.1 | 11.8 | 0.1 | <0.001 | 10.9 | 0.1 | 10.4 | 0.1 | 10.0 | 0.1 | <0.001 |
| Micronutrients | ||||||||||||||
| Cholesterol (mg/day) | 358 | 2 | 357 | 2 | 361 | 3 | 0.60 | 294 | 2 | 290 | 2 | 298 | 2 | <0.05 |
| Calcium (mg/day) | 1178 | 8 | 1188 | 9 | 1126 | 10 | <0.001 | 1058 | 6 | 1058 | 7 | 1008 | 8 | <0.001 |
| Iron (mg/day) | 12.2 | 0.04 | 12.1 | 0.04 | 12.1 | 0.04 | 0.13 | 10.4 | 0.03 | 10.3 | 0.03 | 10.2 | 0.04 | <0.001 |
| Vitamin A (μg RAE/day) | 924 | 10 | 869 | 11 | 887 | 12 | <0.001 | 893 | 9 | 856 | 10 | 848 | 12 | 0.004 |
| Retinol (µg/day) | 651 | 9 | 580 | 10 | 570 | 11 | <0.001 | 560 | 8 | 501 | 9 | 455 | 11 | <0.001 |
| Carotene (µg/day) | 3283 | 44 | 3465 | 47 | 3812 | 55 | <0.001 | 3990 | 54 | 4262 | 58 | 4714 | 71 | <0.001 |
| Vitamin D (µg/day) | 2.86 | 0.03 | 2.83 | 0.04 | 2.95 | 0.04 | 0.09 | 2.76 | 0.03 | 2.67 | 0.03 | 2.84 | 0.04 | 0.003 |
| Alcohol (g/day) * | 21 | 0.4 | 19.6 | 0.4 | 16.8 | 0.4 | <0.001 | 9.2 | 0.2 | 8.4 | 0.2 | 7.1 | 0.3 | <0.001 |
| All | p-Value | High | p-Value | Low | p-Value | p-Value § | p-Value §§ | ||||||||
|---|---|---|---|---|---|---|---|---|---|---|---|---|---|---|---|
| (a): Men | |||||||||||||||
| Sample Size | 8254 | 3006 | 5248 | ||||||||||||
| Total energy (Kcal/day/year) | −6.9 (−9.4; −4.3) | <0.001 | −9.6 (−13.6; −5.6) | <0.001 | −4.6 (−8.0; −1.3) | 0.006 | 0.06 | 0.053 | |||||||
| Macronutrients (g/day/year) | |||||||||||||||
| Proteins | |||||||||||||||
| Total | 0.12 (0.06; 0.18) | <0.001 | 0.16 (0.06; 0.25) | 0.001 | 0.09 (0.01; 0.18) | 0.03 | 0.43 | 0.40 | |||||||
| Vegetal | 0.02 (−0.01; 0.04) | 0.14 | 0.00 (−0.04; 0.04) | 0.98 | 0.02 (−0.01; 0.06) | 0.18 | 0.17 | 0.29 | |||||||
| Animal | 0.10 (0.03; 0.17) | 0.004 | 0.16 (0.05; 0.27) | 0.005 | 0.07 (−0.02; 0.16) | 0.13 | 0.23 | 0.26 | |||||||
| Carbohydrates | 0.34 (0.15; 0.53) | <0.001 | 0.21 (−0.08; 0.50) | 0.16 | 0.44 (0.19; 0.69) | <0.001 | 0.11 | 0.21 | |||||||
| Mono/disaccharides | 0.40 (0.25; 0.55) | <0.001 | 0.35 (0.11; 0.58) | 0.004 | 0.46 (0.26; 0.66) | <0.001 | 0.50 | 0.56 | |||||||
| Polysaccharides | −0.05 (−0.22; 0.11) | 0.52 | −0.14 (−0.40; 0.12) | 0.30 | −0.01 (−0.23; 0.20) | 0.92 | 0.20 | 0.35 | |||||||
| Fibers (g/day/year) | |||||||||||||||
| Total | 0.03 (0.01; 0.06) | 0.02 | 0.01 (−0.04; 0.05) | 0.79 | 0.04 (0.00; 0.07) | 0.03 | 0.12 | 0.22 | |||||||
| Cereal | −0.03 (−0.05; −0.01) | 0.01 | −0.05 (−0.08; −0.01) | 0.01 | −0.02 (−0.05; 0.01) | 0.12 | 0.13 | 0.18 | |||||||
| Fruits and vegetables | 0.06 (0.05; 0.08) | <0.001 | 0.06 (0.03; 0.08) | <0.001 | 0.06 (0.04; 0.09) | <0.001 | 0.35 | 0.65 | |||||||
| Fat (g/day/year) | |||||||||||||||
| Total | 0.03 (−0.03; 0.10) | 0.30 | 0.06 (−0.04; 0.16) | 0.24 | 0.00 (−0.08; 0.09) | 0.97 | 0.14 | 0.42 | |||||||
| SFA | −0.08 (−0.11; −0.04) | <0.001 | −0.03 (−0.08; 0.02) | 0.20 | −0.11 (−0.15; −0.06) | <0.001 | 0.002 | 0.03 | |||||||
| MUFA | 0.15 (0.11; 0.18) | <0.001 | 0.13 (0.08; 0.19) | <0.001 | 0.14 (0.10; 0.18) | <0.001 | 0.95 | 0.78 | |||||||
| PUFA | −0.06 (−0.07; −0.04) | <0.001 | −0.07 (−0.09; −0.04) | <0.001 | −0.05 (−0.07; −0.03) | <0.001 | 0.47 | 0.47 | |||||||
| Micronutrients | |||||||||||||||
| Cholesterol (mg/day/year) | 0.29 (−0.17; 0.75) | 0.22 | 0.54 (−0.22; 1.30) | 0.16 | 0.06 (−0.53; 0.64) | 0.85 | 0.36 | 0.39 | |||||||
| Calcium (mg/day/year) | −3.45 (−5.34; −1.57) | <0.001 | −1.03 (−3.84; 1.78) | 0.47 | −5.24 (−7.78; −2.70) | <0.001 | 0.005 | 0.03 | |||||||
| Iron (mg/day/year) | −0.01 (−0.02; 0.00) | 0.08 | −0.02 (−0.03; −0.001) | 0.01 | −0.01 (−0.02; 0.01) | 0.35 | 0.10 | 0.15 | |||||||
| Vitamin A (μg RAE/day) | −3.45 (−5.66; −1.23) | 0.002 | −3.57 (−6.91; −0.23) | 0.04 | −3.67 (−6.63; −0.70) | 0.02 | 0.82 | 0.90 | |||||||
| Retinol (µg/day/year) | −6.57 (−8.63; −4.50) | <0.001 | −6.24 (−9.34; −3.14) | <0.001 | −6.74 (−9.52; −3.96) | <0.001 | 0.65 | 0.75 | |||||||
| Carotene (µg/day/year) | 37.4 (27.6; 47.3) | <0.001 | 32.1 (15.5; 48.6) | <0.001 | 36.9 (24.5; 49.2) | <0.001 | 0.59 | 0.65 | |||||||
| Vitamin D (µg/day/year) | 0.01 (0.00; 0.01) | 0.08 | 0.01 (−0.01; 0.02) | 0.33 | 0.00 (−0.01; 0.01) | 0.85 | 0.53 | 0.52 | |||||||
| Alcohol (g/day/year) | −0.31 (−0.39; −0.24) | <0.001 | −0.29 (−0.39; −0.18) | <0.001 | −0.32 (−0.43; −0.21) | <0.001 | 0.70 | 0.56 | |||||||
| (b): Women | |||||||||||||||
| Sample Size | 9009 | 3082 | 5927 | ||||||||||||
| Total energy (Kcal/day/year) | −5.3 (−7.4; −3.1) | <0.001 | −7.5 (−11.1; −3.8) | <0.001 | −4.6 (−7.3; −1.9) | 0.001 | 0.20 | 0.21 | |||||||
| Macronutrients (g/day/year) | |||||||||||||||
| Proteins | |||||||||||||||
| Total | 0.03 (−0.02; 0.09) | 0.20 | −0.04 (−0.13; 0.05) | 0.39 | 0.07 (0.01; 0.14) | 0.03 | 0.06 | 0.06 | |||||||
| Vegetal | 0.02 (−0.005; 0.04) | 0.13 | 0.02 (−0.01; 0.06) | 0.19 | 0.01 (−0.02; 0.04) | 0.56 | 0.50 | 0.56 | |||||||
| Animal | 0.02 (−0.04; 0.08) | 0.54 | −0.06 (−0.16; 0.04) | 0.23 | 0.07 (−0.01; 0.15) | 0.09 | 0.06 | 0.07 | |||||||
| Carbohydrates | 0.18 (0.03; 0.34) | 0.02 | 0.28 (0.03; 0.54) | 0.03 | 0.16 (−0.04; 0.35) | 0.12 | 0.39 | 0.51 | |||||||
| Mono/disaccharides | 0.27 (0.13; 0.41) | <0.001 | 0.23 (0.00; 0.46) | 0.05 | 0.31 (0.13; 0.49) | 0.001 | 0.70 | 0.57 | |||||||
| Polysaccharides | −0.08 (−0.22; 0.06) | 0.27 | 0.06 (−0.17; 0.29) | 0.62 | −0.15 (−0.32; 0.03) | 0.10 | 0.18 | 0.19 | |||||||
| Fibers (g/day/year) | |||||||||||||||
| Total | 0.01 (−0.02; 0.03) | 0.54 | 0.00 (−0.04; 0.04) | 0.90 | 0.01 (−0.02; 0.04) | 0.65 | 0.68 | 0.63 | |||||||
| Cereal | −0.04 (−0.06; −0.03) | <0.001 | −0.05 (−0.08; −0.02) | <0.001 | −0.05 (−0.07; −0.02) | <0.001 | 0.92 | 0.86 | |||||||
| Fruits and vegetables | 0.06 (0.04; 0.08) | <0.001 | 0.05 (0.02; 0.08) | <0.001 | 0.06 (0.03; 0.08) | <0.001 | 0.58 | 0.61 | |||||||
| Fat (g/day/year) | |||||||||||||||
| Total | 0.01 (−0.04; 0.07) | 0.68 | 0.04 (−0.05; 0.14) | 0.39 | 0.00 (−0.07; 0.07) | 0.94 | 0.39 | 0.44 | |||||||
| SFA | −0.07 (−0.09; −0.04) | <0.001 | −0.05 (−0.09; −0.01) | 0.03 | −0.07 (−0.11; −0.04) | <0.001 | 0.22 | 0.36 | |||||||
| MUFA | 0.14 (0.11; 0.17) | <0.001 | 0.15 (0.10; 0.20) | <0.001 | 0.13 (0.09; 0.17) | <0.001 | 0.71 | 0.68 | |||||||
| PUFA | −0.08 (−0.09; −0.06) | <0.001 | −0.07 (−0.09; −0.05) | <0.001 | −0.07 (−0.09; −0.06) | <0.001 | 0.88 | 0.76 | |||||||
| Micronutrients | |||||||||||||||
| Cholesterol (mg/day/year) | 0.25 (−0.16; 0.66) | 0.23 | 0.36 (−0.37; 1.10) | 0.33 | 0.17 (−0.32; 0.67) | 0.49 | 0.77 | 0.69 | |||||||
| Calcium (mg/day/year) | −3.69 (−5.19; −2.19) | <0.001 | −3.83 (−6.27; −1.38) | 0.002 | −3.68 (−5.59; −1.77) | <0.001 | 0.73 | 0.97 | |||||||
| Iron (mg/day/year) | −0.02 (−0.02; −0.01) | <0.001 | −0.03 (−0.04; −0.02) | <0.001 | −0.01 (−0.02; 0.00) | 0.04 | 0.001 | 0.002 | |||||||
| Vitamin A (μg RAE/day) | −4.47 (−6.62; −2.31) | <0.001 | −4.24 (−7.73; −0.76) | 0.02 | −4.54 (−7.30; −1.78) | 0.02 | 0.87 | 0.85 | |||||||
| Retinol (µg/day/year) | −8.93 (−10.9; −7.01) | <0.001 | −8.57 (−11.5; −5.61) | <0.001 | −8.76 (−11.3; −6.25) | <0.001 | 0.81 | 0.78 | |||||||
| Carotene (µg/day/year) | 53.6 (41.0; 66.2) | <0.001 | 51.9 (28.9; 74.9) | <0.001 | 50.7 (35.7; 65.7) | <0.001 | 0.92 | 0.90 | |||||||
| Vitamin D (µg/day/year) | 0.01 (0.00; 0.01) | 0.13 | 0.01 (−0.01; 0.02) | 0.40 | 0.00 (−0.01; 0.01) | 0.58 | 0.90 | 0.82 | |||||||
| Alcohol (g/day/year) | −0.14 (−0.18; −0.09) | <0.001 | −0.19 (−0.27; −0.12) | <0.001 | −0.13 (−0.18; −0.07) | <0.001 | 0.10 | 0.23 | |||||||

3.3. Educational Differences in Nutrient Intake
| Men | Women | |||||||
|---|---|---|---|---|---|---|---|---|
| 1993–1999 | p-Value | 2006–2012 | p-Value | 1993–1999 | p-Value | 2006–2012 | p-Value | |
| Sample Size | 3257 | 2138 | 3665 | 2169 | ||||
| Total energy (Kcal/day) | 24.3 (−24.7; 73.3) | 0.33 | 70.6 (13.8; 127.4) | 0.02 | −55.8 (−97.3; −14.3) | 0.008 | −25.6 (−75.4; 24.1) | 0.31 |
| Macronutrients (g/day) | ||||||||
| Proteins | ||||||||
| Total | −0.20 (−1.35; 0.96) | 0.74 | −1.06 (−2.52; 0.39) | 0.15 | −0.12 (−1.12; 0.88) | 0.82 | 0.79 (−0.53; 2.12) | 0.24 |
| Vegetal | −0.45 (−0.93; 0.03) | 0.07 | −0.26 (−0.82; 0.29) | 0.36 | −0.42 (−0.83; −0.01) | 0.04 | −0.44 (−0.93; 0.06) | 0.08 |
| Animal | 0.26 (−1.06; 1.57) | 0.70 | −0.80 (−2.46; 0.86) | 0.34 | 0.31 (−0.84; 1.45) | 0.60 | 1.23 (−0.28; 2.74) | 0.11 |
| Carbohydrates | ||||||||
| Total | 0.78 (−2.81; 4.36) | 0.67 | 1.56 (−2.47; 5.59) | 0.45 | 1.94 (−1.03; 4.91) | 0.20 | 2.87 (−0.55; 6.30) | 0.10 |
| Mono/disaccharides | 0.50 (−2.41; 3.41) | 0.74 | −0.20 (−3.56; 3.16) | 0.91 | 0.05 (−2.6; 2.71) | 0.97 | 2.22 (−1.02; 5.47) | 0.18 |
| Polysaccharides | 0.12 (−3.05; 3.29) | 0.94 | 1.71 (−1.88; 5.29) | 0.35 | 1.80 (−0.88; 4.49) | 0.19 | 0.57 (−2.56; 3.71) | 0.72 |
| Fiber | ||||||||
| Total | −0.77 (−1.27; −0.27) | 0.002 | −0.69 (−1.27; −0.10) | 0.02 | −0.82 (−1.28; −0.36) | <0.001 | −0.52 (−1.08; 0.04) | 0.07 |
| Cereal | −0.60 (−1.01; −0.20) | 0.004 | −0.37 (−0.82; 0.08) | 0.10 | −0.52 (−0.87; −0.18) | <0.001 | −0.35 (−0.75; 0.05) | 0.08 |
| Fruits and vegetables | −0.12 (−0.43; 0.20) | 0.47 | −0.22 (−0.63; 0.20) | 0.31 | −0.28 (−0.63; 0.06) | 0.11 | −0.13 (−0.58; 0.31) | 0.55 |
| Fat | ||||||||
| Total | −1.66 (−2.92; −0.40) | 0.01 | −1.76 (−3.15; −0.37) | 0.01 | 0.48 (−0.58; 1.53) | 0.38 | −1.14 (−2.37; 0.08) | 0.07 |
| SFA | −0.19 (−0.82; 0.45) | 0.56 | −0.92 (−1.59; −0.25) | 0.007 | 0.48 (−0.04; 0.99) | 0.07 | −0.28 (−0.84; 0.29) | 0.34 |
| MUFA | −1.17 (−1.77; −0.57) | <0.001 | −0.88 (−1.61; −0.16) | 0.02 | −0.21 (−0.76; 0.33) | 0.45 | −1.02 (−1.72; −0.31) | 0.005 |
| PUFA | −0.08 (−0.42; 0.25) | 0.63 | 0.29 (−0.04; 0.62) | 0.09 | 0.28 (0.01; 0.54) | 0.04 | 0.25 (−0.01; 0.52) | 0.06 |
| Micronutrients | ||||||||
| Cholesterol (mg/day) | −7.71 (−16.3; 0.89) | 0.08 | −9.22 (−19.6; 1.10) | 0.08 | −0.03 (−7.73; 7.67) | 0.99 | −5.5 (−16.14; 5.14) | 0.31 |
| Calcium (mg/day) | 22.9 (−14.7; 60.5) | 0.23 | −46.9 (−85.5; −8.2) | 0.02 | 0.96 (−28.4; 30.3) | 0.95 | −15.0 (−47.6; 17.6) | 0.37 |
| Iron (mg/day) | −0.29 (−0.45; −0.13) | <0.003 | −0.13 (−0.30; 0.05) | 0.15 | −0.38 (−0.51; −0.24) | <0.001 | −0.06 (−0.21; 0.10) | 0.48 |
| Vitamin A (μg RAE/day) | −27.6 (−70.8; 15.6) | 0.21 | −9.9 (−58.7; 38.9) | 0.69 | −11.5 (−54.5; 31.6) | 0.60 | −37.8 (−82.1; 6.6) | 0.10 |
| Retinol (µg/day) | −2.4 (−43.2; 38.5) | 0.91 | 10.0 (−35.4; 55.5) | 0.67 | 22.3 (−17.0; 61.6) | 0.27 | −8.7 (−46.6; 29.2) | 0.65 |
| Carotene (µg/day) | −303 (−480; −125) | <0.001 | −239 (−470; −8) | 0.04 | −406 (−628; −183) | <0.001 | −349 (−667; −31) | 0.03 |
| Vitamin D (µg/day) | −0.46 (−0.60; −0.31) | <0.001 | −0.52 (−0.70; −0.35) | <0.001 | −0.30 (−0.43; −0.17) | <0.001 | −0.30 (−0.47; −0.13) | <0.001 |
| Alcohol | 1.87 (0.31; 3.43) | 0.02 | 1.92 (0.40; 3.44) | 0.01 | −1.64 (−2.59; −0.69) | 0.001 | −0.65 (−1.51; 0.20) | 0.13 |
3.4. Sensitivity Analyses
4. Discussion
4.1. Trends in Energy and Nutrient Intake
4.2. Educational Differences in Nutrient Intake
4.3. Strengths and Limitations
5. Conclusions
Supplementary Materials
Acknowledgments
Author Contributions
Conflicts of Interest
References
- Wang, D.D.; Leung, C.W.; Li, Y.; Ding, E.L.; Chiuve, S.E.; Hu, F.B.; Willett, W.C. Trends in dietary quality among adults in the united states, 1999 through 2010. JAMA Intern. Med. 2014, 174, 1587–1595. [Google Scholar] [CrossRef] [PubMed]
- Panagiotakos, D.B.; Pitsavos, C.; Stefanadis, C. Dietary patterns: A mediterranean diet score and its relation to clinical and biological markers of cardiovascular disease risk. Nutr. Metab. Cardiovasc. Dis. 2006, 16, 559–568. [Google Scholar] [CrossRef] [PubMed]
- Roberts, C.K.; Barnard, R.J. Effects of exercise and diet on chronic disease. J. Appl. Physiol. 2005, 98, 3–30. [Google Scholar] [CrossRef] [PubMed]
- Drewnowski, A.; Monsivais, P.; Maillot, M.; Darmon, N. Low-energy-density diets are associated with higher diet quality and higher diet costs in french adults. J. Am. Diet. Assoc. 2007, 107, 1028–1032. [Google Scholar] [CrossRef] [PubMed]
- Darmon, N.; Drewnowski, A. Does social class predict diet quality? Am. J. Clin. Nutr. 2008, 87, 1107–1117. [Google Scholar] [PubMed]
- Beghin, L.; Dauchet, L.; De Vriendt, T.; Cuenca-Garcia, M.; Manios, Y.; Toti, E.; Plada, M.; Widhalm, K.; Repasy, J.; Huybrechts, I.; et al. Influence of parental socio-economic status on diet quality of european adolescents: Results from the helena study. Br. J. Nutr. 2013, 111, 1303–1312. [Google Scholar] [CrossRef] [PubMed]
- Naghavi, M.; Wang, H.D.; Lozano, R.; Davis, A.; Liang, X.F.; Zhou, M.G.; Vollset, S.E.; Ozgoren, A.A.; Abdalla, S.; Abd-Allah, F.; et al. Global, regional, and national age-sex specific all-cause and cause-specific mortality for 240 causes of death, 1990–2013: A systematic analysis for the Global Burden of Disease Study 2013. Lancet 2015, 385, 117–171. [Google Scholar] [CrossRef] [PubMed]
- Berghofer, A.; Pischon, T.; Reinhold, T.; Apovian, C.M.; Sharma, A.M.; Willich, S.N. Obesity prevalence from a european perspective: A systematic review. BMC Public Health 2008, 8, 200. [Google Scholar] [CrossRef] [PubMed]
- Finucane, M.M.; Stevens, G.A.; Cowan, M.J.; Danaei, G.; Lin, J.K.; Paciorek, C.J.; Singh, G.M.; Gutierrez, H.R.; Lu, Y.; Bahalim, A.N.; et al. National, regional, and global trends in body-mass index since 1980: Systematic analysis of health examination surveys and epidemiological studies with 960 country-years and 9.1 million participants. Lancet 2011, 377, 557–567. [Google Scholar] [CrossRef]
- Guerra, F.; Paccaud, F.; Marques-Vidal, P. Trends in food availability in switzerland, 1961–2007. Eur. J. Clin. Nutr. 2012, 66, 273–275. [Google Scholar] [CrossRef] [PubMed]
- Perrin, A.E.; Simon, C.; Hedelin, G.; Arveiler, D.; Schaffer, P.; Schlienger, J.L. Ten-year trends of dietary intake in a middle-aged french population: Relationship with educational level. Eur. J. Clin. Nutr. 2002, 56, 393–401. [Google Scholar] [CrossRef] [PubMed]
- Galobardes, B.; Morabia, A.; Bernstein, M.S. Diet and socioeconomic position: Does the use of different indicators matter? Int. J. Epidemiol. 2001, 30, 334–340. [Google Scholar] [CrossRef] [PubMed]
- Galobardes, B.; Costanza, M.C.; Bernstein, M.S.; Delhumeau, C.; Morabia, A. Trends in risk factors for lifestyle-related diseases by socioeconomic position in geneva, switzerland, 1993–2000: Health inequalities persist. Am. J. Public Health 2003, 93, 1302–1309. [Google Scholar] [CrossRef] [PubMed]
- Morabia, A.; Bernstein, M.; Heritier, S.; Ylli, A. Community-based surveillance of cardiovascular risk factors in geneva: Methods, resulting distributions, and comparisons with other populations. Prev. Med. 1997, 26, 311–319. [Google Scholar] [CrossRef] [PubMed]
- Morabia, A.; Bernstein, M.; Kumanyika, S.; Sorenson, A.; Mabiala, I.; Prodolliet, B.; Rolfo, I.; Luong, B.L. Development and validation of a semi-quantitative food questionnaire based on a population survey. Soz. Praventivmedizin 1994, 39, 345–369. [Google Scholar] [CrossRef]
- Imamura, F.; Micha, R.; Khatibzadeh, S.; Fahimi, S.; Shi, P.; Powles, J.; Mozaffarian, D. Dietary quality among men and women in 187 countries in 1990 and 2010: A systematic assessment. Lancet Glob. Health 2015, 3, e132–e142. [Google Scholar] [CrossRef]
- Micha, R.; Khatibzadeh, S.; Shi, P.; Fahimi, S.; Lim, S.; Andrews, K.G.; Engell, R.E.; Powles, J.; Ezzati, M.; Mozaffarian, D.; et al. Global, regional, and national consumption levels of dietary fats and oils in 1990 and 2010: A systematic analysis including 266 country-specific nutrition surveys. BMJ (Clin. Res. Ed.) 2014, 348, g2272. [Google Scholar] [CrossRef] [PubMed] [Green Version]
- Freedman, L.S.; Commins, J.M.; Moler, J.E.; Arab, L.; Baer, D.J.; Kipnis, V.; Midthune, D.; Moshfegh, A.J.; Neuhouser, M.L.; Prentice, R.L.; et al. Pooled results from 5 validation studies of dietary self-report instruments using recovery biomarkers for energy and protein intake. Am. J. Epidemiol. 2014, 180, 172–188. [Google Scholar] [CrossRef] [PubMed]
- De Abreu, D.; Guessous, I.; Vaucher, J.; Preisig, M.; Waeber, G.; Vollenweider, P.; Marques-Vidal, P. Low compliance with dietary recommendations for food intake among adults. Clin. Nutr. 2013, 32, 783–788. [Google Scholar] [CrossRef] [PubMed]
- Abreu, D.; Cardoso, I.; Gaspoz, J.M.; Guessous, I.; Marques-Vidal, P. Trends in dietary intake in Switzerland, 1999 to 2009. Public Health Nutr. 2013, 17, 479–485. [Google Scholar] [CrossRef] [PubMed]
- Iqbal, R.; Ajayan, K.; Bharathi, A.V.; Zhang, X.; Islam, S.; Soman, C.R.; Merchant, A.T. Refinement and validation of an FFQ developed to estimate macro- and micronutrient intakes in a south Indian population. Public Health Nutr. 2009, 12, 12–18. [Google Scholar] [CrossRef] [PubMed]
- Chen, Q.; Marques-Vidal, P. Trends in food availability in portugal in 1966–2003: Comparison with other mediterranean countries. Eur. J. Nutr. 2007, 46, 418–427. [Google Scholar] [CrossRef] [PubMed]
- Marques-Vidal, P.; Waeber, G.; Vollenweider, P.; Bochud, M.; Stringhini, S.; Guessous, I. Sociodemographic and behavioural determinants of a healthy diet in Switzerland. Ann. Nutr. Metab. 2015, 67, 87–95. [Google Scholar] [CrossRef] [PubMed]
- Laurent-Jaccard, A.; de Matteis, L.; Hofstetter, J.R.; Schutz, Y. Are food preferences affected by body mass index, age, sex or tobacco? Schweiz. Med. Wochenschr. 1994, 124, 2039–2041. [Google Scholar] [PubMed]
- Food and Agricultural Organization Statistics Division (FAOSTAT). Food Balance/Food Supply—Livestock and Fish Primary Equivalent—Switzerland. Available online: http://faostat3.fao.org/browse/FB/*/E (accessed on 2 March 2015).
- Swiss Federal Office of Statistics. Production et Consommation de Poisson. Available online: http://www.bfs.admin.ch/bfs/portal/fr/index/themen/07/05/blank/data.html (accessed on 2 March 2015).
- Strobel, C.; Jahreis, G.; Kuhnt, K. Survey of n-3 and n-6 polyunsaturated fatty acids in fish and fish products. Lipids Health Dis. 2012, 11, 144. [Google Scholar] [CrossRef] [PubMed]
- Henriques, J.; Dick, J.R.; Tocher, D.R.; Bell, J.G. Nutritional quality of salmon products available from major retailers in the UK: Content and composition of n-3 long-chain PUFA. Br. J. Nutr. 2014, 112, 964–975. [Google Scholar] [CrossRef] [PubMed]
- World Wildlife Fund Switzerland. Graphiques et Tableaux Concernant L'évolution de la Consommation de Poissons et de Fruits de mer en Suisse; World Wildlife Fund Switzerland: Zürich, Switzerland, 2008; p. 7. [Google Scholar]
- Cladis, D.P.; Kleiner, A.C.; Freiser, H.H.; Santerre, C.R. Fatty acid profiles of commercially available finfish fillets in the united states. Lipids 2014, 49, 1005–1018. [Google Scholar] [CrossRef] [PubMed]
- InterAct, C. Dietary fibre and incidence of type 2 diabetes in eight European countries: The EPIC-InterAct Study and a meta-analysis of prospective studies. Diabetologia 2015, 58, 1394–1408. [Google Scholar] [CrossRef] [PubMed]
- Threapleton, D.E.; Greenwood, D.C.; Evans, C.E.; Cleghorn, C.L.; Nykjaer, C.; Woodhead, C.; Cade, J.E.; Gale, C.P.; Burley, V.J. Dietary fibre intake and risk of cardiovascular disease: Systematic review and meta-analysis. BMJ (Clin. Res. Ed.) 2013, 347, f6879. [Google Scholar] [CrossRef] [PubMed]
- De Abreu, D.; Guessous, I.; Gaspoz, J.M.; Marques-Vidal, P. Compliance with the swiss society for nutrition’s dietary recommendations in the population of geneva, switzerland: A 10-year trend study (1999–2009). J. Acad. Nutr. Diet. 2014, 114, 774–780. [Google Scholar] [CrossRef] [PubMed]
- Sorenson, A.W.; Delhumeau, C.; Bernstein, M.S.; Costanza, M.C.; Morabia, A. Impact of “mad cow disease” publicity on trends in meat and total vitamin a consumption in geneva between 1993 and 2000. Eur. J. Clin. Nutr. 2003, 57, 177–185. [Google Scholar] [CrossRef] [PubMed]
- Ordonnance sur les règles de la Circulation Routière (OCR). Available online: https://www.admin.ch/opc/fr/classified-compilation/19620246/index.html (accessed on 15 July 2015).
- Swiss Confederation. Alcohol in Road Traffic and Navigation. Available online: https://www.ch.ch/en/alcohol-in-road-traffic-and-navigation (accessed on 6 March 2015).
- Kim, K.; Hong, S.A.; Kim, M.K. Trends in nutritional inequality by educational level: A case of South Korea. Nutrition 2010, 26, 791–798. [Google Scholar] [CrossRef] [PubMed]
- Novakovic, R.; Cavelaars, A.; Geelen, A.; Nikolic, M.; Altaba, II; Vinas, B.R.; Ngo, J.; Golsorkhi, M.; Medina, M.W.; Brzozowska, A.; et al. Socio-economic determinants of micronutrient intake and status in europe: A systematic review. Public Health Nutr. 2014, 17, 1031–1045. [Google Scholar] [CrossRef] [PubMed]
- Bloomfield, K.; Grittner, U.; Kramer, S.; Gmel, G. Social inequalities in alcohol consumption and alcohol-related problems in the study countries of the EU concerted action “gender, culture and alcohol problems: A multi-national study”. Alcohol. Alcohol. 2006, 41, i26–i36. [Google Scholar] [CrossRef] [PubMed]
- Grittner, U.; Kuntsche, S.; Gmel, G.; Bloomfield, K. Alcohol consumption and social inequality at the individual and country levels—Results from an international study. Eur. J. Public Health 2013, 23, 332–339. [Google Scholar] [CrossRef] [PubMed]
- Bloomfield, K.; Gmel, G.; Neve, R.; Mustonen, H. Investigating gender convergence in alcohol consumption in Finland, Germany, The Netherlands, and Switzerland: A repeated survey analysis. Subst. Abus. 2001, 22, 39–53. [Google Scholar] [CrossRef] [PubMed]
- Stringhini, S.; Spencer, B.; Marques-Vidal, P.; Waeber, G.; Vollenweider, P.; Paccaud, F.; Bovet, P. Age and gender differences in the social patterning of cardiovascular risk factors in Switzerland: The colaus study. PLoS ONE 2012, 7, e49443. [Google Scholar] [CrossRef] [PubMed]
- Guessous, I.; Gaspoz, J.M.; Theler, J.M.; Kayser, B. Eleven-year physical activity trends in a Swiss urban area. Prev. Med. 2014, 59, 25–30. [Google Scholar] [CrossRef] [PubMed]
- Mozaffarian, D.; Fahimi, S.; Singh, G.M.; Micha, R.; Khatibzadeh, S.; Engell, R.E.; Lim, S.; Danaei, G.; Ezzati, M.; Powles, J.; et al. Global sodium consumption and death from cardiovascular causes. N. Engl. J. Med. 2014, 371, 624–634. [Google Scholar] [CrossRef] [PubMed]
- Powles, J.; Fahimi, S.; Micha, R.; Khatibzadeh, S.; Shi, P.; Ezzati, M.; Engell, R.E.; Lim, S.S.; Danaei, G.; Mozaffarian, D.; et al. Global, regional and national sodium intakes in 1990 and 2010: A systematic analysis of 24 h urinary sodium excretion and dietary surveys worldwide. BMJ Open 2013, 3, e003733. [Google Scholar] [CrossRef] [PubMed]
- Shavers, V.L. Measurement of socioeconomic status in health disparities research. J. Natl. Med. Assoc. 2007, 99, 1013–1023. [Google Scholar] [PubMed]
- Demarest, S.; Van Oyen, H.; Roskam, A.J.; Cox, B.; Regidor, E.; Mackenbach, J.P.; Kunst, A.E. Educational inequalities in leisure-time physical activity in 15 European countries. Eur. J. Public Health 2014, 24, 199–204. [Google Scholar] [CrossRef] [PubMed]
© 2015 by the authors; licensee MDPI, Basel, Switzerland. This article is an open access article distributed under the terms and conditions of the Creative Commons by Attribution (CC-BY) license (http://creativecommons.org/licenses/by/4.0/).
Share and Cite
Marques-Vidal, P.; Rousi, E.; Paccaud, F.; Gaspoz, J.-M.; Theler, J.-M.; Bochud, M.; Stringhini, S.; Guessous, I. Dietary Intake according to Gender and Education: A Twenty-Year Trend in a Swiss Adult Population. Nutrients 2015, 7, 9558-9572. https://0-doi-org.brum.beds.ac.uk/10.3390/nu7115481
Marques-Vidal P, Rousi E, Paccaud F, Gaspoz J-M, Theler J-M, Bochud M, Stringhini S, Guessous I. Dietary Intake according to Gender and Education: A Twenty-Year Trend in a Swiss Adult Population. Nutrients. 2015; 7(11):9558-9572. https://0-doi-org.brum.beds.ac.uk/10.3390/nu7115481
Chicago/Turabian StyleMarques-Vidal, Pedro, Eirini Rousi, Fred Paccaud, Jean-Michel Gaspoz, Jean-Marc Theler, Murielle Bochud, Silvia Stringhini, and Idris Guessous. 2015. "Dietary Intake according to Gender and Education: A Twenty-Year Trend in a Swiss Adult Population" Nutrients 7, no. 11: 9558-9572. https://0-doi-org.brum.beds.ac.uk/10.3390/nu7115481