Article

Korean Pine Nut Oil Attenuated Hepatic Triacylglycerol Accumulation in High-Fat Diet-Induced Obese Mice

1
Department of Food and Nutrition, College of Human Ecology, Seoul National University, Seoul 151-742, Korea
2
College of Veterinary Medicine, BK21 Program for Veterinary Science, Seoul National University, Seoul 151-742, Korea
3
Research Institute for Veterinary Science, Seoul National University, Seoul 151-742, Korea
4
Bio-MAX Institute, Seoul National University, Seoul 151-742, Korea
5
Research Institute of Human Ecology, Seoul National University, Seoul 151-742, Korea
*
Author to whom correspondence should be addressed.
Submission received: 16 November 2015 / Revised: 6 January 2016 / Accepted: 15 January 2016 / Published: 21 January 2016
(This article belongs to the Special Issue Fatty Acids in Obesity and Type 2 Diabetes)

Abstract

:
Korean pine nut oil (PNO) has been reported to influence weight gain and lipid metabolism. We examined whether PNO replacement in a high-fat diet (HFD) can ameliorate HFD-induced hepatic steatosis. Five-week-old male C57BL mice were fed control diets containing 10% of the energy from fat from PNO or soybean oil (SBO) (PC, SC) or HFDs with 45% of the energy from fat, with 10% from PNO or SBO and 35% from lard (PHFD, SHFD), for 12 weeks. Body weight gain and amount of white adipose tissue were lower in PHFD (10% and 18% lower, respectively) compared with SHFD. Hepatic triacylglycerol (TG) level was significantly lower in PHFD than the SHFD (26% lower). PNO consumption upregulated hepatic ACADL mRNA levels. The hepatic PPARG mRNA level was lower in the PC than in the SC. Expression of the sirtuin (SIRT) 3 protein in white adipose tissue was down-regulated in the SHFD and restored in the PHFD to the level in the lean control mice. SIRT 3 was reported to be upregulated under conditions of caloric restriction (CR) and plays a role in regulating mitochondrial function. PNO consumption resulted in lower body fat and hepatic TG accumulation in HFD-induced obesity, which seemed to be associated with the CR-mimetic response.

1. Introduction

Obesity leads to a wide range of health problems and is associated with an increased risk of metabolic syndrome. Non-alcoholic fatty liver disease (NAFLD), a hepatic manifestation of metabolic syndrome, has been becoming a major public health problem due to the obesity epidemic [1]. It has been reported that one-third of the urban population in the United States had hepatic steatosis [2], and the prevalence of NAFLD in Asian countries has been reported to be 16%–18% [3,4]. NAFLD covers a spectrum of liver abnormalities ranging from simple steatosis to fibrosis or cirrhosis accompanied by severe inflammation. The mechanisms leading to hepatic lipid accumulation include increased lipid uptake, elevated de novo lipogenesis, improper fatty acid oxidation, and dysregulation of lipoprotein metabolism. An excessive level of hepatic lipids makes the liver vulnerable to further damage caused by inflammation [5]. There have been many efforts to discover a pharmacologic target for NAFLD treatment based on the pathological process of NAFLD; however, a strategy for treating NAFLD has not been firmly established [6]. Thus, lifestyle modifications focusing on improving an individual’s diet and level of physical activity have been proposed as a primary strategy for NAFLD treatment.
Dietary fatty acids play a significant role in modulating hepatic lipid metabolism [7]. Thus, not only the amount but also the composition of the dietary fat plays an important role in the prevention of NAFLD. It has been reported that saturated fatty acids contribute to the progression of hepatic steatosis by promoting endoplasmic reticulum stress and the apoptosis of hepatocytes [8], and conjugated linoleic acid (CLA) has also been linked to the development of hepatic steatosis despite its influence on weight reduction [9]. Conversely, omega-3 polyunsaturated fatty acids (PUFAs) have been known to have beneficial effects on hepatic lipid metabolism. The mechanisms behind these effects include reduced expression and/or activity of hepatic lipogenic genes, activation of hepatic fatty acid β-oxidation, and inhibition of the production of inflammatory mediators [10], which may result in protection from hepatic lipid accumulation. Recently, oil extracted from the seeds of Pinus koraiensis, pine nut oil (PNO), has been investigated for its impact on lipid metabolism. PNO contains pinolenic acid (18:3, Δ5, 9, 12), which is an unusual omega-6 PUFA characterized by polymethylene-interrupted double bonds. Asset et al. [11,12] showed that PNO consumption lowered the plasma cholesterol level compared with the consumption of other lipids such as sunflower oil, coconut oil, or lard in mice. Two previous studies have investigated PNO’s effects on weight-loss and NAFLD prevention. In a study by Ferramosca et al. [13], the consumption of a PNO-supplemented diet significantly reduced body weight gain and the liver weight relative to the consumption of a maize oil-supplemented diet in mice. In this study, a standard diet (12% of the energy from fat) was supplemented with PNO or maize oil, which made the diets have 30% of the energy from fat. However, a low-fat control group was not included in Ferramosca’s study, and the fat content of the diets was significantly lower than the amount in the commonly used high-fat diet (HFD) for diet-induced obesity. In another study by Ferramosca et al. [14], it was shown that the combination of CLA and PNO prevented a CLA-induced fatty liver and improved insulin sensitivity in mice. In this study, a standard diet (12% of the energy from fat) was supplemented with olive oil (control group), CLA and olive oil (CLA group), or CLA and PNO (CLA and PNO group) to make diets contain 30% of the energy from fat. Collectively, these findings suggest that PNO can affect weight gain and has the potential for NAFLD prevention by its modulation of lipid metabolism. However, the information regarding the role of PNO on NAFLD prevention is still limited. There is no study that has examined the effect of PNO in both a control diet and a HFD.
Some studies have demonstrated that PNO has appetite controlling effects [15,16], which suggested that PNO can lead to less energy consumption. Sirtuins (SIRTs), class 3 NAD+-dependent deacetylases, are known to be upregulated in the chronic caloric restriction (CR). It has been well-documented that SIRTs are responsible for the health benefits of CR such as longevity and protection from age-related diseases including cancer, neurodegeneration, and cardiovascular disease [17,18]. There are seven mammalian SIRTs, ranging from SIRT1 to SIRT7. Among the SIRTs, SIRT3 is the major mitochondrial form that has relevance in supporting fatty acid oxidation, enhancing the antioxidant defense system, and repairing mitochondrial DNA damage, which implies that SIRT3 can be a new target for protection against lipotoxicity and obesity-induced metabolic complications [19]. Thus, we examined whether the SIRT3 protein was upregulated in PNO-fed mice. Among the SIRTs, SIRT3 was chosen because of its significance not only in CR and but also in lipid metabolism as well.
In the present study, HFDs with 45% of the energy from fat with 10% from PNO or soybean oil (SBO) and 35% from lard were used to examine whether partial replacement with PNO in the HFD can ameliorate NAFLD in HFD-induced obese mice. The impact of PNO was also examined using control diets with 10% of the energy from fat from PNO or SBO. We measured the hepatic lipid contents and hepatic mRNA levels of genes involved in fatty acid oxidation and lipogenic pathways to evaluate the influence of PNO on hepatic fatty acid metabolism. Expression of the SIRT3 protein was measured in order to determine whether PNO had a similar effect to that of caloric restriction.

2. Materials and Methods

2.1. Animals and Diets

Five-week-old male C57BL/6 mice (Central Lab, Animal Inc., Seoul, Korea) were randomly divided into four groups after 3 days of acclimation. Mice were fed the experimental diets for 12 weeks ad libitum. Control diets contained 10% of the energy from fat from PNO (PC, n = 11) or SBO (SC, n = 10). HFDs contained 45% of the energy from fat with 35% from lard and 10% from PNO (PHFD, n = 11) or SBO (SHFD, n = 11). The PNO was a gift from the Dubio Co., Ltd. (Gyeonggi-do, Korea). The compositions of the experimental diets are shown in Table 1. The mice were housed individually and maintained in an animal facility with controlled temperature (23 ± 3 °C), controlled humidity (55% ± 10%), and a 12 h light/12 h dark cycle. SBO was chosen as the control oil because its fatty acid composition was similar to that of PNO except for its pinolenic acid content. The fatty acid compositions of the experimental diets are shown in Table 2. An antioxidant was added to the diets (0.2 μg of t-butylhydroquinone/g oil) to prevent the oxidation of polyunsaturated fatty acids, and fresh food was provided every other day. The body weights of the mice were recorded once a week, and their food intake was measured four times a week. At the end of the experimental period, the mice were fasted for 12 h and euthanized by asphyxiation with CO2. Blood was obtained by heart puncture, and serum was collected after centrifugation and stored at −80 °C for later analysis. White adipose tissue (epididymal, abdominal subcutaneous, and retroperitoneal-perirenal depots) was collected and stored at −80 °C for later analysis. For liver histology, fresh liver tissue was dissected into pieces in a consistent manner and fixed in 10% buffered neutral formalin. The rest of the liver tissue was stored at −80 °C for later analysis. This study was approved by the Animal Care and Use Committee at Seoul National University (approval No. SNU-101029-1).
Table 1. Composition of the experimental diets 1.
Control Diet (g) (10% of the kcal from Fat)High-Fat Diet (g) (45% of the kcal from Fat)
10% Oil10% Oil + 35% Lard
Casein200200
l-Cystine33
Sucrose350172.8
Cornstarch31572.8
Dyetrose35100
PNO 2 or SBO4545
Lard0157.5
t-Butylhydroquinone0.0090.009
Cellulose5050
Mineral Mix 33535
Vitamin Mix 41010
Choline Bitartrate22
Total1045.0848.1
kcal/g diet3.694.64
1 Resource: Dyets, Inc, Bethlehem, PA, USA. 2 PNO was a gift from the Dubio Co., Ltd. 3 Thirty-five grams of mineral mix (Dyets, #210099) provides 1.0 g of sodium, 1.6 g of chloride, 0.5 g of magnesium, 0.33 g of sulfur, 59 mg of manganese, 45 mg of iron, 29 mg of zinc, 6 mg of copper, 2 mg of chromium, 1.6 mg of molybdenum, 0.16 mg of selenium, 0.9 mg of fluoride, 0.2 mg of iodine and 3.99 g of sucrose. 4 Ten grams of vitamin mix (Dyets, #300050) provides 4000 IU vitamin A, 1000 IU vitamin D3, 50 IU vitamin E, 30 mg of niacin, 16 mg of pantothenic acid, 7 mg of vitamin B6, 6 mg of vitamin B1, 6 mg of vitamin B2, 2 mg of folic acid, 0.5 mg of menadione, 0.2 mg of biotin, 10 µg of vitamin B12 and 9.78 g of sucrose.
Table 2. Fatty acid composition of the experimental diets (% of fatty acids) 1.
SBOPNO
Control Diet (SC)High-Fat Diet (SHFD)Control Diet (PC)High-Fat Diet (PHFD)
Myristic acid (C14:0)ND0.9ND0.9
Palmitic acid (C16:0)11.918.97.017.8
Stearic acid (C18:0)4.811.13.610.7
Total saturated fatty acid16.730.910.629.4
Palmitoleic acid (C16:1, Δ9)ND1.4ND1.4
Oleic acid (C18:1, Δ9)21.134.727.436.0
Total monounsaturated fatty acid21.136.127.437.4
Linoleic acid (C18:2, Δ9, 12)54.930.347.228.6
α-linolenic acid (C18:3, Δ9, 12, 15)7.42.80.81.3
Pinolenic acid (C18:3, Δ5, 9, 12)NDND14.03.3
Total polyunsaturated fatty acid62.333.162.033.2
ND, not detected; 1 Fatty acid composition was determined by a gas chromatographic method.

2.2. Serum Lipid Concentrations

The serum non-esterified fatty acid (NEFA) (SICDIA NEFAZYME; Shin Yang Chemical, Seoul, Korea), triacylglycerol (TG) (Cleantech TG-S; Asan Pharmaceutical, Seoul, Korea), and total cholesterol (T-CHO; Asan Pharmaceutical, Seoul, Korea) concentrations were measured by enzymatic colorimetric methods according to the manufacturer’s instructions.

2.3. Serum Leptin and Fetuin-A Concentrations

Serum leptin (Quantikine® ELISA kit; R & D Systems, Minneapolis, MN, USA) and fetuin-A (mouse Fetuin-A/AHSG Duo set; R & D Systems) levels were determined using enzyme-linked immunosorbent assays (ELISAs).

2.4. Liver Histology

For hematoxylin and eosin staining, liver tissue was embedded in paraffin and stained with hematoxylin and eosin. For oil red O staining, liver tissue was frozen in OCT compound and stained with oil red O. Histological images were captured at 200× magnification using a BX51 light microscope (Olympus, Optical Co. Ltd., Tokyo, Japan).

2.5. Hepatic Lipid Contents

The total lipids were extracted by the Folch method [20] from the liver tissue. The lipids were extracted in chloroform, dried in nitrogen gas and redissolved in isopropanol. The hepatic TG and cholesterol levels were determined by the same enzymatic colorimetric methods used for the measurement of the serum lipids. The hepatic TG and cholesterol contents are presented as mg/g tissue.

2.6. Real-Time PCR Analysis of the Genes in Liver Tissue

The mRNA levels of fetuin-A and genes involved in fatty acid oxidation and lipogenic pathways in the liver were determined. The oligonucleotide sequences of primers used in this study are presented in Table 3. The total RNA was isolated from the liver tissue using TRIzol reagent (Life Technologies Co., Carlsbad, CA, USA). The RNA concentration was measured by a spectrophotometer (Beckman Instruments, Fullerton, CA, USA), and the quality of the RNA was confirmed by agarose gel electrophoresis. The total RNA (2 μg) was used to synthesize single-stranded cDNA using a cDNA synthesis kit (PrimeScript™ II 1st strand cDNA synthesis kit; Takara Bio Inc., Shiga, Japan). The relative mRNA level was determined by the real-time quantitative PCR analysis using the SYBR green assay (SYBR® Premix Ex TaqTM; Takara Bio Inc., Shiga, Japan), and the analysis was performed with a Step-One-Plus RT-PCR system (Life Technologies, Carlsbad, CA, USA). All of the samples were analyzed in duplicate with an endogenous control gene being analyzed at the same time. The relative expression levels of each gene were calculated by the 2−ΔΔCT method, with the Gapdh gene being used as the endogenous control.
Table 3. Primer sequences used in real-time PCR quantitative analysis.
GeneFunctionForward Primer (5′–3′)Reverse Primer (5′–3′)
Ahsg/fetuin-Afatty liver indicatorTTGCTCAGCTCTGGGGCTGGCAAGTGGTCTCCAGTGTG
Pparatranscription factor promoting fatty acid oxidationGCAGTGGAAGAATCGGACCTCAACCCGCCTTTTGTCATAC
Cpt1amitochondrial β-oxidationGATGTTCTTCGTCTGGCTTGACTTATCGTGGTGGTGGGTGT
Acadlmitochondrial β-oxidationTCGCAATATAGGGCATGACAACTTGGGAAGAGCAAGCGTA
Hadhamitochondrial β-oxidationCCCTTTGAACACTTGCTGCTGCCCAGGTCTCTGTGGATAA
Acox1peroxisomal β-oxidationGTCAAAGGCATCCACCAAAGGAGGGGAACATCATCACAGG
Cyp4a10microsomal ω-oxidationCAGAAAGGAGGGAAGATGGAGCATGGTCTCCAAAATCCAAGG
Sod2anti-oxidative defenseTTAGAGCAGGCAGCAATCTGTGCGTGACTTTGGGTCTTTTG
Ucp2anti-oxidative defenseCAGGTCACTGTGCCCTTACCACACTACGTTCCAGGATCCCAA
Ppargtranscription factor promoting adipogenesisCAGCAGGTTGTCTTGGATGTCAGCCCTTTGGTGACTTTATGG
Srebf1de novo lipogenesisGTCTCCACCACTTCGGGTTTCGACTACATCCGCTTCTTGC
Fasnde novo lipogenesisGCGGTGTGAAAACGAACTTTCTGTCTGGGCATAACGGTCT
Slc25a1de novo lipogenesisTTCCCTTTAGCCCTTGTTCCTGACCAGACTTCCTCCAACC
Fabp1fatty acid transportGAACTCATTGCGGACCACTTCATCCAGAAAGGGAAGGACAT
Cd36fatty acid transportCCAAGCTATTGCGACATGATTTCTCAATGTCCGAGACTTTTCA
Gapdhendogenous controlGGAGAAACCTGCCAAGTAAAGAGTGGGAGTTGCTGTTG
Ahsg/fetuin-A, alpha-2-HS-glycoprotein; Ppara, peroxisome proliferator activated receptor alpha; Cpt1a, carnitine palmitoyltransferase 1a; Acadl, long-chain acyl-CoA dehydrogenase; Acox1, acyl-CoA oxidase 1; Cyp4a10, cytochrome P450 family 4 subfamily a polypeptide 10; Hadha, hydroxyacyl-CoA dehydrogenase alpha subunit; Sod2, superoxide dismutase 2; Ucp2, uncoupling protein 2; Pparg, peroxisome proliferator activated receptor gamma; Srebf1, sterol regulatory element-binding transcription factor 1; Fasn, fatty acid synthase; Slc25a1, solute carrier family 25 member 1; Fabp1, fatty acid binding protein 1; Cd36, cluster of differentiation 36; Gapdh, glyceraldehyde-3-phosphate dehydrogenase.

2.7. Western Blot Analysis of SIRT3 in White Adipose Tissue

The epididymal fat pad was homogenized in an ice-cold protein lysis buffer containing 50 mM Tris-Cl (pH 7.4), 150 mM NaCl, 1 mM EDTA, 1 mM PMSF, 1 mM Na3VO4, 1 mM NaF, 1 mM Na4P2O7, 1 mM β-glycerophosphate, 1% NP-40, 0.25% sodium deoxycholate, 10% glycerol, and protease inhibitor cocktail (Complete Mini Protease Inhibitor Cocktail; Roche Diagnostics GmbH, Penzberg, Germany). The supernatant was obtained by centrifugation at 10,000× g for 30 min at 4 °C. A Bradford assay (Bio-Rad, Hercules, CA, USA) was used to determine the total protein concentration. Fifty micrograms of the protein sample was separated in 10% SDS-PAGE and transferred onto a PVDF membrane (Bio-Rad, Hercules, CA, USA). The membrane was blocked with 3% bovine serum albumin (BSA) in Tris-buffered saline containing 0.1% Tween-20 (pH 7.6, TBST) for 1 h. The membrane was incubated with rabbit anti-mouse SIRT3 antibody (1:1000; Cell Signaling Technology, Beverly, MA, USA) in 3% BSA/TBST overnight at 4 °C. The membrane was washed with TBST and then incubated with secondary anti-rabbit IgG HRP-linked antibody (Cell Signaling Technology, Beverly, MA, USA) in 3% BSA/TBST for 1 h at room temperature. The signal was visualized by a chemiluminescent detection system and quantified using Quantity One analysis software (Bio-Rad, Hercules, CA, USA).

2.8. Statistical Analysis

Statistical analysis was performed using PASW Statistics 18 (SPSS Inc., Chicago, IL, USA). Two-way ANOVA was used to evaluate the overall effects of the fat amount, oil type, and their interaction. When the effects of the fat amount and/or oil type were significant, a LSD multiple-comparison post-hoc test was performed for the individual group comparisons. Student’s t test was used for the comparison between the PC and SC groups or the PHFD and SHFD groups if an interaction was significant. Pearson’s correlation was used to determine the relationship between the two variables. The results from all of the comparisons were considered significant at p < 0.05. Data are reported as the means ± SEM.

3. Results

3.1. Body Weight, Energy Intake, and Body Fat Accumulation

After 12 weeks of feeding, HFD-fed mice had a significantly higher mean body weight (p < 0.05) and a significantly higher mean white adipose tissue weight (p < 0.05) than control diet-fed mice. Mice in the PHFD group gained less body weight (10% less, p < 0.05) and had less white adipose tissue (18% less, p < 0.05) compared to mice in the SHFD group, but their energy intake was not significantly different from that of mice in the SHFD group. Mice in the PC group also had less white adipose tissue than mice in the SC group (30% less, p = 0.05) (Table 4). Body weight gain positively correlated with the white adipose tissue weight (r = 0.93, p < 0.05), which indicated that the PNO-mediated lower weight gain was mainly due to a lower body fat accumulation. Mice in the PHFD group also had a significantly lower serum leptin level than those in the SHFD group (p < 0.05), which was consistent with the result that PNO suppressed body fat accumulation in the HFD-induced obese mice (Table 5).
Table 4. Body weights, energy intakes, and adipose tissue weights.
SC (n = 10)PC (n = 11)SHFD (n = 11)PHFD (n = 11)p Value
Fat AmountOil TypeInteraction
Body weight at 0 week (g)17.3 ± 0.516.7 ± 0.417.0 ± 0.417.0 ± 0.30.970.560.50
Body weight at 12 weeks (g)32.8 ± 1.0 ab30.5 ± 0.6 a38.5 ± 1.4 c34.6 ± 1.4 b0.000.010.49
Weight gain (g)15.5 ± 0.8 ab13.8 ± 0.6 a21.5 ± 1.1 c17.5 ± 1.3 b0.000.010.32
Average daily food intake (g/day)3.20 ± 0.06 b3.20 ± 0.03 b2.82 ± 0.05 a2.76 ± 0.04 a0.000.540.48
Average daily energy intake (kcal/day) 111.8 ± 0.2 a11.8 ± 0.1 a13.1 ± 0.2 b12.8 ± 0.2 b0.000.500.43
Total white adipose tissue (g) 23.1 ± 0.2 b2.2 ± 0.2 a5.3 ± 0.4 d4.4 ± 0.4 c0.000.000.95
Epididymal (g)1.3 ± 0.1 b0.9 ± 0.1 a2.2 ± 0.2 c1.9 ± 0.2 c0.000.000.68
Retroperitoneal and perirenal (g)0.60 ± 0.04 b0.41 ± 0.05 a0.99 ± 0.06 c0.84 ± 0.08 c0.000.010.79
Abdominal subcutaneous (g)1.2 ± 0.1 a0.9 ± 0.1 a2.1 ± 0.2 c1.7 ± 0.2 b0.000.010.52
Values are presented as the mean ± SE. Two-way ANOVA was used to determine the significant effects of the fat amount and oil type and was followed by a LSD post-hoc test. Means in a row without a common superscript are significantly different (p < 0.05). 1 Average daily energy intake (kcal/day) = Average daily food intake (g/day) × Energy per g diet (kcal/g diet); 2 WAT weight is the sum of the weights of the epididymal, abdominal subcutaneous, and retroperitoneal-perirenal depots.

3.2. Serum Lipid Levels

PNO tended to decrease the total cholesterol in the serum (p = 0.09), whereas it had no significant influence on the TG concentration of the serum. Serum NEFA, the primary factor that causes hepatic lipid overload in obesity, tended to be at a higher level in HFD-fed mice than in control diet-fed mice (p = 0.09), but no significant effect of PNO was observed (Table 5).
Table 5. Serum lipid and leptin levels.
SC (n = 10)PC (n = 11)SHFD (n = 11)PHFD (n = 11)p value
Fat AmountOil TypeInteraction
Serum triacylglycerol (mg/dL)116.0 ± 8.4133.5 ± 10.4163.0 ± 33.8118.1 ± 16.10.440.500.13
Serum cholesterol (mg/dL)282.8 ± 10.5250.2 ± 15.7284.7 ± 22.1258.1 ± 16.20.770.090.86
Serum NEFA (mmol/L)1.09 ± 0.081.35 ± 0.081.71 ± 0.401.62 ± 0.290.090.730.50
Serum leptin (ng/mL)19.9 ± 2.8 ab12.6 ± 2.0 a43.3 ± 6.8 c29.2 ± 4.5 b<0.010.020.46
Values are presented as the mean ± SE. Two-way ANOVA was used to determine the significant effects of the fat amount and oil type and was followed by a LSD post-hoc test. Means in a row without a common superscript are significantly different (p < 0.05).

3.3. Liver Lipid Levels

The mean liver weight of mice in the PHFD group was lower than that of the SHFD group (9% less, p < 0.05) (Figure 1a). For the hepatic TG concentration, there was a significant interaction between the amount of fat and the oil type (p < 0.05). The hepatic TG concentration of the PHFD group was significantly lower than that of the SHFD group (26% less, p < 0.05), and it was comparable to that of lean mice (Figure 1b). When the total hepatic TG content was calculated and adjusted for body weight, it confirmed that mice in the PHFD group stored less TG in the liver compared to those in the SHFD group (24% less, p < 0.05). There was no significant difference in the hepatic TG concentration between the SC and PC groups. PNO had no significant influence on the hepatic cholesterol level. Overall, the hepatic cholesterol level was lower in HFD-fed mice than in control diet-fed mice (12% lower, p < 0.05), which was mainly due to the high cholesterol level of the PC group (Figure 1c).
Figure 1. Liver weight and liver lipid levels (a) liver weight; (b) liver triacylglycerol (TG); (c) liver cholesterol; (d) representative photomicrographs of liver sections stained with hematoxylin and eosin (×200), and (e) representative photomicrographs of liver sections stained with Oil red O (×200). Values are the mean ± SE (SC, n = 10; PC, n = 11; SHFD, n = 11; PHFD, n = 11). Two-way ANOVA was used to determine the effects of the fat amount and oil type and was followed by a LSD post-hoc test. Labeled means without a common superscript represent a significant difference at p < 0.05. Student’s t test was used for comparison between the PC and SC groups or the PHFD and SHFD groups if the interaction was significant. * indicates a significant difference at p < 0.05.
Nutrients 08 00059 g001

3.4. Hepatic Fetuin-A mRNA and Serum Fetuin-A Levels

To examine whether NAFLD was developed due to a HFD and whether PNO had a beneficial influence for the prevention of NAFLD, hepatic fetuin-A mRNA and serum fetuin-A levels were measured. Although the fetuin-A mRNA level was significantly higher in obese mice (1.7-fold, p < 0.05), the serum fetuin-A level was not significantly higher in obese mice compared to the level in lean mice in this study (Figure 2a,b). Overall, PNO consumption tended to result in higher fetuin-A mRNA levels in the liver (1.4-fold, p = 0.1) even though PNO-fed mice did not show steatotic livers. Fetuin-A mRNA levels positively correlated with the mRNA levels of Acadl, an enzyme catalyzing the first step of mitochondrial β-oxidation of fatty acids (r = 0.84, p < 0.05) (Figure 2c), and with the mRNA levels of other genes involved in fatty acid β-oxidation (Ppara, r = 0.56, p < 0.05; Hadha, r = 0.70, p < 0.05; Acox1, r = 0.49, p < 0.05).
Figure 2. Hepatic fetuin-A mRNA and serum fetuin-A levels (a) hepatic fetuin-A mRNA level; (b) serum fetuin-A level; (c) correlation between hepatic fetuin-A mRNA and Acadl mRNA levels. The serum fetuin-A level was measured by ELISA (SC, n = 10; PC, n = 11; SHFD, n = 11; PHFD, n = 11). The mRNA level was determined by a real-time PCR method (n = 6 per group). Values are the mean ± SE. Two-way ANOVA was used to determine the effects of the fat amount and oil type and was followed by a LSD post-hoc test. Labeled means without a common superscript represent a significant difference (p < 0.05).
Nutrients 08 00059 g002

3.5. Hepatic Expression of Genes Involved in Fatty Acid Oxidation and Oxidative Stress

We examined the expression of genes involved in fatty acid oxidation to see whether the PNO-mediated decrease in hepatic TG accumulation in obese mice could be attributed to enhanced fatty acid oxidation (Figure 3a). Overall, PNO consumption promoted mRNA expression of Acadl (1.5-fold, p = 0.05). Mice in the PHFD group tended to have higher Acadl mRNA levels compared to mice in the SHFD group (1.6-fold, p = 0.08). The mRNA levels of Sod2, an anti-oxidative enzyme, were higher in HFD-fed mice (1.3-fold, p < 0.05), and the PHFD group showed the highest level. The mRNA level of Cpt1a, a rate-limiting enzyme that transfers fatty acids from the cytosol into the mitochondria, was lower in HFD-fed mice (0.7-fold, p < 0.05), and the PHFD group had the lowest level of Cpt1a mRNA among the four groups. The mRNA expression levels of Ppara, Acox1, Hadha, Cyp4a10, and Ucp2 were not significantly affected by HFD or PNO.
Figure 3. Expression of hepatic genes involved in fatty acid oxidation, oxidative stress, and lipogenic pathways (a) hepatic mRNA levels of genes involved in fatty acid oxidation and oxidative stress and (b) hepatic mRNA levels of genes involved in lipogenic pathways. The mRNA level was determined by a real-time PCR method. Values are the mean ± SE (n = 6 per group). Two-way ANOVA was used to determine the effects of the fat amount and oil type and was followed by a LSD post-hoc test. Labeled means without a common superscript represent a significant difference at p < 0.05. Student’s t test was used for comparison between the PC and SC groups or the PHFD and SHFD groups if the interaction was significant. * indicates a significant difference at p < 0.05.
Nutrients 08 00059 g003

3.6. Hepatic Expression of Genes Involved in Lipogenic Pathways

To examine the effect of PNO on lipogenic pathways in the liver, we examined the expression of lipogenic genes in the liver (Figure 3b). Although the level of Pparg mRNA was not greater in obese mice, it was significantly lower in the PC group compared to in the SC group (0.5-fold, p < 0.05). The mRNA levels of Srebf1, Fasn, Slc25a1, Fabp1, and Cd36 were not significantly altered by HFD or PNO.

3.7. SIRT3 Protein Expression in White Adipose Tissue

We examined whether the expression of SIRT, a protein known to be responsible for CR-mediated health benefits, was higher in the white adipose tissue of PNO-fed mice (Figure 4). The protein expression of SIRT3 was lowered by being fed a high-fat diet (p < 0.05), and it was restored in the PHFD group to the level in lean mice. The PHFD group had a significantly higher expression of the SIRT3 protein compared to the SHFD group (p < 0.05)
Figure 4. SIRT3 protein expression in white adipose tissue. Epididymal adipose tissue protein (50 μg) was used for western blot analysis. A representative image is presented. The intensity of the SIRT3 band was densitometrically measured and normalized to the level of β-Actin. Values are the mean ± SE (SC, n = 5; PC, n = 5; SHFD, n = 6; PHFD, n = 6). Two-way ANOVA was used to determine the effects of the fat amount and oil type and was followed by a LSD post-hoc test. Labeled means without a common superscript represent a significant difference at p < 0.05.
Nutrients 08 00059 g004

4. Discussion

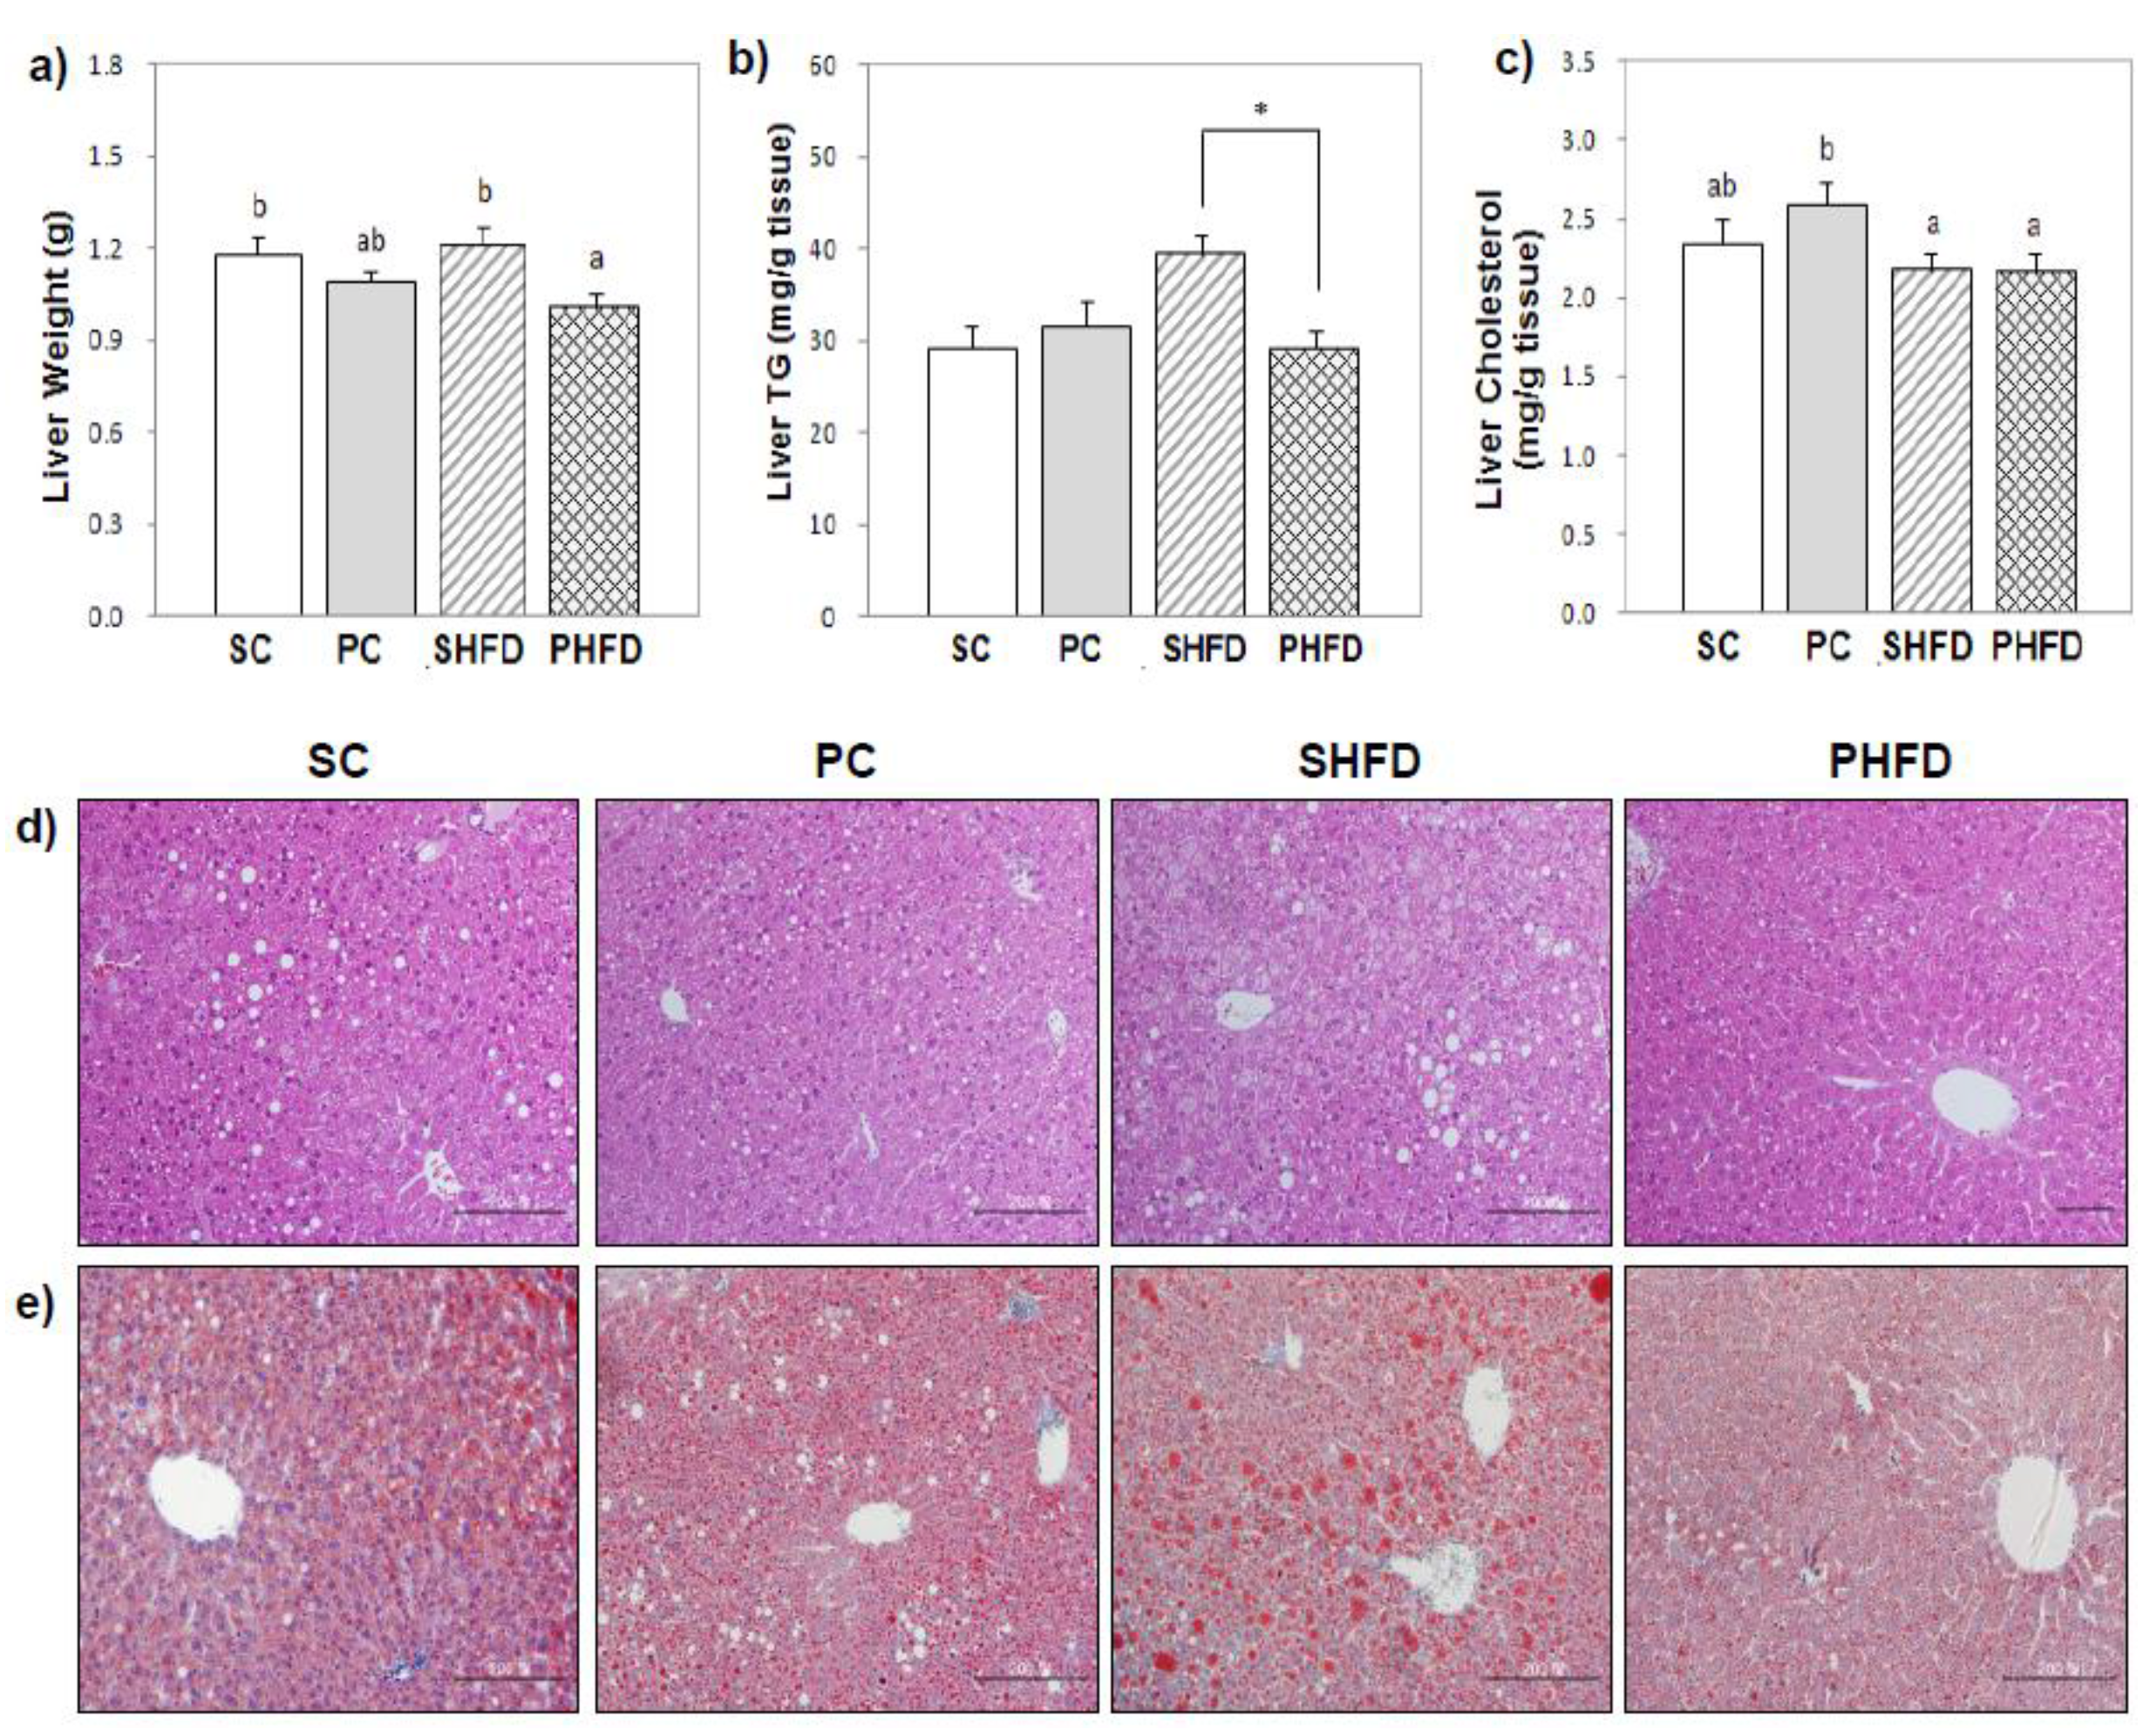
In this study, we showed that hepatic TG accumulation was attenuated by PNO replacement in HFD-fed mice. Mice in the SHFD group showed 30% higher hepatic TG concentrations compared to the control group, but mice in the PHFD group maintained hepatic TG concentrations at the level of lean mice. NAFLD induced by feeding the mice a HFD (45% of the energy from fat) for 12 weeks in this study seemed to remain in the initial stage of a simple steatotic condition. A hepatic TG content over 5% of the liver weight, which is the criteria for a fatty liver [21], was not observed overall. On pathological observation, inflammation and hepatocyte degeneration were mild (Table A1) even in the SHFD group. The expression of Pparg mRNA was also not higher in the HFD-fed mice compared with the control diet-fed mice. Meanwhile, the hepatic cholesterol level was lower in HFD-fed mice, and PNO had no effect on the hepatic cholesterol level. In the study by de Vogel-van den Bosch et al. [22], feeding a cholesterol-free high-fat diet lowered fractional cholesterol absorption, which resulted in cholesterol synthesis and down-regulation of cholesterol efflux to spare intracellular cholesterol for chylomicron formation. Desmarchelier et al. [23] also reported that mice fed with the high-fat western diet containing 0.03% (w/w) cholesterol showed reduced intestinal and hepatic cholesterol concentrations despite the hypercholesterolemia and increased hepatic TG levels. The HFD used in this study provided 0.02% (w/w) cholesterol from lard. It seems that providing this amount of cholesterol is not sufficient to meet the increased demand for chylomicron packaging due to lipid overload with high-fat diet feeding. The duration of high-fat feeding was not very long in this study (12 weeks) and two studies by others (8 weeks in the study by de Vogel-van den Bosch et al. [22] and 12 weeks in the study by Desmarchelier et al. [23]). Taken together, lower levels of hepatic cholesterol in HFD fed mice in this study might be interpreted as an adaptive response to deal with large quantities of fat in the diet.
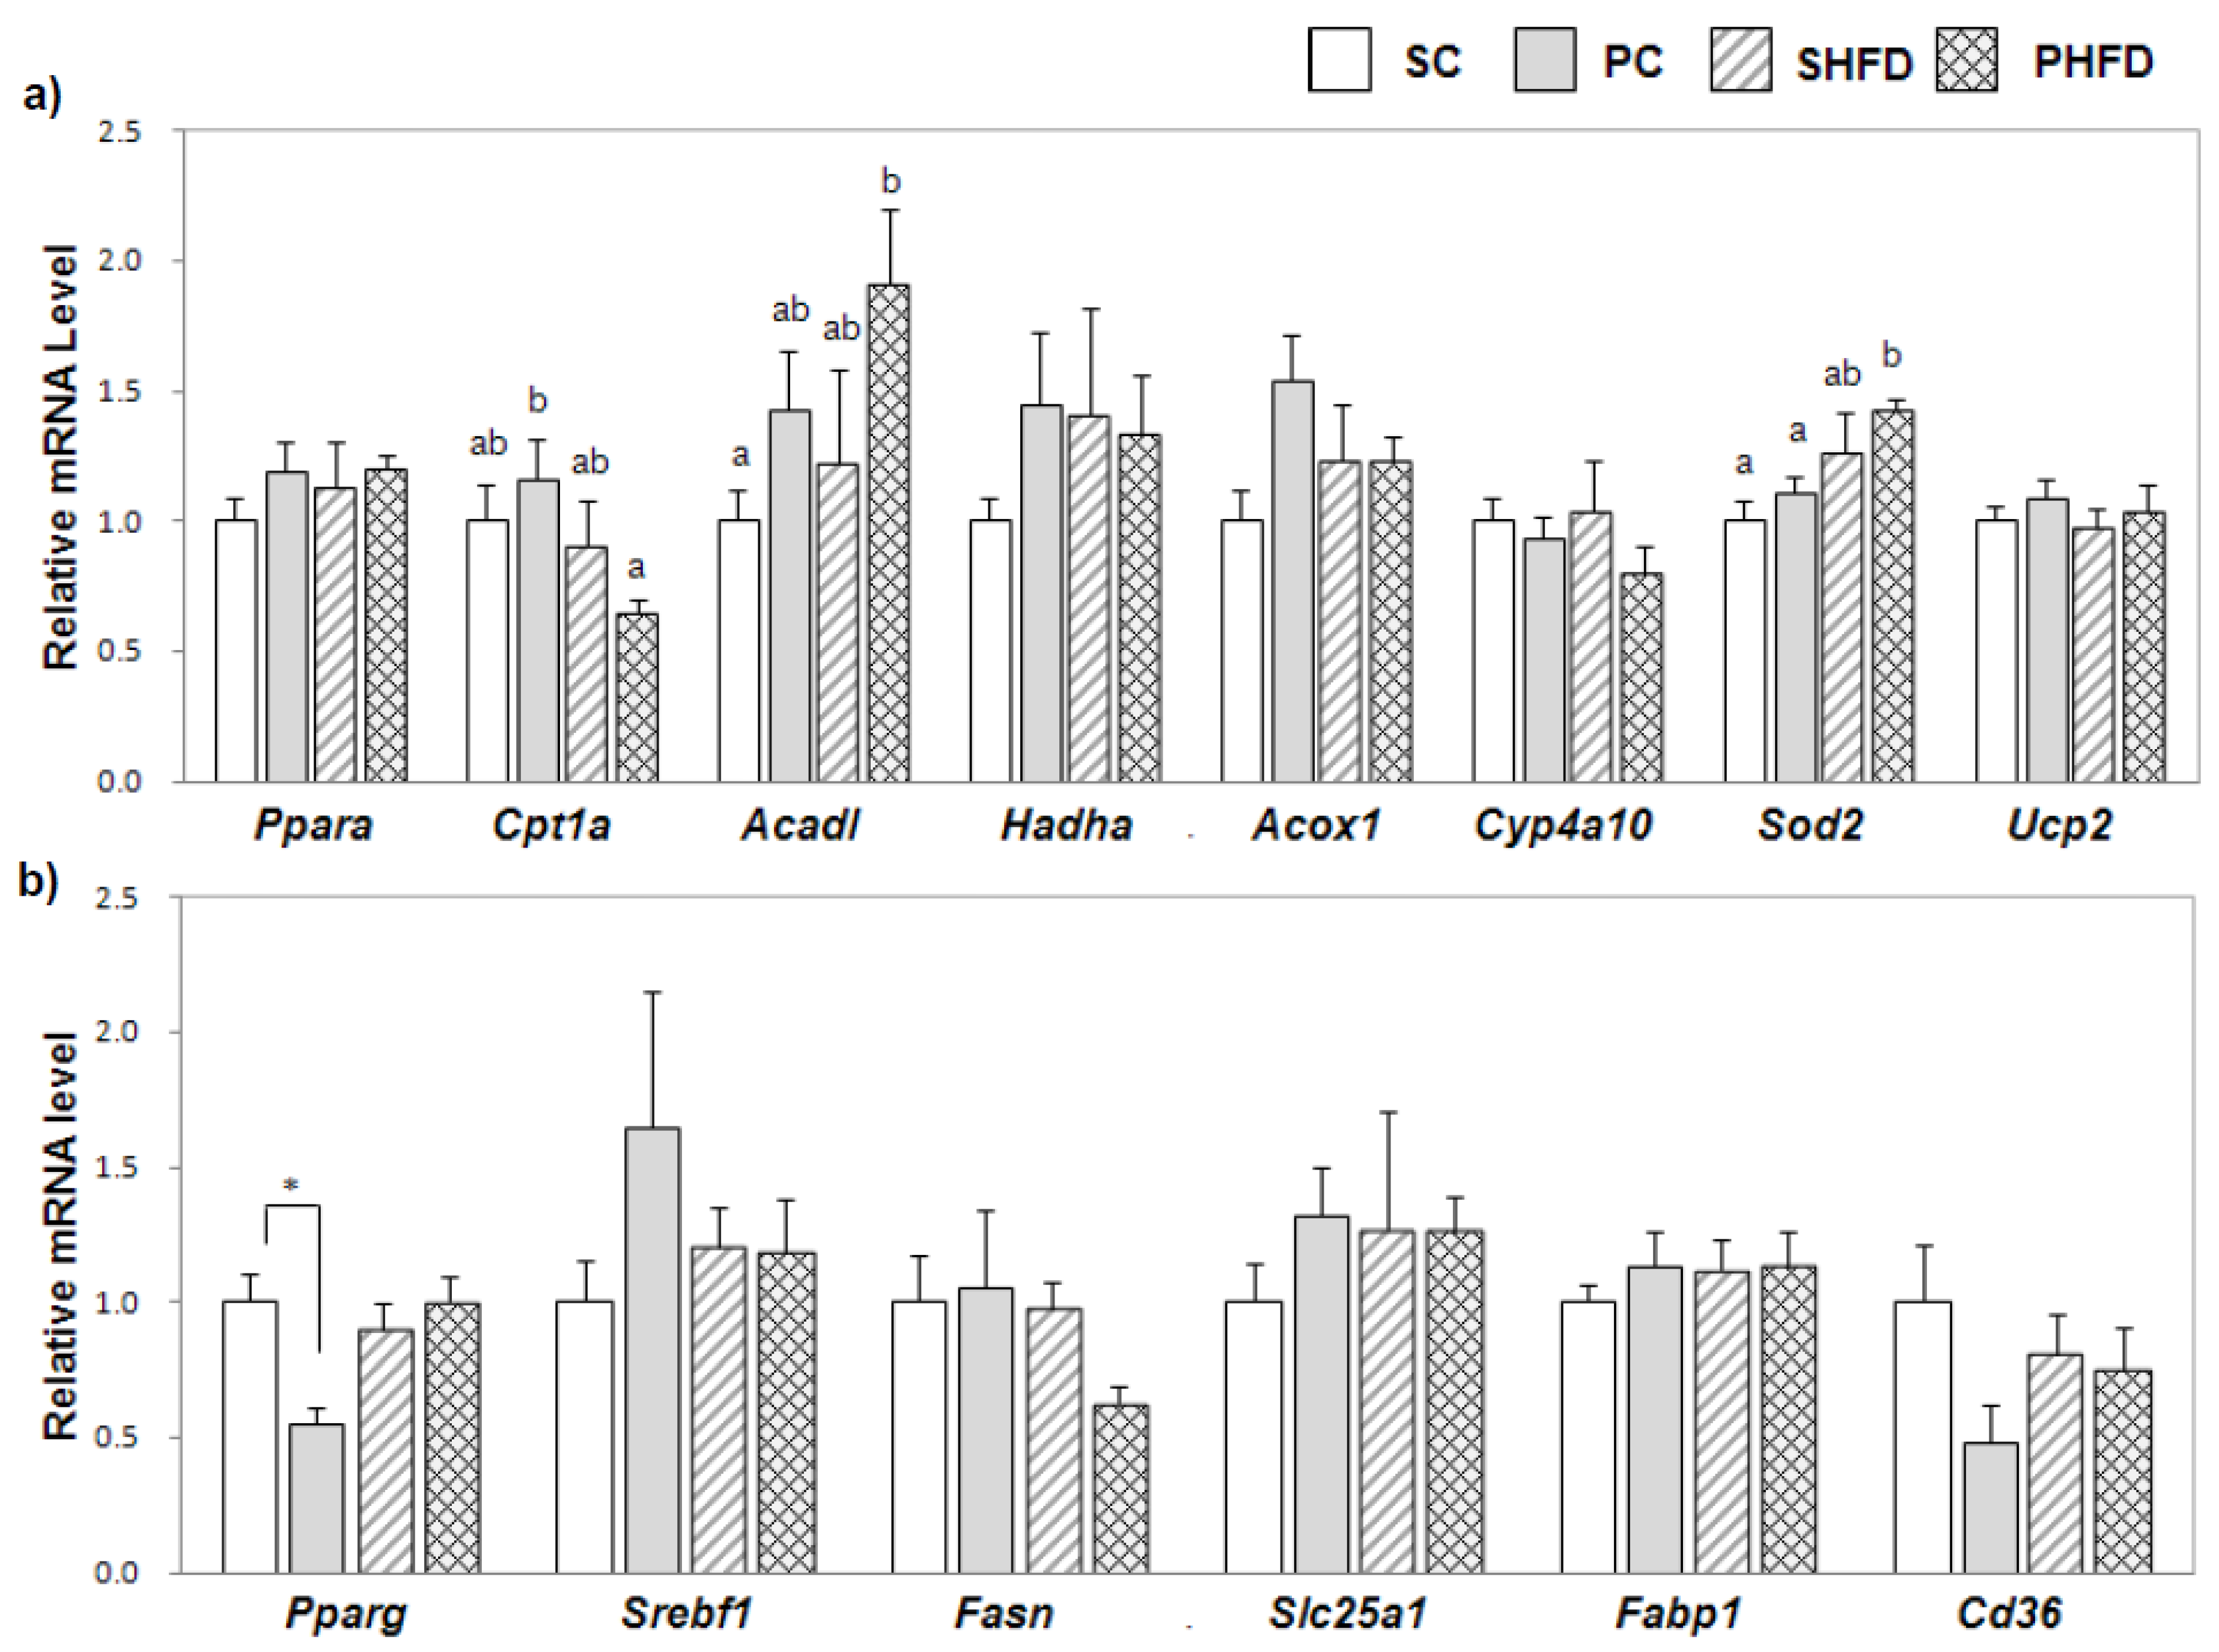
The mRNA level of long-chain acyl-CoA dehydrogenase (Acadl) in PNO-fed mice was significantly higher, and the PHFD group expressed the highest level of Acadl among the four groups. The up-regulation of Acadl mRNA might contribute to the enhancement of fatty acid β-oxidation, which could partially explain the smaller hepatic TG accumulation in PNO-fed mice. The role of fatty acid oxidation in NAFLD is controversial. Studies by Schrauwen et al. [24] and Sunny et al. [25] reported that fatty acid oxidation was higher in steatotic livers, which could lead to oxidative stress and liver damage. However, the increase in fatty acid oxidation in both studies was attributed to the excessive amount of TG stored in the liver tissue, whereas PNO-fed mice in this study showed little TG accumulation. Additionally, the PHFD group had the highest level of superoxide dismutase 2 (Sod2) mRNA among the four groups, which might confer a protection from the reactive oxygen species produced by increased fatty acid oxidation. Because Sod2 can also be induced by reactive oxygen species [26], this result is consistent with the fact that the PHFD group showed increased expression of Acadl. However, the PFHD group had the lowest mRNA expression level of carnitine palmitoyltransferase 1a (Cpt1a) among the four groups. Depletion of unesterified coenzyme A, a cofactor required for fatty acid oxidation in the mitochondria, would further inhibit the entry of fatty acids into the mitochondria [27,28]. As increased mitochondrial β-oxidation could lead to a shortage of available cofactors, down-regulation of Cpt1a mRNA in the PHFD group might be the result of an intramitochondrial control mechanism to prevent a further influx of fatty acids in order to maintain mitochondrial homeostasis. The results from a recent study by Le et al. [29], in which PNO increased both Cpt1b and Acadl mRNA levels in the muscle tissue of HFD-fed mice, suggested a tissue-specific regulation. In fact, liver and muscle tissues express different isoforms of Cpt1, and the two isoforms have different kinetic characteristics [28]. However, direct mechanistic evidence to explain the contradictory expression pattern of the genes involved in mitochondrial β-oxidation (higher Acadl and lower Cpt1) shown in this study is lacking. A direct comparison of the mitochondrial fatty acid oxidation rates would help confirm the effect of PNO on fatty acid oxidation in the liver.
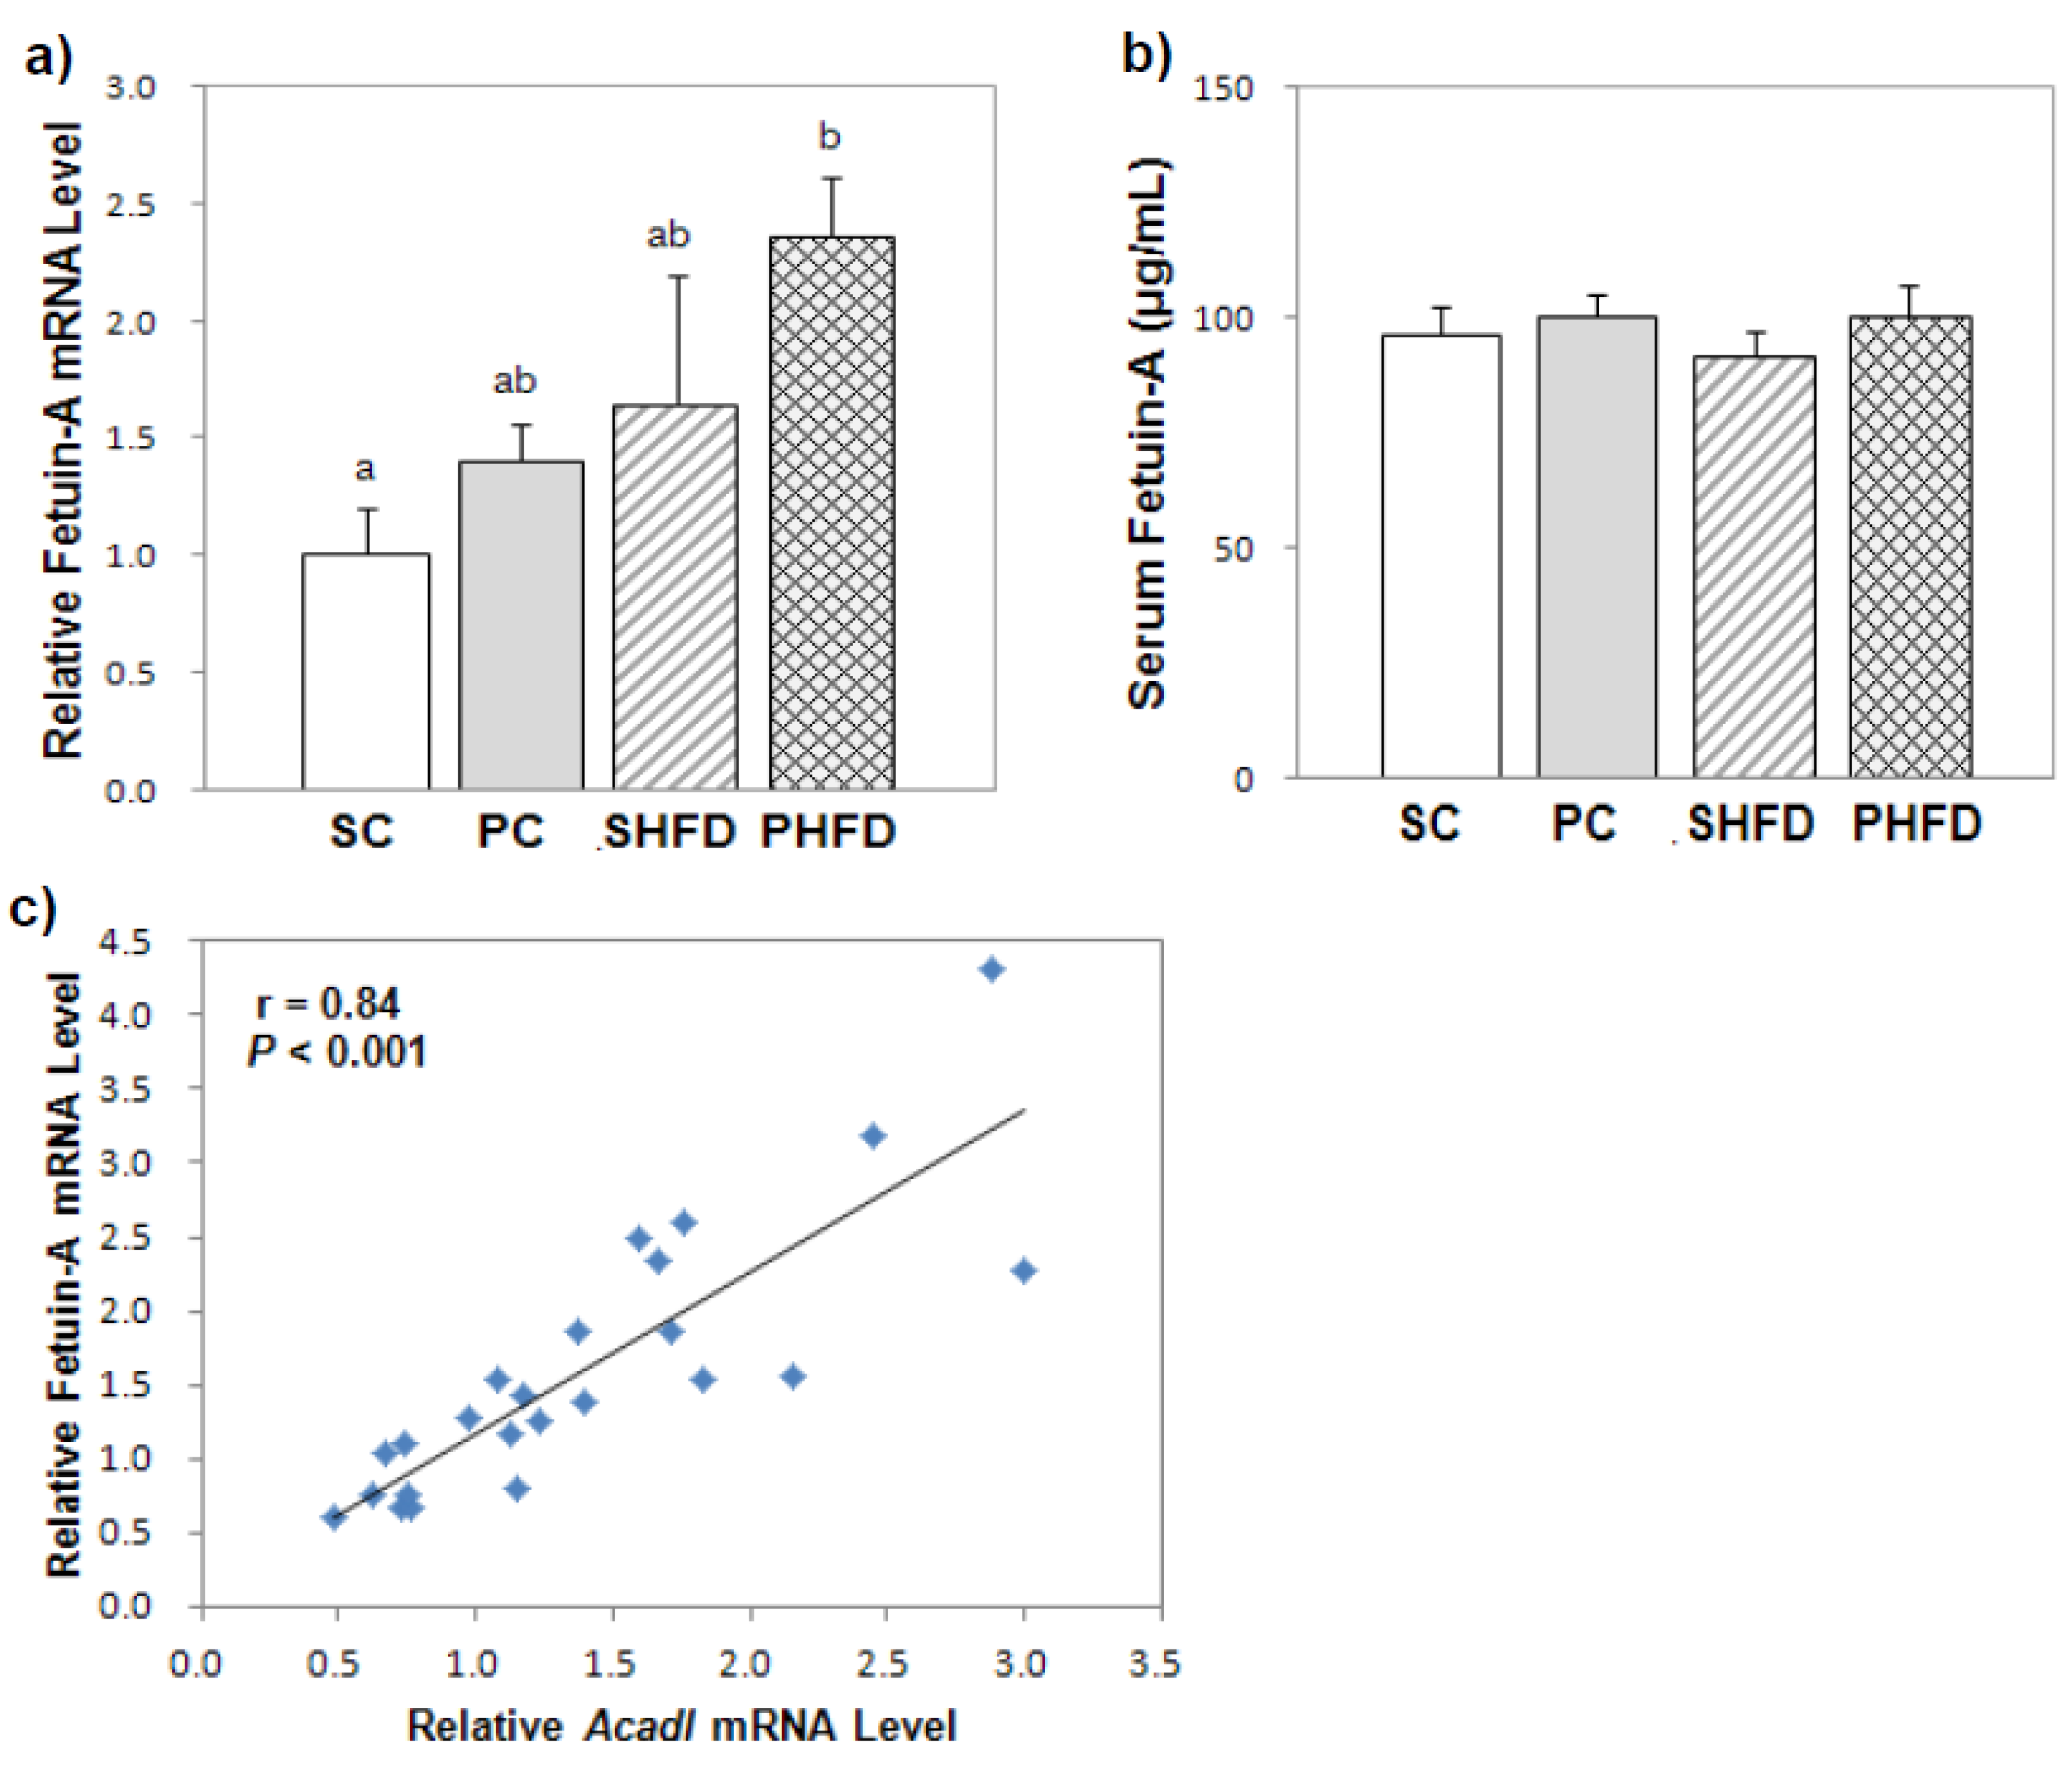
Fetuin-A has been linked to weight gain, insulin resistance, and NAFLD [30,31,32]. Fetuin-A knockout mice were insulin-sensitive and resistant to weight gain when fed a HFD [33]. Stefan et al. [34] reported that the plasma fetuin-A level positively correlated with liver fat accumulation in humans, and the expression of fetuin-A mRNA was greater in mice with fatty livers. In this study, the serum fetuin-A concentration was not higher in obese mice despite the upregulated hepatic fetuin-A mRNA level in obese mice. Because fetuin-A is present in systemic circulation at a high concentration, the magnitude of the elevated fetuin-A expression in the liver might have been insufficient to cause a significant change in the serum fetuin-A concentration. However, the hepatic expression of fetuin-A mRNA was greater in PNO-fed mice without evidence of hepatic steatosis, and it positively correlated with the genes involved in fatty acid oxidation. Haukeland et al. [35] reported that hepatic fetuin-A mRNA levels positively correlated with Pepck1 and Srebp1c mRNA levels in human subjects. A positive correlation between fetuin-A and Cpt1 mRNA levels was also observed, although it was less consistent. These results suggest that fetuin-A mRNA expression could be co-regulated with glucose and lipid metabolism. Based on our results, the expression of fetuin-A mRNA seemed to be closely related to fatty acid oxidative metabolism, and the up-regulation of fetuin-A mRNA in PNO-fed mice could be the result of increased fatty acid oxidation. Further studies are needed to elucidate the relationship between fetuin-A and fatty acid metabolism.
Although the overall effect of PNO on the mRNA expression of fatty acid synthase (Fasn), a multi-enzyme protein involved in de novo lipogenesis, was not significant, it was significantly lower in the PHFD group than in the SHFD group (Student’s t-test, p < 0.05). Ferramosca et al. [14] reported that the activities of hepatic lipogenic enzymes including acetyl-CoA carboxylase and fatty acid synthase were significantly decreased in PNO-fed mice after 16 weeks of feeding, and PNO-fed mice were protected from liver fat accumulation when CLA was fed, which partially supports our results. In the study by Donnelly et al. [36], de novo lipogenesis was elevated in the fasting state and failed to increase in the postprandial state in NAFLD patients, which suggested dysregulated de novo lipogenesis in NAFLD patients. Our results indicated that the attenuation of the lipogenic process under the condition of HFD consumption occurred in mice in the PHFD group, while this was not observed in mice in the SHFD group. Collectively, these data suggested that PNO replacement contributes to the maintenance of the homeostatic regulation of hepatic fatty acid metabolism in HFD-induced obesity by increasing fatty acid β-oxidation and alleviating lipogenesis.
The changes in the expression of hepatic genes related to fatty acid oxidation and lipogenesis by PNO replacement have been discussed so far. In this study, PNO-fed mice showed reduced weight gain and body fat accumulation along with the less hepatic TG accumulation in the HFD group. It is well established that an excess flow of free fatty acids arising from adipose tissue is the major contributor to hepatic TG in obese patients [36], which is mainly explained by the failed suppression of lipolysis caused by peripheral insulin resistance. Thus, there is a possibility that less hepatic TG accumulation in the PHFD group in this study could be an indirect consequence of less body fat accumulation followed by an overall improvement in energy metabolism.
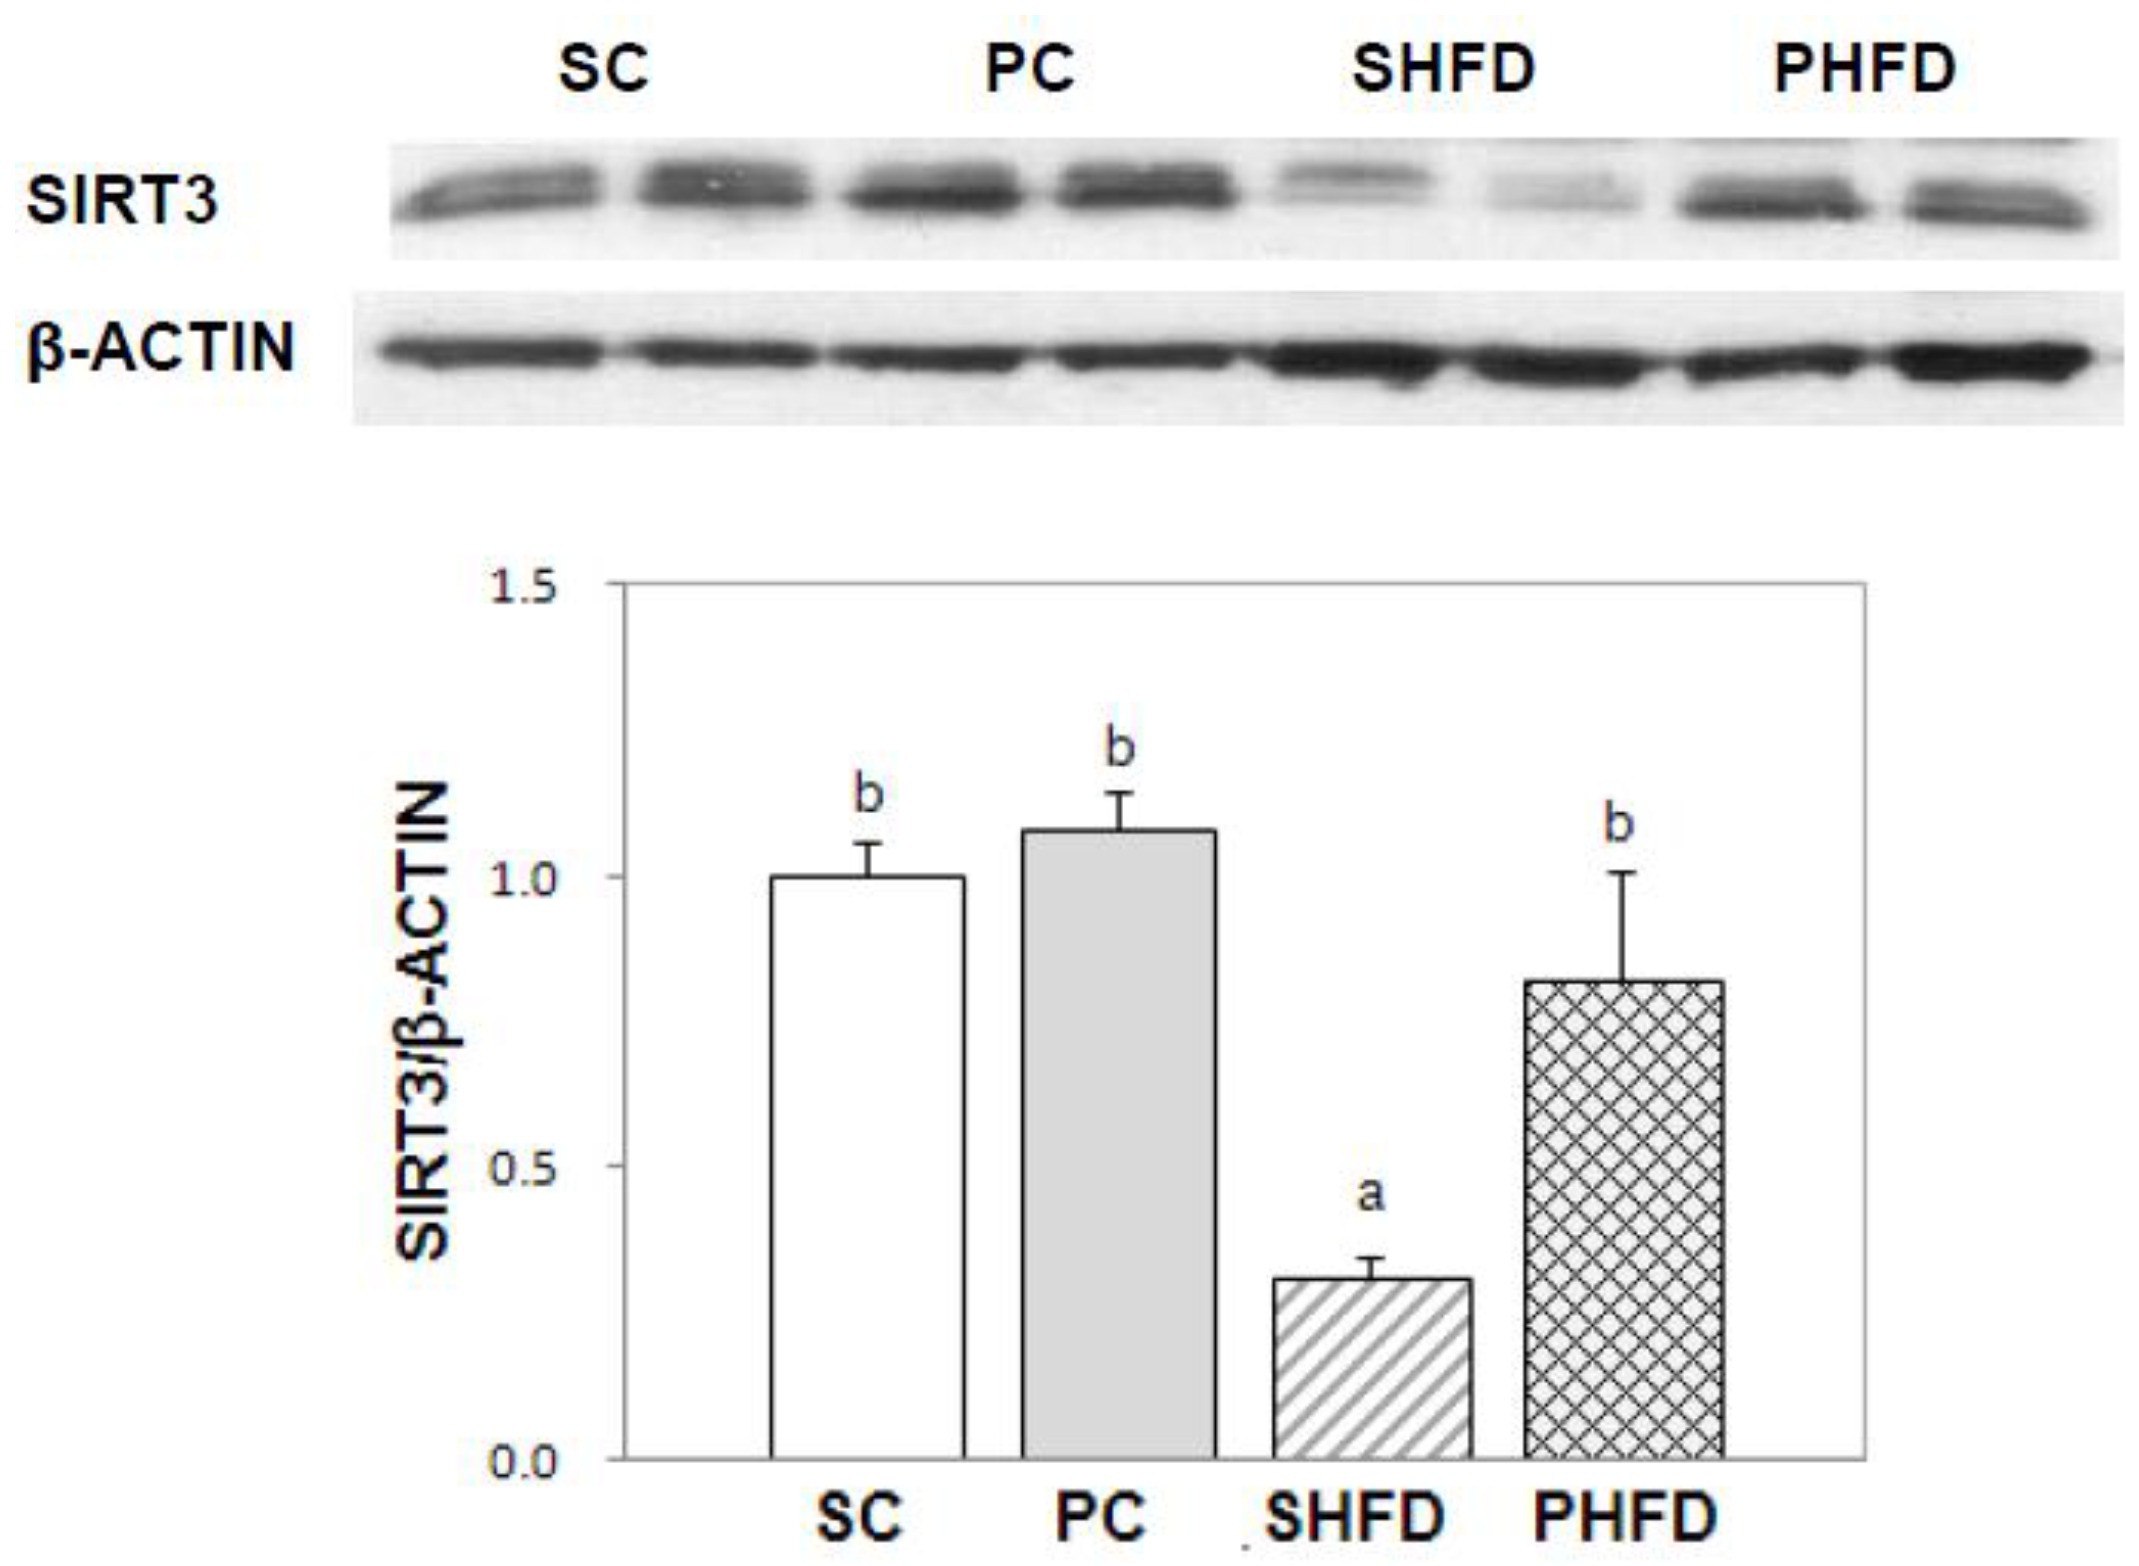
Among the SIRTs (SIRT1-7), SIRT3 plays a pivotal role in energy metabolism and mitochondrial function by regulating the activity of mitochondrial enzymes related to fatty acid metabolism including ACADL [37] and SOD2 [38]. We observed that SIRT3 protein expression was significantly lower in the white adipose tissue of the SHFD group compared with that of mice fed control diets, which seemed to be the result of excess energy storage in the white adipose tissue of mice in the SHFD group. Conversely, SIRT3 protein expression in the white adipose tissue from the PHFD group was maintained at the same level as that of the control diet-fed mice and was not reduced despite the HFD feeding. These results suggested that partial PNO replacement prevented the down-regulation of SIRT3 caused by high-fat feeding and that PNO could alleviate mitochondrial dysregulation by maintaining SIRT3 protein expression in HFD-induced obesity.
Collectively, it seemed that PNO-fed mice showed mild CR-mimetic responses in both the control diet and HFD groups, although the actual energy intake was not significantly different from the corresponding SBO-containing diet groups. First, mice in the PHFD group showed less hepatic lipid accumulation accompanied with less whole-body fat accumulation compared with the mice in the SHFD group. Hepatic lipid reduction with whole-body weight loss is commonly observed when obese animals [39] or human subjects [40,41] were placed on CR. Higher SIRT3 protein expression in white adipose tissue from the PHFD group than that from the SHFD group further supports this idea. Secondly, mice in the PC group also showed the least body weight gain among the four groups and also showed markedly reduced Pparg mRNA expression compared to the other groups. It was reported that the hepatic Pparg mRNA level was higher in NAFLD patients [42], and CR reduced the expression of hepatic Pparg mRNA in mice [43]. Thirdly, the serum NEFA levels of mice in the PC group were higher than those of mice in the SC group (Student’s t-test, p < 0.05) even though mice in the PC group had less white adipose tissue than those in the SC group. Elevation of fasting serum NEFA is a metabolic feature of long-term CR [44], which is a result of enhanced fat mobilization as an adaptive response to CR.
The pinolenic acid (18:3, Δ5, 9, 12) in PNO (14% of the fatty acid composition) is a strong candidate for the cause of the PNO-mediated effect observed in this study. In the study by Le et al. [29], pinolenic acid elicited ligand activity for PPARα and PPARδ, and pinolenic acid treatment upregulated the downstream target genes of PPARα and PPARδ involved in fatty acid oxidation, including Pgc1a, Ucp3, Cpt1b, Acadm, and Acadl in the C2C12 myotubes cell line. The ligand activity of pinolenic acid for PPARα and PPARδ could be a reason for the lower body fat accumulation in PNO-fed mice considering the importance of PPAR in the lipid metabolism of adipose tissue. However, Le et al. mainly focused on skeletal muscle and brown adipose tissue. Thus, mechanistic studies that examine the expression of downstream genes of PPARα and PPARδ using liver and white adipose tissue cell lines could be helpful for achieving further understanding.

5. Conclusions

In conclusion, PNO consumption resulted in less body fat accumulation. Partial PNO replacement in the HFD ameliorated hepatic steatosis and prevented the down-regulation of SIRT3 in white adipose tissue. It seemed that PNO exerted a CR-mimetic effect despite no significant change in the food intake, which prevented a dysregulation of energy homeostasis in HFD-induced obesity.

Acknowledgments

This research was supported by the Basic Science Research Program through the National Research Foundation of Korea (NRF) funded by the Ministry of Education (grant number NRF-2010-0024878).

Author Contributions

Soyoung Park and Sung Nim Han contributed to the study design, performed the experiments, analyzed the data, wrote and reviewed the manuscript. Sunhye Shin, Yeseo Lim, Jae Hoon Shin, and Je Kyung Seong contributed by performing the experiments, analyzing the data, and reviewing the manuscript. All of the authors have read and approved the final manuscript.

Conflicts of Interest

The authors declare no conflict of interest.

Appendix

Table A1. NAFLD activity scores of mice fed control diets or HFDs containing SBO or PNO.
SC (n = 6)PC (n = 7)SHFD (n = 7)PHFD (n = 7)p Value
Fat AmountOil TypeInteraction
Steatosis1.00 ± 0.260.71 ± 0.291.00 ± 0.310.86 ± 0.260.800.460.80
Ballooning0.50 ± 0.340.57 ± 0.371.00 ± 0.380.86 ± 0.340.290.920.77
Inflammation0.50 ± 0.220.14 ± 0.140.29 ± 0.180.14 ± 0.140.540.160.54
NAFLD activity score (NAS)2.00 ± 0.521.43 ± 0.482.29 ± 0.641.86 ± 0.630.540.400.90
Hematoxylin and eosin (H & E) staining was used for evaluation of steatosis, degeneration of hepatocyte, and inflammation and accumulation of fat droplet was also confirmed by oil red O staining. Steatosis, hepatocellular ballooning, and lobular inflammation were graded as described previously [45] with modification. The degree of steatosis was graded using on a scale: grade 0, minimal; grade 1, moderate; grade 2, severe. Hepatocellular ballooning graded using on a scale: grade 0, minimal; grade 1, a few balloon cells; grade 2, many/prominent balloon cells. Lobular inflammation was graded on a scale: grade 0, fewer than two foci per ×20 field; grade 1, two to four foci per ×20 field; grade 2, more than four foci per ×20 field. For the NAFLD activity score (NAS), grades of steatosis, hepatocellular ballooning, and lobular inflammation were combined, ranging from 0 to 6.

References

  1. Ogden, C.L.; Yanovski, S.Z.; Carroll, M.D.; Flegal, K.M. The epidemiology of obesity. Gastroenterology 2007, 132, 2087–2102. [Google Scholar] [CrossRef] [PubMed]
  2. Browning, J.D.; Szczepaniak, L.S.; Dobbins, R.; Nuremberg, P.; Horton, J.D.; Cohen, J.C.; Grundy, S.M.; Hobbs, H.H. Prevalence of hepatic steatosis in an urban population in the United States: Impact of ethnicity. Hepatology 2004, 40, 1387–1395. [Google Scholar] [CrossRef] [PubMed]
  3. Eguchi, Y.; Hyogo, H.; Ono, M.; Mizuta, T.; Ono, N.; Fujimoto, K.; Chayama, K.; Saibara, T. Prevalence and associated metabolic factors of nonalcoholic fatty liver disease in the general population from 2009 to 2010 in Japan: A multicenter large retrospective study. J. Gastroenterol. 2012, 47, 586–595. [Google Scholar] [CrossRef] [PubMed]
  4. Park, S.H.; Jeon, W.K.; Kim, S.H.; Kim, H.J.; Park, D.I.; Cho, Y.K.; Sung, I.K.; Sohn, C.I.; Keum, D.K.; Kim, B.I. Prevalence and risk factors of non-alcoholic fatty liver disease among Korean adults. J. Gastroenterol. Hepatol. 2006, 21, 138–143. [Google Scholar] [CrossRef] [PubMed]
  5. Fabbrini, E.; Sullivan, S.; Klein, S. Obesity and nonalcoholic fatty liver disease: Biochemical, metabolic, and clinical implications. Hepatology 2010, 51, 679–689. [Google Scholar] [CrossRef] [PubMed]
  6. Anderson, N.; Borlak, J. Molecular mechanisms and therapeutic targets in steatosis and steatohepatitis. Pharmacol. Rev. 2008, 60, 311–357. [Google Scholar] [CrossRef] [PubMed]
  7. Ferramosca, A.; Zara, V. Modulation of hepatic steatosis by dietary fatty acids. World J. Gastroenterol. 2014, 20, 1746–1755. [Google Scholar] [CrossRef] [PubMed]
  8. Leamy, A.K.; Egnatchik, R.A.; Young, J.D. Molecular mechanisms and the role of saturated fatty acids in the progression of non-alcoholic fatty liver diesease. Prog. Lipid Res. 2013, 52, 165–174. [Google Scholar] [CrossRef] [PubMed]
  9. Wang, Y.; Jones, P.J. Dietary conjugated linoleic acid and body composition. Am. J. Clin. Nutr. 2004, 79, S1153–S1158. [Google Scholar]
  10. Scorletti, E.; Byrne, C.D. Omega-3 fatty acids, hepatic lipid metabolism, and nonalcoholic fatty liver disease. Annu. Rev. Nutr. 2013, 33, 231–248. [Google Scholar] [CrossRef] [PubMed]
  11. Asset, G.; Baugé, E.; Wolff, R.L.; Fruchart, J.C.; Dallongeville, J. Pinus pinaster oil affects lipoprotein metabolism in apolipoprotein E-deficient mice. J. Nutr. 1999, 129, 1972–1978. [Google Scholar] [PubMed]
  12. Asset, G.; Baugé, E.; Wolff, R.L.; Fruchart, J.C.; Dallongeville, J. Effects of dietary maritime pine seed oil on lipoprotein metabolism and atherosclerosis development in mice expressing human apolipoprotein B. Eur. J. Nutr. 2001, 40, 268–274. [Google Scholar] [CrossRef] [PubMed]
  13. Ferramosca, A.; Savy, V.; Einerhand, A.W.C.; Zara, V. Pinus koraiensis seed oil (PinnoThin™) supplementation reduces body weight gain and lipid concentration in liver and plasma of mice. J. Anim. Feed Sci. 2008, 17, 621–630. [Google Scholar]
  14. Ferramosca, A.; Savy, V.; Conte, L.; Zara, V. Dietary combination of conjugated linoleic acid (CLA) and pine nut oil prevents CLA-induced fatty liver in mice. J. Agric. Food Chem. 2008, 56, 8148–8158. [Google Scholar] [CrossRef] [PubMed]
  15. Hughes, G.M.; Boyland, E.J.; Williams, N.J.; Mennen, L.; Scott, C.; Kirkham, T.C.; Harrold, J.A.; Keizer, H.G.; Halford, J.C. The effect of Korean pine nut oil (PinnoThin™) on food intake, feeding behaviour and appetite: A double-blind placebo-controlled trial. Lipids Health Dis. 2008, 7, 6. [Google Scholar] [CrossRef] [PubMed]
  16. Pasman, W.J.; Heimerikx, J.; Rubingh, C.M.; van den Berg, R.; O’Shea, M.; Gambelli, L.; Hendriks, H.F.; Einerhand, A.W.; Scott, C.; Keizer, H.G.; et al. The effect of Korean pine nut oil on in vitro CCK release, on appetite sensations and on gut hormones in post-menopausal overweight women. Lipids Health Dis. 2008, 7, 10. [Google Scholar] [CrossRef] [PubMed]
  17. Nogueiras, R.; Habegger, K.M.; Chaudhary, N.; Finan, B.; Banks, A.S.; Dietrich, M.O.; Horvath, T.L.; Sinclair, D.A.; Pfluger, P.T.; Tschöp, M.H. Sirtuin 1 and sirtuin 3: Physiological modulators of metabolism. Physiol. Rev. 2012, 92, 1479–1514. [Google Scholar] [CrossRef] [PubMed]
  18. Sebastián, C.; Satterstrom, F.K.; Haigis, M.C.; Mostoslavsky, R. From sirtuin biology to human diseases: An update. J. Biol. Chem. 2012, 287, 42444–42452. [Google Scholar] [CrossRef] [PubMed]
  19. Parihar, P.; Solanki, I.; Mansuri, M.L.; Parihar, M.S. Mitochondrial sirtuins: Emerging roles in metabolic regulations, energy homeostasis and disease. Exp. Gerontol. 2015, 61, 130–141. [Google Scholar] [CrossRef] [PubMed]
  20. Folch, J.; Lees, M.; Sloane Stanley, G.H. A simple method for the isolation and purification of total lipides from animal tissues. J. Biol. Chem. 1957, 226, 497–509. [Google Scholar] [PubMed]
  21. Tiniakos, D.G.; Vos, M.B.; Brunt, E.M. Nonalcoholic fatty liver disease: Pathology and pathogenesis. Annu. Rev. Pathol. 2010, 5, 145–171. [Google Scholar] [CrossRef] [PubMed]
  22. De Vogel-van den Bosch, H.M.; de Wit, N.J.; Hooiveld, G.J.; Vermeulen, H.; van der Veen, J.N.; Houten, S.M.; Kuipers, F.; Műller, M.; van der Meer, R. A cholesterol-free, high-fat diet suppresses gene expression of cholesterol transporters in murine small intestine. Am. J. Physiol. Gastrointest. Liver Physiol. 2008, 294, G1171–G1180. [Google Scholar] [CrossRef] [PubMed]
  23. Desmarchelier, C.; Dahlhoff, C.; Keller, S.; Sailer, M.; Jahreis, G.; Daniel, H. C57Bl/6 N mice on a western diet display reduced intestinal and hepatic cholesterol levels despite a plasma hypercholesterolemia. BMC Genomics 2012, 13, 84. [Google Scholar] [CrossRef] [PubMed]
  24. Schrauwen, P.; Wagenmakers, A.J.; van Marken Lichtenbelt, W.D.; Saris, W.H.; Westerterp, K.R. Increase in fat oxidation on a high-fat diet is accompanied by an increase in triglyceride-derived fatty acid oxidation. Diabetes 2000, 49, 640–646. [Google Scholar] [CrossRef] [PubMed]
  25. Sunny, N.E.; Parks, E.J.; Browning, J.D.; Burgess, S.C. Excessive hepatic mitochondrial TCA cycle and gluconeogenesis in humans with nonalcoholic fatty liver disease. Cell Metab. 2011, 14, 804–810. [Google Scholar] [CrossRef] [PubMed]
  26. Miao, L.; St Clair, D.K. Regulation of superoxide dismutase genes: Implications in disease. Free Radic. Biol. Med. 2009, 47, 344–356. [Google Scholar] [CrossRef] [PubMed]
  27. Eaton, S. Control of mitochondrial β-oxidation flux. Prog. Lipid Res. 2002, 41, 197–239. [Google Scholar] [CrossRef]
  28. Bartlett, K.; Eaton, S. Mitochondrial β-oxidation. Eur. J. Biochem. 2004, 271, 462–469. [Google Scholar] [CrossRef] [PubMed]
  29. Le, N.H.; Shin, S.; Tu, T.H.; Kim, C.S.; Kang, J.H.; Tsuyoshi, G.; Teruo, K.; Han, S.N.; Yu, R. Diet enriched with Korean pine nut oil improves mitochondrial oxidative metabolism in skeletal muscle and brown adipose tissue in diet-induced obesity. J. Agric. Food Chem. 2012, 60, 11935–11941. [Google Scholar] [CrossRef] [PubMed]
  30. Stefan, N.; Fritsche, A.; Weikert, C.; Boeing, H.; Joost, H.G.; Häring, H.U.; Schulze, M.B. Plasma fetuin-A levels and the risk of type 2 diabetes. Diabetes 2008, 57, 2762–2767. [Google Scholar] [CrossRef] [PubMed]
  31. Brix, J.M.; Stingl, H.; Hollerl, F.; Schernthaner, G.H.; Kopp, H.P.; Schernthaner, G. Elevated Fetuin-A concentrations in morbid obesity decrease after dramatic weight loss. J. Clin. Endocrinol. Metab. 2010, 95, 4877–4881. [Google Scholar] [CrossRef] [PubMed]
  32. Reinehr, T.; Roth, C.L. Fetuin-A and its relation to metabolic syndrome and fatty liver disease in obese children before and after weight loss. J. Clin. Endocrinol. Metab. 2008, 93, 4479–4485. [Google Scholar] [CrossRef] [PubMed]
  33. Mathews, S.T.; Singh, G.P.; Ranalletta, M.; Cintron, V.J.; Qiang, X.; Goustin, A.S.; Jen, K.L.; Charron, M.J.; Jahnen-Dechent, W.; Grunberger, G. Improved insulin sensitivity and resistance to weight gain in mice null for the Ahsg gene. Diabetes 2002, 51, 2450–2458. [Google Scholar] [CrossRef] [PubMed]
  34. Stefan, N.; Hennige, A.M.; Staiger, H.; Machann, J.; Schick, F.; Kröber, S.M.; Machicao, F.; Fritsche, A.; Häring, H.U. Alpha2-Heremans-Schmid glycoprotein/fetuin-A is associated with insulin resistance and fat accumulation in the liver in humans. Diabetes Care 2006, 29, 853–857. [Google Scholar] [CrossRef] [PubMed]
  35. Haukeland, J.W.; Dahl, T.B.; Yndestad, A.; Gladhaug, I.P.; Løberg, E.M.; Haaland, T.; Konopski, Z.; Wium, C.; Aasheim, E.T.; Johansen, O.E.; et al. Fetuin A in nonalcoholic fatty liver disease: In vivo and in vitro studies. Eur. J. Endocrinol. 2012, 166, 503–510. [Google Scholar] [CrossRef] [PubMed]
  36. Donnelly, K.L.; Smith, C.I.; Schwarzenberg, S.J.; Jessurun, J.; Boldt, M.D.; Parks, E.J. Sources of fatty acids stored in liver and secreted via lipoproteins in patients with nonalcoholic fatty liver disease. J. Clin. Investig. 2005, 115, 1343–1351. [Google Scholar] [CrossRef] [PubMed]
  37. Hirschey, M.D.; Shimazu, T.; Goetzman, E.; Jing, E.; Schwer, B.; Lombard, D.B.; Grueter, C.A.; Harris, C.; Biddinger, S.; Ilkayeva, O.R.; et al. SIRT3 regulates mitochondrial fatty-acid oxidation by reversible enzyme deacetylation. Nature 2010, 464, 121–125. [Google Scholar] [CrossRef] [PubMed]
  38. Qiu, X.; Brown, K.; Hirschey, M.D.; Verdin, E.; Chen, D. Calorie restriction reduces oxidative stress by SIRT3-mediated SOD2 activation. Cell Metab. 2010, 12, 662–667. [Google Scholar] [CrossRef] [PubMed]
  39. Rector, R.S.; Uptergrove, G.M.; Morris, E.M.; Borengasser, S.J.; Laughlin, M.H.; Booth, F.W.; Thyfault, J.P.; Ibdah, J.A. Daily exercise vs. caloric restriction for prevention of nonalcoholic fatty liver disease in the OLETF rat model. Am. J. Physiol. Gastrointest. Liver Physiol. 2011, 300, G874–G883. [Google Scholar] [CrossRef] [PubMed]
  40. Snel, M.; Jonker, J.T.; Hammer, S.; Kerpershoek, G.; Lamb, H.J.; Meinders, A.E.; Pijl, H.; de Roos, A.; Romijn, J.A.; Smit, J.W.; et al. Long-term beneficial effect of a 16-week very low calorie diet on pericardial fat in obese type 2 diabetes mellitus patients. Obesity 2012, 20, 1572–1576. [Google Scholar] [CrossRef]
  41. Edholm, D.; Kullberg, J.; Haenni, A.; Karlsson, F.A.; Ahlström, A.; Hedberg, J.; Ahlström, H.; Sundbom, M. Preoperative 4-week low-calorie diet reduces liver volume and intrahepatic fat, and facilitates laparoscopic gastric bypass in morbidly obese. Obes. Surg. 2011, 21, 345–350. [Google Scholar] [CrossRef] [PubMed]
  42. Pettinelli, P.; Videla, L.A. Up-regulation of PPAR-gamma mRNA expression in the liver of obese patients: An additional reinforcing lipogenic mechanism to SREBP-1c induction. J. Clin. Endocrinol. Metab. 2011, 96, 1424–1430. [Google Scholar] [CrossRef] [PubMed]
  43. Mulligan, J.D.; Stewart, A.M.; Saupe, K.W. Downregulation of plasma insulin levels and hepatic PPARgamma expression during the first week of caloric restriction in mice. Exp. Gerontol. 2008, 43, 146–153. [Google Scholar] [CrossRef] [PubMed]
  44. Bruss, M.D.; Khambatta, C.F.; Ruby, M.A.; Aggarwal, I.; Hellerstein, M.K. Calorie restriction increases fatty acid synthesis and whole body fat oxidation rates. Am. J. Physiol. Endocrinol. Metab. 2010, 298, E108–E116. [Google Scholar] [CrossRef] [PubMed]
  45. Kleiner, D.E.; Brunt, E.M.; van Natta, M.; Behling, C.; Contos, M.J.; Cummings, O.W.; Ferrell, L.D.; Liu, Y.C.; Torbenson, M.S.; Unalp-Arida, A.; et al. Design and validation of a histological scoring system for nonalcoholic fatty liver disease. Hepatology 2005, 41, 1313–1321. [Google Scholar] [CrossRef] [PubMed]

