Bovine Peripheral Blood Mononuclear Cells Are More Sensitive to Deoxynivalenol Than Those Derived from Poultry and Swine

 , , and
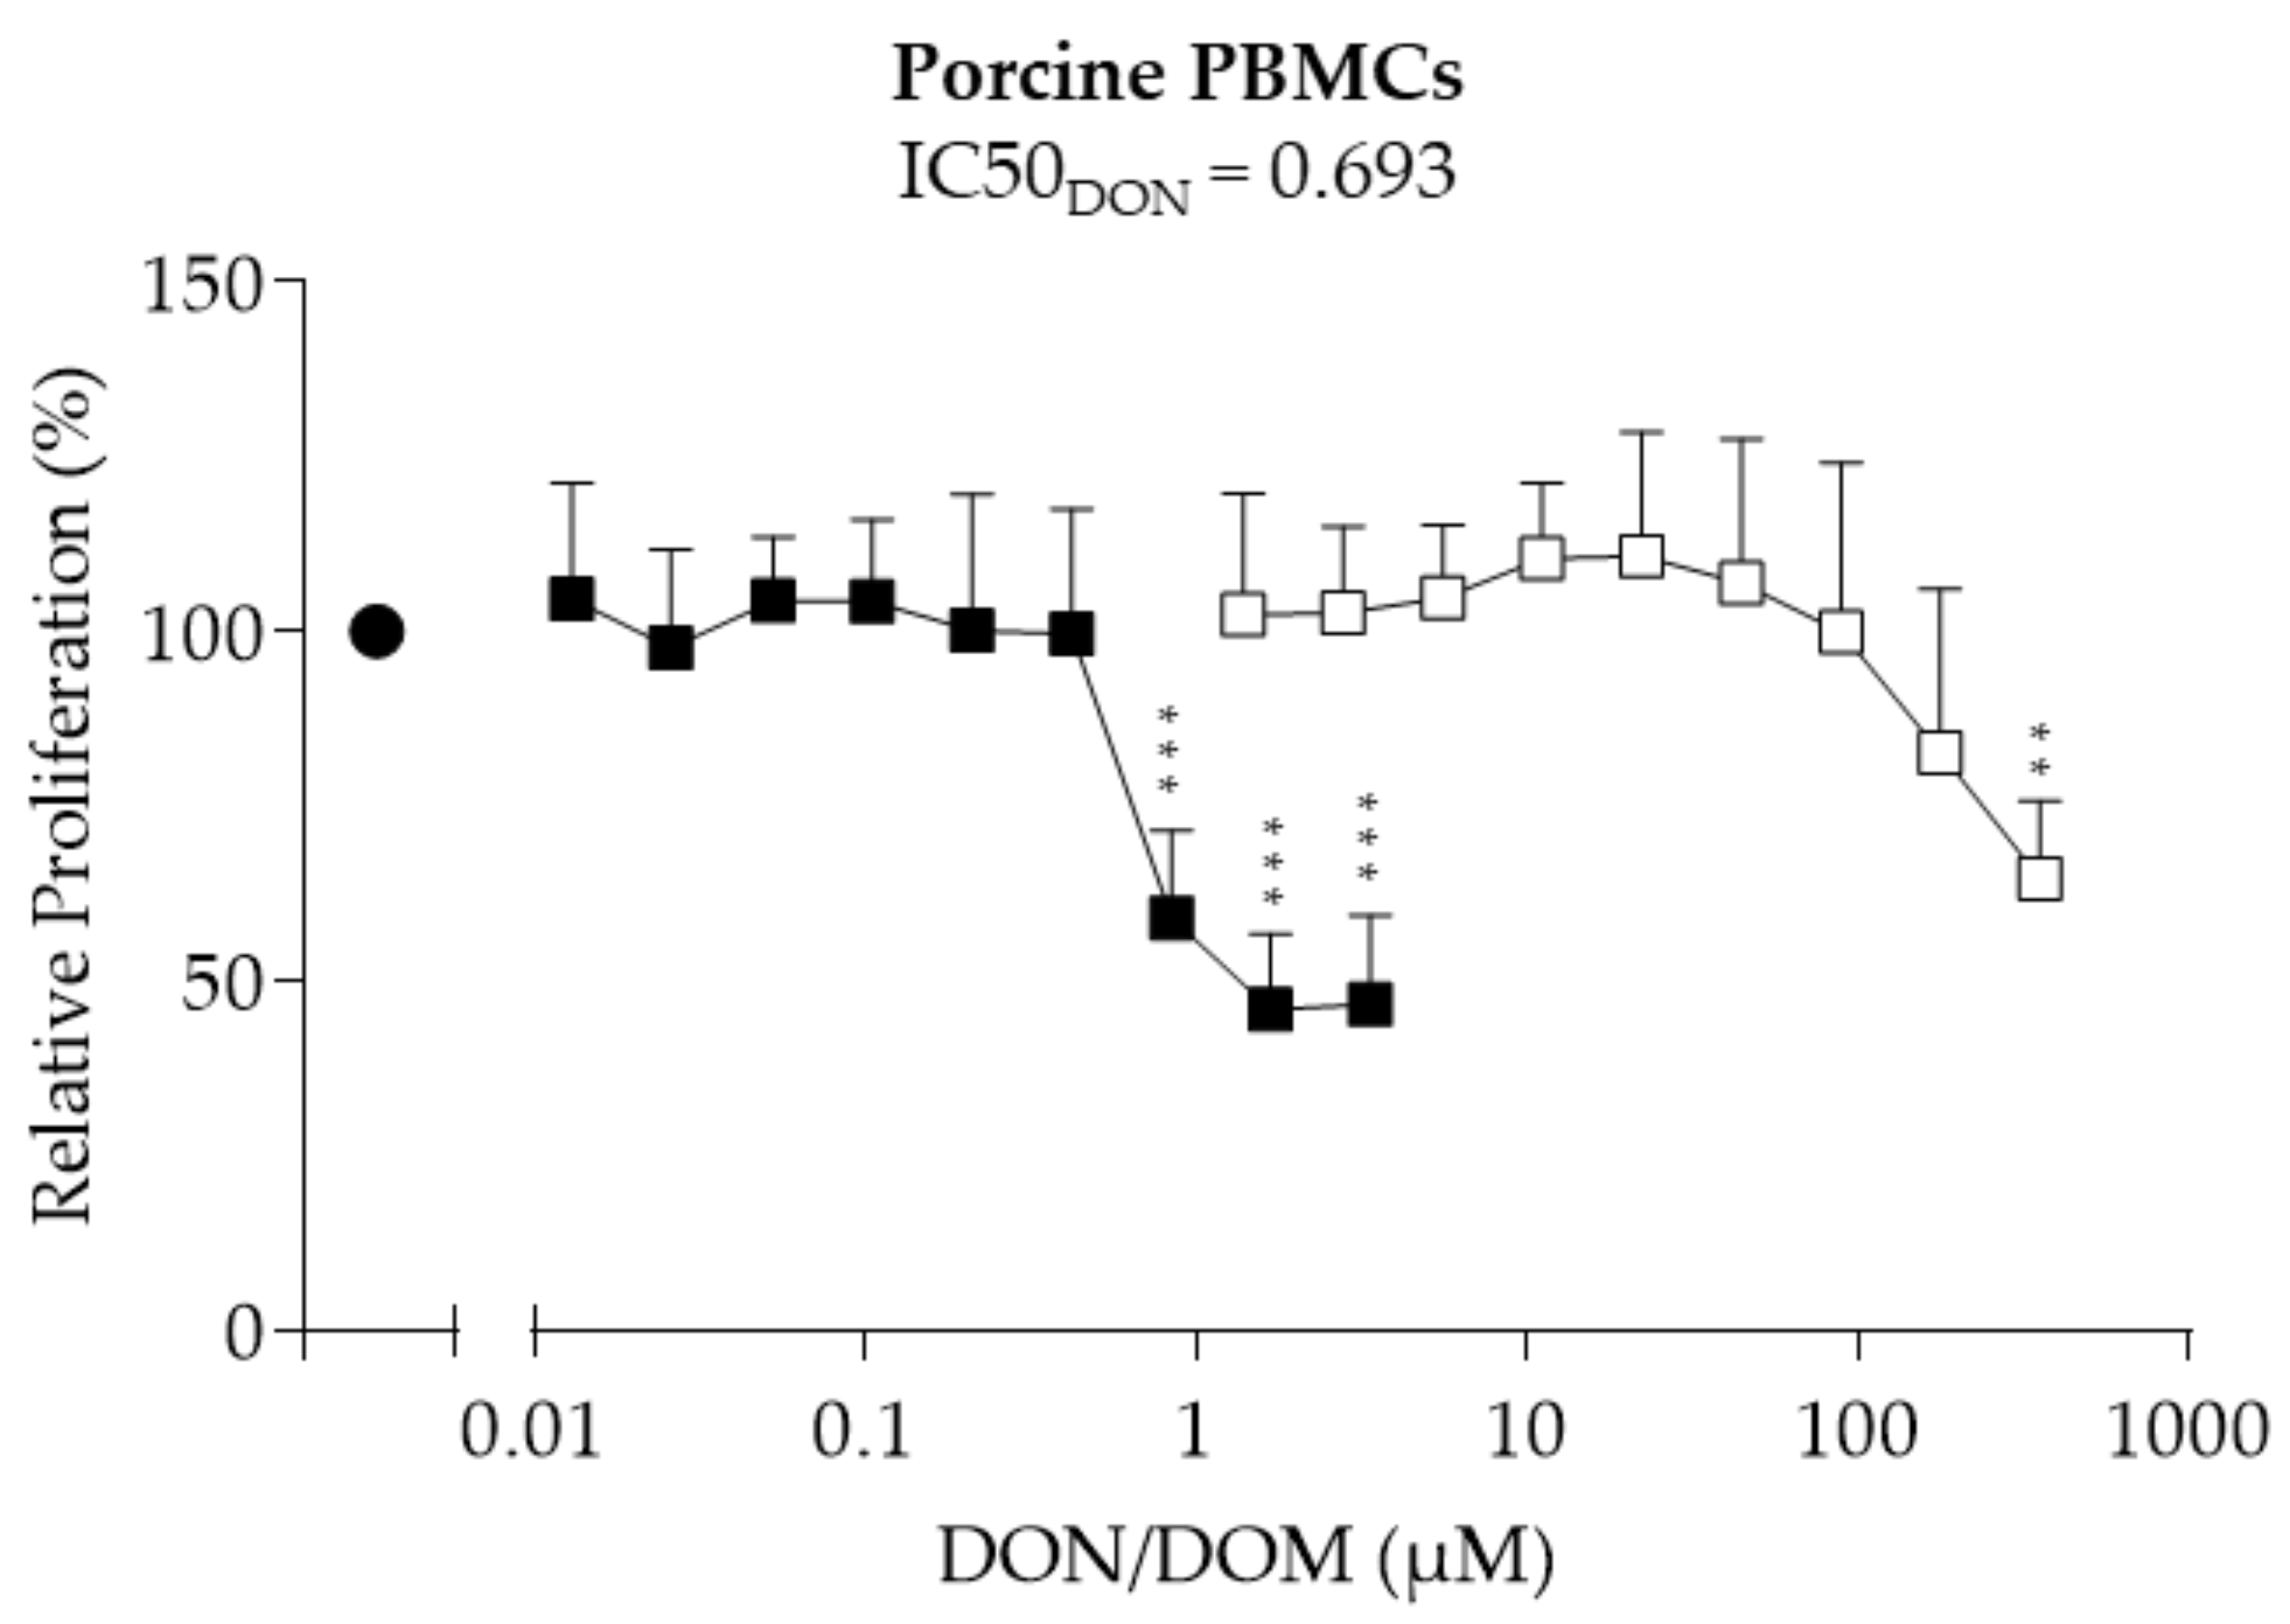
Abstract
:1. Introduction
2. Results
2.1. Porcine PBMCs
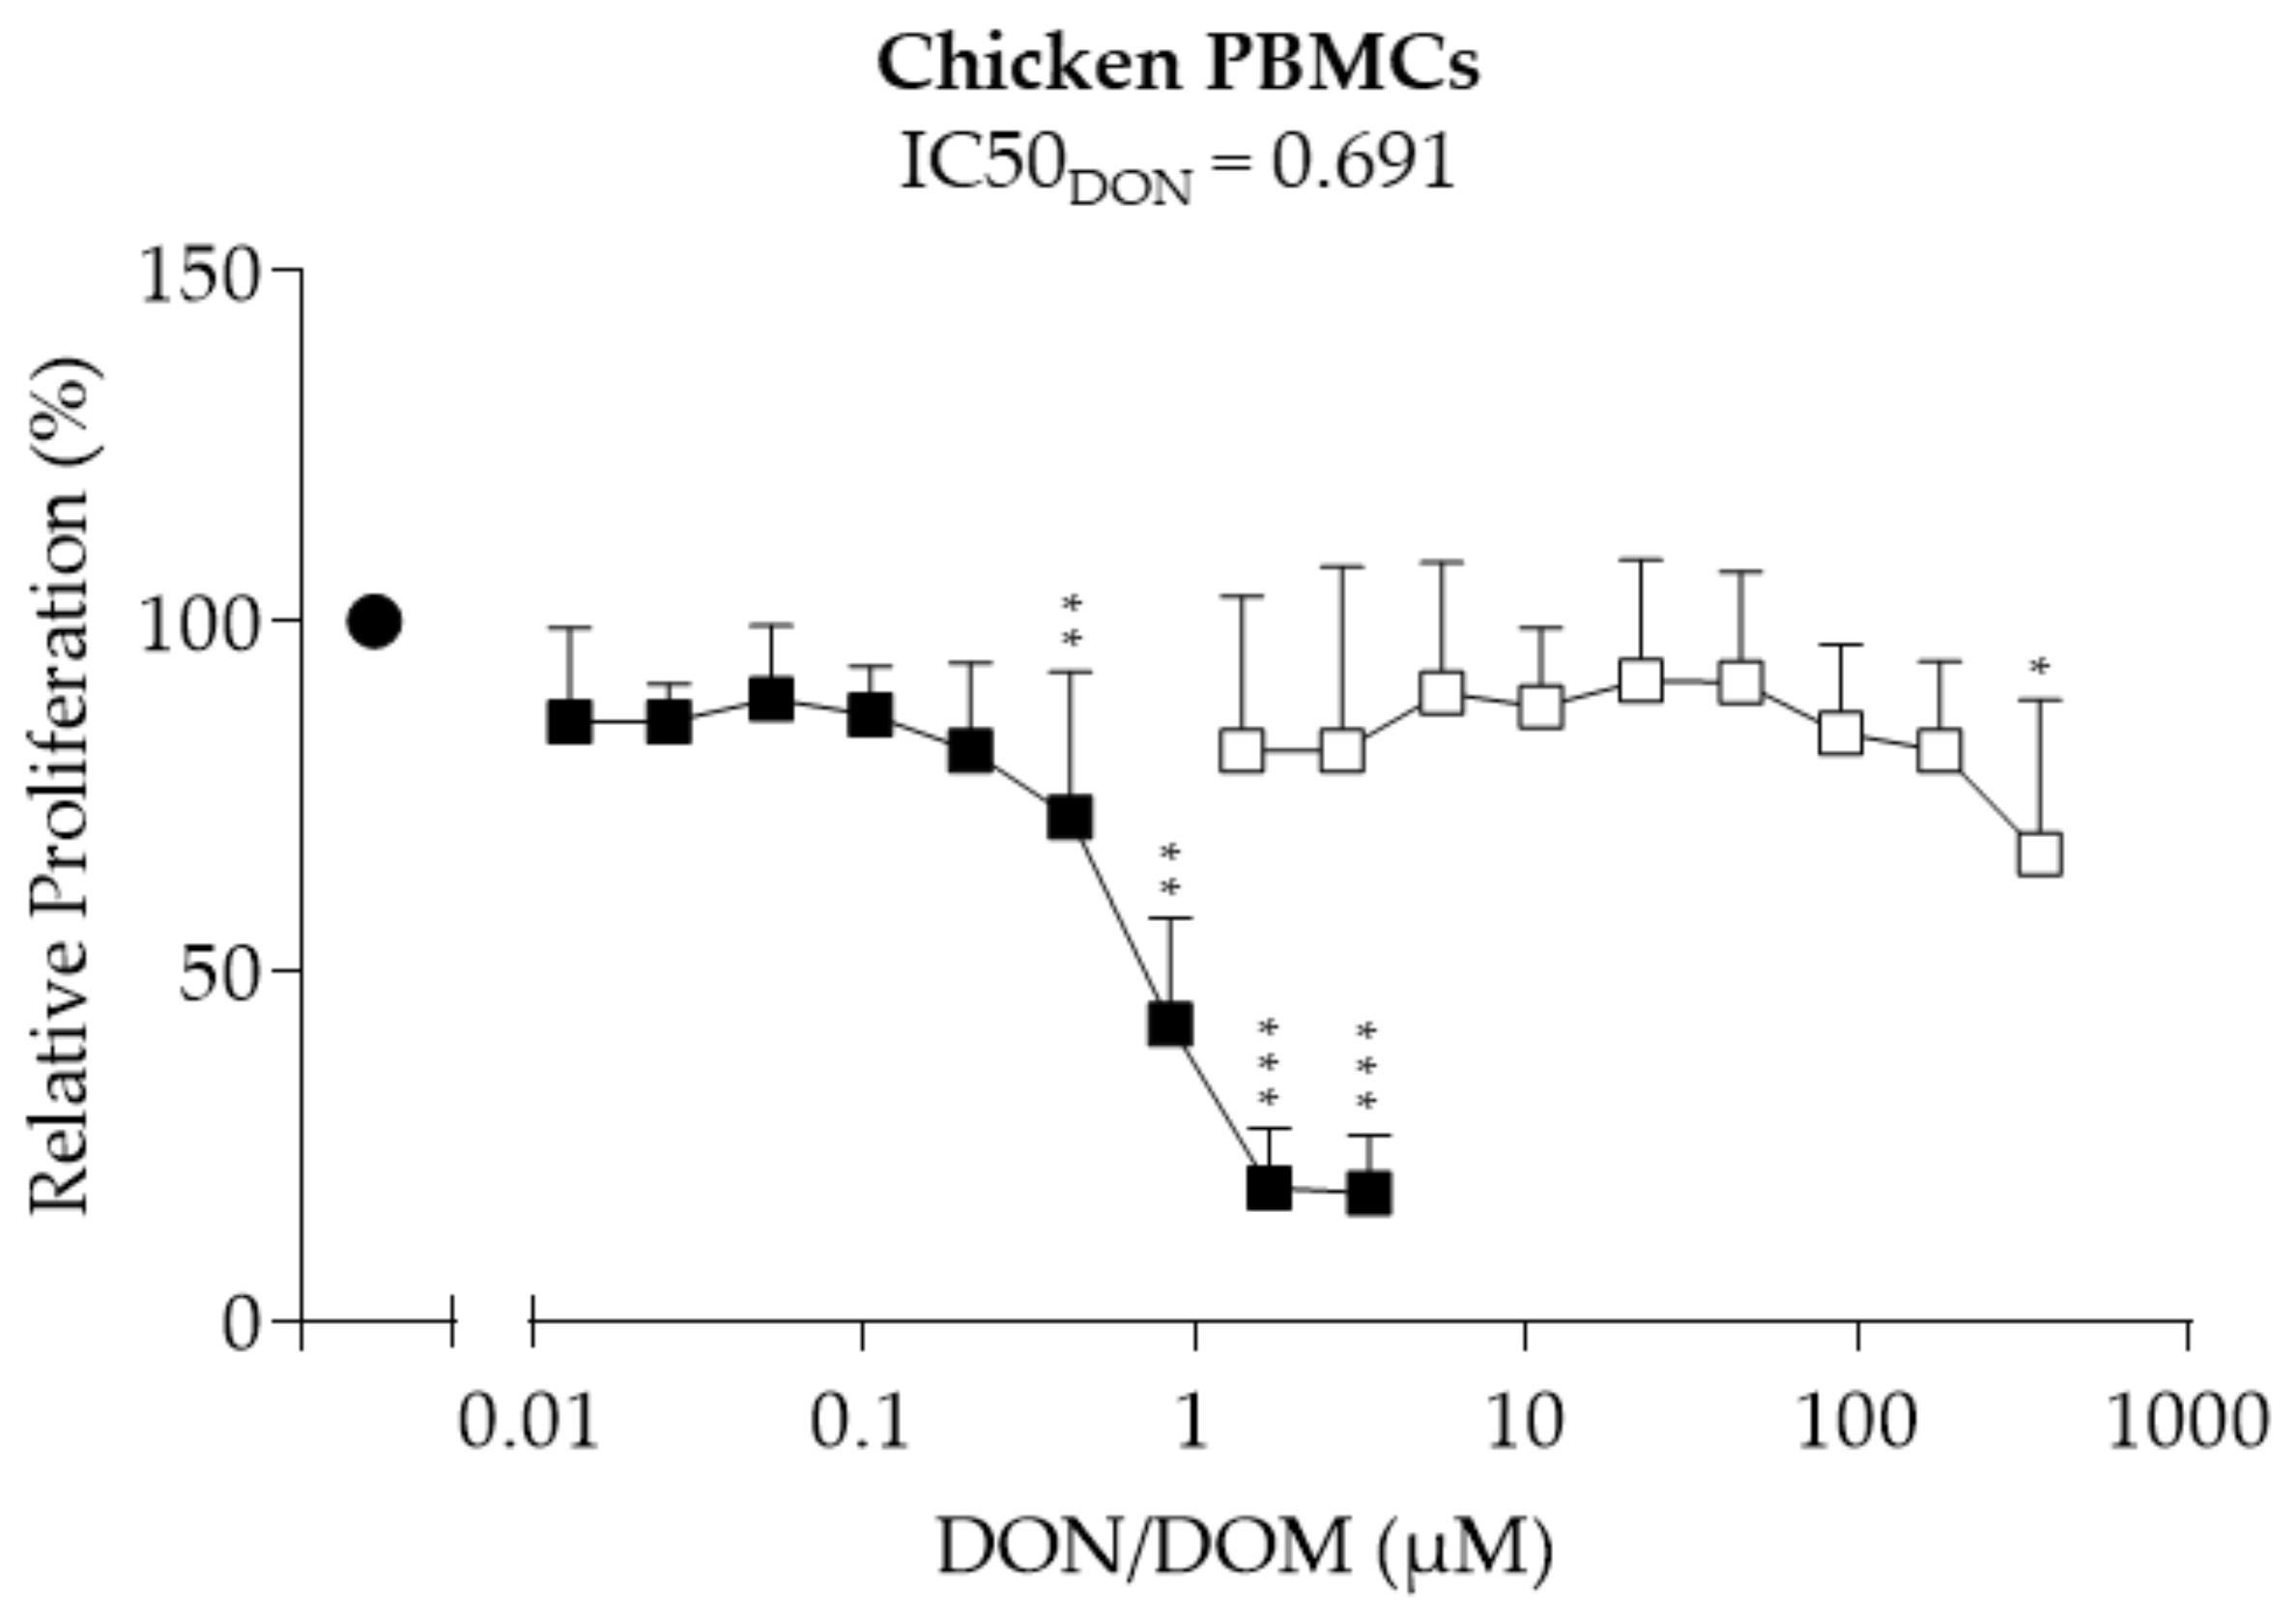
2.2. Chicken PBMCs
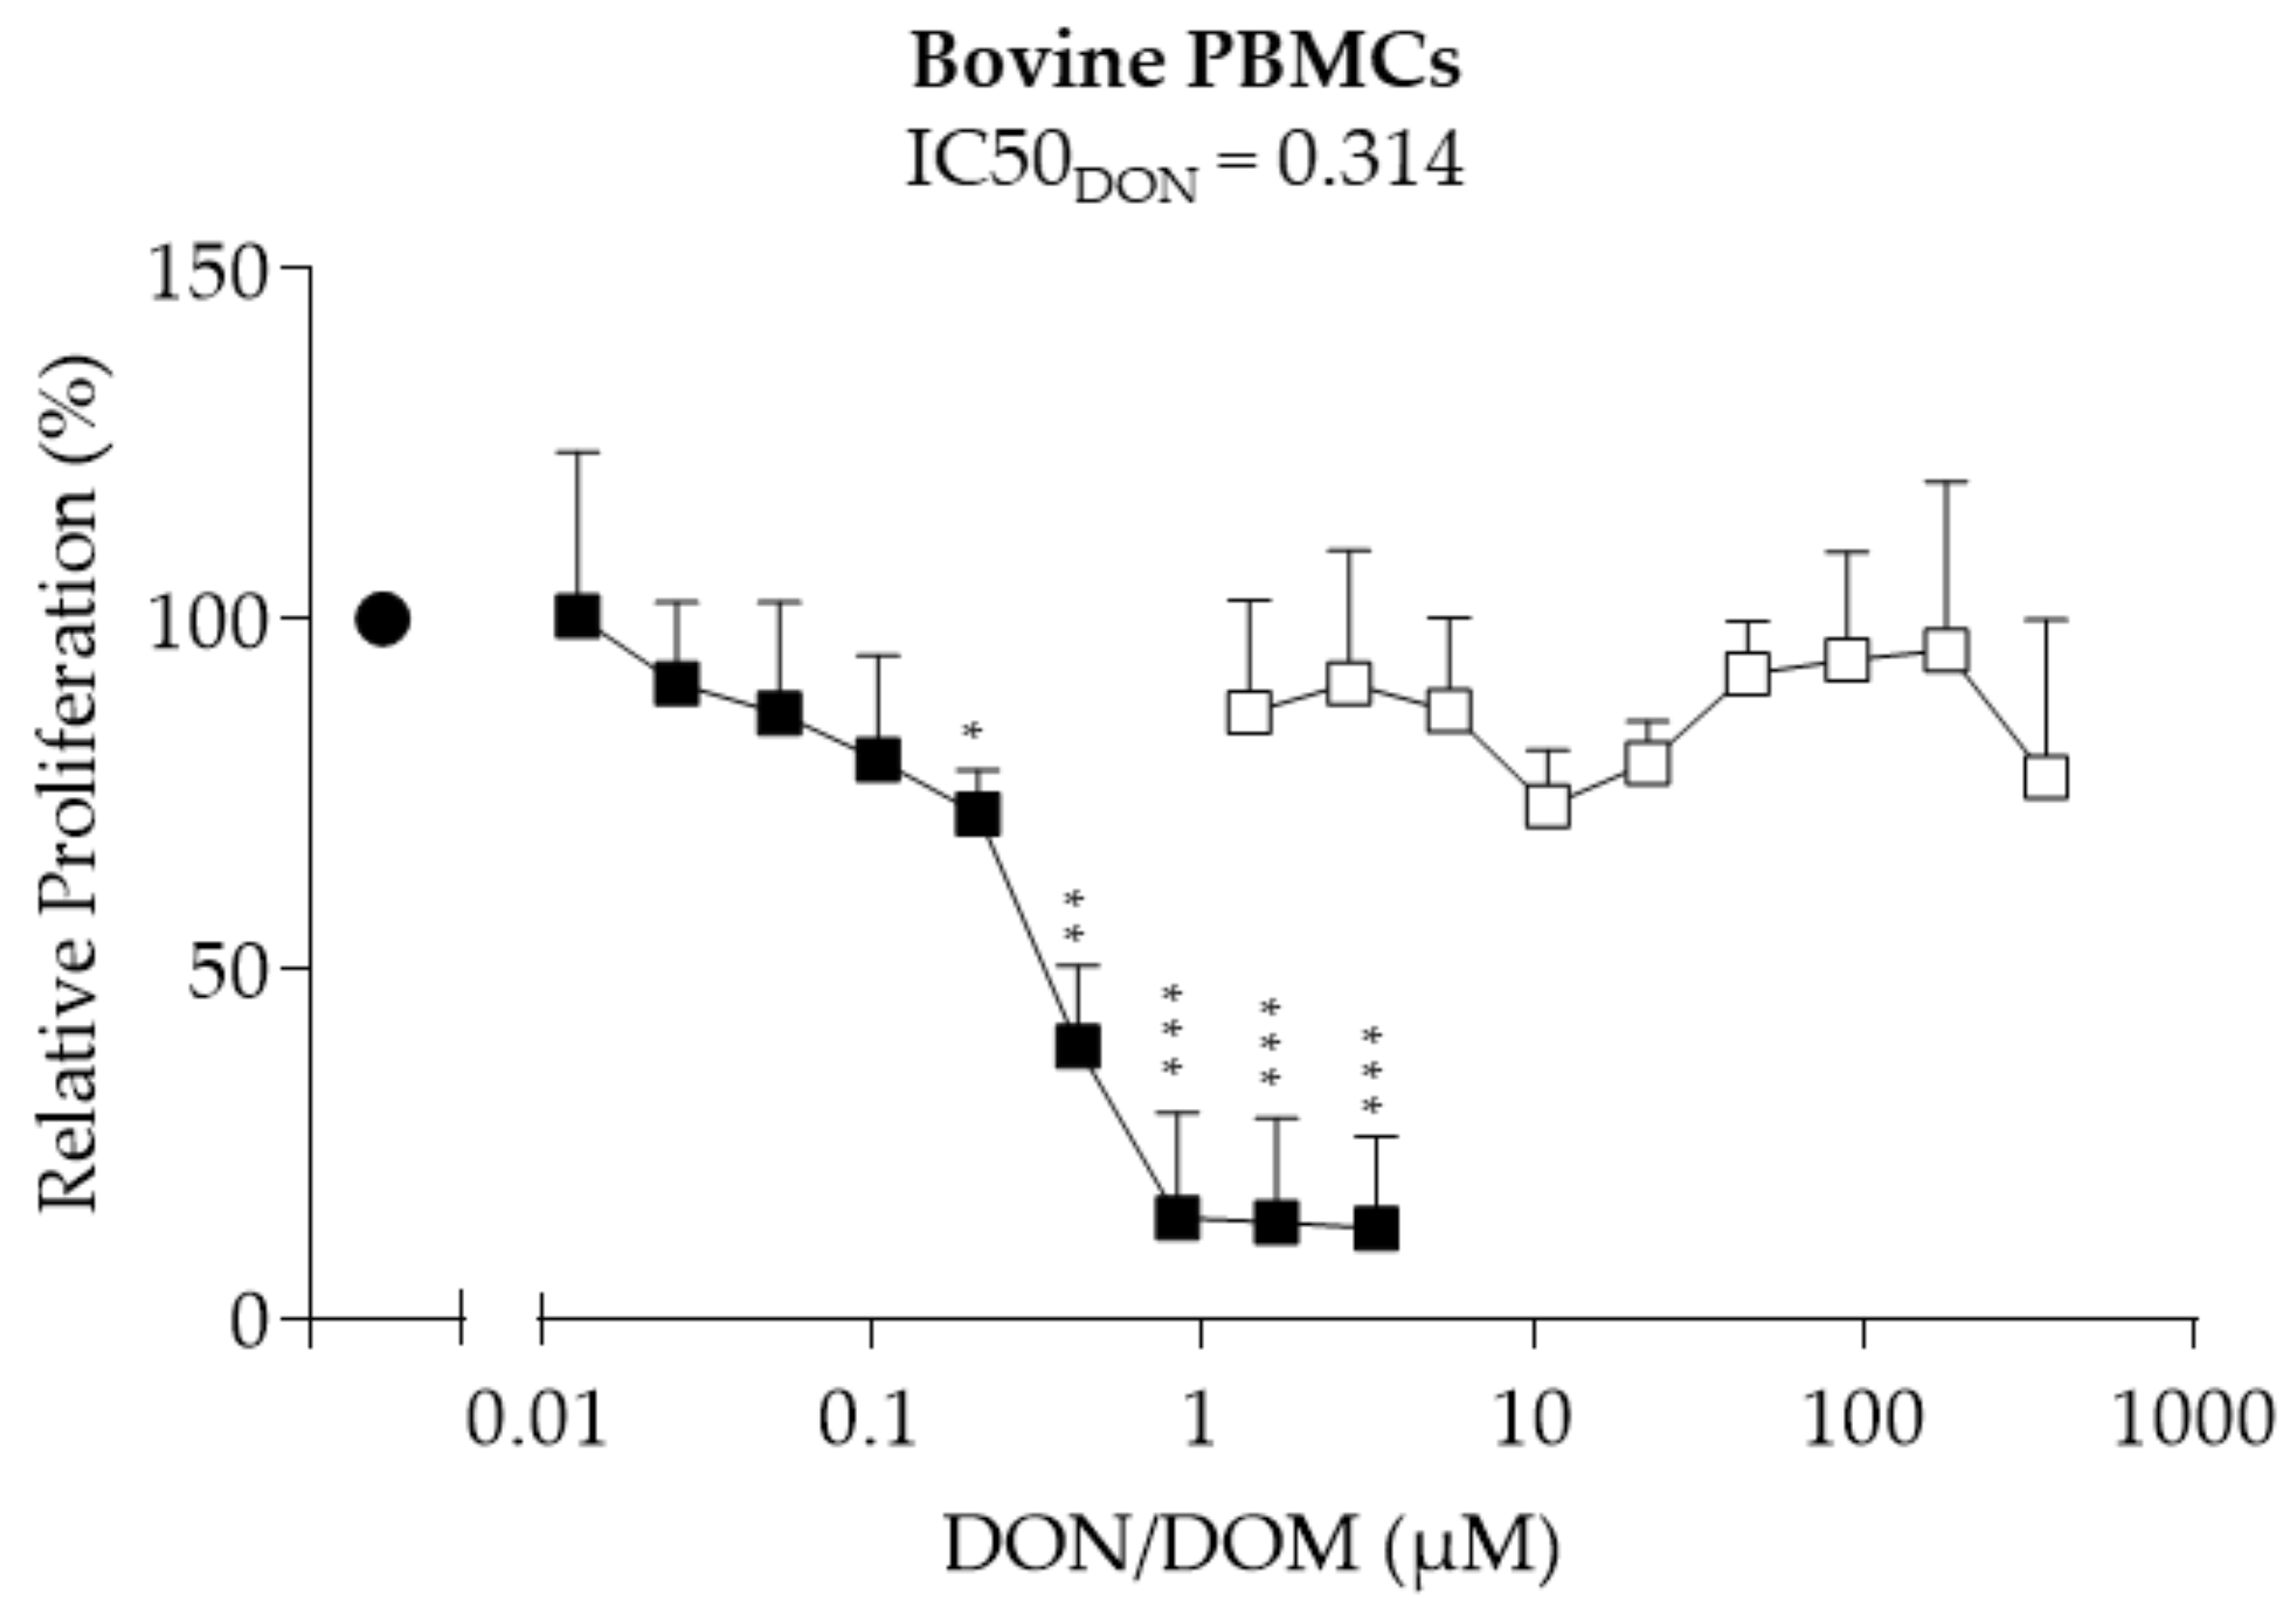
2.3. Bovine PBMCs
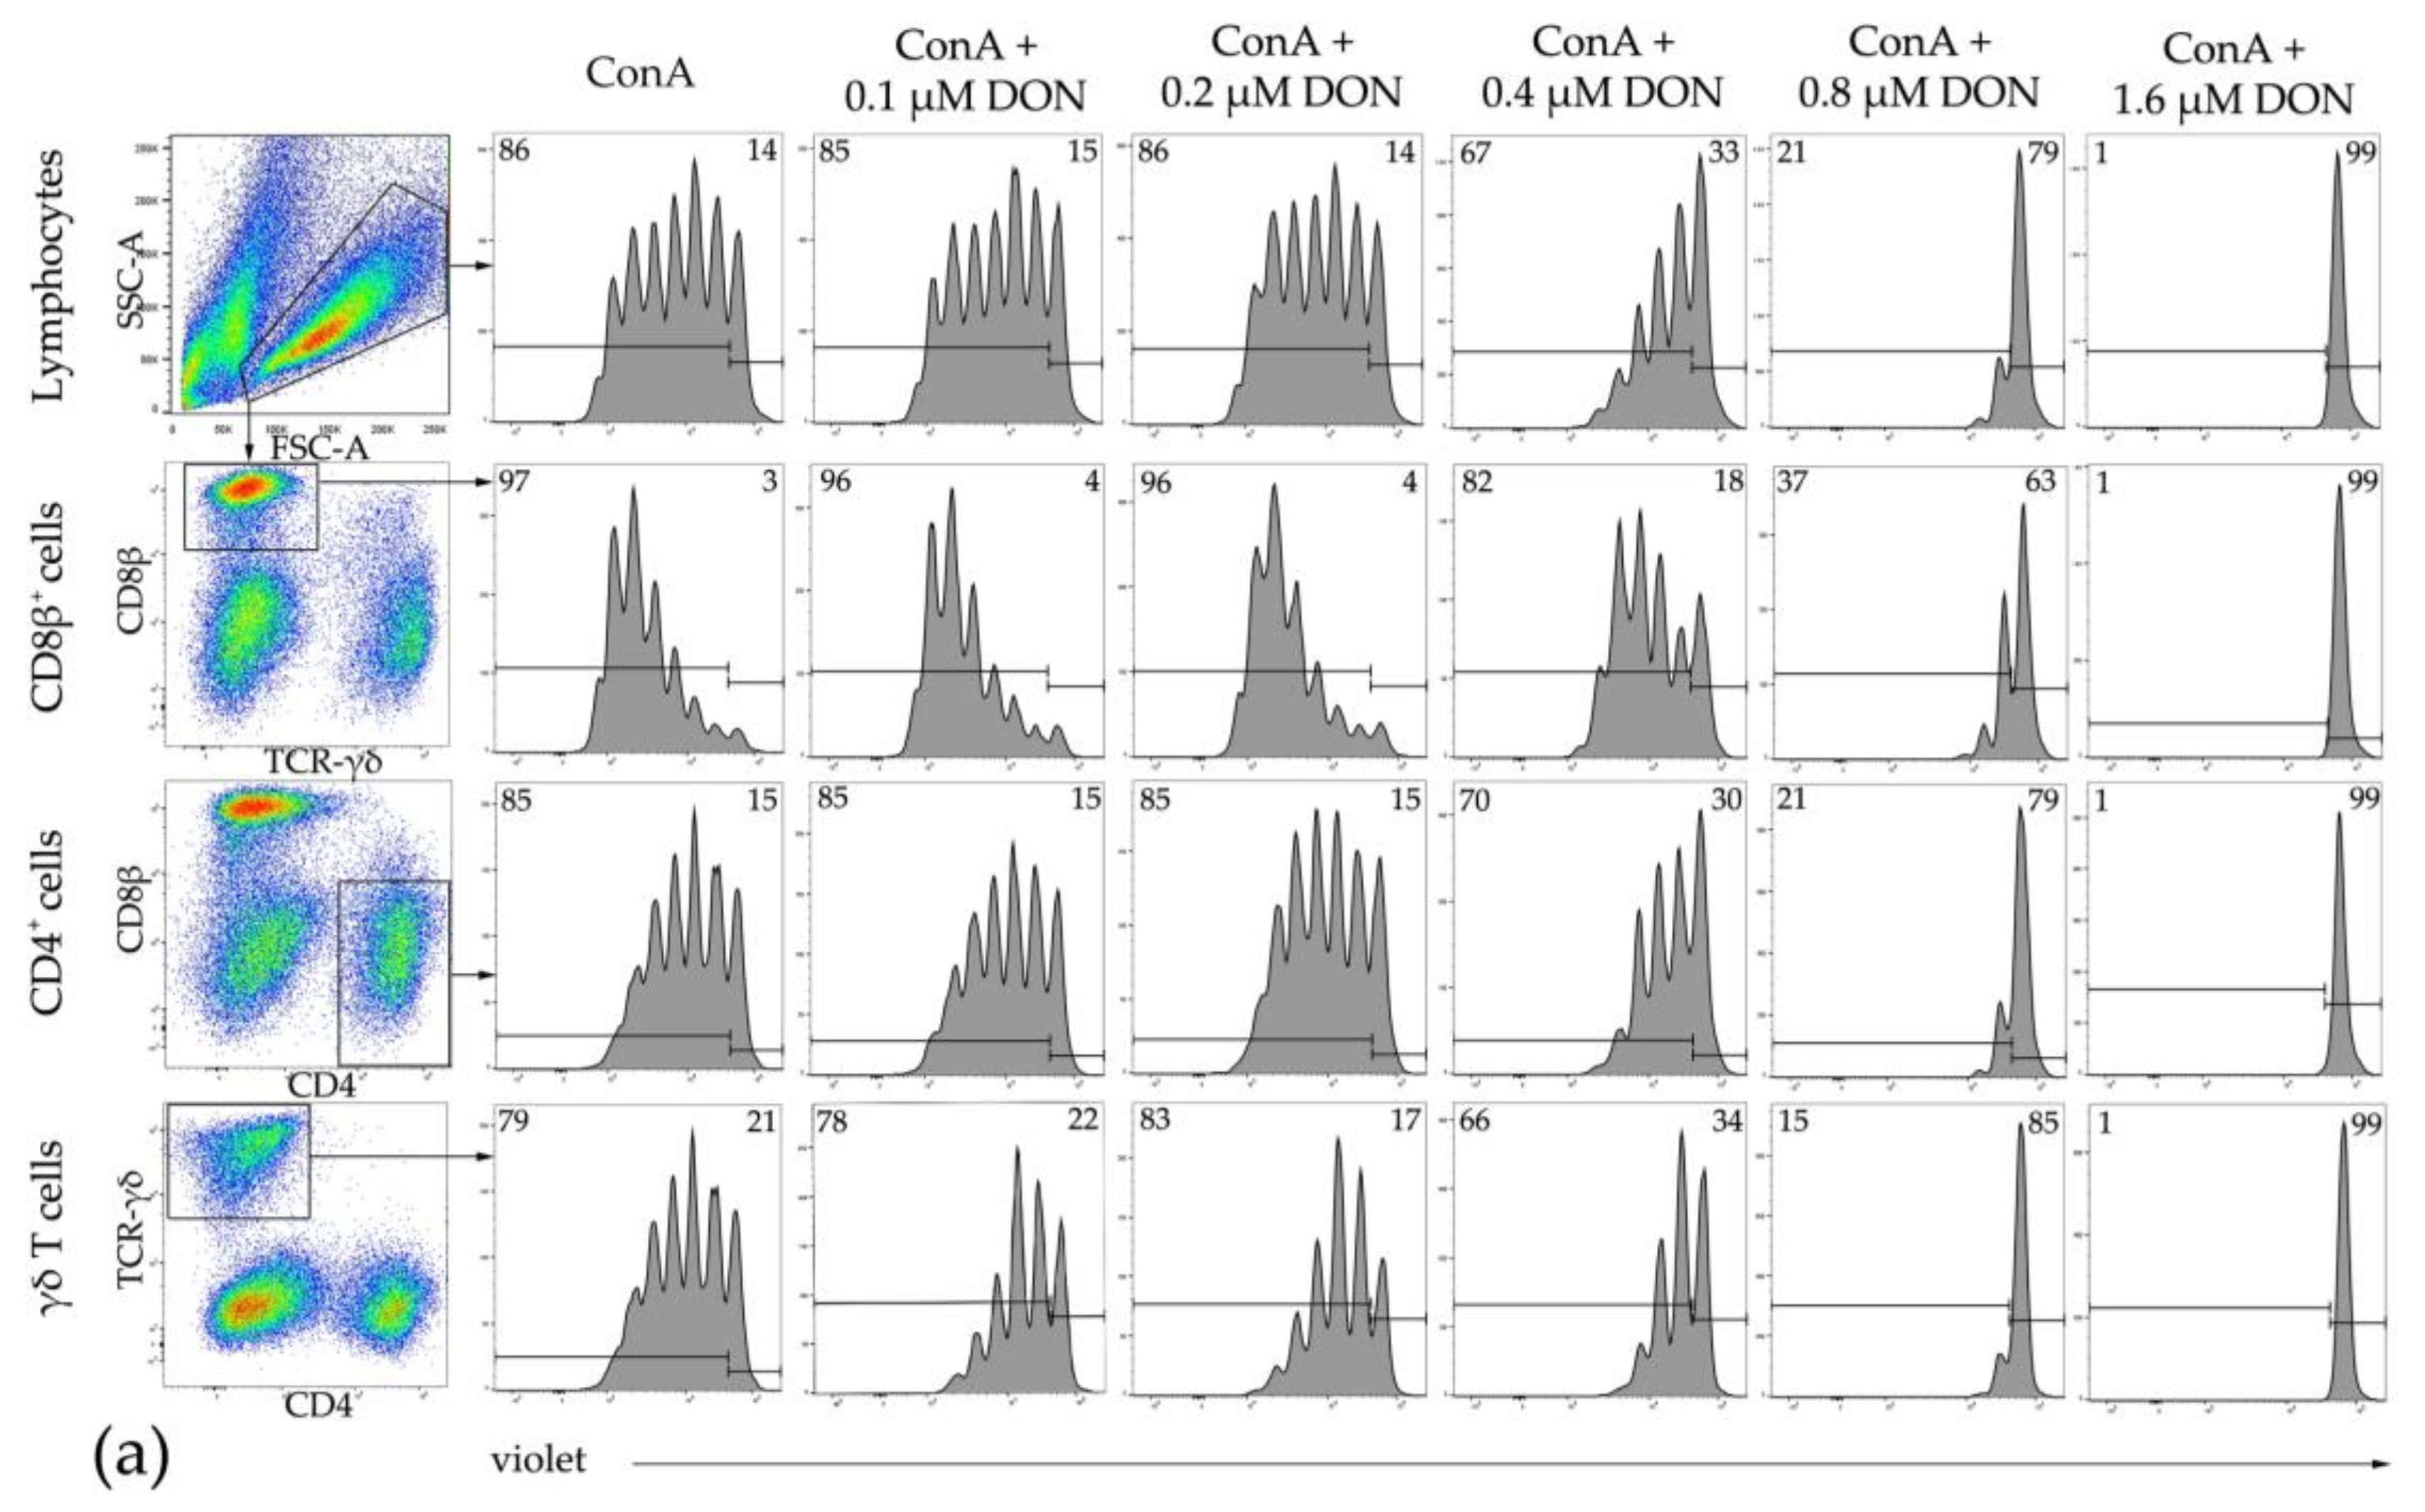
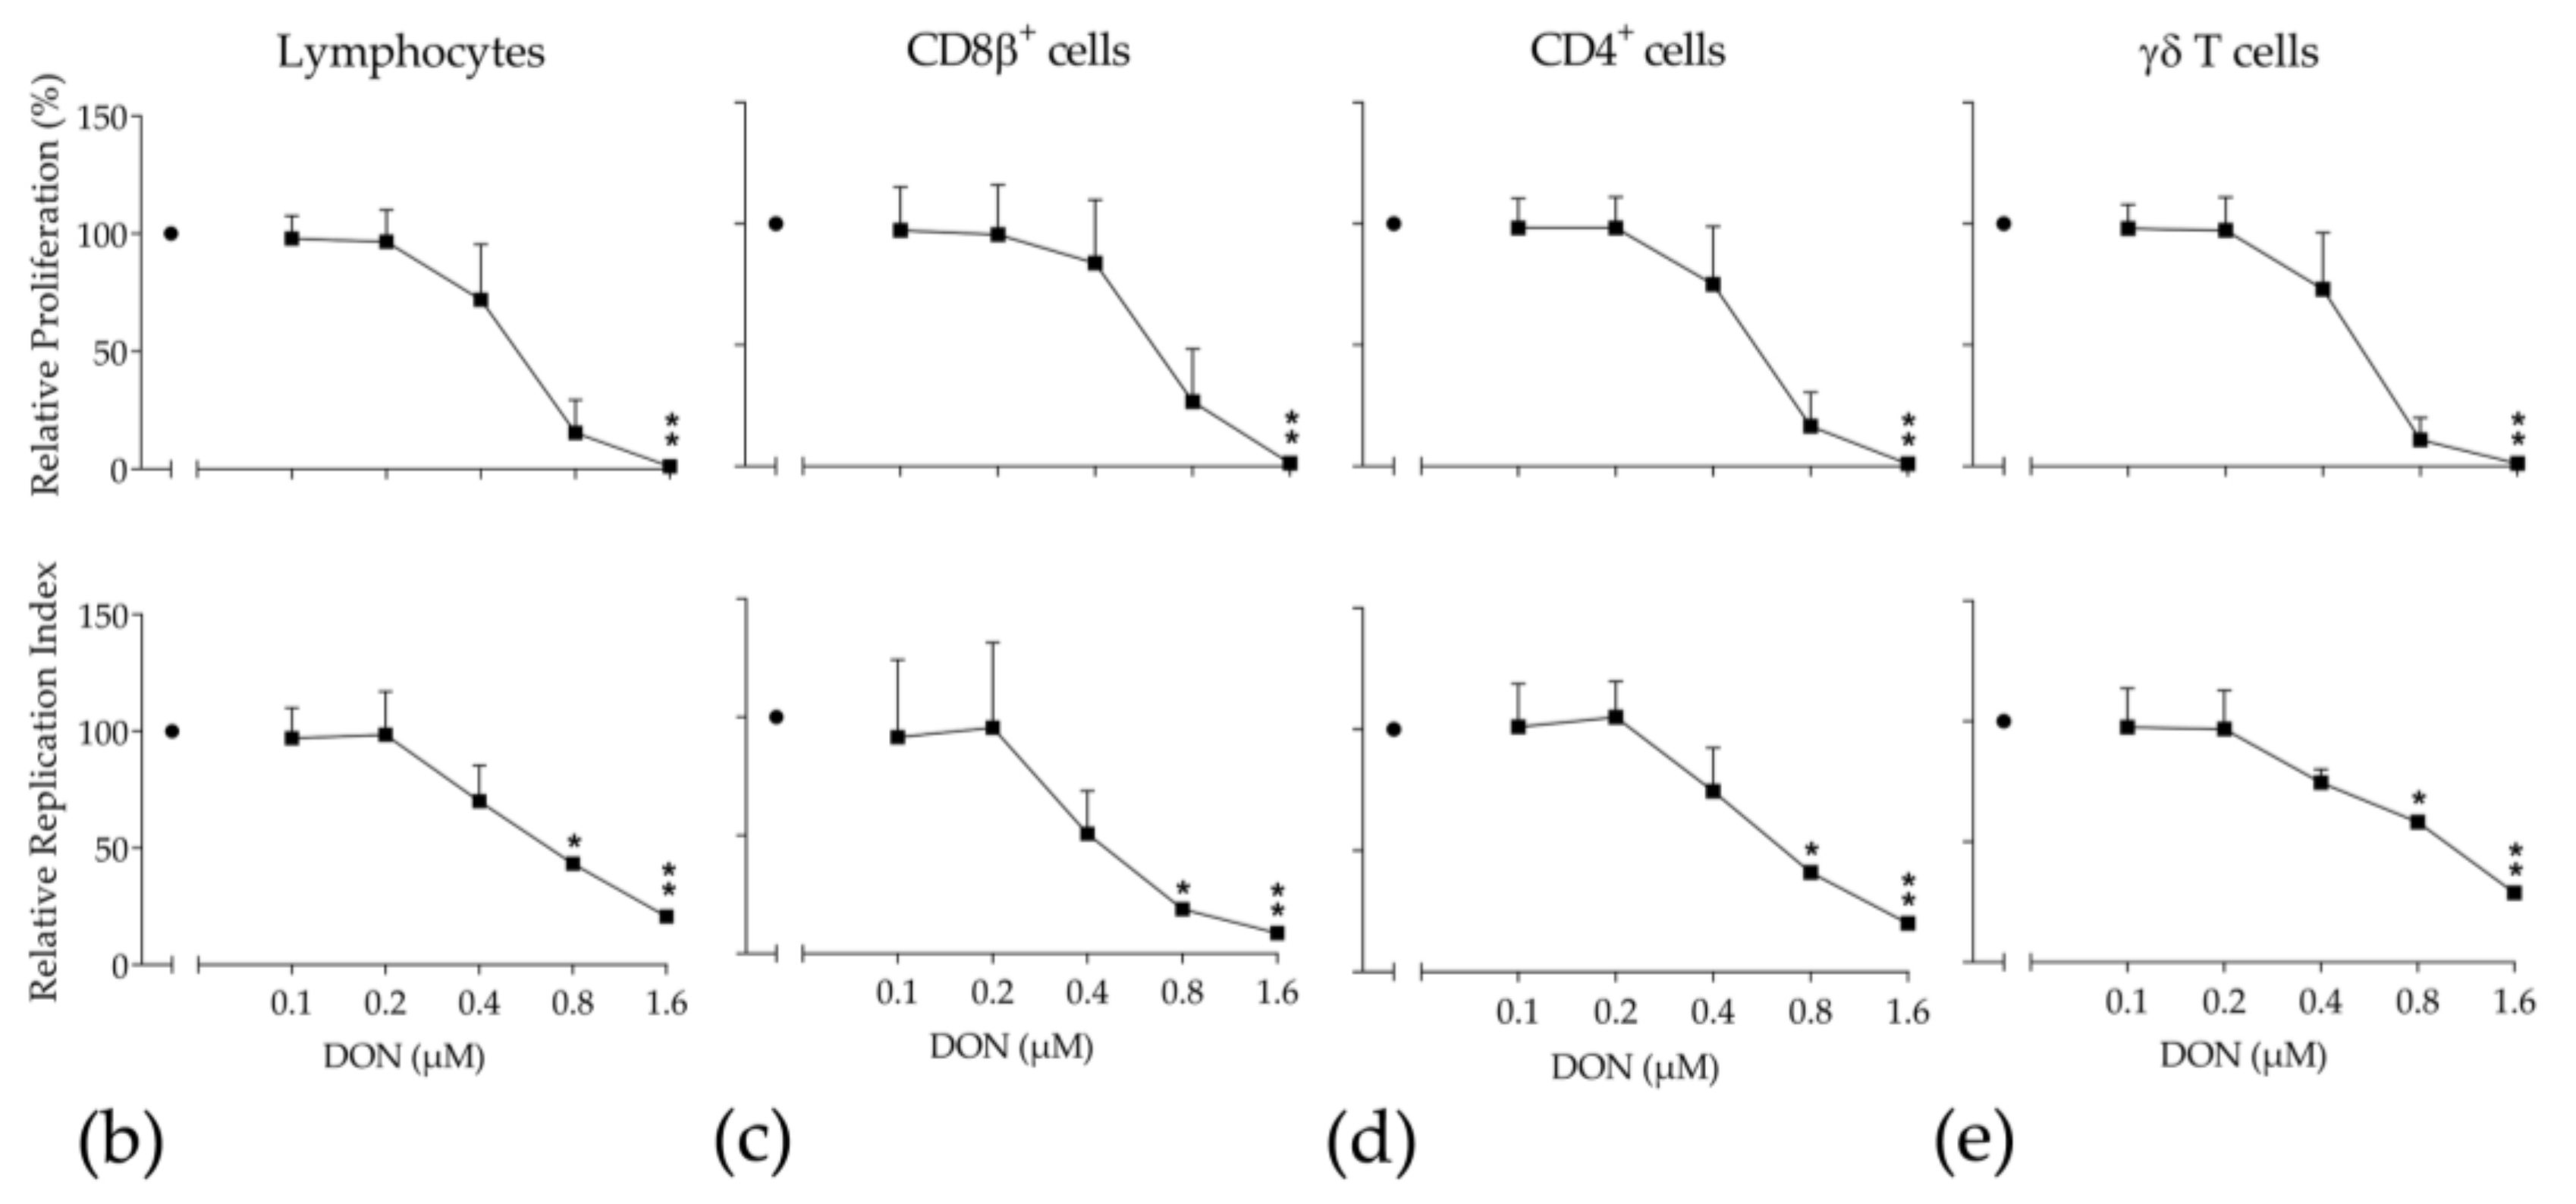
2.4. Proliferation of Bovine T-Cell Subsets
3. Discussion
4. Conclusions
5. Materials and Methods
5.1. Cell Isolation
5.2. Deoxynivalenol (DON) and Deepoxy-Deoxynivalenol (DOM-1) Treatment
5.3. Cell Proliferation ELISA, BrdU Assay
5.4. Cell Proliferation and Phenotyping of Bovine PBMCs by Violet Proliferation Assays
5.5. Statistics
Acknowledgments
Author Contributions
Conflicts of Interest
References
- Streit, E.; Naehrer, K.; Rodrigues, I.; Schatzmayr, G. Mycotoxin occurrence in feed and feed raw materials worldwide: Long-term analysis with special focus on Europe and Asia. J. Sci. Food Agric. 2013, 93, 2892–2899. [Google Scholar] [CrossRef] [PubMed]
- Sobrova, P.; Adam, V.; Vasatkova, A.; Beklova, M.; Zeman, L.; Kizek, R. Deoxynivalenol and its toxicity. Interdiscip. Toxicol. 2010, 3, 94–99. [Google Scholar] [CrossRef] [PubMed]
- Pinotti, L.; Ottoboni, M.; Giromini, C.; Dell’Orto, V.; Cheli, F. Mycotoxin contamination in the EU feed supply chain: A focus on cereal byproducts. Toxins 2016, 8, 45. [Google Scholar] [CrossRef] [PubMed]
- Rotter, B.A.; Prelusky, D.B.; Pestka, J.J. Toxicology of deoxynivalenol (vomitoxin). J. Toxicol. Environ. 1996, 48, 1–34. [Google Scholar]
- Berek, L.; Petri, I.B.; Mesterhazy, A.; Teren, J.; Molnar, J. Effects of mycotoxins on human immune functions in vitro. Toxicol. In Vitro 2001, 15, 25–30. [Google Scholar] [CrossRef]
- Vivier, E.; Tomasello, E.; Baratin, M.; Walzer, T.; Ugolini, S. Functions of natural killer cells. Nat. Immunol. 2008, 9, 503–510. [Google Scholar] [CrossRef] [PubMed]
- Taranu, I.; Marina, D.E.; Burlacu, R.; Pinton, P.; Damian, V.; Oswald, I.P. Comparative aspects of in vitro proliferation of human and porcine lymphocytes exposed to mycotoxins. Arch. Anim. Nutr. 2010, 64, 383–393. [Google Scholar] [CrossRef] [PubMed]
- Pestka, J.J. Deoxynivalenol: Mechanisms of action, human exposure, and toxicological relevance. Arch. Toxicol. 2010, 84, 663–679. [Google Scholar] [CrossRef] [PubMed]
- Pestka, J.J. Deoxynivalenol-induced proinflammatory gene expression: Mechanisms and pathological sequelae. Toxins 2010, 2, 1300–1317. [Google Scholar] [CrossRef] [PubMed]
- European Commission (EC). Commission implementing regulation (EU) No 1016/2013 of 23 October 2013 concerning the authorisation of a preparation of micro-organism strain DSM 11798 of the Coriobacteriacae family as a feed additive for pigs. Off. J. Eur. Union 2013, 11, 36–38. [Google Scholar]
- Prelusky, D.B.; Gerdes, R.G.; Underhill, K.L.; Rotter, B.A.; Jui, P.Y.; Trenholm, H.L. Effects of low-level dietary deoxynivalenol on haematological and clinical parameters of the pig. Nat. Toxins 1994, 2, 97–104. [Google Scholar] [CrossRef] [PubMed]
- Pestka, J.J.; Smolinski, A.T. Deoxynivalenol: Toxicology and potential effects on humans. J. Toxicol. Environ. Health B Crit. Rev. 2005, 8, 39–69. [Google Scholar] [CrossRef] [PubMed]
- Owens, F.N.; Secrist, D.S.; Hill, W.J.; Gill, D.R. Acidosis in cattle: A review. J. Anim. Sci. 1998, 76, 275–286. [Google Scholar] [CrossRef] [PubMed]
- European Commission (EC). Commission Recommendation of 17 August 2006 on the presence of deoxynivalenol, zearalenone, ochratoxin A, T-2 and HT-2 and fumonisins in products intended for animal feeding (2006/576/EU). Off. J. Eur. Union 2006, L229, 7–9. [Google Scholar]
- Awad, W.; Ghareeb, K.; Böhm, J.; Zentek, J. The toxicological impacts of the Fusarium mycotoxin, deoxynivalenol, in poultry flocks with special reference to immunotoxicity. Toxins 2013, 5, 912–925. [Google Scholar] [CrossRef] [PubMed]
- Maresca, M. From the gut to the brain: Journey and pathophysiological effects of the food-associated trichothecene mycotoxin deoxynivalenol. Toxins 2013, 5, 784–820. [Google Scholar] [CrossRef] [PubMed]
- European Food Safety Authority (EFSA). Deoxynivalenol in food and feed: Occurrence and exposure. EFSA J. 2013, 11, 319–324. [Google Scholar]
- Awad, W.A.; Ghareeb, K.; Böhm, J.; Razzazi, E.; Hellweg, P.; Zentek, J. The impact of the Fusarium toxin deoxynivalenol (DON) on poultry. Int. J. Poult. Sci. 2008, 7, 827–842. [Google Scholar] [CrossRef]
- King, R.R.; McQueen, R.E.; Levesque, D.; Greenhalgh, R. Transformation of deoxynivalenol (vomitoxin) by rumen microorganisms. J. Agric. Food Chem. 1984, 32, 1181–1183. [Google Scholar] [CrossRef]
- Schatzmayr, G.; Zehner, F.; Täubel, M.; Schatzmayr, D.; Klimitsch, A.; Loibner, A.P.; Binder, E.M. Microbiologicals for deactivating mycotoxins. Mol. Nutr. Food Res. 2006, 50, 543–551. [Google Scholar] [CrossRef] [PubMed]
- Abdela, N. Sub-acute ruminal acidosis (SARA) and its consequence in dairy cattle: A review of past and recent research at global prospective. Achiev. Life Sci. 2016, 10, 187–196. [Google Scholar] [CrossRef]
- Dänicke, S.; Keese, C.; Goyarts, T.; Döll, S. Effects of deoxynivalenol (DON) and related compounds on bovine peripheral blood mononuclear cells (PBMC) in vitro and in vivo. Mycotoxin Res. 2011, 27, 49–55. [Google Scholar] [CrossRef] [PubMed]
- Springler, A.; Hessenberger, S.; Schatzmayr, G.; Mayer, E. Early activation of MAPK p44/42 is partially involved in DON-induced disruption of the intestinal barrier function and tight junction network. Toxins 2016, 8, 264. [Google Scholar] [CrossRef] [PubMed]
- Springler, A.; Hessenberger, S.; Reisinger, N.; Kern, C.; Nagl, V.; Schatzmayr, G.; Mayer, E. Deoxynivalenol and its metabolite deepoxy-deoxynivalenol:multi-parameter analysis for the evaluation of cytotoxicity and cellular effects. Mycotoxin Res. 2017, 33, 25–37. [Google Scholar] [CrossRef] [PubMed]
- Sundstol Eriksen, G.; Pettersson, H.; Lundh, T. Comparative cytotoxicity of deoxynivalenol, nivalenol, their acetylated derivatives and de-epoxy metabolites. Food Chem. Toxicol. 2004, 42, 619–624. [Google Scholar] [CrossRef] [PubMed]
- Pierron, A.; Mimoun, S.; Murate, L.S.; Loiseau, N.; Lippi, Y.; Bracarense, A.P.; Schatzmayr, G.; He, J.W.; Zhou, T.; Moll, W.D.; et al. Microbial biotransformation of DON: Molecular basis for reduced toxicity. Sci. Rep. 2016, 6, 29105. [Google Scholar] [CrossRef] [PubMed]
- Dänicke, S.; Hegewald, A.K.; Kahlert, S.; Kluess, J.; Rothkötter, H.J.; Breves, G.; Döll, S. Studies on the toxicity of deoxynivalenol (DON), sodium metabisulfite, DON-sulfonate (DONS) and de-epoxy-DON for porcine peripheral blood mononuclear cells and the Intestinal Porcine Epithelial Cell lines IPEC-1 and IPEC-J2, and on effects of DON and DONS on piglets. Food Chem. Toxicol. 2010, 48, 2154–2162. [Google Scholar] [PubMed]
- Nasri, T.; Bosch, R.R.; Voorde, S.; Fink-Gremmels, J. Differential induction of apoptosis by type A and B trichothecenes in Jurkat T-lymphocytes. Toxicol. In Vitro 2006, 20, 832–840. [Google Scholar] [CrossRef] [PubMed]
- Pearson, T.W.; Roelants, G.E.; Lundin, L.B.; Mayor-Withey, K.S. The bovine lymphoid system: Binding and stimulation of peripheral blood lymphocytes by lectins. J. Immunol. Methods 1979, 26, 271–282. [Google Scholar] [CrossRef]
- Rouse, B.T.; Babiuk, L.A. Host responses to infectious bovine rhinotracheitis virus. III. Isolation and immunologic activities of bovine T lymphocytes. J. Immunol. 1974, 113, 1391–1398. [Google Scholar] [PubMed]
- Vistica, D.T.; Skehan, P.; Scudiero, D.; Monks, A.; Pittman, A.; Boyd, M.R. Tetrazolium-based assays for cellular viability: A critical examination of selected parameters affecting formazan production. Cancer Res. 1991, 51, 2515–2520. [Google Scholar] [PubMed]
- Goyarts, T.; Dänicke, S.; Grove, N.; Tiemann, U.; Rothkötter, H.J. Methodical aspects of in vitro proliferation of porcine blood lymphocytes when exposed to deoxynivalenol (DON). Landbauforsch. Volkenrode 2006, 56, 139–148. [Google Scholar]
- Charoenpornsook, K.; Fitzpatrick, J.L.; Smith, J.E. The effects of four mycotoxins on the mitogen stimulated proliferation of bovine peripheral blood mononuclear cells in vitro. Mycopathologia 1998, 143, 105–111. [Google Scholar] [CrossRef] [PubMed]
- Wada, K.; Hashiba, Y.; Ohtsuka, H.; Kohiruimaki, M.; Masui, M.; Kawamura, S.; Endo, H.; Ogata, Y. Effects of mycotoxins on mitogen-stimulated proliferation of bovine peripheral blood mononuclear cells. J. Vet. Med. Sci. 2008, 70, 193–196. [Google Scholar] [CrossRef] [PubMed]
- Lyons, A.B.; Parish, C.R. Determination of lymphocyte division by flow cytometry. J. Immunol. Methods 1994, 171, 131–137. [Google Scholar] [CrossRef]
- Sathiyaseelan, T.; Baldwin, C.L. Evaluation of cell replication by bovine T cells in polyclonally activated cultures using carboxyfluorescein succinimidyl ester (CFSE) loading and flow cytometric analysis. Res. Vet. Sci. 2000, 69, 275–281. [Google Scholar] [CrossRef] [PubMed]
- Swanson, S.P.; Nicoletti, J.; Rood, H.D., Jr.; Buck, W.B.; Cote, L.M.; Yoshizawa, T. Metabolism of three trichothecene mycotoxins, T-2 toxin, diacetoxyscirpenol and deoxynivalenol, by bovine rumen microorganisms. J. Chromatogr. 1987, 414, 335–342. [Google Scholar] [CrossRef]
- Dänicke, S.; Brussow, K.P.; Valenta, H.; Ueberschär, K.H.; Tiemann, U.; Schollenberger, M. On the effects of graded levels of Fusarium toxin contaminated wheat in diets for gilts on feed intake, growth performance and metabolism of deoxynivalenol and zearalenone. Mol. Nutr. Food Res. 2005, 49, 932–943. [Google Scholar] [CrossRef] [PubMed]
- Seeling, K.; Dänicke, S.; Valenta, H.; Van Egmond, H.P.; Schothorst, R.C.; Jekel, A.A.; Lebzien, P.; Schollenberger, M.; Razzazi-Fazeli, E.; Flachowsky, G. Effects of Fusarium toxin-contaminated wheat and feed intake level on the biotransformation and carry-over of deoxynivalenol in dairy cows. Food Addit. Contam. 2006, 23, 1008–1020. [Google Scholar] [CrossRef] [PubMed]
- Nagaraja, T.G.; Chengappa, M.M. Liver abscesses in feedlot cattle: A review. J. Anim. Sci. 1998, 76, 287–298. [Google Scholar] [CrossRef] [PubMed]
- Kleen, J.L.; Hooijer, G.A.; Rehage, J.; Noordhuizen, J.P. Subacute ruminal acidosis (SARA): A review. J. Vet. Med. A Physiol. Pathol. Clin. Med. 2003, 50, 406–414. [Google Scholar] [CrossRef] [PubMed]
- He, P.; Young, L.G.; Forsberg, C. Microbial transformation of deoxynivalenol (vomitoxin). Appl. Environ. Microbiol. 1992, 58, 3857–3863. [Google Scholar] [PubMed]
- Keese, C.; Meyer, U.; Rehage, J.; Spilke, J.; Boguhn, J.; Breves, G.; Dänicke, S. On the effects of the concentrate proportion of dairy cow rations in the presence and absence of a Fusarium toxin-contaminated triticale on cow performance. Arch. Anim. Nutr. 2008, 62, 241–262. [Google Scholar] [CrossRef] [PubMed]
- Sabater Vilar, M. Assessment and Intervention of Food- und Feed-Borne Mycotoxicoses. Ph.D. Thesis, Utrecht University, Utrecht, The Netherlands, 2003. [Google Scholar]
- Marczuk, J.; Obremski, K.; Lutnicki, K.; Gajecka, M.; Gajecki, M. Zearalenone and deoxynivalenol mycotoxicosis in dairy cattle herds. Pol. J. Vet. Sci. 2012, 15, 365–372. [Google Scholar] [CrossRef] [PubMed]
- Osselaere, A.; Devreese, M.; Goossens, J.; Vandenbroucke, V.; De Baere, S.; De Backer, P.; Croubels, S. Toxicokinetic study and absolute oral bioavailability of deoxynivalenol, T-2 toxin and zearalenone in broiler chickens. Food Chem. Toxicol. 2013, 51, 350–355. [Google Scholar] [CrossRef] [PubMed]
- Wan, D.; Huang, L.; Pan, Y.; Wu, Q.; Chen, D.; Tao, Y.; Wang, X.; Liu, Z.; Li, J.; Wang, L.; et al. Metabolism, distribution, and excretion of deoxynivalenol with combined techniques of radiotracing, high-performance liquid chromatography ion trap time-of-flight mass spectrometry, and online radiometric detection. J. Agric. Food Chem. 2014, 62, 288–296. [Google Scholar] [CrossRef] [PubMed]
- Dänicke, S.; Ueberschär, K.H.; Halle, I.; Matthes, S.; Valenta, H.; Flachowsky, G. Effect of addition of a detoxifying agent to laying hen diets containing uncontaminated or Fusarium toxin-contaminated maize on performance of hens and on carryover of zearalenone. Poult. Sci. 2002, 81, 1671–1680. [Google Scholar] [CrossRef] [PubMed]
- Harvey, R.B.; Kubena, L.F.; Huff, W.E.; Elissalde, M.H.; Phillips, T.D. Hematologic and immunologic toxicity of deoxynivalenol (DON)-contaminated diets to growing chickens. Bull. Environ. Contam. Toxicol. 1991, 46, 410–416. [Google Scholar] [CrossRef] [PubMed]
- Swamy, H.V.; Smith, T.K.; Karrow, N.A.; Boermans, H.J. Effects of feeding blends of grains naturally contaminated with Fusarium mycotoxins on growth and immunological parameters of broiler chickens. Poult. Sci. 2004, 83, 533–543. [Google Scholar] [CrossRef] [PubMed]
- Chowdhury, S.R.; Smith, T.K. Effects of feeding blends of grains naturally contaminated with Fusarium mycotoxins on performance and metabolism of laying hens. Poult. Sci. 2004, 83, 1849–1856. [Google Scholar] [CrossRef] [PubMed]
- Ghareeb, K.; Awad, W.A.; Soodoi, C.; Sasgary, S.; Strasser, A.; Böhm, J. Effects of feed contaminant deoxynivalenol on plasma cytokines and mRNA expression of immune genes in the intestine of broiler chickens. PLoS ONE 2013, 8, e71492. [Google Scholar] [CrossRef] [PubMed]
- Goyarts, T.; Grove, N.; Dänicke, S. Effects of the Fusarium toxin deoxynivalenol from naturally contaminated wheat given subchronically or as one single dose on the in vivo protein synthesis of peripheral blood lymphocytes and plasma proteins in the pig. Food. Chem. Toxicol. 2006, 44, 1953–1965. [Google Scholar] [CrossRef] [PubMed]
- Mayer, E.; Novak, B.; Springler, A.; Schwartz-Zimmermann, H.E.; Nagl, V.; Reisinger, N.; Hessenberger, S.; Schatzmayr, G. Effects of deoxynivalenol (DON) and its microbial biotransformation product deepoxy-deoxynivalenol (DOM-1) on a trout, pig, mouse, and human cell line. Mycotoxin Res. 2017, 33, 297–308. [Google Scholar] [CrossRef] [PubMed]
- Szepfalusi, Z.; Nentwich, I.; Gerstmayr, M.; Jost, E.; Todoran, L.; Gratzl, R.; Herkner, K.; Urbanek, R. Prenatal allergen contact with milk proteins. Clin. Exp. Allergy 1997, 27, 28–35. [Google Scholar] [CrossRef] [PubMed]
- Leitner, J.; Reutner, K.; Essler, S.E.; Popow, I.; Gerner, W.; Steinberger, P.; Saalmüller, A. Porcine SWC1 is CD52—Final determination by the use of a retroviral cDNA expression library. Vet. Immunol. Immunopathol. 2012, 146, 27–34. [Google Scholar] [CrossRef] [PubMed]


© 2018 by the authors. Licensee MDPI, Basel, Switzerland. This article is an open access article distributed under the terms and conditions of the Creative Commons Attribution (CC BY) license (http://creativecommons.org/licenses/by/4.0/).
Share and Cite
Novak, B.; Vatzia, E.; Springler, A.; Pierron, A.; Gerner, W.; Reisinger, N.; Hessenberger, S.; Schatzmayr, G.; Mayer, E. Bovine Peripheral Blood Mononuclear Cells Are More Sensitive to Deoxynivalenol Than Those Derived from Poultry and Swine. Toxins 2018, 10, 152. https://0-doi-org.brum.beds.ac.uk/10.3390/toxins10040152
Novak B, Vatzia E, Springler A, Pierron A, Gerner W, Reisinger N, Hessenberger S, Schatzmayr G, Mayer E. Bovine Peripheral Blood Mononuclear Cells Are More Sensitive to Deoxynivalenol Than Those Derived from Poultry and Swine. Toxins. 2018; 10(4):152. https://0-doi-org.brum.beds.ac.uk/10.3390/toxins10040152
Chicago/Turabian StyleNovak, Barbara, Eleni Vatzia, Alexandra Springler, Alix Pierron, Wilhelm Gerner, Nicole Reisinger, Sabine Hessenberger, Gerd Schatzmayr, and Elisabeth Mayer. 2018. "Bovine Peripheral Blood Mononuclear Cells Are More Sensitive to Deoxynivalenol Than Those Derived from Poultry and Swine" Toxins 10, no. 4: 152. https://0-doi-org.brum.beds.ac.uk/10.3390/toxins10040152