Fumonisins at Doses below EU Regulatory Limits Induce Histological Alterations in Piglets

 , , and
Abstract
:1. Introduction
2. Results
2.1. Effects of FBs on Animal and Organ Weights
2.2. Effects of FBs on Immune Response and Biochemical Parameters
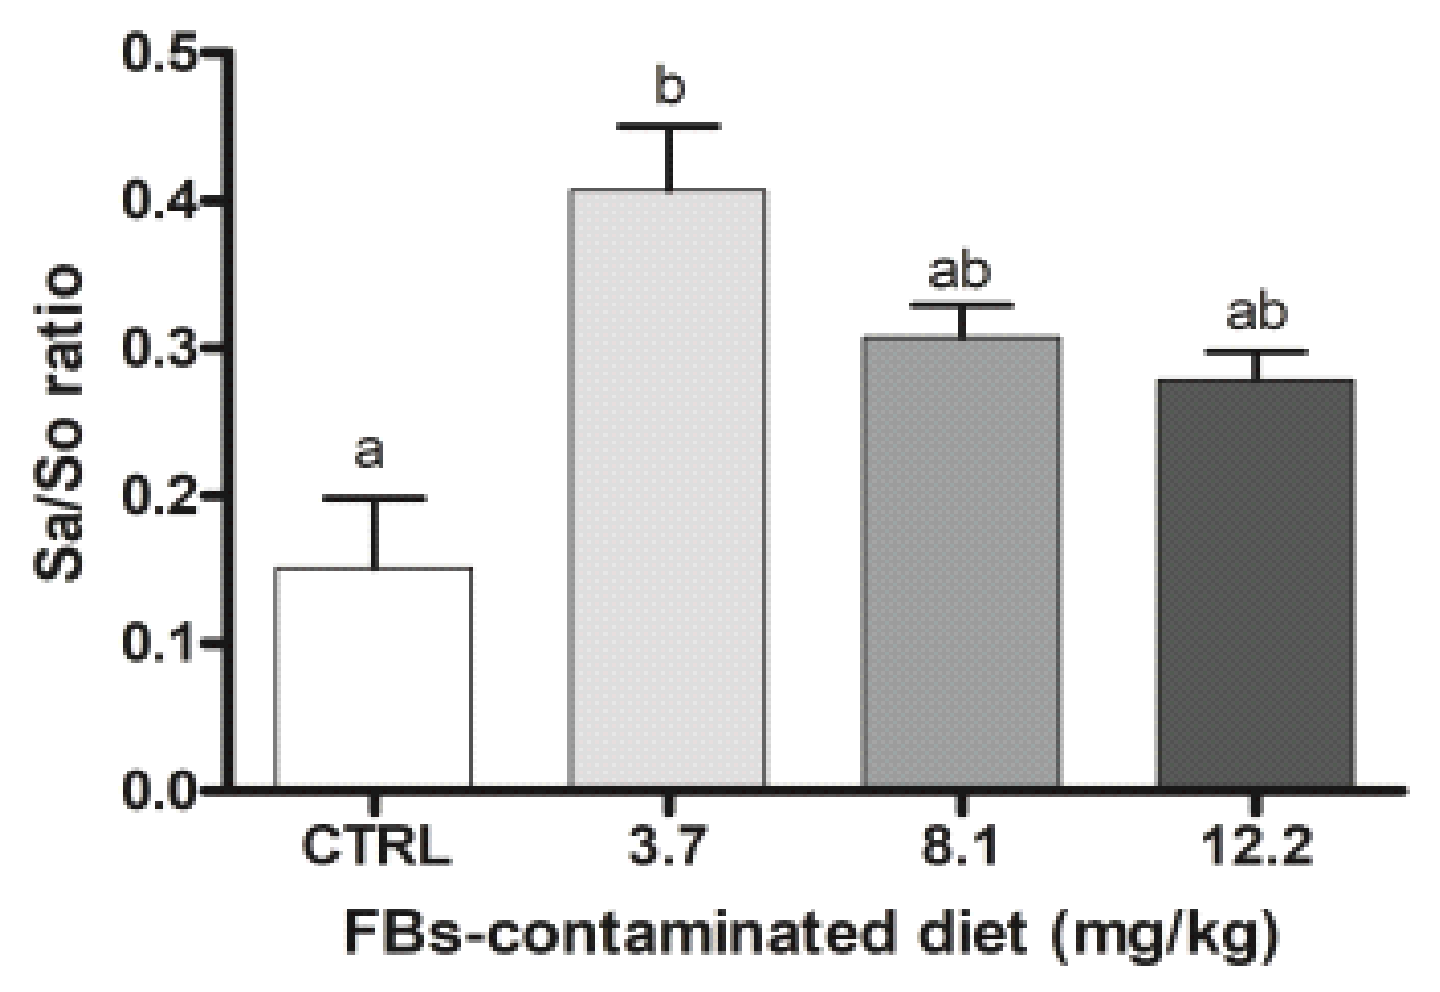
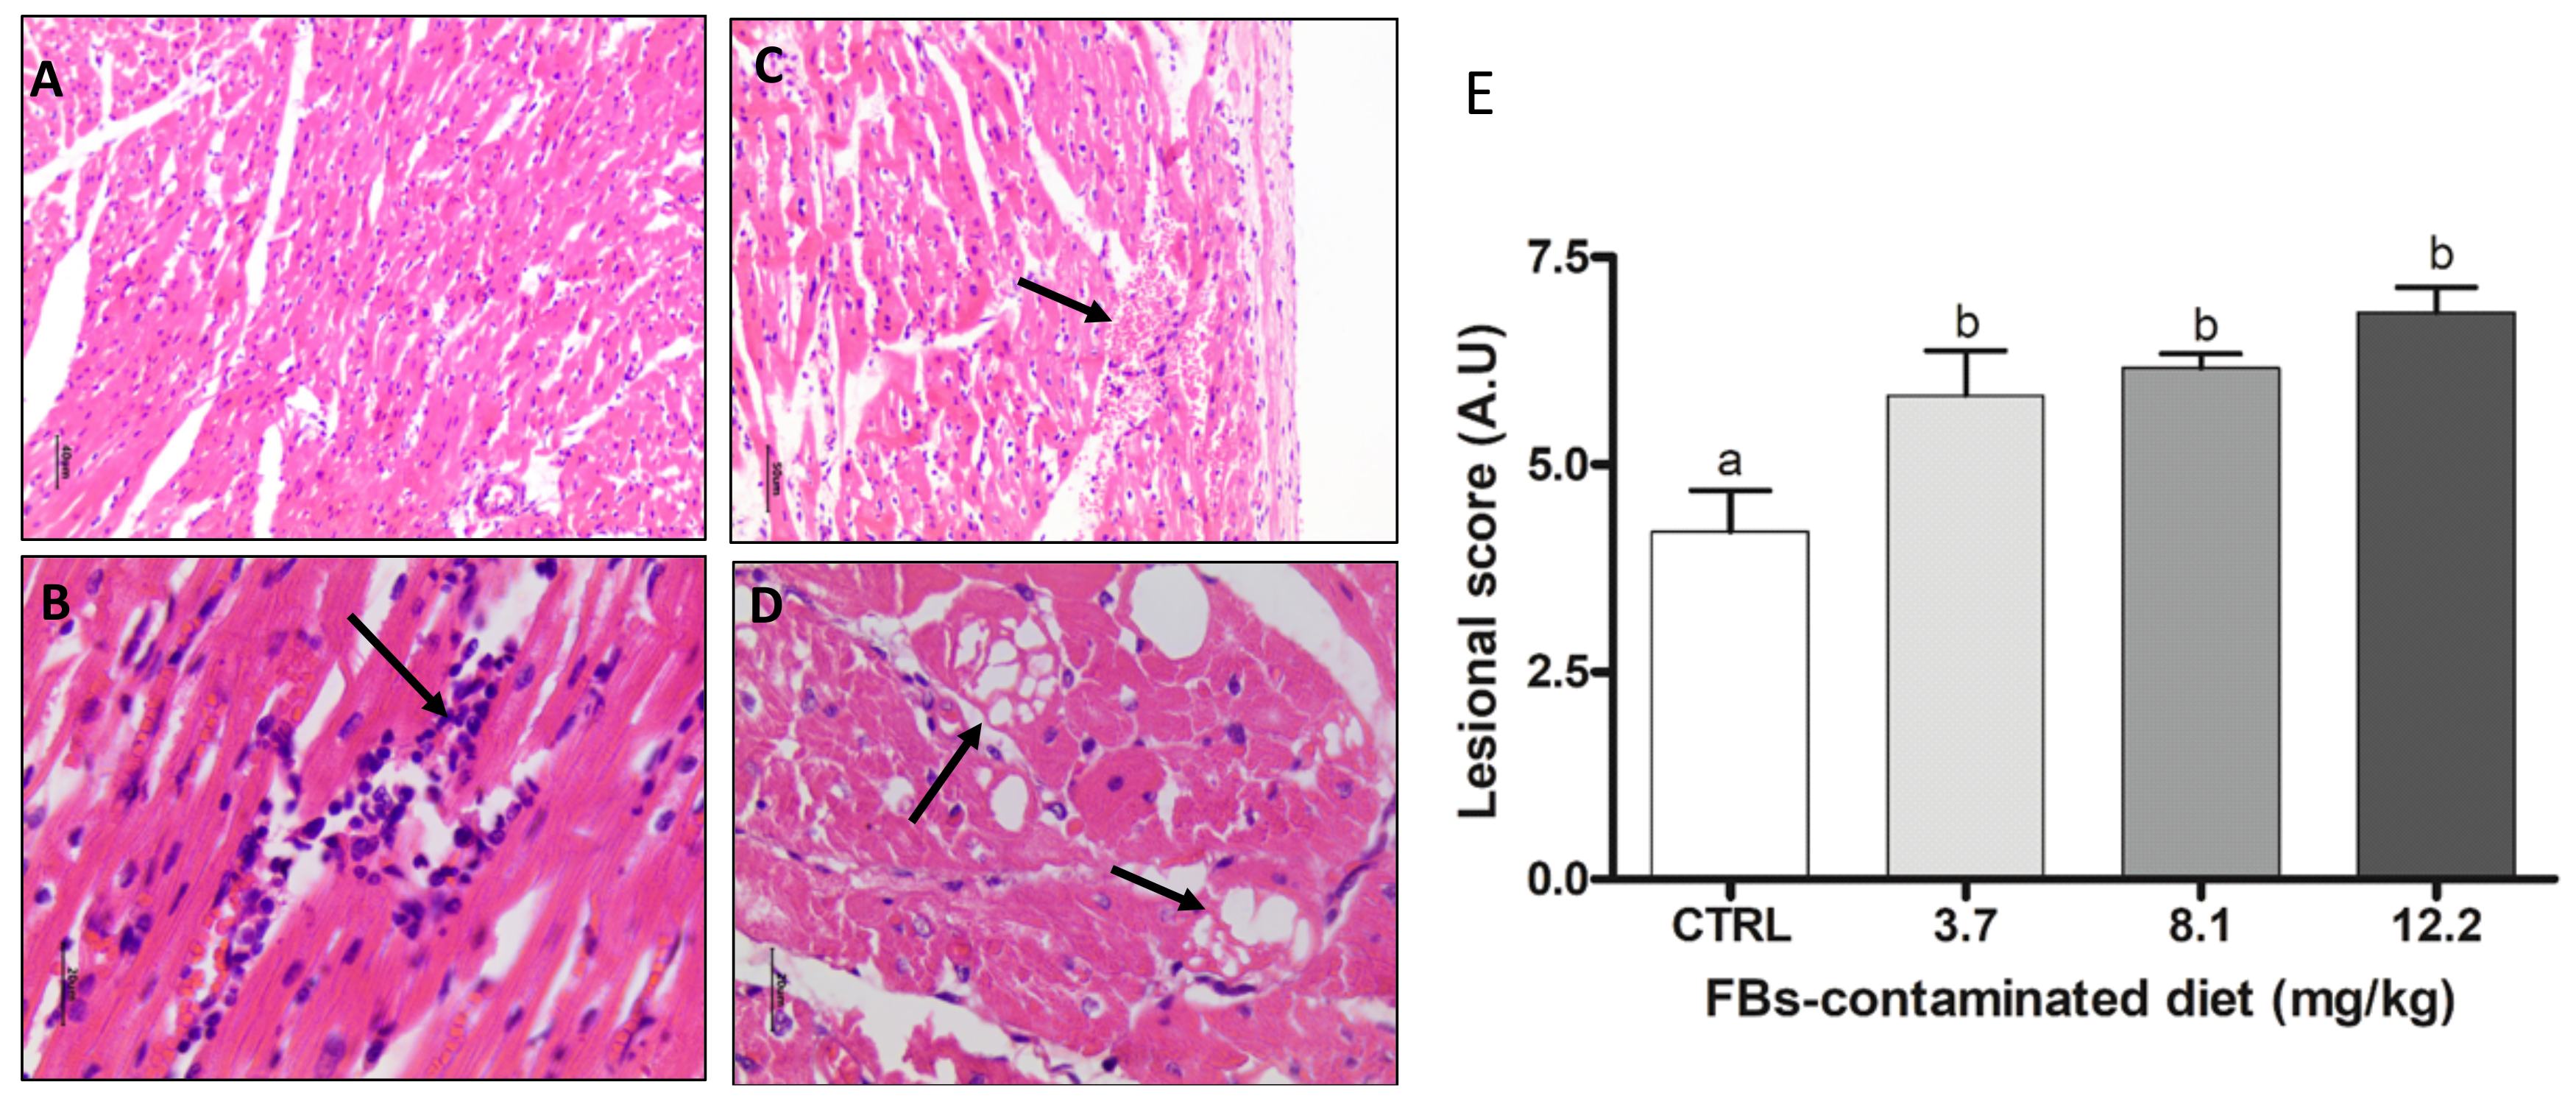
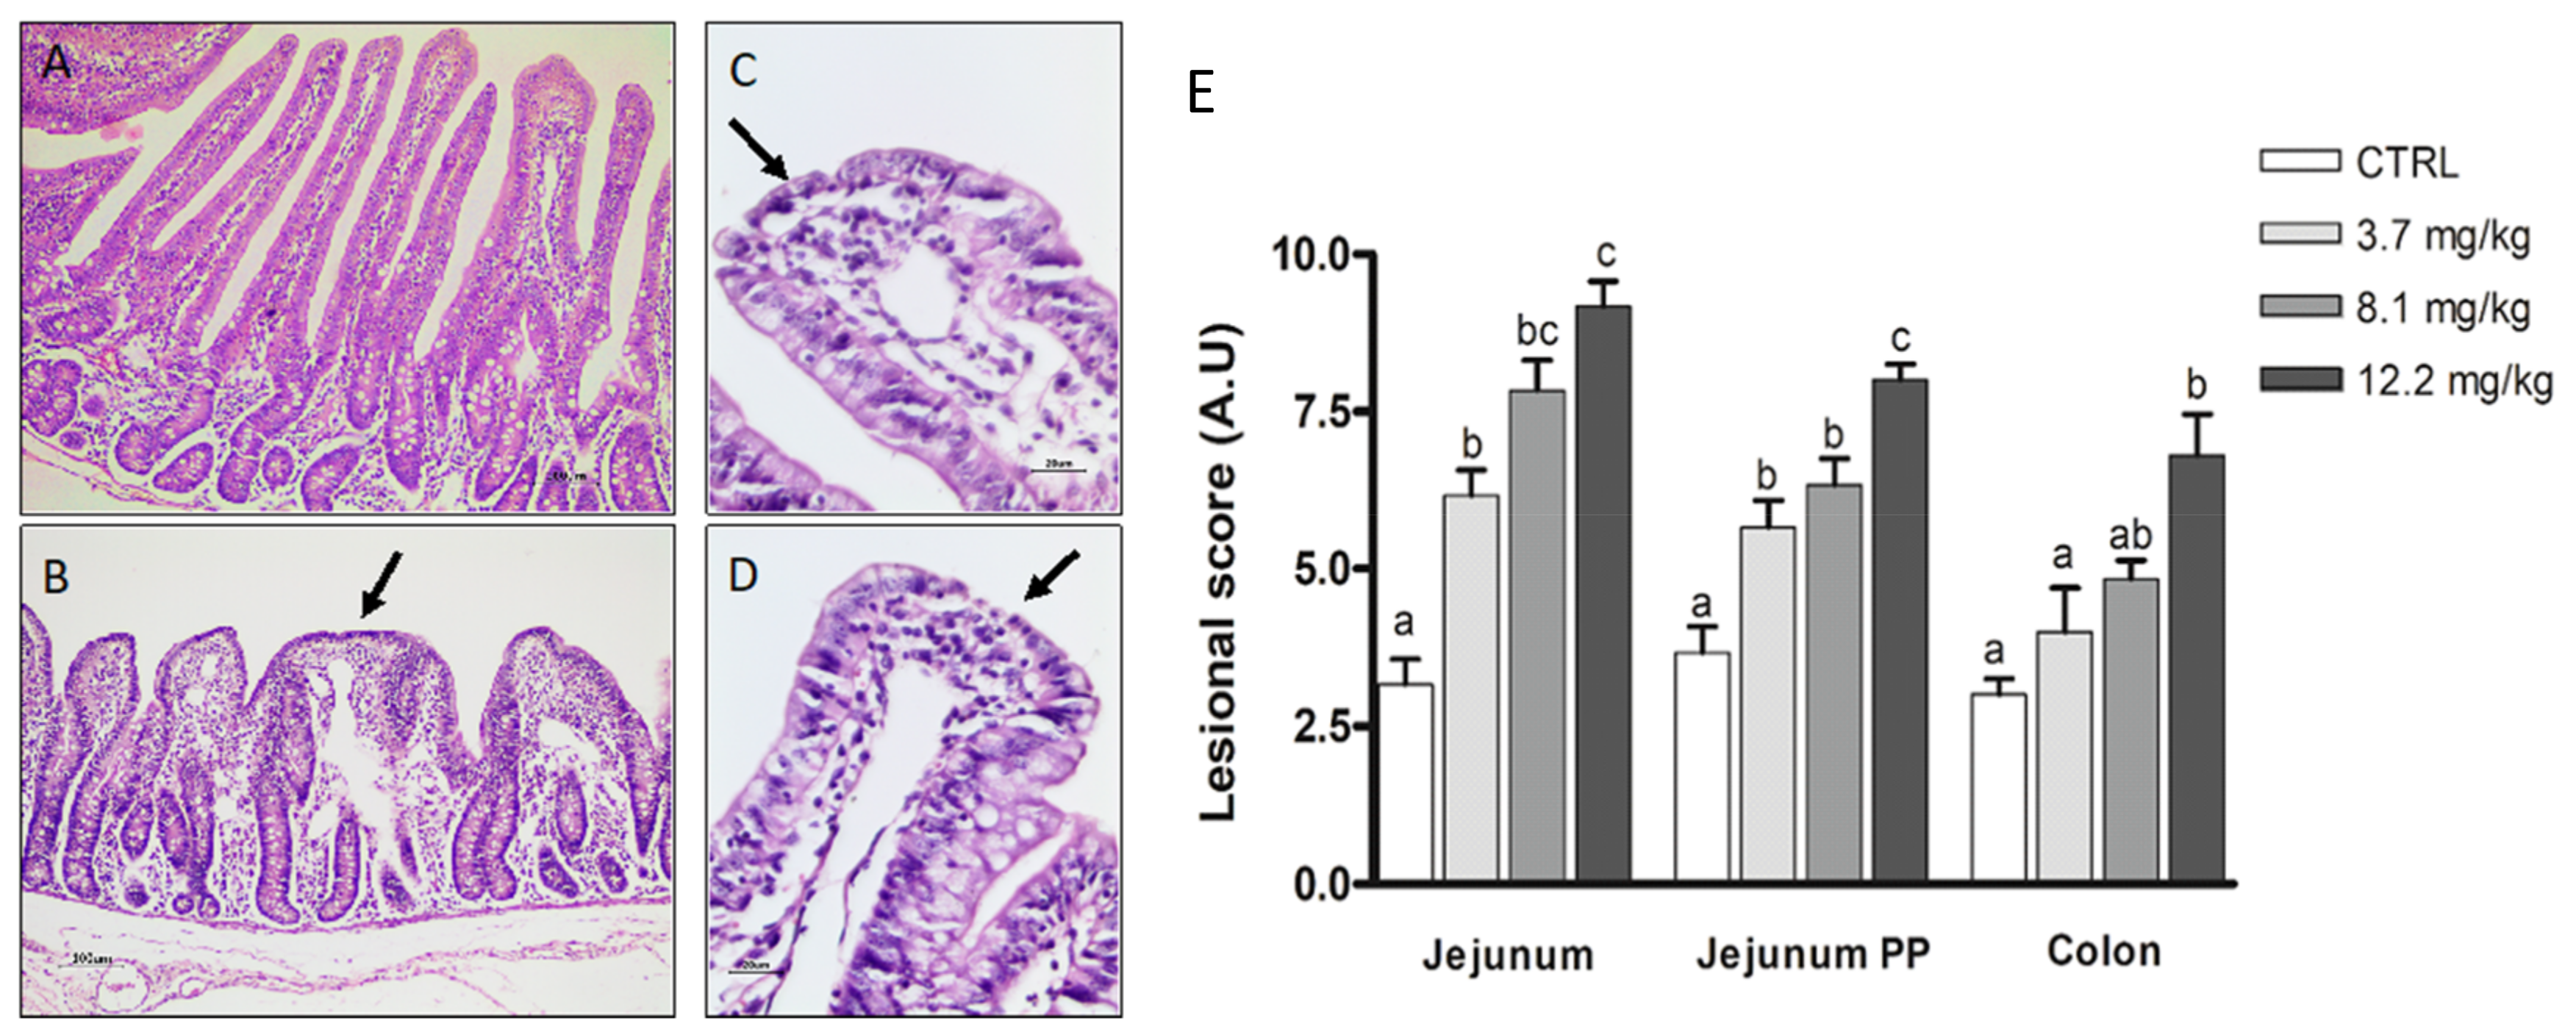
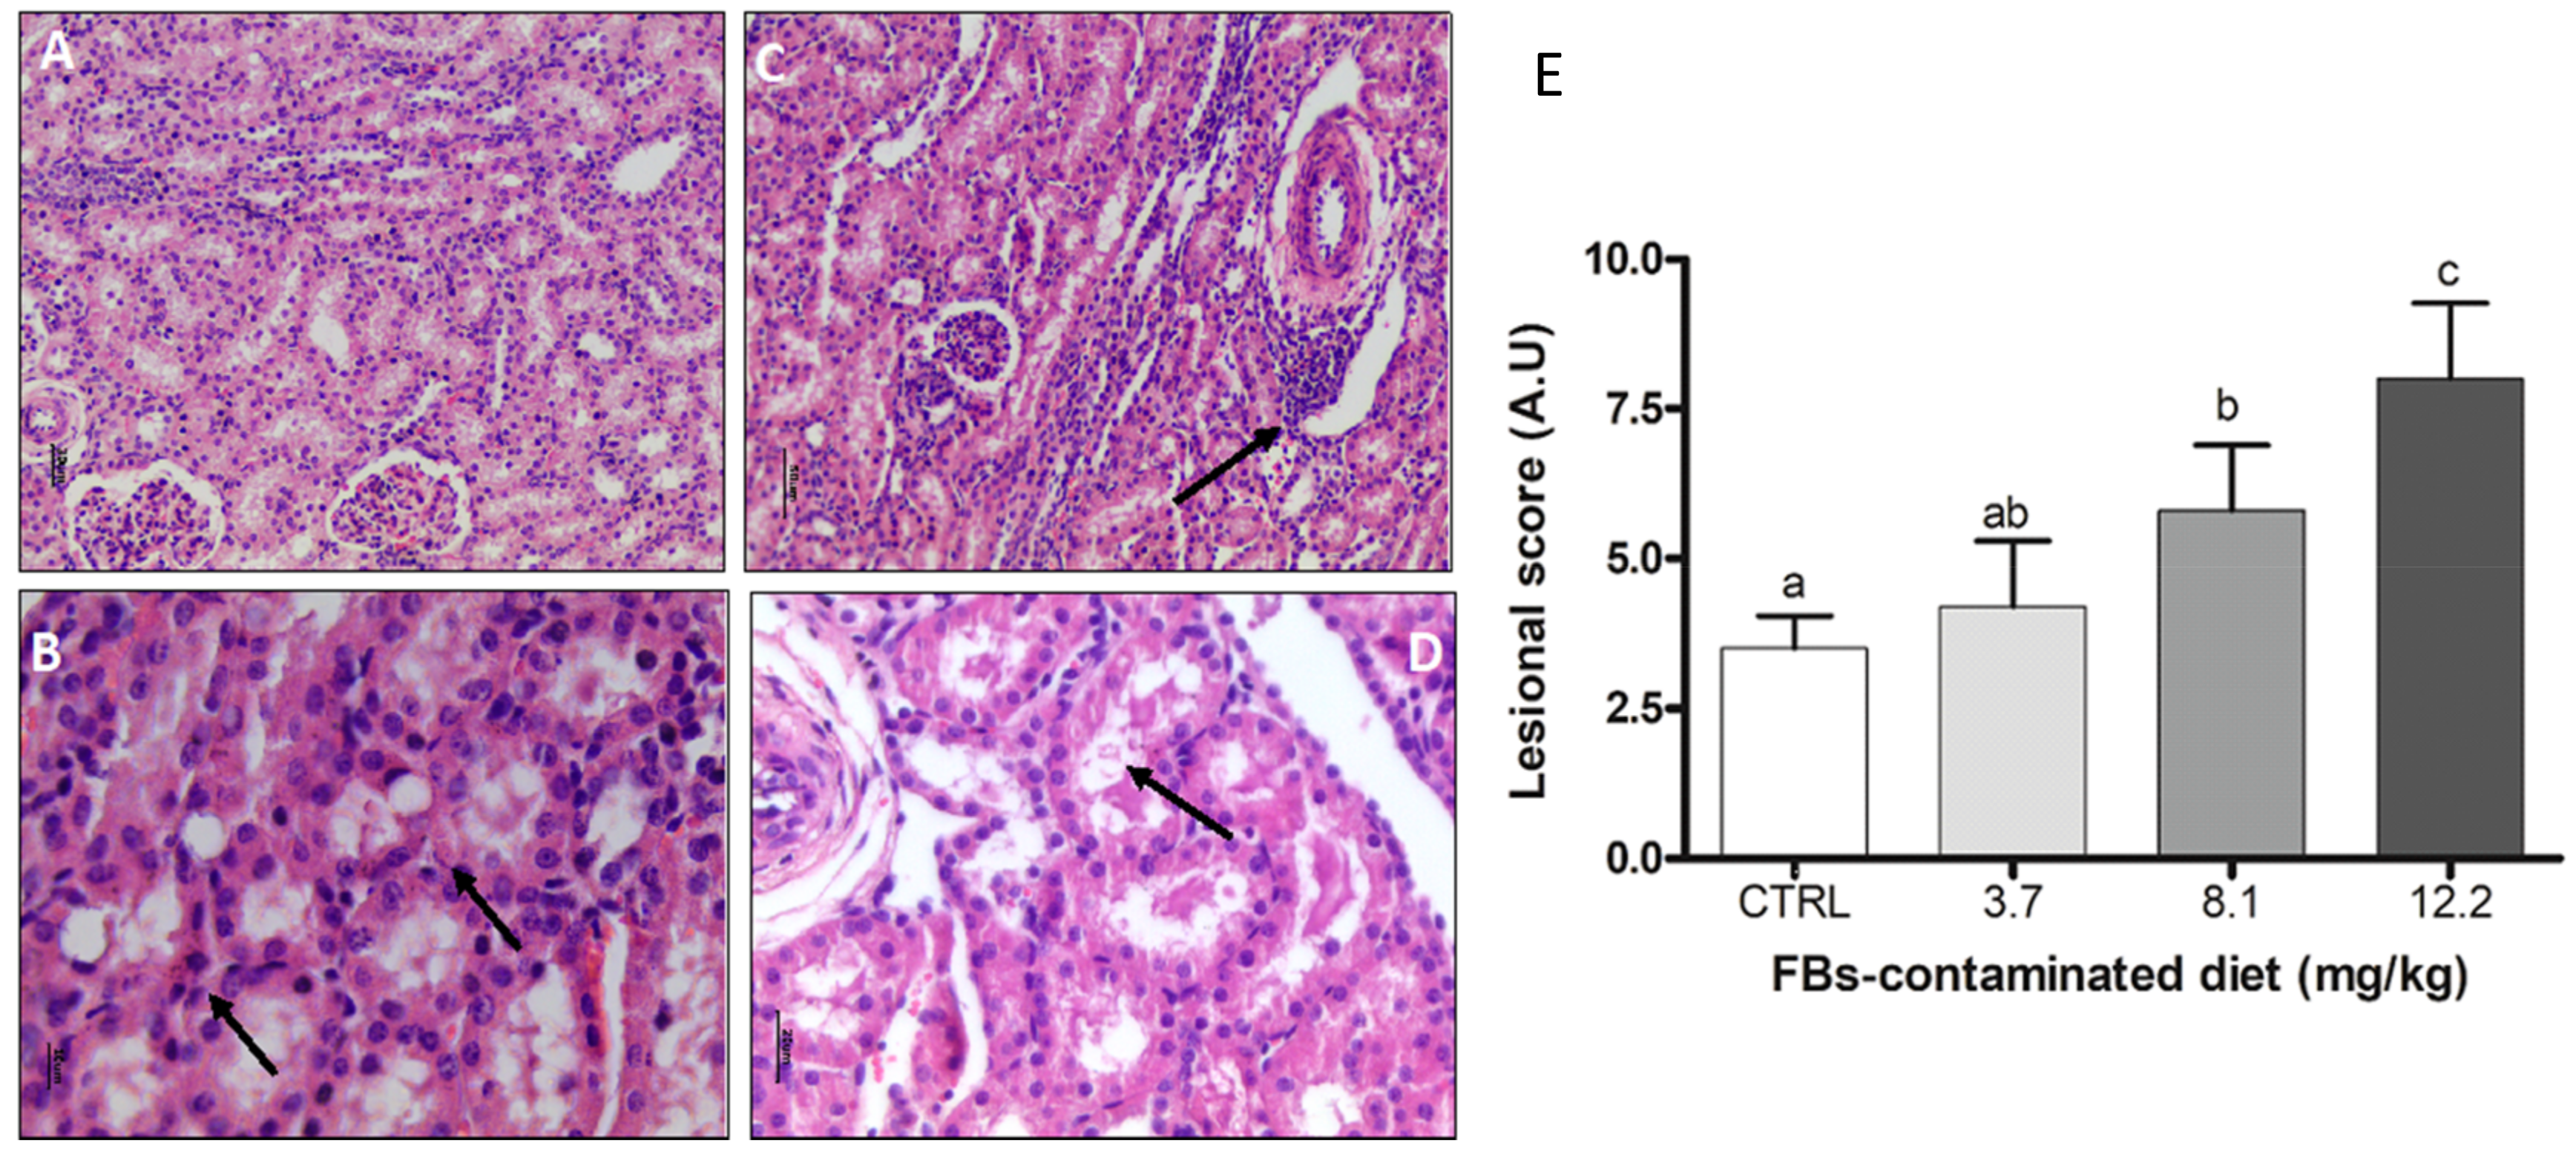
2.3. Effects of FBs on Histological Parameters
2.3.1. Heart
2.3.2. Intestine
2.3.3. Kidney
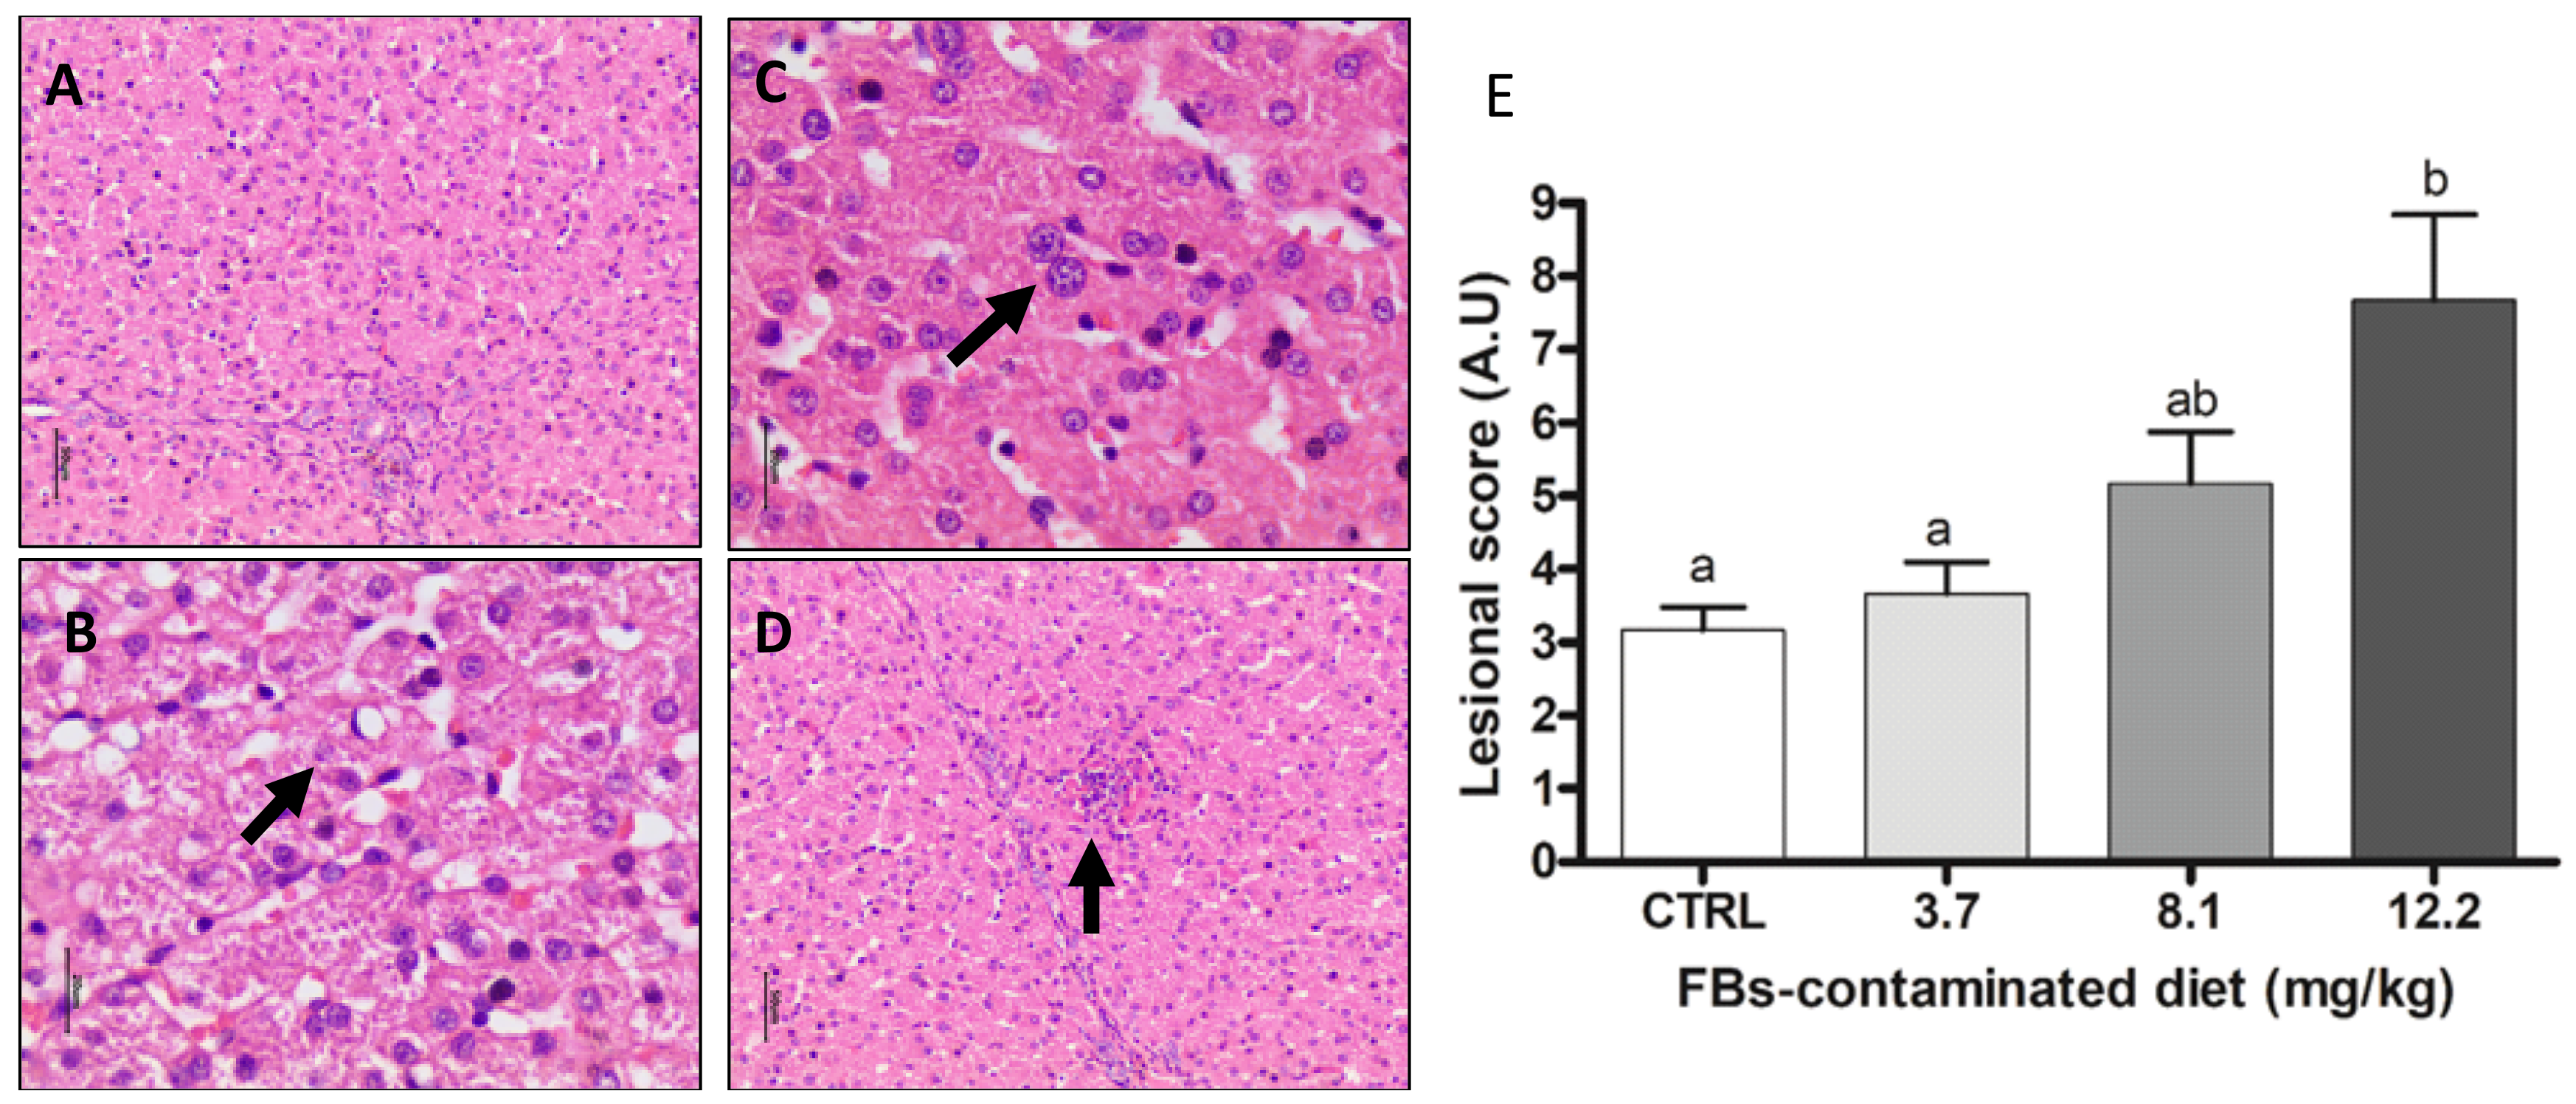
2.3.4. Liver
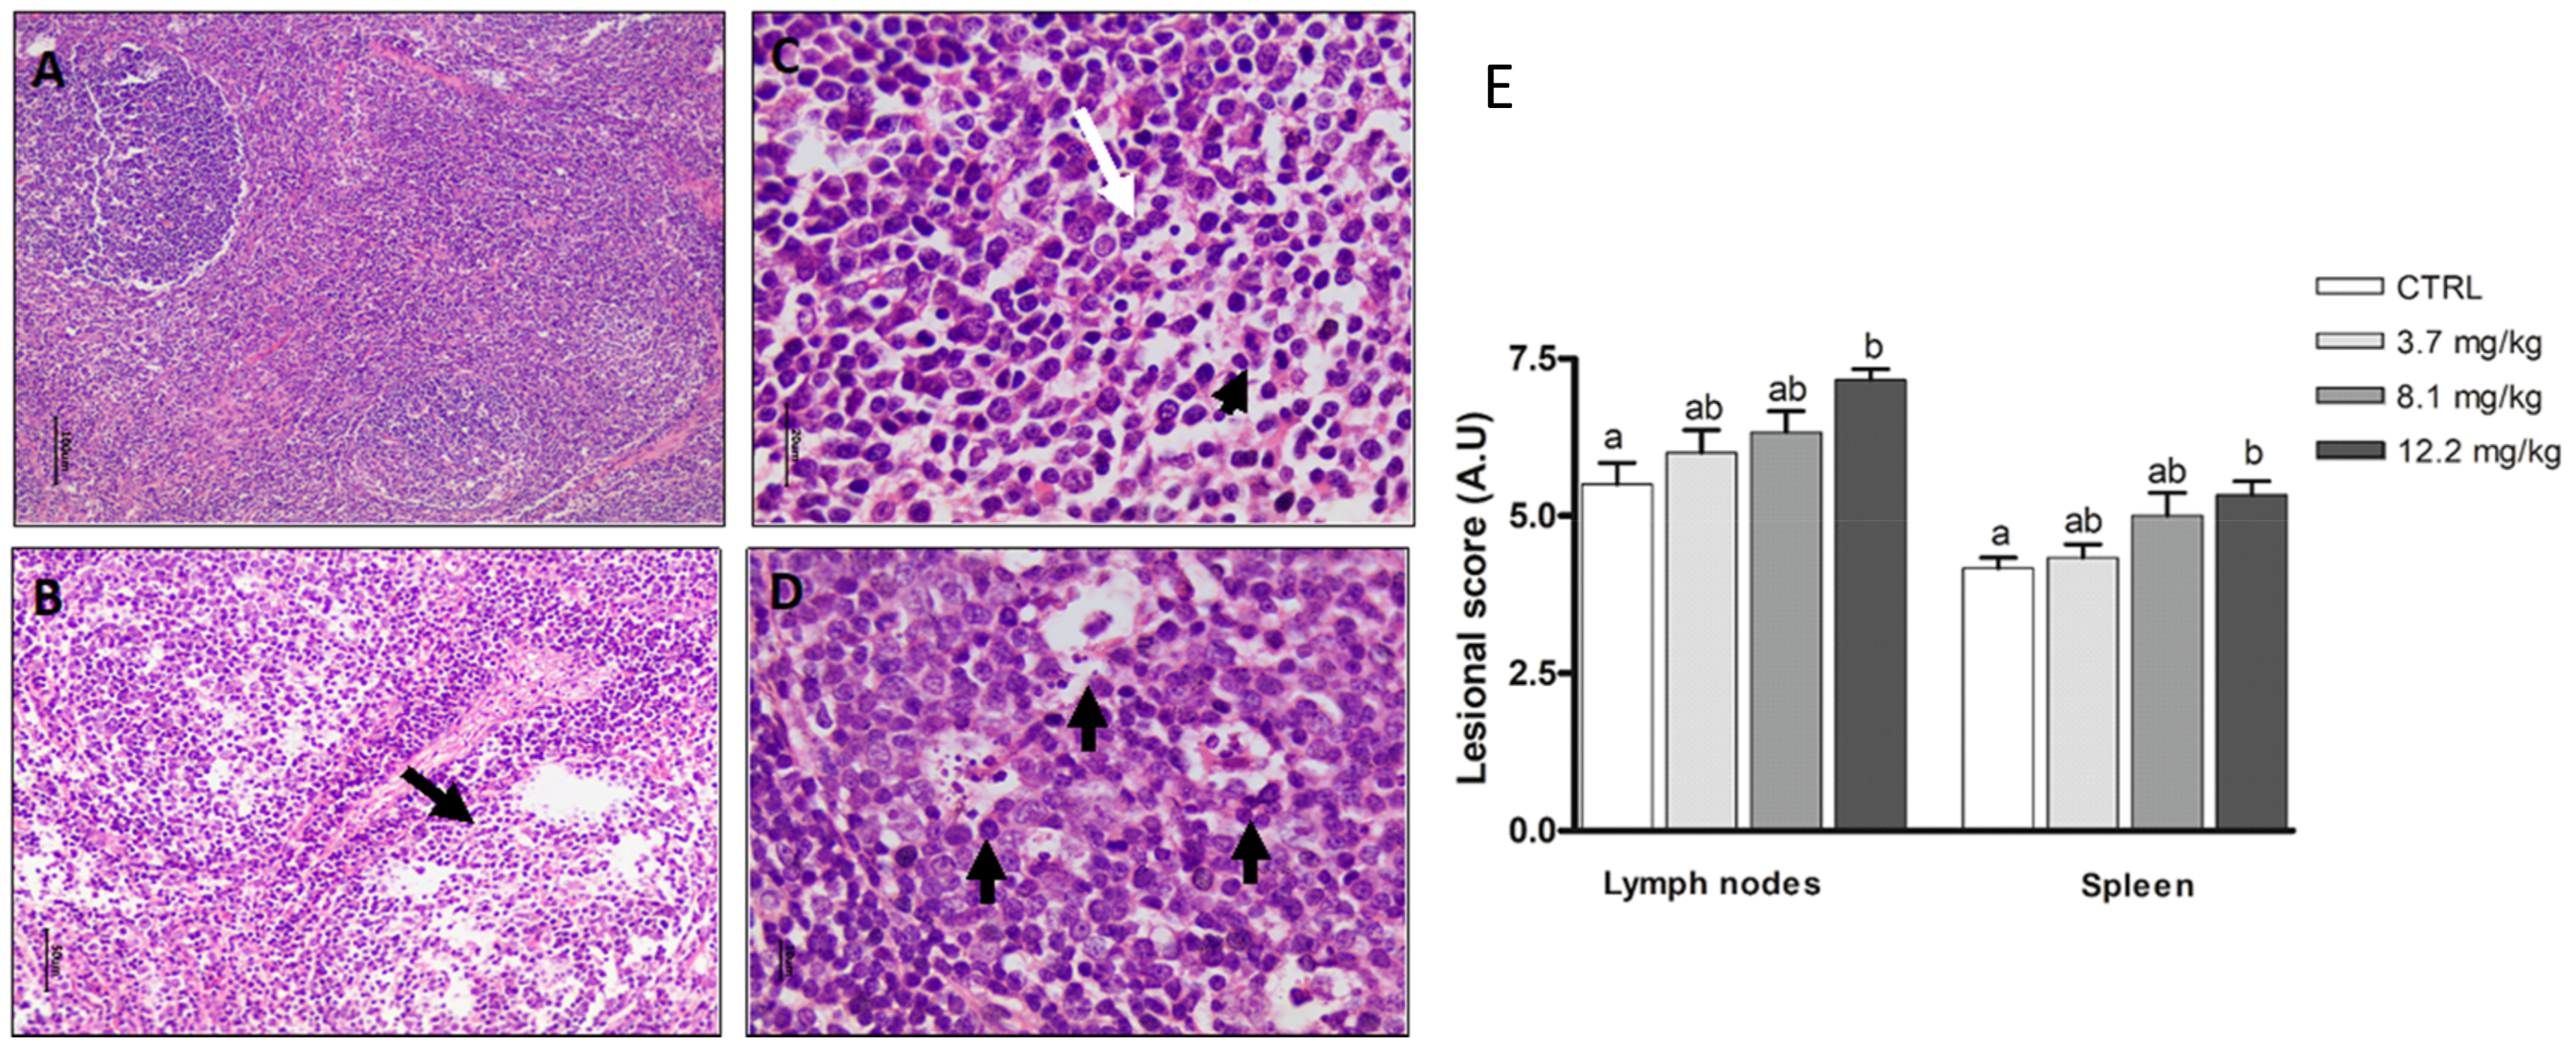
2.3.5. Lymphoid Organs
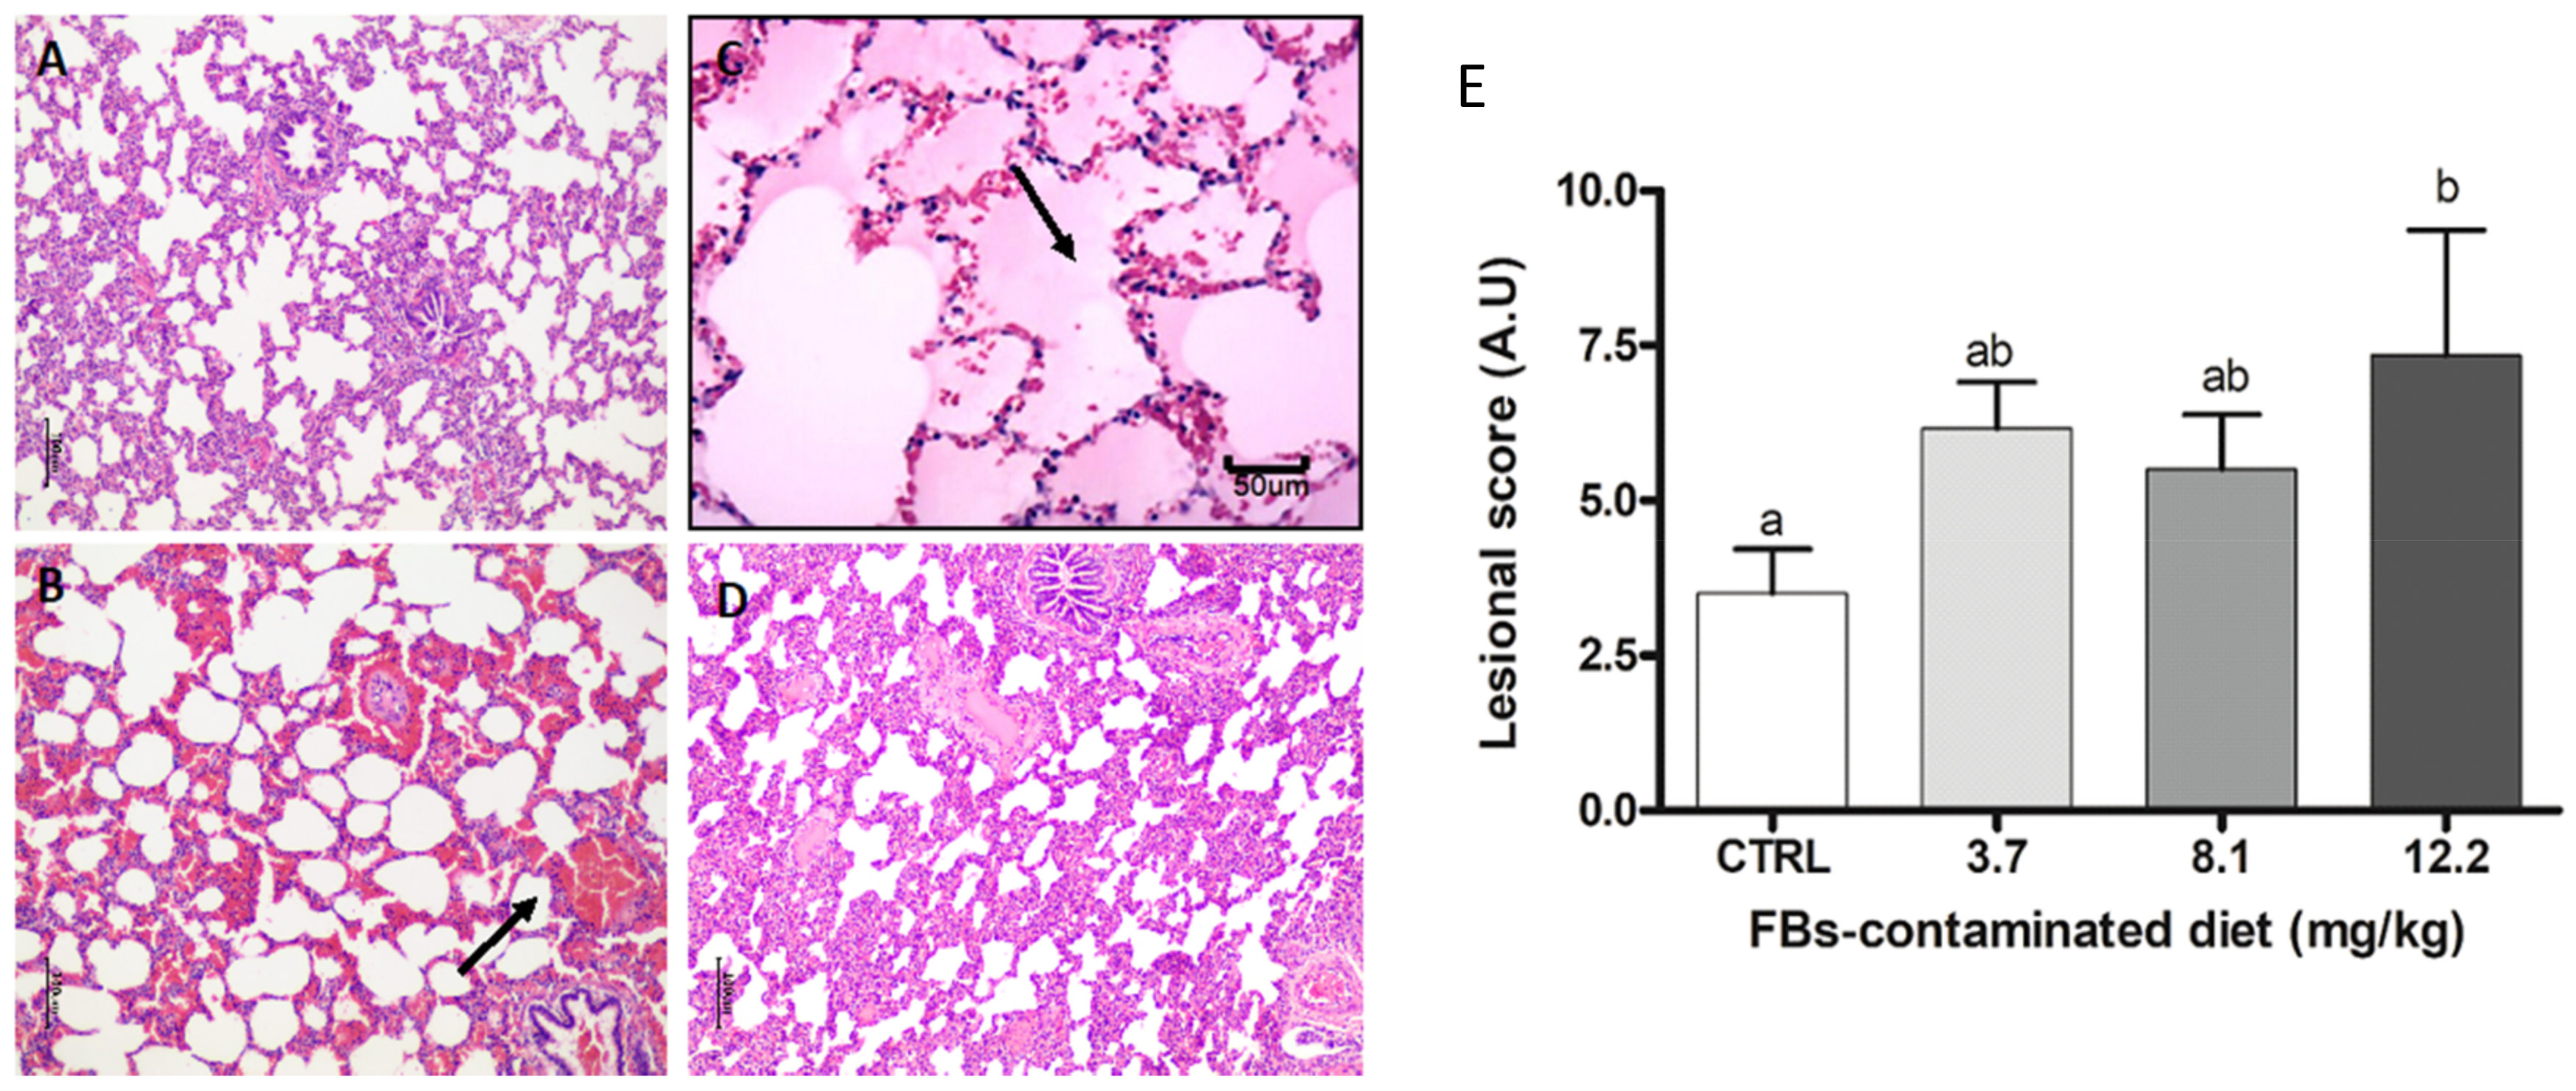
2.3.6. Lung
3. Discussion
4. Conclusions
5. Materials and Methods
5.1. Animals
5.2. Experimental Diets
5.3. Experimental Design and Sample Collection
5.4. Histopathological Assessment
5.5. Statistics
Author Contributions
Funding
Acknowledgments
Conflicts of Interest
References
- Rheeder, J.P.; Marasas, W.F.O.; Vismer, H.F. Production of Fumonisin Analogs by Fusarium Species. Appl. Environ. Microbiol. 2002, 68, 2101–2105. [Google Scholar] [CrossRef]
- Voss, K.A.; Riley, R.T. Fumonisin Toxicity and Mechanism of Action: Overview and Current Perspectives. Food Saf. 2013, 1, 2013006. [Google Scholar] [CrossRef]
- Wang, E.; Norred, W.P.; Bacon, C.W.; Riley, R.T.; Merrill, A.H. Inhibition of sphingolipid biosynthesis by fumonisins. Implications for diseases associated with Fusarium moniliforme. J. Biol. Chem. 1991, 266, 14486–14490. [Google Scholar] [PubMed]
- Masching, S.; Naehrer, K.; Schwartz-Zimmermann, H.E.; Sarandan, M.; Schaumberger, S.; Dohnal, I.; Nagl, V.; Schatzmayr, D. Gastrointestinal Degradation of Fumonisin B(1) by Carboxylesterase FumD Prevents Fumonisin Induced Alteration of Sphingolipid Metabolism in Turkey and Swine. Toxins 2016, 8, 84. [Google Scholar] [CrossRef] [PubMed]
- Loiseau, N.; Debrauwer, L.; Sambou, T.; Bouhet, S.; Miller, J.D.; Martin, P.G.; Viadère, J.L.; Pinton, P.; Puel, O.; Pineau, T.; et al. Fumonisin B1 exposure and its selective effect on porcine jejunal segment: Sphingolipids, glycolipids and trans-epithelial passage disturbance. Biochem. Pharmacol. 2007, 74, 144–152. [Google Scholar] [CrossRef] [PubMed]
- Bouhet, S.; Hourcade, E.; Loiseau, N.; Fikry, A.; Martinez, S.; Roselli, M.; Galtier, P.; Mengheri, E.; Oswald, I.P. The Mycotoxin Fumonisin B1 Alters the Proliferation and the Barrier Function of Porcine Intestinal Epithelial Cells. Toxicol. Sci. 2004, 77, 165–171. [Google Scholar] [CrossRef]
- Bracarense, A.-P.F.L.; Lucioli, J.; Grenier, B.; Drociunas Pacheco, G.; Moll, W.-D.; Schatzmayr, G.; Oswald, I.P. Chronic ingestion of deoxynivalenol and fumonisin, alone or in interaction, induces morphological and immunological changes in the intestine of piglets. Br. J. Nutr. 2012, 107, 1776–1786. [Google Scholar] [CrossRef] [PubMed]
- IARC. Monographs on the Evaluation of Carcinogenic Risks to Humans No. 56; International Agency for Research on Cancer: Lion, France, 1993. [Google Scholar]
- Walter, F.O.; Marasas, J.D.; Miller, R.T.; Riley, A.V. Environmental Health Criteria Fumonisin B 1; World Health Organization: Geneva, Switzerland, 2000. [Google Scholar]
- Knutsen, H.K.; Alexander, J.; Barregård, L.; Bignami, M.; Brüschweiler, B.; Ceccatelli, S.; Cottrill, B.; Dinovi, M.; Edler, L.; Grasl-Kraupp, B.; et al. Risks for animal health related to the presence of fumonisins, their modified forms and hidden forms in feed. EFSA J. 2018, 16, e05242. [Google Scholar]
- Humphreys, S.H.; Carrington, C.; Bolger, M. A quantitative risk assessment for fumonisins B1 and B2 in US corn. Food Addit. Contam. 2001, 18, 211–220. [Google Scholar] [CrossRef]
- Devriendt, B.; Gallois, M.; Verdonck, F.; Wache, Y.; Bimczok, D.; Oswald, I.P.; Goddeeris, B.M.; Cox, E. The food contaminant fumonisin B(1) reduces the maturation of porcine CD11R1(+) intestinal antigen presenting cells and antigen-specific immune responses, leading to a prolonged intestinal ETEC infection. Vet. Res. 2009, 40, 40. [Google Scholar] [CrossRef]
- Halloy, D.J.; Gustin, P.G.; Bouhet, S.; Oswald, I.P. Oral exposure to culture material extract containing fumonisins predisposes swine to the development of pneumonitis caused by Pasteurella multocida. Toxicology 2005, 213, 34–44. [Google Scholar] [CrossRef] [PubMed]
- Bouhet, S.; Oswald, I.P. The intestine as a possible target for fumonisin toxicity. Mol. Nutr. Food Res. 2007, 51, 925–931. [Google Scholar] [CrossRef] [PubMed]
- Mateos, I.; Combes, S.; Pascal, G.; Cauquil, L.; Barilly, C.; Cossalter, A.-M.; Laffitte, J.; Botti, S.; Pinton, P.; Oswald, I.P. Fumonisin-Exposure Impairs Age-Related Ecological Succession of Bacterial Species in Weaned Pig Gut Microbiota. Toxins 2018, 10, 230. [Google Scholar] [CrossRef] [PubMed]
- Régnier, M.; Polizzi, A.; Lukowicz, C.; Smati, S.; Lasserre, F.; Lippi, Y.; Naylies, C.; Laffitte, J.; Bétoulières, C.; Montagner, A.; et al. The protective role of liver X receptor (LXR) during fumonisin B1-induced hepatotoxicity. Arch. Toxicol. 2019, 93, 505–517. [Google Scholar] [CrossRef] [PubMed]
- Haschek, W.M.; Gumprecht, L.A.; Smith, G.; Tumbleson, M.E.; Constable, P.D. Fumonisin toxicosis in swine: An overview of porcine pulmonary edema and current perspectives. Environ. Health Perspect. 2001, 109, 251–257. [Google Scholar]
- Zomborszky-Kovacs, M.; Kovàcs, K.; Si, F.V.; Horn, P.; Repa, I.; Kova´cs, F. Effects of Prolonged Exposure to Low-Dose Fumonisin B 1 in Pigs. J. Vet. Med. B Infect. Dis. Vet. Public Health 2002, 49, 197–201. [Google Scholar] [CrossRef] [PubMed]
- Zomborszky-Kovács, M.; Kovács, F.; Horn, P.; Vetési, F.; Repa, I.; Tornyos, G.; Tóth, Á. Investigations into the time- and dose-dependent effect of fumonisin B1 in order to determine tolerable limit values in pigs. Livest. Prod. Sci. 2002, 76, 251–256. [Google Scholar] [CrossRef]
- Gbore, F.A. Growth performance and puberty attainment in growing pigs fed dietary fumonisin B(1). J. Anim. Physiol. Anim. Nutr. 2009, 93, 761–767. [Google Scholar] [CrossRef]
- Burel, C.; Tanguy, M.; Guerre, P.; Boilletot, E.; Cariolet, R.; Queguiner, M.; Postollec, G.; Pinton, P.; Salvat, G.; Oswald, I.P.; et al. Effect of low dose of fumonisins on pig health: Immune status, intestinal microbiota and sensitivity to Salmonella. Toxins 2013, 5, 841–864. [Google Scholar] [CrossRef]
- Helke, K.L.; Swindle, M.M. Animal models of toxicology testing: The role of pigs. Expert Opin. Drug Metab. Toxicol. 2013, 9, 127–139. [Google Scholar] [CrossRef]
- Rothkötter, H.J.; Sowa, E.; Pabst, R. The pig as a model of developmental immunology. Hum. Exp. Toxicol. 2002, 21, 533–536. [Google Scholar] [CrossRef] [PubMed]
- Zomborszky, M.K.; Vetesi, F.; Repa, I.; Kovacs, F.; Bata, A.; Horn, P.; Toth, A.; Romvari, R. Experiment to Determine Limits of Tolerance for Fumonisin B1 in Weaned Piglets. J. Vet. Med. Ser. B 2000, 47, 277–286. [Google Scholar] [CrossRef]
- Dilkin, P.; Zorzete, P.; Mallmann, C.A.; Gomes, J.D.F.; Utiyama, C.E.; Oetting, L.L.; Corrêa, B. Toxicological effects of chronic low doses of aflatoxin B1 and fumonisin B1-containing Fusarium moniliforme culture material in weaned piglets. Food Chem. Toxicol. 2003, 41, 1345–1353. [Google Scholar] [CrossRef]
- Dilkin, P.; Direito, G.; Simas, M.M.S.; Mallmann, C.A.; Corrêa, B. Toxicokinetics and toxicological effects of single oral dose of fumonisin B1 containing Fusarium verticillioides culture material in weaned piglets. Chem. Biol. Interact. 2010, 185, 157–162. [Google Scholar] [CrossRef] [PubMed]
- Voss, K.A.; Smith, G.W.; Haschek, W.M. Fumonisins: Toxicokinetics, mechanism of action and toxicity. Anim. Feed Sci. Technol. 2007, 137, 299–325. [Google Scholar] [CrossRef]
- Park, W.-J.; Park, J.-W.; Merrill, A.H.; Storch, J.; Pewzner-Jung, Y.; Futerman, A.H. Hepatic fatty acid uptake is regulated by the sphingolipid acyl chain length. Biochim. Biophys. Acta 2014, 1841, 1754–1766. [Google Scholar] [CrossRef] [Green Version]
- Raichur, S.; Wang, S.T.; Chan, P.W.; Li, Y.; Ching, J.; Chaurasia, B.; Dogra, S.; Öhman, M.K.; Takeda, K.; Sugii, S.; et al. CerS2 Haploinsufficiency Inhibits β-Oxidation and Confers Susceptibility to Diet-Induced Steatohepatitis and Insulin Resistance. Cell Metab. 2014, 20, 687–695. [Google Scholar] [CrossRef]
- Burger, H.-M.; Abel, S.; Gelderblom, W.C.A. Modulation of key lipid raft constituents in primary rat hepatocytes by fumonisin B1—Implications for cancer promotion in the liver. Food Chem. Toxicol. 2018, 115, 34–41. [Google Scholar] [CrossRef]
- Loiseau, N.; Obata, Y.; Moradian, S.; Sano, H.; Yoshino, S.; Aburai, K.; Takayama, K.; Sakamoto, K.; Holleran, W.M.; Elias, P.M.; et al. Altered sphingoid base profiles predict compromised membrane structure and permeability in atopic dermatitis. J. Dermatol. Sci. 2013, 72, 296–303. [Google Scholar] [CrossRef] [Green Version]
- Riley, R.T.; An, N.H.; Showker, J.L.; Yoo, H.S.; Norred, W.P.; Chamberlain, W.J.; Wang, E.; Merrill, A.H.; Motelin, G.; Beasley, V.R. Alteration of tissue and serum sphinganine to sphingosine ratio: An early biomarker of exposure to fumonisin-containing feeds in pigs. Toxicol. Appl. Pharmacol. 1993, 118, 105–112. [Google Scholar] [CrossRef]
- Grenier, B.; Bracarense, A.-P.F.L.; Schwartz, H.E.; Lucioli, J.; Cossalter, A.-M.; Moll, W.-D.; Schatzmayr, G.; Oswald, I.P. Biotransformation Approaches to Alleviate the Effects Induced by Fusarium Mycotoxins in Swine. J. Agric. Food Chem. 2013, 61, 6711–6719. [Google Scholar] [CrossRef] [PubMed]
- Casteel, S.W.; Turk, J.R.; Cowart, R.P.; Rottinghaus, G.E. Chronic Toxicity of Fumonisin in Weanling Pigs. J. Vet. Diagn. Investig. 1993, 5, 413–417. [Google Scholar] [CrossRef] [PubMed] [Green Version]
- Casteel, S.W.; Turk, J.R.; Rottinghaus, G.E. Chronic effects of dietary fumonisin on the heart and pulmonary vasculature of swine. Fundam. Appl. Toxicol. 1994, 23, 518–524. [Google Scholar] [CrossRef] [PubMed]
- Prelusky, D.B.; Trenholm, H.L.; Rotter, B.A.; Miller, J.D.; Savard, M.E.; Yeung, J.M.; Scott, P.M. Biological fate of fumonisin B1 in food-producing animals. Adv. Exp. Med. Biol. 1996, 392, 265–278. [Google Scholar] [PubMed]
- Schertz, H.; Danicke, S.; Frahm, J.; Schatzmayr, D.; Dohnal, I.; Bichl, G.; Schwartz-Zimmermann, H.E.; Colicchia, S.; Breves, G.; Teifke, J.P.; et al. Biomarker Evaluation and Toxic Effects of an Acute Oral and Systemic Fumonisin Exposure of Pigs with a Special Focus on Dietary Fumonisin Esterase Supplementation. Toxins 2018, 10, 296. [Google Scholar] [CrossRef]
- Grenier, B.; Loureiro-Bracarense, A.-P.; Lucioli, J.; Pacheco, G.D.; Cossalter, A.-M.; Moll, W.-D.; Schatzmayr, G.; Oswald, I.P. Individual and combined effects of subclinical doses of deoxynivalenol and fumonisins in piglets. Mol. Nutr. Food Res. 2011, 55, 761–771. [Google Scholar] [CrossRef] [PubMed]
- Marin, D.E.; Taranu, I.; Pascale, F.; Lionide, A.; Burlacu, R.; Bailly, J.-D.; Oswald, I.P. Sex-related differences in the immune response of weanling piglets exposed to low doses of fumonisin extract. Br. J. Nutr. 2006, 95, 1185–1192. [Google Scholar] [CrossRef]
- Grenier, B.; Bracarense, A.P.; Schwartz, H.E.; Trumel, C.; Cossalter, A.M.; Schatzmayr, G.; Kolf-Clauw, M.; Moll, W.D.; Oswald, I.P. The low intestinal and hepatic toxicity of hydrolyzed fumonisin B₁ correlates with its inability to alter the metabolism of sphingolipids. Biochem. Pharmacol. 2012, 83, 1465–1473. [Google Scholar] [CrossRef]
- Piva, A.; Casadei, G.; Pagliuca, G.; Cabassi, E.; Galvano, F.; Solfrizzo, M.; Riley, R.T.; Diaz, D.E. Activated carbon does not prevent the toxicity of culture material containing fumonisin B1 when fed to weanling piglets1. J. Anim. Sci. 2005, 83, 1939–1947. [Google Scholar] [CrossRef] [Green Version]
- Casado, J.M.; Theumer, M.; Masih, D.T.; Chulze, S.; Rubinstein, H.R. Experimental subchronic mycotoxicoses in mice: Individual and combined effects of dietary exposure to fumonisins and aflatoxin B1. Food Chem. Toxicol. 2001, 39, 579–586. [Google Scholar] [CrossRef]
- Knutsen, H.; Barregård, L.; Bignami, M.; Brüschweiler, B.; Ceccatelli, S.; Cottrill, B.; Dinovi, M.; Edler, L.; Grasl-Kraupp, B.; Hogstrand, C.; et al. Appropriateness to set a group health-based guidance value for fumonisins and their modified forms. EFSA J. 2018, 16, e05172. [Google Scholar]
- Souto, P.; Jager, A.V.; Tonin, F.G.; Petta, T.; Di Gregorio, M.C.; Cossalter, A.M.; Pinton, P.; Oswald, I.P.; Rottinghaus, G.E.; Oliveira, C.A.F. Determination of fumonisin B1 levels in body fluids and hair from piglets fed fumonisin B1-contaminated diets. Food Chem. Toxicol. 2017, 108, 1–9. [Google Scholar] [CrossRef] [PubMed]
- Metayer, J.P.; Travel, A.; Mika, A.; Bailly, J.D.; Cleva, D.; Boissieu, C.; Guennec, J.L.; Froment, P.; Albaric, O.; Labrut, S.; et al. Lack of Toxic Interaction Between Fusariotoxins in Broiler Chickens Fed throughout Their Life at the Highest Level Tolerated in the European Union. Toxins 2019, 11, 455. [Google Scholar] [CrossRef] [PubMed]
- Meissonnier, G.M.; Laffitte, J.; Loiseau, N.; Benoit, E.; Raymond, I.; Pinton, P.; Cossalter, A.-M.; Bertin, G.; Oswald, I.P.; Galtier, P. Selective impairment of drug-metabolizing enzymes in pig liver during subchronic dietary exposure to aflatoxin B1. Food Chem. Toxicol. 2007, 45, 2145–2154. [Google Scholar] [CrossRef] [PubMed]
- Loiseau, N.; Polizzi, A.; Dupuy, A.; Therville, N.; Rakotonirainy, M.; Loy, J.; Viadere, J.-L.; Cossalter, A.-M.; Bailly, J.-D.; Puel, O.; et al. New insights into the organ-specific adverse effects of fumonisin B1: Comparison between lung and liver. Arch. Toxicol. 2015, 89, 1619–1629. [Google Scholar] [CrossRef] [PubMed]
- Gerez, J.R.; Pinton, P.; Callu, P.; Grosjean, F.; Oswald, I.P.; Bracarense, A.P.F.L. Deoxynivalenol alone or in combination with nivalenol and zearalenone induce systemic histological changes in pigs. Exp. Toxicol. Pathol. 2015, 67, 89–98. [Google Scholar] [CrossRef] [PubMed]


| Body Weight Gain (kg) | Diet (FBs Contamination, mg/kg Feed) | |||
|---|---|---|---|---|
| Control | 3.7 | 8.1 | 12.2 | |
| Week 1 | 2.9 ± 0.2 a | 2.9 ± 0.3 a | 2.8 ± 0.4 a | 2.6 ± 0.2 a |
| Week 2 | 3.7 ± 0.7 a | 3.9 ± 0.6 a | 5.6 ± 0.4 a | 4.1 ± 0.4 a |
| Week 3 | 4.8 ± 0.9 a | 6.4 ± 0.5 a | 5.7 ± 0.3 a | 6.0 ± 0.6 a |
| Week 4 | 6.7 ± 0.3 a | 6.6 ± 0.9 a | 6.7 ± 0.3 a | 7.1 ± 0.3 a |
| Organ Weight (g) | Diet (FBs Contamination, mg/kg Feed) | |||
|---|---|---|---|---|
| Control | 3.7 | 8.1 | 12.2 | |
| Spleen | 74.7 ± 5.9 a | 75.9 ± 4.2 a | 72.0 ± 4.3 a | 62.0 ± 3.7 a |
| Liver | 962 ± 81 a | 906 ± 54 a | 1030 ± 23 a | 948 ± 40 a |
| Lung | 373 ± 28 a | 381 ± 12 a | 352 ± 22 a | 382 ± 32 a |
| Kidney | 94.9 ± 3.7 a | 90.4 ± 5.7 a | 93.6 ± 11.6 a | 101.7 ± 6.1 a |
| Heart | 211 ± 12 a | 170 ± 33 a | 204 ± 9 a | 178 ± 9 a |
| Biochemical Parameters | Diet (FBs Contamination, mg/kg Feed) | ||||
|---|---|---|---|---|---|
| Control | 3.7 | 8.1 | 12.2 | ||
| Triglycerides (mmol/L) | day 14 | 0.4 ± 0.1 a | 0.4 ± 0.2 a | 0.4 ± 0.1 a | 0.6 ± 0.2 b |
| day 28 | 0.5 ± 0.1 a | 0.3 ± 0.2 a | 0.4 ± 0.1 a | 0.5 ± 0.1 a | |
| Urea (mmol/L) | day 14 | 3.2 ± 1.2 a | 3.03 ± 1.1 a | 2.4 ± 0.7 a | 2.9 ± 0.9 a |
| day 28 | 2.6 ± 0.6 a | 2.4 ± 0.6 a | 2.5 ± 0.3 a | 4 ± 0.9 b | |
| Creatinine (µmol/L) | day 14 | 79.4 ± 7 a | 78.1 ± 16.3 a | 82.22 ± 6.3 a | 86.2 ± 5.5 a |
| day 28 | 82.7 ± 20 a | 71.7 ± 28.9 a | 84.4 ± 30.3 a | 100.5 ± 35.1 a | |
| Ingredient (%) | |
|---|---|
| Wheat | 47.50 |
| Soybean meal | 24.30 |
| Barley | 22.90 |
| Calcium phosphate | 1.12 |
| Calcium carbonate | 1.00 |
| Vitamin and mineral premix a | 0.50 |
| Vegetable oil | 1.40 |
| Sodium chloride | 0.40 |
| Phytase | 0.01 |
| Lysine | 0.465 |
| Methionine | 0.165 |
| Threonine | 0.195 |
| Tryptophan | 0.045 |
| Composition b | |
| Starch (g) | 476.8 |
| Crude protein (g) | 218.3 |
| Crude fiber (g) | 37.5 |
| Ca (g) | 10.5 |
| P (g) | 6.5 |
| K (g) | 8.7 |
| Net energy (MJ) | 15.6 |
| Criteria (Severity Factor) | Maximum Total Score | |
|---|---|---|
| Heart | Edema (2) | 39 |
| Hemorrhage (2) | ||
| Congestion (1) | ||
| Inflammatory infiltrate (2) | ||
| Myocyte hypertrophy (1) | ||
| Myocyte degeneration (2) | ||
| Necrosis (3) | ||
| Intestine | Villi atrophy (2) | 39 |
| Villi fusion (2) | ||
| Lymphatic dilation (1) | ||
| Edema (2) | ||
| Enterocyte flattening (2) | ||
| Cytoplasmic vacuolation (1) | ||
| Necrosis (3) | ||
| Kidney | Congestion (1) | 27 |
| Inflammatory infiltrate (2) | ||
| Cell debris (1) | ||
| Cytoplasmic vacuolation (1) | ||
| Nuclear vacuolation (1) | ||
| Necrosis (3) | ||
| Lymph nodes and spleen | Lymphoid hyperplasia (1) | 36 |
| Lymphoid depletion (1) | ||
| Histiocytosis (2) | ||
| Inflammatory infiltrate (2) | ||
| Apoptosis (1) | ||
| Mitosis (1) | ||
| Necrosis (3) | ||
| Liver | Trabecular disorganization (1) | 33 |
| Inflammatory infiltrate (1) | ||
| Cytoplasmic vacuolation (1) | ||
| Nuclear vacuolation (1) | ||
| Megalocytosis (2) | ||
| Apoptosis (2) | ||
| Necrosis (3) | ||
| Lung | Edema (2) | 21 |
| Inflammatory infiltrate (2) | ||
| Hemorrhage (2) | ||
| Congestion (1) |
© 2019 by the authors. Licensee MDPI, Basel, Switzerland. This article is an open access article distributed under the terms and conditions of the Creative Commons Attribution (CC BY) license (http://creativecommons.org/licenses/by/4.0/).
Share and Cite
Terciolo, C.; Bracarense, A.P.; Souto, P.C.M.C.; Cossalter, A.-M.; Dopavogui, L.; Loiseau, N.; Oliveira, C.A.F.; Pinton, P.; Oswald, I.P. Fumonisins at Doses below EU Regulatory Limits Induce Histological Alterations in Piglets. Toxins 2019, 11, 548. https://0-doi-org.brum.beds.ac.uk/10.3390/toxins11090548
Terciolo C, Bracarense AP, Souto PCMC, Cossalter A-M, Dopavogui L, Loiseau N, Oliveira CAF, Pinton P, Oswald IP. Fumonisins at Doses below EU Regulatory Limits Induce Histological Alterations in Piglets. Toxins. 2019; 11(9):548. https://0-doi-org.brum.beds.ac.uk/10.3390/toxins11090548
Chicago/Turabian StyleTerciolo, Chloé, Ana Paula Bracarense, Pollyana C.M.C. Souto, Anne-Marie Cossalter, Léonie Dopavogui, Nicolas Loiseau, Carlos A. F. Oliveira, Philippe Pinton, and Isabelle P. Oswald. 2019. "Fumonisins at Doses below EU Regulatory Limits Induce Histological Alterations in Piglets" Toxins 11, no. 9: 548. https://0-doi-org.brum.beds.ac.uk/10.3390/toxins11090548