Article

Ecophysiological Aspects and sxt Genes Expression Underlying Induced Chemical Defense in STX-Producing Raphidiopsis raciborskii (Cyanobacteria) against the Zooplankter Daphnia gessneri

by
Mauro C. P. Vilar
1,*,
Thiago F. C. P. Rodrigues
1,
Luan O. Silva
1,
Ana Beatriz F. Pacheco
2,
Aloysio S. Ferrão-Filho
3 and
Sandra M. F. O. Azevedo
1
1
Laboratory Ecophysiology and Toxicology of Cyanobacteria, Carlos Chagas Filho Institute of Biophysics, Federal University of Rio de Janeiro, Rio de Janeiro 21949-902, Brazil
2
Laboratory Biological Physics, Carlos Chagas Filho Institute of Biophysics, Federal University of Rio de Janeiro, Rio de Janeiro 21949-902, Brazil
3
Laboratory of Evaluation and Promotion of Environmental Health, Instituto Oswaldo Cruz, FIOCRUZ, Rio de Janeiro 21040-360, Brazil
*
Author to whom correspondence should be addressed.
Submission received: 7 May 2021 / Revised: 31 May 2021 / Accepted: 2 June 2021 / Published: 8 June 2021

Abstract

:
Cyanobacteria stand out among phytoplankton when they form massive blooms and produce toxins. Because cyanotoxin genes date to the origin of metazoans, the hypothesis that cyanotoxins function as a defense against herbivory is still debated. Although their primary cellular function might vary, these metabolites could have evolved as an anti-predator response. Here we evaluated the physiological and molecular responses of a saxitoxin-producing Raphidiopsis raciborskii to infochemicals released by the grazer Daphnia gessneri. Induced chemical defenses were evidenced in R. raciborskii as a significant increase in the transcription level of sxt genes, followed by an increase in saxitoxin content when exposed to predator cues. Moreover, cyanobacterial growth decreased, and no significant effects on photosynthesis or morphology were observed. Overall, the induced defense response was accompanied by a trade-off between toxin production and growth. These results shed light on the mechanisms underlying zooplankton–cyanobacteria interactions in aquatic food webs. The widespread occurrence of the cyanobacterium R. raciborskii in freshwater bodies has been attributed to its phenotypic plasticity. Assessing the potential of this species to thrive over interaction filters such as zooplankton grazing pressure can enhance our understanding of its adaptive success.
Key Contribution: Daphnia infochemicals induce an up-regulation of sxt genes and consequently an increase in saxitoxin production by the cyanobacterium Raphidiopsis raciborskii. Conversely, a growth loss may occur as a trade-off with enhanced toxin production. Grazer-induced chemical defense was first evidenced in the cyanobacterial species R. raciborskii.

Graphical Abstract

1. Introduction

Predator–prey interactions foster the evolution of defensive adaptations [1]. A series of traits that deter predation by zooplankton have been described in phytoplankton, including the formation of colonies and spines, and/or the production of harmful metabolites [2,3]. In addition to the direct effect provided by active foraging, zooplankton also release infochemicals that induce functional responses in phytoplankton species, such as increased toxin production [4,5,6,7] and colony formation or trichome stretching, which in turn may limit grazing pressure [8,9,10,11]. These infochemicals are also referred to as kairomones or predator cues, which are chemical signals released by predators that indicate a threat and can benefit prey defense. In Daphnia, these chemicals were found to be aliphatic sulfates and sulfamates [12,13].
In many eutrophic water bodies, cyanobacteria dominate phytoplankton and represent one of the main sources of energy for omnivorous zooplankton in aquatic food webs. Several cyanobacterial species produce bioactive metabolites regarded as anti-grazer substances because of their effects on zooplankton survivorship and reproduction [14,15,16,17], swimming and foraging behavior [18,19]. Ultimately, these metabolites can limit the role that zooplankton play in the top-down control of phytoplankton and therefore impair energy flux in aquatic ecosystems.
Because of the potential on producing these secondary metabolites also named cyanotoxins, Cyanobacteria may form nuisance blooms [20]. Microcystins (MCs), saxitoxins (STXs), cylindrospermopsins (CYNs) and anatoxins (ATXs) are among the most reported cyanotoxins. Although the chemical and pharmacological properties and biosynthesis pathways of these toxins have been well documented [21], their roles in cyanobacterial ecology remain unclear [22,23,24].
Raphidiopsis raciborskii (formerly Cylindrospermopsis raciborskii [25]) is one of the most common bloom-forming species in freshwater. It is a diazotrophic toxic cyanobacterium that was first reported in tropical and subtropical regions where it dominates (or codominates) phytoplanktonic communities. Nowadays, R. raciborskii has been frequently recorded in temperate freshwater environments [26]. This recent expansion and invasive (or opportunistic) potential are ascribed to its phenotypic plasticity, involving, among other traits, tolerance to a wide range of temperatures, competitive potential, and grazing resistance stemming from its morphological and metabolic versatility [26,27,28].
Some strains of R. raciborskii can produce toxic alkaloids with neurotoxic (saxitoxins (STXs)) or cytotoxic activity (cylindrospermopsins (CYNs)). In South America, toxic strains have been reported to be STX producers [29,30,31,32,33], while no strain has been characterized to produce CYN, although some studies have detected this toxin in environmental samples [34]. Moreover, non-toxic R. raciborskii strains, which usually lack genes encoding STXs or CYN [35], can also be found in the environment, co-occurring with toxic strains.
STXs are guanidinium-containing neurotoxic alkaloids that block ionic Na+ and Ca2+ channels encompassing more than 50 analogs, including non-sulfated (saxitoxin and neosaxitoxin), monosulfated (gonyautoxins), disulfated (C-toxins), and decarbamoyl variants and derivatives [36]. These toxins are distinguished from other cyanotoxins because they are produced by organisms belonging to two life domains: Bacteria (Cyanobacteria) and Eukaryota (marine dinoflagellates). In the latter, these toxins are referred to as paralytic shellfish toxins [37]. Because STX analogs display different toxicities in animal cells depending on their functional groups, toxicity equivalent factors (TEFs) are usually addressed [38].
The biosynthesis of STXs depends on enzymes encoded in a gene cluster called sxt, which was first described in R. raciborskii T3 [39], the same strain used in the present study. The sxt cluster comprises seven sxt genes, sxtAsxtD, sxtG, sxtS and sxtU, which encode enzymes involved in the formation of the structural skeleton and other accessory sxt genes, encoding tailoring enzymes involved in chemical modifications, transport and regulation, and transposases [37].
STX-producing R. raciborskii have been shown to have a variety of harmful effects on zooplankton organisms, especially on daphnids, such as decreased feeding rate [40,41], mobility [17,42], growth, and reproduction [43,44]. These effects can occur via direct contact with cyanotoxins through cell ingestion or handling impairment stemming from a mismatch in the size of trichomes. On the other hand, until now no studies have examined the early responses of STX-producing cyanobacteria to chemical signals released by grazers.
The evolution of inducible defenses appears to be favored over constitutive defenses because grazing pressure by zooplankton varies on both temporal and spatial scales [45]. Defenses induced by the presence or action of predators have lower costs compared with constitutive defenses [46]. If predation can be deterred by STXs, the optimal defense hypothesis (ODH) predicts that toxin cell content should increase in response to threat cues, to maintain population fitness [7]. According to Pavia et al. [47], the ODH assumes that both chemical and morphological defenses are costly; therefore, natural selection will act to optimize their benefit–cost ratio. This leads to the prediction that there should be a trade-off with energy allocation to chemical vs. morphological defenses.
The molecular basis of grazer-induced defenses in phytoplankton is poorly understood. A study of the expression of target genes can provide insight into defensive phenotypes, and aid exploration of the adaptive traits mediating anti-predator responses. The conservation of sxt gene clusters in different cyanobacterial species indicates that STXs may play an adaptive role in STX-producing cyanobacteria [48]. No study to date has characterized changes in the expression of genes related to STX synthesis upon the exposure of cyanobacteria to zooplankton, nor in the more general context of predator-induced defenses. Here, we aimed to assess the effects of chemical cues released by the neotropical daphnid Daphnia gessneri on morphological and ecophysiological traits and sxt gene expression in the R. raciborskii strain T3. We tested the hypothesis that predator infochemicals promote a defense response (at the molecular and physiological levels) in the cyanobacterium but at an associated cost, as assumed by the ODH (see [49,50]).

2. Results

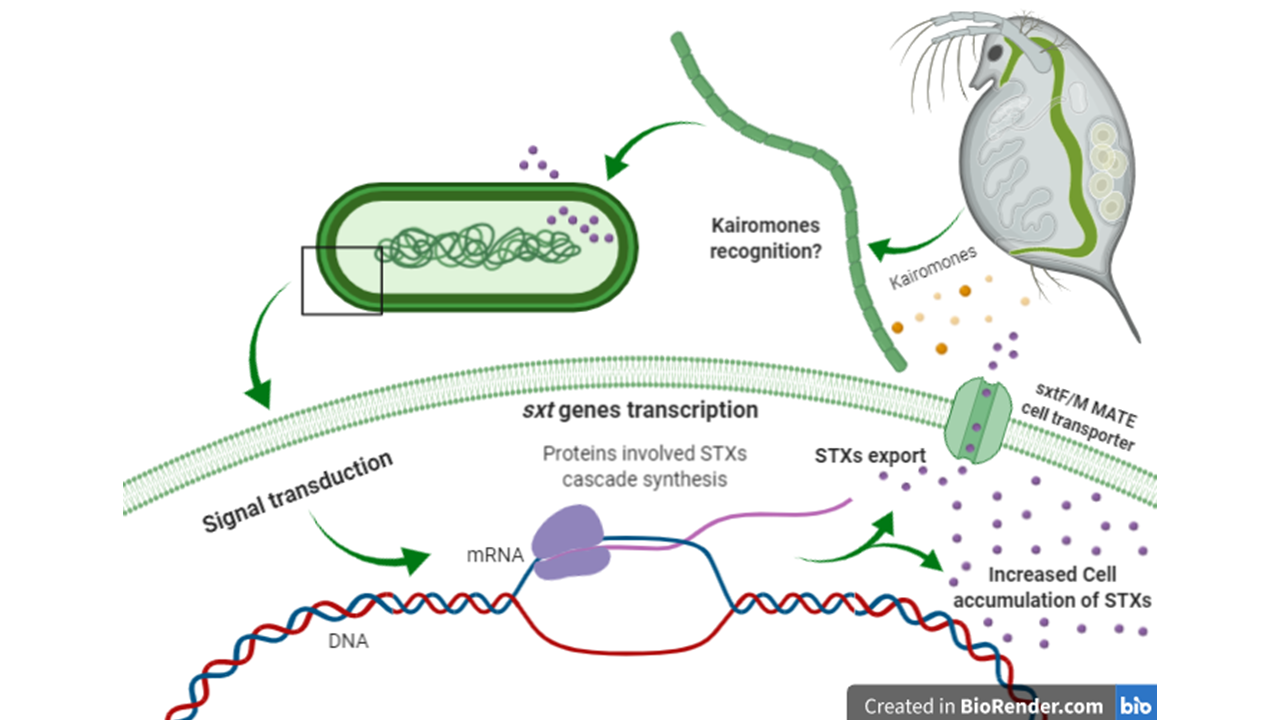
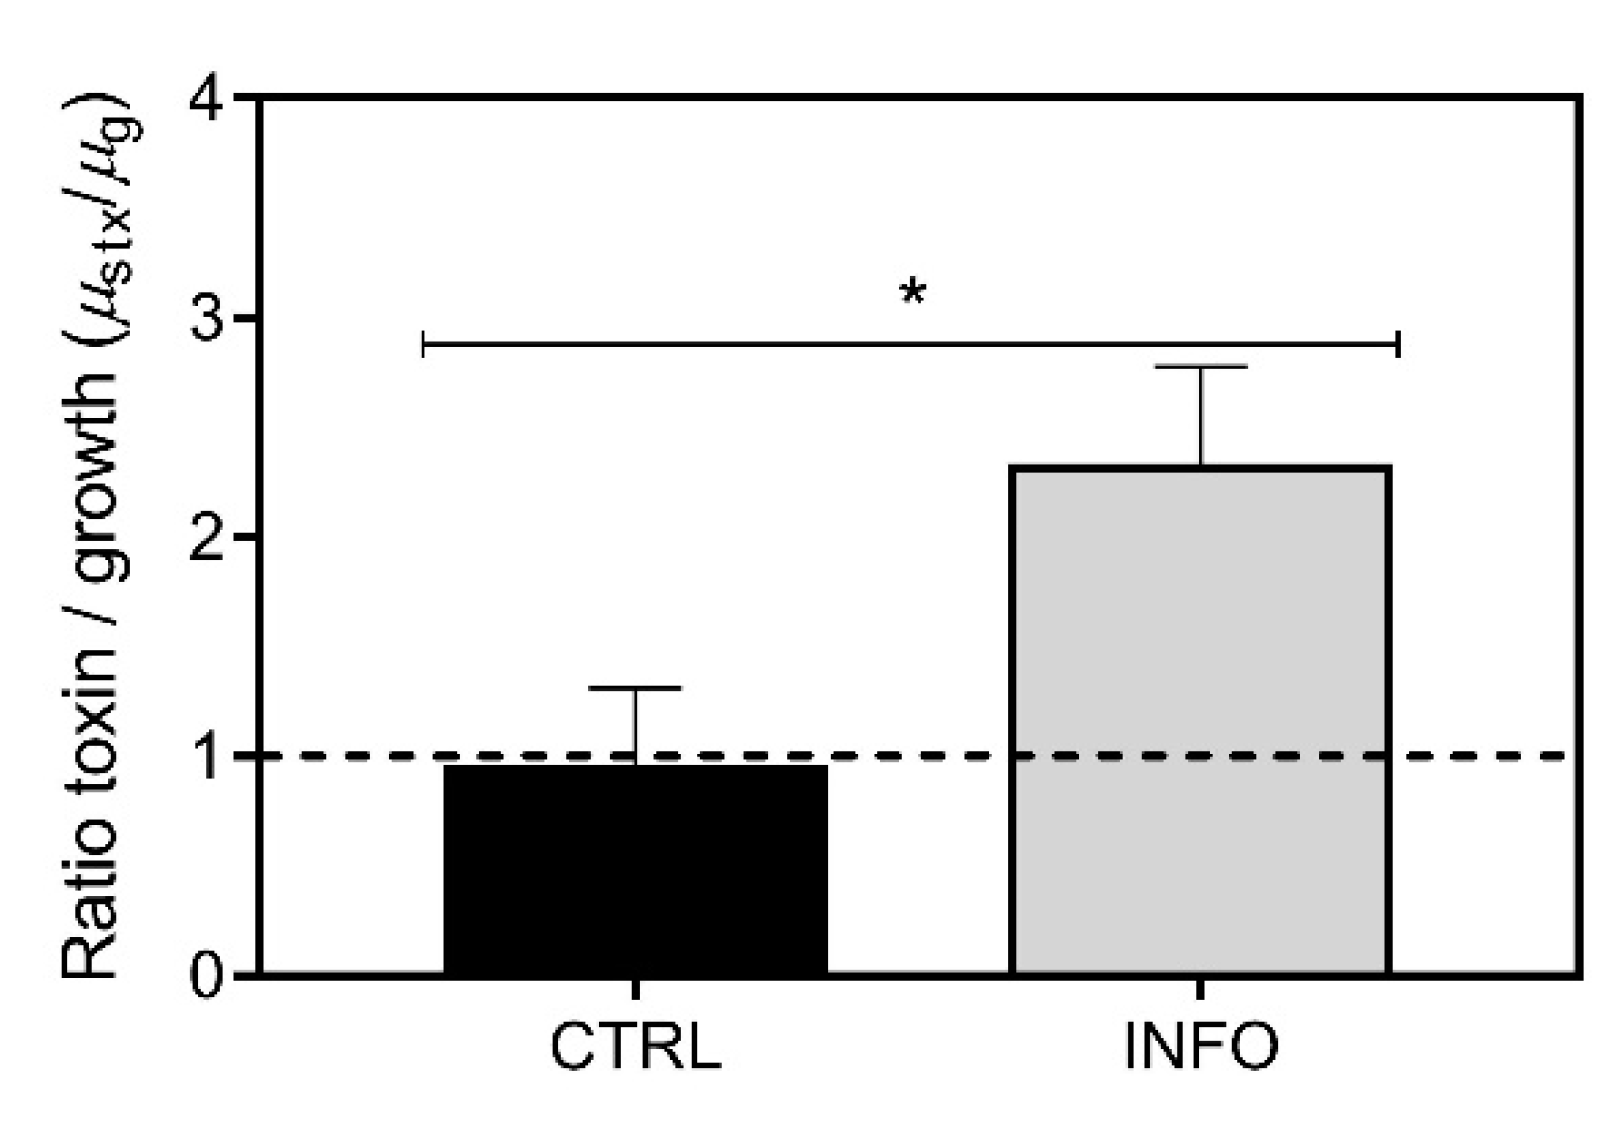
2.1. Predator-Induced Chemical Defense

D. gessneri infochemicals significantly enhanced the total STXs production in R. raciborskii T3 over time (Figure 1; Supplementary Table S1). On the 6th day of incubation with infochemicals, the cellular amount of STXs expressed as STX biovolume quota was 0.63 ± 0.12 µg mm−3. This amount was twice that measured in the control (0.31 ± 0.10 µg mm−3; Bonferroni’s test, p < 0.001), which indicated that a chemically induced defense response was displayed by the cyanobacterium (Figure 1). In addition, neoSTX and STX content increased significantly in response to the infochemicals, which resulted in a higher cellular relative toxicity (infochemicals = 2.92 ± 0.53 µg STXeq mm−3; control = 1.41 ± 0.47 µg STXeq mm−3; Bonferroni’s test, p < 0.001) (Figure 2; Supplementary Table S2).
There was no significant effect of kairomones on the total pool of dissolved STXs (Figure 3). Predator cues resulted in an STX release rate of 0.20 ± 0.04 µg L−1 d−1, while under control conditions, the release rate was 0.16 ± 0.03 µg L−1 d−1 (data not shown).
Overall, the STX biovolume content, relative biovolume toxicity and volumetric STX concentration increased over time (two-way RM ANOVA, p < 0.01) (Figure 1, Figure 2 and Figure 3). The latter also reflected the increase in cell concentration in both experimental conditions.
First-order rate kinetics showed different patterns in toxin production/growth in R. raciborskii T3. Under control conditions, STX production was coupled to growth (1:1 μstxg ratio) (Figure 4). In contrast, predator cues caused the mean value of the μstxg ratio to be significantly greater than 1 (Student’s t-test; T = 4.055, p < 0.05), indicating that the specific rate of STX production was faster than the specific growth rate, resulting in increased cell toxin accumulation (Figure 1).

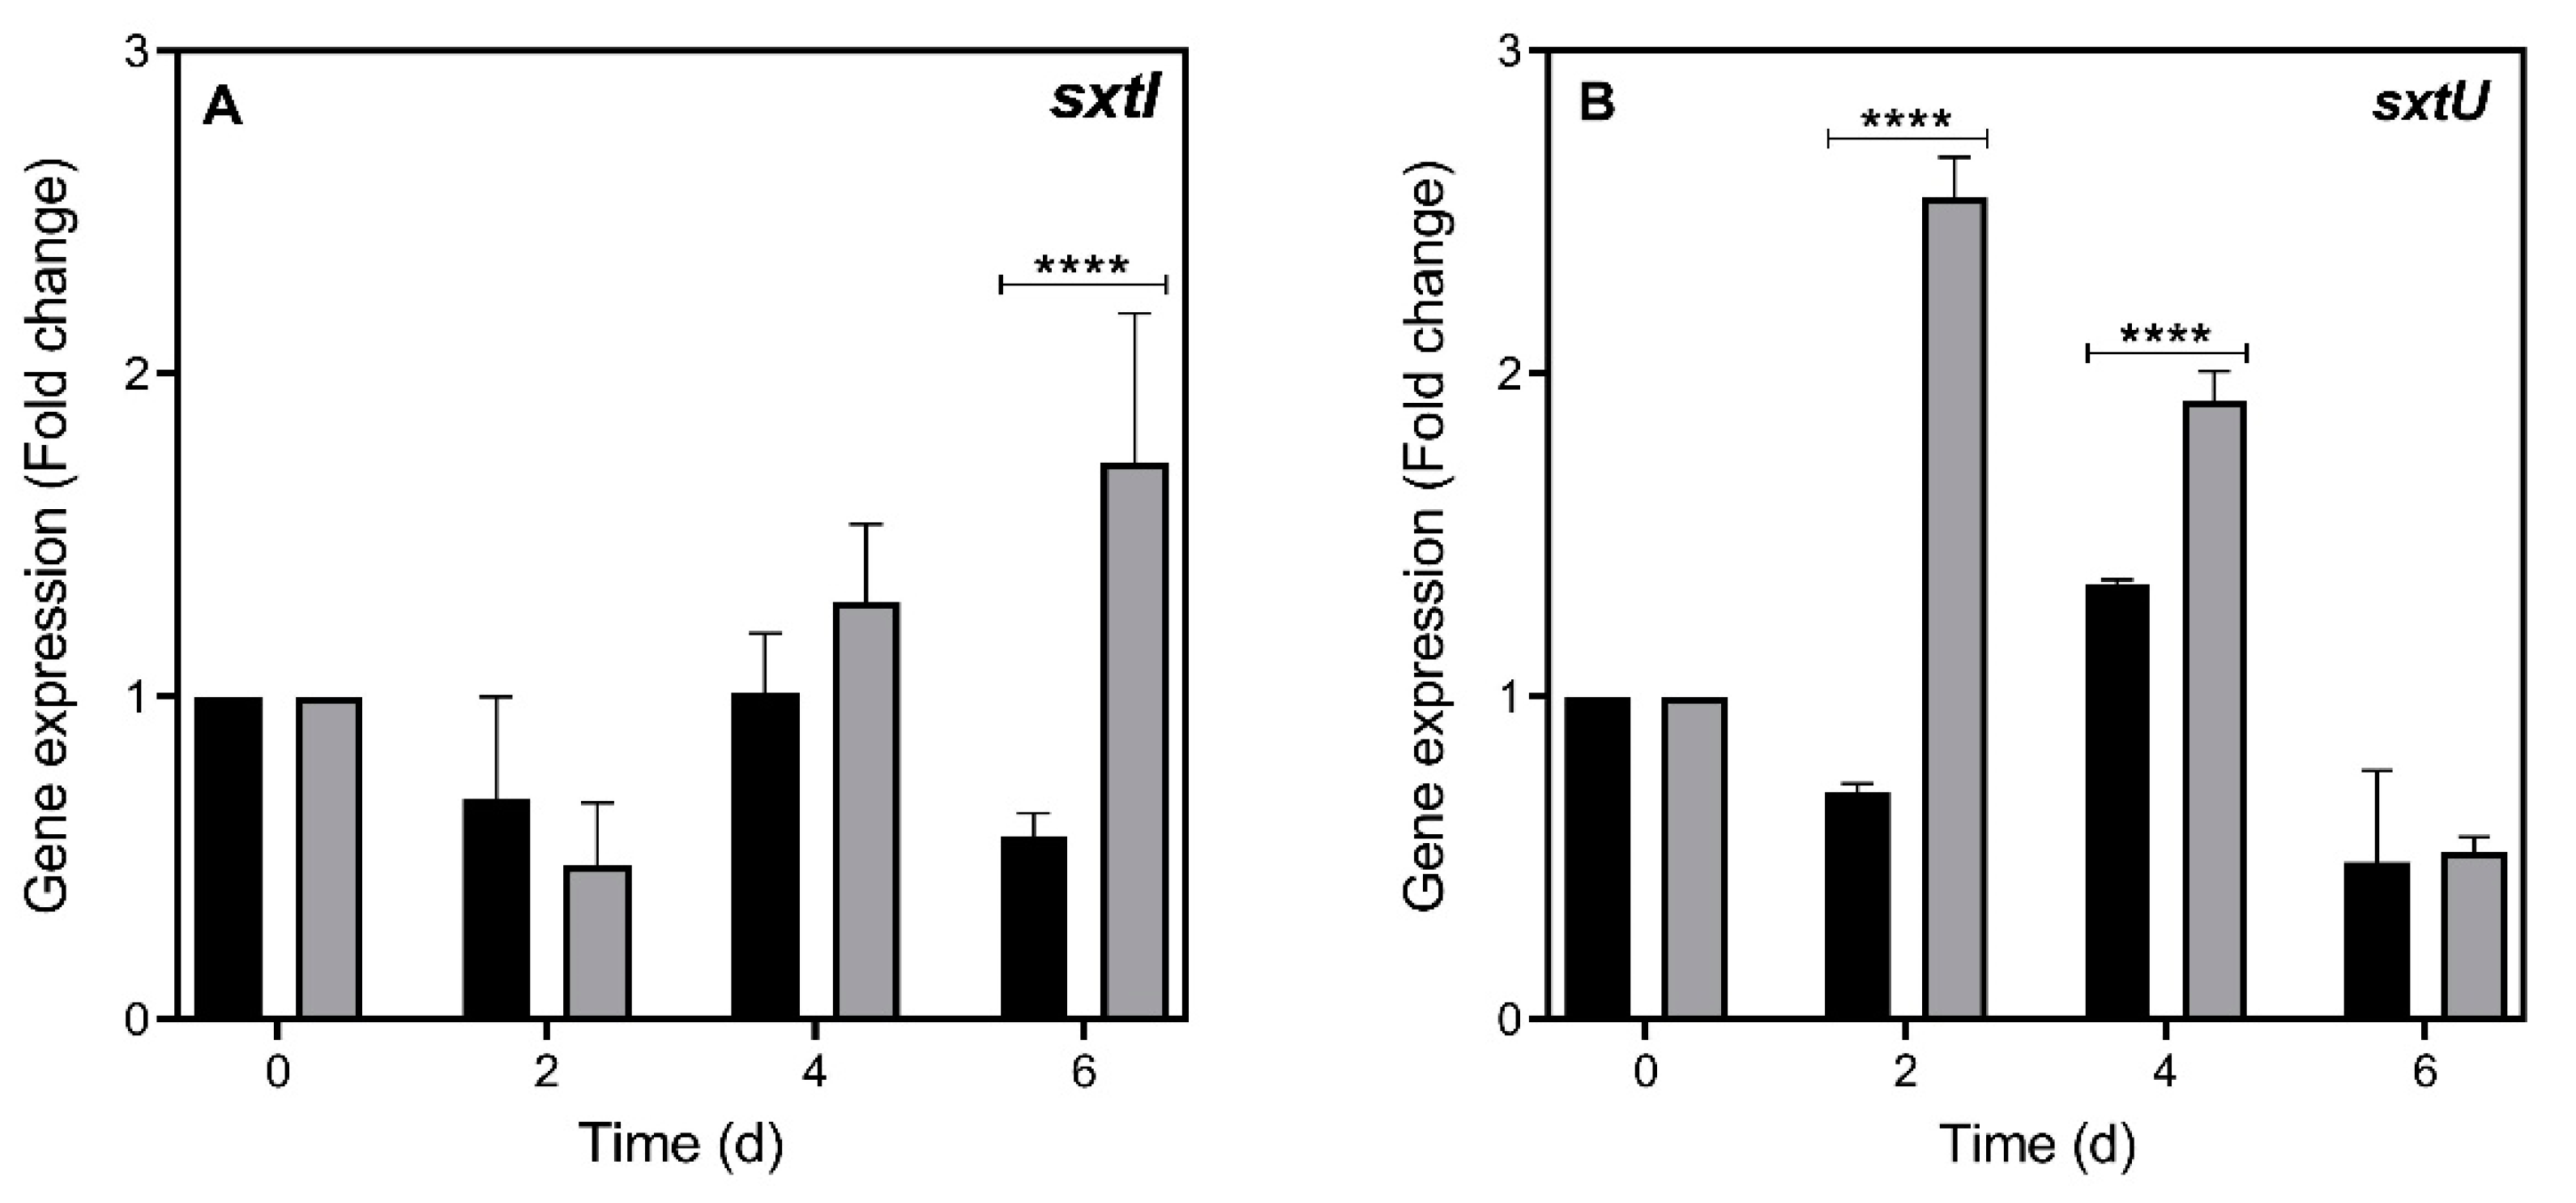
2.2. STX Gene Expression

Significant up-regulation of the expression of two STX-related genes, sxtI (two-way RM ANOVA, F(1,4) = 8.588; p < 0.05) and sxtU (two-way RM ANOVA, F(1,4) = 153.2; p < 0.001), was detected in R. raciborskii T3 grown in the presence of infochemicals compared with the control (Figure 5; Supplementary Table S3). In the presence of Daphnia infochemicals, sxtI expression was significantly higher than the control at the 6th day of incubation (Bonferroni’s test, p < 0.0001) (Figure 5A), which was also when a significant increase in STX production was observed (see Figure 1). Transcript levels increased over time (F(3,12) = 8.172; p < 0.01), and a significant interaction between both factors (time × treatment, F(3,12) = 10.13; p < 0.01) was observed. Transcript abundances of sxtU were higher in the treatment than in the control on the 2nd and 4th days (F(1,4) = 153.2; p < 0.001) (Bonferroni’s test, p < 0.0001) (Figure 5B), four days before an increase in STX content was detected. There was also a significant interaction in the transcript levels of this gene between both factors (time × treatment, F(3,12) = 85.65; p < 0.0001). The abundance of sxtU transcripts decreased gradually over time, and on the 6th day, it was similar under both treatment and control conditions (F(3,12) = 137.7; p < 0.0001).

2.3. Growth, Morphology and Photosynthetic Parameters

R. raciborskii T3 displayed a significant decrease in biovolume (two-way RM ANOVA, p < 0.001) and specific growth rate when exposed to Daphnia-conditioned medium compared with the control (µcontrol = 0.47 ± 0.15 day−1; µinfochemicals = 0.24 ± 0.04 day−1; Student’s t-test, p < 0.05) (Figure 6A; Supplementary Table S4). No differences were observed in chlorophyll-a concentrations (Figure 6B).
Additionally, growth in the presence of predator infochemicals did not affect photosynthesis, as estimated by the light-harvesting efficiency (α), relative PSII quantum yield (Fv’/Fm’), light saturation parameter (Ik) and maximum electron transport rate (ETRmax) (Table 1). However, a significant increase in the photosynthetic parameters ETRmax (two-way RM ANOVA, p < 0.05) and Ik (two-way RM ANOVA, p < 0.001) over time was observed (Table 1).
The irradiation curves of R. raciborskii T3 (maximum PSII quantum yield) indicated no effect of predator infochemicals (Figure 7). Under both control and treatment conditions, the cells were sensitive to light intensities above 64 µmol photons m−2 s−1, and R. raciborskii T3 displayed a significant decrease in photosynthetic efficiency when exposed to increased light pulses (two-way RM ANOVA, p < 0.0001) (Figure 7).
The morphology of R. raciborskii T3 did not change (Dunnett’s test, p > 0.05) when exposed to infochemicals. Trichomes ranged from an initial length of 74.91 ± 32.54 µm to 75.05 ± 40.44 µm at day 6 in the presence of Daphnia infochemicals, and from 74.91 ± 32.54 µm to 79.69 ± 42.79 µm under control conditions. Similarly, no changes were detected in trichome thickness, with mean widths of 2.63 ± 0.52 µm and 2.53 ± 0.43 µm under control and infochemical conditions, respectively.

3. Discussion

Infochemicals released by D. gessneri significantly reduced growth but enhanced sxt gene expression and toxin production in R. raciborskii T3, evidencing a predator-induced chemical defense. We observed these effects using a density of cladocerans near to those naturally occurring, and we detected an approximately two-fold increase in sxt gene transcript levels and cellular STX quotas of the cyanobacterium in response to zooplankton alarm cues.
Several studies have characterized the physiological responses underlying predator-induced chemical defenses in microcystin-producing cyanobacteria [5,51,52,53], including gene expression [45,54]. In contrast, an increase in STX production mediated by predator cues has only been reported in eukaryotic marine dinoflagellates. For example, Selander et al. [7] found that there was a more than two-fold increase in STX production by Alexandrium minutum when exposed to kairomones of the copepod Acartia tonsa. Similar findings were obtained for STX-producing A. tamarense and A. fundyense exposed to different predators [55,56,57]. Despite the effect that the C:N:P ratio has on STX production as suggested by the stoichiometric hypothesis [58], the cellular content of STX can increase in response to predator cues, regardless of nutrient conditions [59].
R. raciborskii T3 has sxtM/sxtF genes that encode multidrug and toxic compound extrusion (MATE) transport proteins [60]. However, no effect on STX secretion by this cyanobacterium was observed, despite the increased biovolume toxin content it displayed following exposure to Daphnia infochemicals. In fact, increasing intracellular toxin content is an effective cyanobacterial defense against grazing pressure by zooplankton as opposed to simply releasing these metabolites into the surroundings. Feeding is thought to be the most important route of exposure to toxins in aquatic systems [61]. This assumption is based on the harmful acute effects and life-history impairments of zooplankton, observed when they actively feed on STX-producing cyanobacteria [16,17,19,62,63].
According to Yang et al. [64], the kairomone-induced increase in STX production is mediated by chemoreception and does not involve mechanical damage. This defensive response does not depend on active grazing and must be assessed by exposing harmful algae or cyanobacteria to predator kairomones. Experiments involving direct exposure would lead to selective grazing on less toxic cells, which might favor cells with a higher mean toxin content; these cells may be indistinguishable from those in which toxin production had been induced [7].
In our study, two representative genes of the sxt cluster, sxtI and sxtU, showed increased transcript levels in R. raciborskii cells exposed to D. gessneri infochemicals. This response preceded the observed increase in STX cellular quotas. sxtU encodes a dehydrogenase that reduces the terminal aldehyde group of the STX precursor, whereas sxtI encodes a carbamoyl transferase that catalyzes carbamoyl transfer from carbamoyl phosphate onto the free hydroxyl at C-13, forming STX [60]. These genes are reliable markers for assessing STX synthesis because they encode enzymes that participate in key steps of STX formation. Other studies have successfully used these sxt molecular markers as reporters to assess STX biosynthesis in R. raciborskii [65,66]. Yang et al. [64] were the first to demonstrate an increased cellular toxin content and associated transcript profile of a STX-producing dinoflagellate exposed to zooplankton cues, although no genes of the sxt cluster were identified. Later, Wohlrab et al. [67] assessed sxtA gene expression coupled with STX production in A. fundyense exposed to predators. Despite a two-fold increase in the STX cell quota, no changes were observed at the transcript level. The authors suggested that sxtA might have been overexpressed early at the onset of the dinoflagellate defense response prior to the observed physiological changes. This assumption is confirmed in our findings, where we demonstrated that an increase in sxt transcript levels preceded the increase in the STX cellular quota during the cyanobacterial response to predator cues.
Molecular events involved in induced chemical defenses in cyanobacteria are still poorly explored, especially in STX-producing species. Although the presence of genes related to toxin synthesis precedes the existence of metazoans [68], these toxins might have evolved to diversify their functions and represent an adaptive response against predators [23]. This is exemplified by the predator-mediated induction of STX production coupled to the increased resistance to grazers in A. minutum [7]. Thus, it is likely that the potential adverse effects of STXs on zooplankton have undergone positive selection more recently, as has been suggested for MCs by Rzymski et al. [69].
In addition to the increased toxin production induced in response to predators, the growth of R. raciborskii T3 decreased, and biovolume concentrations were low under these conditions. Overall, the imbalance in growth and STX production observed after exposure to zooplankton infochemicals indicates the presence of a trade-off. According to photosynthetic parameters, R. raciborskii cells were in a normal physiological state, but growth was still reduced. It is likely that the potential threat indicated by the infochemicals caused the cells to allocate energy toward toxin production instead of cell division. Indeed, studies examining the effects of environmental stressors on R. raciborskii physiology have suggested that there is a trade-off between growth and toxin production [33]. Different stress conditions can activate similar physiological responses as cyanotoxin production. Studies with both STX- and CYN-producing R. raciborskii strains have demonstrated this imbalance between growth and toxin production in response to abiotic stress (e.g., nutrient limitation, light and temperature stress) [30,70,71,72]. However, our study is the first to report the response of the cyanobacterium R. raciborskii to biotic stress caused by predation. Additionally, costs are not only related to the production of well-described toxins, but also to other unknown metabolites. For example, Blossom et al. [73] studied the costs of toxicity in STX-producing Alexandrium and did not find any growth reduction related to toxin production; instead, growth reduction was related to lytic activity, which was associated with other poorly known metabolites.
Additionally, a trade-off response was also confirmed through the first-order kinetics rate. The calculated ratio between the rates of toxin production and cell division indicated that induced chemical defense in R. raciborskii T3 led to a greater increase in the STX production rate than in growth. The production of other cyanotoxins, such as microcystins, is considered a constitutive process that is directly coupled to cell division [74,75]. Cells can achieve an up to three-fold variation in the toxin quota depending on their growth stage [76]. However, the cellular STX content depends not only on the cell division rate but also on environmental factors [33].
Generally, photosynthesis is thought to be disrupted when the cellular growth of phytoplankton is reduced, as the photosynthetic machinery is key for biomass acquisition. In our study, although infochemicals have negatively affected R. raciborskii T3 growth, no photosynthetic impairments were observed. However, a significant increase in the ETRmax and Ik parameters over incubation time occurred, indicating enhanced light acquisition by R. raciborskii, which suggests that self-shading was caused by the accumulation of cells.
We examined photosynthetic parameters to assess early changes in cyanobacterial physiology, as little is known about how predator-induced defenses in phytoplankton might affect photosynthesis. Savic et al. [77] evaluated the photosynthetic response of toxic and nontoxic Microcystis strains exposed to D. magna kairomones. Decreases in photosynthetic activity and chlorophyll-a content in the toxic strain were observed in response to Daphnia. Savic et al. [78] reported that zooplankton cues did not affect M. aeruginosa photosynthetic activity under a similar experimental set-up, which was probably explained by the fact that only ETRmax was examined. In our study, the finding that zooplankton infochemicals had no effect on photosynthesis was based on a more comprehensive set of photosynthetic parameters (i.e., Ik, ETRmax, α and ϕm), in addition to the commonly used chlorophyll-a concentration, ETR and PSII quantum yield.
We also characterized trichome length and thickness, which are proxies of induced morphological defense; however, no significant changes were observed. Several studies have examined the effects of predator kairomones on cyanobacterial filament morphology, and most studies have reported an increase in width [11,79]; however, less is known about the effect on trichome length [11,80]. Filamentous morphology acts as a functional trait that prevents ingestion by clogging the predator filtration apparatus, and some microalgae can adjust their length in response to predator cues to minimize losses associated with zooplankton grazing pressure [81,82,83,84].
Defenses induced under variable grazing threat/attack are considered more energetically efficient than constitutive ones because they enable organisms to maximize benefits and reduce the costs associated with the investment in the constant expression of defensive strategies [85,86]. Numerous studies have attempted to estimate the costs and benefits of defense mechanisms in phytoplankton; Pančić and Kiørboe [87] argue that the costs associated with induced defenses have largely been undetermined. They also assume that if there is no cost to predator-resistance trait expression, all species would evolve toward a state of equal defense, and the community would not be structured by predation. This claim is consistent with the ODH, which is based on the fundamental assumption that the benefits of defense outweigh the costs, especially under high predation pressure [49]. Although the ODH was originally proposed for plant defenses, this hypothesis also predicts defensive responses in unicellular organisms, including phytoplankton, where phenotypically plastic organisms can express defensive traits upon exposure to a threat. However, intraspecific variability in these responses indicates that the associated costs are genotype-specific [53]. Thus, the adaptive evolution of defensive traits can be mediated by both Mendelian (e.g., genotype-specific responses) and non-Mendelian (e.g., phenotypic plasticity) evolving mechanisms.
In general, the predominance of R. raciborskii in water bodies has been attributed to its phenotypic plasticity and its dispersal capacity [26,27]. Assessing the ability of this species to cope with diverse ecological interaction filters (e.g., competition, predation and parasitism) [88] could provide insight into the complex factors that contribute to its adaptive success. Our results point out the potential of a STX-producing strain of the invasive (opportunistic) cyanobacterial species Raphidiopsis raciborskii in responding to grazer cues with an increase in toxin production at different levels. As cyanotoxins are also regarded as anti-grazing chemicals, describing an induced chemical defense and other underlying responses in this species adds more information into the knowledge of adaptive traits (e.g., grazing resistance) which allow its wide occurrence and dominance in several lakes. Additionally, regarding the ecological relevance of our experimental model, R. raciborskii has been reported co-occurring with D. gessneri, in addition to other Daphnia species, in several water bodies [89,90,91].
In conclusion, D. gessneri infochemicals induced the up-regulation of sxt genes and led to a subsequent increase in toxin content. On the other hand, R. raciborskii reduced its growth. These results support the hypothesis that the anti-predator defenses of R. raciborskii may be costly.

4. Materials and Methods

4.1. Phytoplankton and Zooplankton Cultures

R. raciborskii T3 is an STX-producing strain isolated from Billings Reservoir (São Paulo, Brazil) [29]. In this cyanobacterial strain, neoSTX and STX analogs are predominantly produced [92]. Stock cultures were maintained in ASM-1 medium [93] at 24 ± 1 °C and 50 µmol photons m−2 s−1 under a 12/12-h light-dark cycle. Under these conditions, T3 had an average trichome length of 74.91 ± 32.54 µm.
Zooplankton consisted of the neotropical species Daphnia gessneri isolated from Barra do Braúna Reservoir (Minas Gerais, Brazil) in 2018. Individuals were kept in RT medium [94] enriched with commercial 0.1% (~2.25 mg C L−1) humic extract (Microbe-lift® Amazon Black & Soft Water Conditioner, USA) at an initial pH 7.6, 24 ± 1 °C, 50 µmol photons m−2 s−1 and a 12/12-hour dark-light cycle. Animals were fed a cell suspension of the green algae Selenastrum capricornutum at a final concentration of 500 µg C L−1 once every two days. The algae population was dominated by unicells (mean length and width dimensions: 13.80 ± 1.56 × 3.18 ± 0.66 µm).

4.2. Experimental Set-Up

4.2.1. Zooplankton Filtrate to Obtain Infochemicals

Prior to experiments, D. gessneri clones were starved in fresh RT medium to empty their guts and remove any superficial contamination. Cultures were established with adults at a populational density of 60 ind L−1. The animals were fed with a cell suspension of the green algae S. capricornutum at 500 µg C L−1 and incubated for 96 h. Thereafter, animals were removed using a cup of plankton (60-µm mesh size), and the zooplankton medium was sterilized by filtration through a 0.22-µm pore membrane. The filtrate (zooplankton pre-conditioned medium) was used to prepare the ASM-1 culture medium, hereafter referred to as infochemicals. As a control, RT medium with the chlorophycean as food suspension at a similar concentration provided for the treatment with Daphnia wasalso incubated for 96 h, and the medium was then filtered through a 0.22-µm pore membrane. The filtrate was also used instead of water to prepare ASM-1 and transferred together with the infochemical-rich medium to the predator-induced defense experiment.

4.2.2. Predator-Induced Defenses Experiment

Zooplankton-conditioned medium was used to evaluate whether R. raciborskii cells respond to predator infochemicals. Biomass inocula of R. raciborskii T3 at 20 mm3 L−1 (105 cells mL−1) were prepared in 1-L Erlenmeyer flasks filled with 600 mL of infochemical-rich or control culture medium (n = 3). Batch cultures were incubated over 6 days at 24 ± 1 °C and 50 µmol photons m−2 s−1 under a 12/12-h dark-light cycle. Samples were collected every two days to evaluate growth, morphological changes, photosynthetic activity, toxin content and the expression of sxt genes.

4.3. Growth, Morphology and Photosynthetic Measurements

Samples were harvested and preserved with 1% acetic Lugol’s solution for trichome count in a Fuchs-Rosenthal chamber under an optical microscope (Olympus BX51). The results are expressed in trichomes mL−1. Trichome density was converted to biovolume (mm3 L−1) based on the mean trichome volume (µm3) [95,96].
The specific growth rate was calculated during the exponential growth phase using Equation (1):
µ = l n N 2 l n N 1 t 2 t 1
where N2 = final biovolume; N1 = initial biovolume; t2 = final time; and t1 = initial time.
Additionally, trichome length and width (µm) at tinitial and tfinal in both culture conditions were measured to examine morphological variation. Samples were analyzed under an Olympus BX51 light microscope (250× and 400× magnification) coupled to an image-capture system (Canon t6i). Trichomes were measured using the Cell^B software package for image acquisition.
Photosynthetic activity was evaluated using a PHYTO-PAM fluorometer (Heinz Walz GmbH, Germany) equipped with a PHYTO-EDF detection unit for measuring cyanobacterial fluorescence. Saturation pulses (36 µmol photons m−2/s−1) were applied, and fluorescence data were converted to chlorophyll-a concentration (μg L−1) and photosynthetic yield (relative Fv’/Fm’). Light curves were performed with dark-acclimated culture samples (F0) with 10-s intervals between pulses. Light intensity varied from 16 to 764 µmol photons m−2/s−1. From these curves, the values of the maximum electron transport rate (ETRmax), light-harvesting efficiency (α) and light saturation parameter (Ik) were obtained as a function of irradiance. Additionally, the maximum effective quantum efficiency of PSII was calculated as ϕm = [(Fm − F)/Fm], where F is the fluorescence of the dark-adapted sample and Fm is the maximum dark-adapted fluorescence.

4.4. STX Analyses and Toxicity Equivalency Calculation

Aliquots were taken from R. raciborskii cultures, and cells were harvested by centrifugation (7200× g, 10 min, 4 °C). The supernatant was filtered (0.45-μm pore membrane) for toxin measurements in the dissolved fraction, and the pellet was used to measure the intracellular toxin content. Both samples were frozen at –20 °C, freeze-dried and then subjected to STX extraction. For cellular toxin extraction, 0.5 M acetic acid solution was added to the dried cells in 3 cycles of 1 h each. At each cycle, the cell extract was centrifuged as previously mentioned, and the supernatant was reserved. For dissolved STX recovery, filtered samples were freeze-dried and then resuspended in a 0.5 M acetic acid solution. Both dissolved and cellular fractions were filtered in a 0.22-µm syringe filter and stored in 1.5-mL vials prior to chromatographic analysis.
The analysis was performed on a Shimadzu Class VP liquid chromatography system with a fluorescence detector (RF-10A XL). A reversed-phase C18 column (Lichrospher®; 150 mm × 4.6 mm; 5 µm-Merck) and a 20-µL loop injector were used. Chromatographic analyses were performed according to the post-derivatization method [97] using a mobile phase of 2 mM sodium 1-heptane sulfonate in 30 mM ammonium phosphate and 5% acetonitrile at a flow rate of 0.8 mL min−1. STXs were detected at an excitation wavelength of 330 nm and an emission wavelength of 400 nm.
For quantification of toxins, standard solutions of STX and neoSTX from the National Research Council (NRC)—Institute of Marine Biosciences (Canada) were used. Quantified STXs were expressed as volumetric intra- and extracellular concentrations (µg L−1), and cellular toxin amounts as STXs quota per biovolume (µg mm−3).
Total relative cellular toxicity (saxitoxin equivalents, STXeq) was expressed as biovolume toxicity µg STXeq mm−3) according to the TEF described for each STX analog (in this study, neoSTX and STX) in FAO/WHO [98] and using Equation (2):
S T X e q = i = 1 n C i × T E F i
where Ci is the concentration of the individual toxin analog and its assigned TEFi.

4.5. Application of First-Order Rate Kinetics to Assess Total STX Production

The specific growth rate (μg) and the specific total STX production rate (μstx) were calculated during the exponential growth phase according to simple first-order rate kinetics using either biovolume concentration (mm3 L−1) or volumetric total intracellular STX data (μg L−1), respectively. Both specific rates are reported in units per day (d-l).
The ratio between μstx and μg was calculated to assess different patterns of toxin production coupled to the growth cycle and subsequent changes in the toxin cell (or biovolume) quota (Qtox) as described in Orr et al. [74,75], such that:
Equation (3) describes the condition where the intracellular μstx between t0 and tn is slower than μg, resulting in a lower Qtox.
0.5 < µ stx µ g < 1
Equation (4) describes the condition where the intracellular μstx between t0 and tn is a function of μg, resulting in a constant Qtox (1:1 growth-toxin relationship).
µ stx µ g = 1
Equation (5) describes the condition where the intracellular μstx between t0 and tn is higher than μg, resulting in an increased Qtox.
µ stx µ g > 1

4.6. Expression of Genes Involved in STX Biosynthesis

Transcript levels of the sxtI and sxtU genes were measured. Although most steps in the biosynthesis pathway of STX are putative, sequence similarity analysis indicates that the sxtU gene encodes a dehydrogenase that reduces the terminal aldehyde group of the STX precursor [60], and the sxtI gene encodes a carbamoyltransferase that catalyzes carbamoyl transfer from carbamoyl phosphate onto the free hydroxyl at C-13, forming STX. We chose these genes based on previous studies that reported a coherent response pattern of sxtI and sxtU and the other genes of the sxt cluster, and a coherent response of sxtI and sxtU expression and STX levels [65,66]. The reference gene used to calculate the relative expression of the target genes was rpoC1, which encodes the RNA polymerase gamma subunit [99].
Samples of 50 mL were taken from R. raciborskii cultures, and cells were harvested by centrifugation (1500× g, 15 min, 4 °C). TRIzol® (300 μL) was added to the pellets, and the suspensions were immediately stored at –80 °C. RNA extraction was performed using the Direct-zolTM RNA Miniprep Plus (Zymo Research®) extraction kit per the manufacturer’s instructions (including a DNAse digestion step). RNA samples were suspended in RNAse-free water, and the nucleic acid quality and concentration were determined using the RNA HS Assay kit (Life Technologies) in a Qubit fluorometer (Thermo Fisher Scientific). To check for DNA contamination, PCR was carried out using 16S rDNA primers and purified RNA samples as templates. cDNA synthesis was performed with the GoScript Reverse Transcriptase enzyme (Promega) per the manufacturer’s instructions. The cDNA products were quantified in a Nanodrop, diluted 1:10 and tested for amplification with specific primers for rpoC1 [99].
The obtained cDNA was used in qPCR to quantify the relative abundance of sxtU and sxtI transcripts. For each sample, 3 µL of a 1:10 cDNA dilution was mixed with 7.5 μL of Sybr Green PCR MasterMix (Applied Biosystems), 0.6 µL of a 20 µM solution of each primer and nuclease-free water to a final volume of 15 µL. Reactions were performed with the following primers: sxtU forward [5′-ACTCCCAGAACATTCACATCG-3′]—sxtU reverse [5′-GGAATTGGTGTGTTTGGTGC-3′] [99]; sxtI forward [5′-TGCAGTGGGAGCAGCTTTAG-3′]—sxtI reverse [5′-GATCGCCTGCTGTTGAAGTG-3′] [66]; and rpoC1 forward [5′-GACATGGTTTTGGGAGCCTA-3′]—rpoC1 reverse [5′-CGTTATCCGGTTGTCCTGTT-3′] [100]. For each sample, triplicate reactions were run on a QuantStudio 3 Real-Time PCR system (Thermo Fisher Scientific), with a preincubation at 95 °C for 10 min and 40 cycles of amplification at 95 °C for 15 s and 60 °C for 1 min. A melting curve was obtained by incubation at 95 °C for 15 s, 60 °C for 1 min and 95 °C for 15 s. Negative controls for each primer set were included in which nuclease-free water was used instead of cDNA template. The amplification efficiency of each primer set was calculated from standard curves using serial dilutions of cDNA, according to the equation E = 10 (−1/slope) (Supplementary Figure S1 and Table S5). Transcript levels of the target sxt genes were normalized to the reference rpoC1 gene, and the relative change in transcript levels was calculated using the ΔΔCT method of relative quantification [101].

4.7. Statistical Analysis

All data were checked for normality and homoscedasticity of variances. Specific growth rate data and the ratio between specific toxin production and growth rate were analyzed by Student’s T-test to test for significant effects of zooplankton cues. Variation in the growth, total STXs biovolume quota, biovolume relative toxicity, total STXs pool size and sxt gene expression over incubation time were verified using repeated measures of two-way ANOVA with a post-hoc Bonferroni’s test. Morphological trait variation was analyzed using one-way ANOVA with a post-hoc Dunnett’s test using the morphological trait at the initial time as a control condition. The ΔΔCT data were log-transformed, and two-way RM ANOVA was used to compare the infochemical-rich samples with the control samples on each day. All analyses were performed, and graphs were produced using GraphPad Prism 7.0 software.

Supplementary Materials

The following are available online at https://0-www-mdpi-com.brum.beds.ac.uk/article/10.3390/toxins13060406/s1, Table S1: Results of the two-way ANOVA for differences in total saxitoxins biovolume quota of Raphidiopsis raciborskii T3 exposed (infochemicals) and not exposed (control) to Daphnia gessneri over 6 days of incubation. Table S2: Results of the post hoc Bonferroni’s comparison test for differences in biovolume toxicity relative to STX analogues produced by Raphidiopsis raciborskii T3 exposed (infochemicals) and not exposed (control) to Daphnia gessneri over 6 days of incubation. Table S3: Results of the two-way ANOVA for differences in the relative expression of sxtI and sxtU by Raphidiopsis raciborskii T3 exposed (infochemicals) and not exposed (control) to Daphnia gessneri over 6 days of incubation. Table S4: Results of the two-way ANOVA for differences in the biovolume growth curves and chlorophyll-a of Raphidiopsis raciborskii T3 exposed (infochemicals) and not exposed (control) to Daphnia gessneri over 6 days of incubation. Table S5: Efficiencies and standard curve parameters obtained by real-time qPCR analysis for the cyanobacterial rpoC1-, sxtI- and sxtU-specific primer sets. Figure S1: Standard curve and its linear equation for cyanobacterial rpoC1-, sxtI- and sxtU-specific primers.

Author Contributions

Conceptualization—M.C.P.V., A.S.F.-F. and S.M.F.O.A.; data acquisition—M.C.P.V., L.O.S., T.F.C.P.R. and A.B.F.P.; formal analysis—M.C.P.V. and A.B.F.P.; funding acquisition—S.M.F.O.A.; supervision—S.M.F.O.A., A.S.F.-F. and A.B.F.P.; writing/original draft—M.C.P.V.; writing, review & editing—M.C.P.V., A.S.F.-F., A.B.F.P. and S.M.F.O.A. All authors have read and agreed to the published version of the manuscript.

Funding

This work was funded by the National Council for Scientific and Technological Development—CNPq (grant number 306174/2018-9) and by the Carlos Chagas Filho Foundation for the Support of Science in Rio de Janeiro Development—FAPERJ (grant number E-26/203.032/2015). M.C.P.V., T.F.C.P.R. and L.O.S. were supported by CNPq scholarships.

Institutional Review Board Statement

Not applicable.

Informed Consent Statement

Not applicable.

Data Availability Statement

Data is contained within the article or Supplementary Materials.

Acknowledgments

We thank Carolina Lage for the excellent technical assistance with molecular data, the anonymous reviewers for the comments to improve this manuscript and the agencies CNPq and FAPERJ for the financial support.

Conflicts of Interest

The authors declare no conflict of interest.

References

  1. Vermeij, G.J. The evolutionary interaction among species: Selection, escalation, and coevolution. Annu. Rev. Ecol. Evol. Syst. 1994, 25, 219–236. [Google Scholar] [CrossRef]
  2. Van Donk, E.; Ianora, A.; Vos, M. Induced defences in marine and freshwater phytoplankton: A review. Hydrobiologia 2011, 668, 3–19. [Google Scholar] [CrossRef] [Green Version]
  3. Lürling, M. Grazing resistance in phytoplankton. Hydrobiologia 2020, 848, 237–249. [Google Scholar] [CrossRef]
  4. Jang, M.H.; Ha, K.; Joo, G.J.; Takamura, N. Toxin production of cyanobacteria is increased by exposure to zooplankton. Freshwa. Biol. 2003, 48, 1540–1550. [Google Scholar] [CrossRef]
  5. Jang, M.H.; Jung, J.M.; Takamura, N. Changes in microcystin production in cyanobacteria exposed to zooplankton at different population densities and infochemical concentrations. Limnol. Oceanogr. 2007, 52, 1454–1466. [Google Scholar] [CrossRef]
  6. Jang, M.; Ha, K.; Takamura, N. Microcystin production by Microcystis aeruginosa exposed to different stages of herbivorous zooplankton. Toxicon 2008, 51, 882–889. [Google Scholar] [CrossRef]
  7. Selander, E.; Thor, P.; Toth, G.; Pavia, H. Copepods induce paralytic shellfish toxin production in marine dinoflagellates. Proc. Royal Soc. B 2006, 273, 1673–1680. [Google Scholar] [CrossRef] [Green Version]
  8. Lürling, M. Phenotypic plasticity in the green algae Desmodesmus and Scenedesmus with special reference to the induction of defensive morphology. Ann. Limnol. 2003, 39, 85–101. [Google Scholar] [CrossRef] [Green Version]
  9. Lurling, M.; Beekman, W. Palmelloids formation in Chlamydomonas reinhardtii: Defence against rotifer predators? Ann. Limnol. 2006, 42, 65–72. [Google Scholar] [CrossRef]
  10. Wu, X.; Zhang, J.; Qin, B.; Cui, G.; Yang, Z. Grazer density-dependent response of induced colony formation of Scenedesmus obliquus to grazing-associated infochemicals. Biochem. Syst. Ecol. 2013, 50, 286–292. [Google Scholar] [CrossRef]
  11. Wejnerowski, L.; Cerbin, S.; Wojciechowicz, M.; Jurczak, T.; Glama, M.; Meriluoto, J.; Dziuba, M. Effects of Daphnia exudates and sodium octyl sulphates on filament morphology and cell wall thickness of Aphanizomenon gracile (Nostocales), Cylindrospermopsis raciborskii (Nostocales) and Planktothrix agardhii (Oscillatoriales). Eur. J. Phycol. 2018, 53, 280–289. [Google Scholar] [CrossRef]
  12. Yasumoto, K.; Nishigami, A.; Yasumoto, M.; Kasai, F.; Okada, Y.; Kusumi, T.; Ooi, T. Aliphatic sulfates released from Daphnia induce morphological defense of phytoplankton: Isolation and synthesis of kairomones. Tetrahedron Lett. 2005, 46, 4765–4767. [Google Scholar] [CrossRef]
  13. Yasumoto, K.; Nishigami, A.; Ao, H.; Tsuchihashi, C.; Kasai, F.; Kusumi, T.; Ooi, T. Isolation of new aliphatic sulfates and sulfamate as the Daphnia kairomones inducing morphological change of a phytoplankton Scenedesmus gutwinskii. Chem. Pharm. Bull. 2008, 56, 133–136. [Google Scholar] [CrossRef] [Green Version]
  14. Esterhuizen-Londt, M.; von Schnehen, M.; Kühn, S.; Pflugmacher, S. Oxidative stress responses in the animal model, Daphnia pulex exposed to a natural bloom extract versus artificial cyanotoxin mixtures. Aquat. Toxicol. 2016, 179, 151–157. [Google Scholar] [CrossRef]
  15. Ferrão-Filho, A.S.; Kozlowsky-Suzuki, B. Cyanotoxins: Bioaccumulation and effects on aquatic animals. Mar. Drugs 2011, 9, 2729–2772. [Google Scholar] [CrossRef]
  16. Ferrão-Filho, A.S.; Dias, T.M.; Pereira, U.J.; Santos, J.A.A.; Kozlowsky-Suzuki, B. Nutritional and toxicity constraints of phytoplankton from a Brazilian reservoir to the fitness of cladoceran species. Environ. Sci. Pollut. Res. 2019, 26, 12881–12893. [Google Scholar] [CrossRef]
  17. Santos, G.S.D.; Vilar, M.C.P.; Azevedo, S.M.F.O. Acute toxicity of neurotoxin-producing Raphidiopsis (Cylindrospermopsis) raciborskii ITEP-A1 (Cyanobacteria) on the neotropical cladoceran Macrothrix spinosa. Ecotoxicol. Environ. Contam. 2020, 15, 1–8. [Google Scholar] [CrossRef]
  18. Bownik, A. Harmful Algae: Effects of cyanobacterial cyclic peptides on aquatic invertebrates–a short review. Toxicon 2016, 124, 26–35. [Google Scholar] [CrossRef]
  19. Ferrão-Filho, A.S.; Silva, D.A.C. Saxitoxin-producing Raphidiopsis raciborskii (Cyanobacteria) inhibits swimming and physiological parameters in Daphnia similis. Sci. Total. Environ. 2020, 706, 135751. [Google Scholar] [CrossRef]
  20. Huisman, J.; Codd, G.A.; Paerl, H.W.; Ibelings, B.W.; Verspagen, J.M.; Visser, P.M. Cyanobacterial blooms. Nat. Rev. Microbiol. 2018, 16, 471–483. [Google Scholar] [CrossRef]
  21. Pearson, L.A.; Dittmann, E.; Mazmouz, R.; Ongley, S.E.; D’Agostino, P.M.; Neilan, B.A. The genetics, biosynthesis and regulation of toxic specialized metabolites of cyanobacteria. Harmful Algae 2016, 54, 98–111. [Google Scholar] [CrossRef]
  22. Holland, A.; Kinnear, S. Interpreting the Possible Ecological Role(s) of Cyanotoxins: Compounds for Competitive Advantage and/or Physiological Aide? Mar. Drugs 2013, 11, 2239–2258. [Google Scholar] [CrossRef] [Green Version]
  23. Kaplan, A.; Harel, M.; Kaplan-Levy, R.N.; Hadas, O.; Sukenik, A.; Dittmann, E. The languages spoken in the water body (or the biological role of cyanobacterial toxins). Front. Microbiol. 2012, 3, 138. [Google Scholar] [CrossRef] [Green Version]
  24. Omidi, A.; Esterhuizen-Londt, M.; Pflugmacher, S. Still challenging: The ecological function of the cyanobacterial toxin microcystin–What we know so far. Toxin Rev. 2018, 37, 87–105. [Google Scholar] [CrossRef] [Green Version]
  25. Aguilera, A.; Gómez, E.B.; Kaštovský, J.; Echenique, R.O.; Salerno, G.L. The polyphasic analysis of two native Raphidiopsis isolates supports the unification of the genera Raphidiopsis and Cylindrospermopsis (Nostocales, Cyanobacteria). Phycologia 2018, 57, 130–146. [Google Scholar] [CrossRef]
  26. Antunes, J.T.; Leão, P.N.; Vasconcelos, V.M. Cylindrospermopsis raciborskii: Review of the distribution, phylogeography, and ecophysiology of a global invasive species. Front. Microbiol. 2015, 6, 1–13. [Google Scholar] [CrossRef] [Green Version]
  27. Burford, M.A.; Beardall, J.; Willis, A.; Orr, P.T.; Magalhães, V.F.; Rangel, L.M.; Azevedo, S.M.F.O.; Neilan, B.A. Understanding the winning strategies used by the bloom-forming cyanobacterium Cylindrospermopsis raciborskii. Harmful Algae 2016, 54, 44–53. [Google Scholar] [CrossRef]
  28. Jia, N.; Yang, Y.; Yu, G.; Wang, Y.; Qiu, P.; Li, H.; Li, R. Interspecific competition reveals Raphidiopsis raciborskii as a more successful invader than Microcystis aeruginosa. Harmful Algae 2020, 97, 101858. [Google Scholar] [CrossRef]
  29. Lagos, N.; Onodera, H.; Zagatto, P.A.; Andrinolo, D.; Azevedo, S.M.F.O.; Oshima, Y. The first evidence of paralytic shellfish toxins in the freshwater cyanobacterium Cylindrospermopsis raciborskii, isolated from Brazil. Toxicon 1999, 37, 1359–1373. [Google Scholar] [CrossRef]
  30. Mesquita, M.C.B.; Lürling, M.; Dorr, F.; Pinto, E.; Marinho, M.M. Combined effect of light and temperature on the Production of saxitoxins in Cylindrospermopsis raciborskii strains. Toxins 2019, 11, 38. [Google Scholar] [CrossRef] [Green Version]
  31. Molica, R.J.R.; Onodera, H.; García, C.; Rivas, M.; Andrinolo, D.; Nascimento, S.M.; Meguro, H.; Oshima, Y.; Azevedo, S.M.F.O.; Lagos, N. Toxins in the freshwater cyanobacterium Cylindrospermopsis raciborskii (Cyanophyceae) isolated from Tabocas reservoir in Caruaru, Brazil, including demonstration of a new saxitoxin analogue. Phycologia 2002, 41, 606–611. [Google Scholar] [CrossRef]
  32. Piccini, C.; Aubriot, L.; D’Alessandro, B.; Martigani, F.; Bonilla, S. Revealing Toxin Signatures in Cyanobacteria: Report of Genes Involved in Cylindrospermopsin Synthesis from Saxitoxin-Producing Cylindrospermopsis raciborskii. Adv. Microbiol. 2013, 3, 289–296. [Google Scholar] [CrossRef] [Green Version]
  33. Vilar, M.C.P.; Molica, R.J.R. Changes in pH and dissolved inorganic carbon in water affect the growth, saxitoxins production and toxicity of the cyanobacterium Raphidiopsis raciborskii ITEP-A1. Harmful Algae 2020, 97, 101870. [Google Scholar] [CrossRef]
  34. Lorenzi, A.S.; Cordeiro-Araújo, M.K.; Chia, M.A.; Bittencourt-Oliveira, M.C. Cyanotoxin contamination of semiarid drinking water supply reservoirs. Environ. Earth Sci. 2018, 77, 1–8. [Google Scholar] [CrossRef]
  35. Abreu, V.A.; Popin, R.V.; Alvarenga, D.O.; Schaker, P.D.; Hoff-Risseti, C.; Varani, A.M.; Fiore, M.F. Genomic and genotypic characterization of Cylindrospermopsis raciborskii: Toward an intraspecific phylogenetic evaluation by comparative genomics. Front. Microbiol. 2018, 9, 306. [Google Scholar] [CrossRef]
  36. Wiese, M.; D’Agostino, P.M.D.; Mihali, T.K.; Moffitt, M.C.; Neilan, B.A. Neurotoxic Alkaloids: Saxitoxin and its Analogs. Mar. Drugs 2010, 8, 2185–2211. [Google Scholar] [CrossRef] [Green Version]
  37. Wang, D.; Zhang, S.; Zhang, Y.; Lin, L. Paralytic shellfish toxin biosynthesis in cyanobacteria and dinoflagellates: A molecular overview. J. Proteomics 2016, 135, 132–140. [Google Scholar] [CrossRef]
  38. Perez, S.; Vale, C.; Botana, A.M.; Alonso, E.; Vieytes, M.R.; Botana, L.M. Determination of Toxicity Equivalent Factors for Paralytic Shellfish Toxins by Electrophysiological Measurements in cultured neurons. Chem. Res. Toxicol. 2011, 24, 1153–1157. [Google Scholar] [CrossRef]
  39. Kellman, R.; Mihali, T.K.; Jeon, Y.J.; Pickford, R.; Pomati, F.; Neilan, B.A. Biosynthetic intermediate analysis and functional homology reveal a saxitoxin gene cluster in Cyanobacteria. Appl. Environ. Microbiol. 2008, 74, 4044–4053. [Google Scholar] [CrossRef] [Green Version]
  40. Panosso, R.; Lürling, M. Daphnia magna feeding on Cylindrospermopsis raciborskii: The role of food composition, filament length and body size. J. Plankton Res. 2010, 32, 1393–1404. [Google Scholar] [CrossRef] [Green Version]
  41. Ferrão-Filho, A.S.; Silva, D.A.S.; Oliveira, T.A.; Magalhães, V.F.; Pflugmacher, S.; Silva, E.M. Single and combined effects of microcystin-and saxitoxin-producing cyanobacteria on the fitness and antioxidant defenses of cladocerans. Environ. Toxicol. Chem. 2017, 36, 2689–2697. [Google Scholar] [CrossRef] [PubMed]
  42. Ferrão-Filho, A.S.; Soares, M.C.S.; Magalhães, V.F.; Azevedo, S.M.F.O. A rapid bioassay for detecting saxitoxins using a Daphnia acute toxicity test. Environ. Pollut. 2010, 158, 2084–2093. [Google Scholar] [CrossRef] [PubMed]
  43. Costa, S.M.; Ferrão-Filho, A.S.; Azevedo, S.M.F.O. Effects of saxitoxin-and non-saxitoxin-producing strains of the cyanobacterium Cylindrospermopsis raciborskii on the fitness of temperate and tropical cladocerans. Harmful Algae 2013, 28, 55–63. [Google Scholar] [CrossRef]
  44. Soares, M.C.S.; Lürling, M.; Panosso, R.; Huszar, V. Effects of the cyanobacterium Cylindrospermopsis raciborskii on feeding and life history characteristics of the grazer Daphnia magna. Ecotoxicol. Environ. Saf. 2009, 72, 1183–1189. [Google Scholar] [CrossRef]
  45. Harke, M.J.; Jankowiak, J.G.; Morrell, B.K.; Gobler, C.J. Transcriptomic responses in the bloom-forming cyanobacterium Microcystis induced during exposure to zooplankton. Appl. Environ. Microbiol. 2017, 83, e02832-16. [Google Scholar] [CrossRef] [Green Version]
  46. Agrawal, A.A. Phenotypic plasticity in the interactions and evolution of species. Science 2001, 294, 321–326. [Google Scholar] [CrossRef] [Green Version]
  47. Pavia, H.; Toth, G.B.; Åberg, P. Optimal defense theory: Elasticity analysis as a tool to predict intraplant variation in defenses. Ecology 2002, 83, 891–897. [Google Scholar] [CrossRef]
  48. Murray, S.A.; Mihali, T.K.; Neilan, B.A. Extraordinary conservation, gene loss, and positive selection in the evolution of an ancient neurotoxin. Mol. Biol. Evol. 2010, 28, 1173–1182. [Google Scholar] [CrossRef] [PubMed] [Green Version]
  49. McKey, D. Adaptive patterns in alkaloid physiology. Am. Nat. 1974, 108, 305–320. [Google Scholar] [CrossRef]
  50. Van Donk, E.; Lürling, M.; Lampert, W. Consumer induced changes in phytoplankton: Inducibility, costs, benefits, and the impact on grazers. In The Ecology, Evolution of Inducible Defenses; Tollrian, R., Harvell, C.D., Eds.; Princeton University Press: Princeton, NJ, USA, 1999; pp. 89–103. [Google Scholar]
  51. Akbar, S.; Du, J.; Lin, H.; Kong, X.; Sun, S.; Tian, X. Understanding interactive inducible defenses of Daphnia and its phytoplankton prey. Harmful Algae 2017, 66, 47–56. [Google Scholar] [CrossRef]
  52. Princiotta, S.D.; Hendricks, S.P.; White, D.S. Production of cyanotoxins by Microcystis aeruginosa mediates interactions with the mixotrophic flagellate Cryptomonas. Toxins 2019, 11, 223. [Google Scholar] [CrossRef] [Green Version]
  53. Van Gremberghe, I.; Vanormelingen, P.; Van der Gucht, K.; Mancheva, A.; D’hondt, S.; De Meester, L.; Vyverman, W. Influence of Daphnia infochemicals on functional traits of Microcystis strains (Cyanobacteria). Hydrobiologia 2009, 635, 147–155. [Google Scholar] [CrossRef]
  54. Pineda-Mendoza, R.M.; Zúñiga, G.; Martínez-Jerónimo, F. Infochemicals released by Daphnia magna fed on Microcystis aeruginosa affect mcyA gene expression. Toxicon 2014, 80, 78–86. [Google Scholar] [CrossRef]
  55. Selander, E.; Fagerberg, T.; Wohlrab, S.; Pavia, H. Fight and flight in dinoflagellates? Kinetics of simultaneous grazer-induced responses in Alexandrium tamarense. Limnol. Oceanogr. 2012, 57, 58–64. [Google Scholar] [CrossRef]
  56. Senft-Batoh, C.D.; Dam, H.G.; Shumway, S.E.; Wikfors, G.H.; Schlichting, C.D. Influence of predator–prey evolutionary history, chemical alarm-cues, and feeding selection on induction of toxin production in a marine dinoflagellate. Limnol. Oceanogr. 2015, 60, 318–328. [Google Scholar] [CrossRef]
  57. Senft-Batoh, C.D.; Dam, H.G.; Shumway, S.E.; Wikfors, G.H. A multi-phylum study of grazer-induced paralytic shellfish toxin production in the dinoflagellate Alexandrium fundyense: A new perspective on control of algal toxicity. Harmful Algae 2015, 44, 20–31. [Google Scholar] [CrossRef]
  58. Van de Waal, D.B.; Smith, V.H.; Declerck, S.A.; Stam, E.C.; Elser, J.J. Stoichiometric regulation of phytoplankton toxins. Ecol. Lett. 2014, 17, 736–742. [Google Scholar] [CrossRef] [PubMed]
  59. Griffin, J.E.; Park, G.; Dam, H.G. Relative importance of nitrogen sources, algal alarm cues and grazer exposure to toxin production of the marine dinoflagellate Alexandrium catenella. Harmful Algae 2019, 84, 181–187. [Google Scholar] [CrossRef]
  60. Mihali, T.K.; Kellmann, R.; Neilan, B.A. Characterization of the paralytic shellfish toxin biosynthesis gene clusters in Anabaena circinalis AWQC131C and Aphanizomenon sp. NH-5. BMC Biochem. 2009, 10, 8. [Google Scholar] [CrossRef] [PubMed] [Green Version]
  61. Ibelings, B.W.; Havens, K.E. Cyanobacterial toxins: A qualitative meta–analysis of concentrations, dosage and effects in freshwater, estuarine and marine biota. In Cyanobacterial Harmful Algal Blooms: State of the Science and Research Needs; Springer: New York, NY, USA, 2008; pp. 675–732. [Google Scholar]
  62. Ferrão-Filho, A.S.; Soares, M.C.S.; Lima, R.S.; Magalhães, V.F. Effects of Cylindrospermopsis raciborskii (Cyanobacteria) on the swimming behavior of Daphnia (Cladocera). Environ. Toxicol. Chem. 2014, 31, 223–229. [Google Scholar] [CrossRef] [PubMed]
  63. Freitas, E.C.; Pinheiro, C.; Rocha, O.; Loureiro, S. Can mixtures of cyanotoxins represent a risk to the zooplankton? The case study of Daphnia magna Straus exposed to hepatotoxic and neurotoxic cyanobacterial extracts. Harmful Algae 2014, 31, 143–152. [Google Scholar] [CrossRef] [PubMed]
  64. Yang, I.; Selander, E.; Pavia, H.; John, U. Grazer-induced toxin formation in dinoflagellates: A transcriptomic model study. Eur. J. Phycol. 2011, 46, 66–73. [Google Scholar] [CrossRef] [Green Version]
  65. Beamud, G.; Vico, P.; Haakonsson, S.; Martínez de la Escalera, G.; Piccini, C.; Brena, B.; Pírez, M.; Bonilla, S. Influence of UV-B radiation on the fitness and toxin expression of the cyanobacterium Cylindrospermopsis raciborskii. Hydrobiologia 2016, 763, 161–172. [Google Scholar] [CrossRef]
  66. Vico, P.; Aubriot, L.; Martigani, F.; Rigamonti, N.; Bonilla, S.; Piccini, C. Influence of nitrogen availability on the expression of genes involved in the biosynthesis of saxitoxin and analogs in Cylindrospermopsis raciborskii. Harmful Algae 2016, 56, 37–43. [Google Scholar] [CrossRef] [PubMed]
  67. Wohlrab, S.; Selander, E.; John, U. Predator cues reduce intraspecific trait variability in a marine dinoflagellate. BMC Ecol. 2017, 17, 8. [Google Scholar] [CrossRef] [PubMed] [Green Version]
  68. Rantala, A.; Fewer, D.P.; Hisbergues, M.; Rouhiainen, L.; Vaitomaa, J.; Börner, T.; Sivonen, K. Phylogenetic evidence for the early evolution of microcystin synthesis. Proc. Natl. Acad. Sci. USA 2004, 101, 568–573. [Google Scholar] [CrossRef] [Green Version]
  69. Rzymski, P.; Klimaszyk, P.; Jurczak, T.; Poniedziałek, B. Oxidative stress, programmed cell death and microcystin release in Microcystis aeruginosa in response to Daphnia grazers. Front. Microbiol. 2020, 11, 1201. [Google Scholar] [CrossRef]
  70. Kenesi, G.; Shafik, H.; Kovacs, A.; Herodek, S.; Presing, M. Effect of nitrogen forms on growth, cell composition and N2 fixation of Cylindrospermopsis raciborskii in phosphorus-limited chemostat cultures. Hydrobiologia 2009, 623, 191–202. [Google Scholar] [CrossRef]
  71. Nor, N.H.M.; Te, S.H.; Mowe, M.A.D.; Gin, K.Y.H. Environmental factors influence cylindrospermopsin production of Cylindrospermopsis raciborskii (CR12). J. Plankton Res. 2019, 41, 114–126. [Google Scholar]
  72. Stucken, K.; John, U.; Cembella, A.; Soto-Liebe, K.; Vásquez, M. Impact of nitrogen sources on gene expression and toxin production in the diazotroph Cylindrospermopsis raciborskii CS-505 and non-diazotroph Raphidiopsis brookii D9. Toxins 2014, 6, 1896–1915. [Google Scholar] [CrossRef] [Green Version]
  73. Blossom, H.E.; Markussen, B.; Daugbjerg, N.; Krock, B.; Norlin, A.; Hansen, P.J. The cost of toxicity in microalgae: Direct evidence from the dinoflagellate Alexandrium spp. Front. Microbiol. 2019, 10, 1065. [Google Scholar] [CrossRef] [PubMed] [Green Version]
  74. Orr, P.T.; Jones, G.J. Relationship between microcystin production and cell division rates in nitrogen-limited Microcystis aeruginosa cultures. Limnol. Oceanogr. 1998, 43, 1604–1614. [Google Scholar] [CrossRef]
  75. Orr, P.T.; Willis, A.; Burford, M.A. Application of first order rate kinetics to explain changes in bloom toxicity—the importance of understanding cell toxin quotas. J. Ocenanol. Limnol. 2018, 36, 1063–1074. [Google Scholar] [CrossRef]
  76. Jähnichen, S.; Ihle, T.; Petzoldt, T. Variability of microcystin cell quota: A small model explains dynamics and equilibria. Limnologica 2008, 38, 339–349. [Google Scholar] [CrossRef] [Green Version]
  77. Bojadzija Savic, G.; Edwards, C.; Briand, E.; Lawton, L.; Wiegand, C.; Bormans, M. Daphnia magna Exudates Impact Physiological and Metabolic Changes in Microcystis aeruginosa. Toxins 2019, 11, 421. [Google Scholar] [CrossRef] [PubMed] [Green Version]
  78. Bojadzija Savic, G.; Bormans, M.; Edwards, C.; Lawton, L.; Briand, E.; Wiegand, C. Cross talk: Two-way allelopathic interactions between toxic Microcystis and Daphnia. Harmful Algae 2020, 94, 101803. [Google Scholar] [CrossRef] [PubMed]
  79. Cerbin, S.; Wejnerowski, Ł.; Dziuba, M. Aphanizomenon gracile increases in width in the presence of Daphnia. A defence mechanism against grazing? J. Limnol. 2013, 72, e41. [Google Scholar] [CrossRef]
  80. Wejnerowski, L.; Cerbin, S.; Dziuba, M.K. Thicker filaments of Aphanizomenon gracile are more harmful to Daphnia than thinner Cylindrospermopsis raciborskii. Zool. Stud. 2015, 54, 2. [Google Scholar] [CrossRef] [Green Version]
  81. Bergkvist, J.; Thor, P.; Jakobsen, H.H.; Wängberg, S.Å.; Selander, E. Grazer-induced chain length plasticity reduces grazing risk in a marine diatom. Limnol. Oceanogr. 2012, 57, 318–324. [Google Scholar] [CrossRef]
  82. Bjærke, O.; Jonsson, P.R.; Alam, A.; Selander, E. Is chain length in phytoplankton regulated to evade predation? J. Plankton Res. 2015, 37, 1110–1119. [Google Scholar] [CrossRef] [Green Version]
  83. Selander, E.; Jakobsen, H.H.; Lombard, F.; Kiørboe, T. Grazer cues induce stealth behavior in marine dinoflagellates. Proc. Natl. Acad. Sci. USA 2011, 108, 4030–4034. [Google Scholar] [CrossRef] [Green Version]
  84. Selander, E.; Berglund, E.C.; Engström, P.; Berggren, F.; Eklund, J.; Harðardóttir, S.; Lundholm, N.; Grebner, W.; Andersson, M.X. Copepods drive large-scale trait-mediated effects in marine plankton. Sci. Adv. 2019, 5, eaat5096. [Google Scholar] [CrossRef] [PubMed] [Green Version]
  85. Agrawal, A.A. Induced responses to herbivory and increased plant performance. Science 1998, 279, 1201–1202. [Google Scholar] [CrossRef] [Green Version]
  86. Agrawal, A.A.; Laforsch, C.; Tollrian, R. Transgenerational induction of defences in animals and plants. Nature 1999, 401, 2. [Google Scholar] [CrossRef]
  87. Pančić, M.; Kiørboe, T. Phytoplankton defence mechanisms: Traits and trade-offs. Biol. Rev. 2018, 93, 1269–1303. [Google Scholar] [CrossRef]
  88. Cadotte, M.W.; Tucker, C.M. Should environmental filtering be abandoned? Trends Ecol. Evol. 2017, 32, 429–437. [Google Scholar] [CrossRef] [PubMed]
  89. Fileto, C.; Arcifa, M.S.; Marchetti, J.M.; Turati, I.C.; Lopes, N.P. Influence of biochemical, mineral and morphological features of natural food on tropical cladocerans. Aquatic Ecol. 2007, 41, 557–568. [Google Scholar] [CrossRef]
  90. Soares, M.C.S.; Rocha, M.I.D.A.; Marinho, M.M.; Azevedo, S.M.; Branco, C.W.; Huszar, V.L. Changes in species composition during annual cyanobacterial dominance in a tropical reservoir: Physical factors, nutrients and grazing effects. Aquat. Microb. Ecol. 2009, 57, 137–149. [Google Scholar] [CrossRef] [Green Version]
  91. Zamora-Barrios, C.A.; Nandini, S.; Sarma, S.S.S. Bioaccumulation of microcystins in seston, zooplankton and fish: A case study in Lake Zumpango, Mexico. Environ. Pollut. 2019, 249, 267–276. [Google Scholar] [CrossRef]
  92. D’Agostino, P.M.; Boundy, M.J.; Harwood, T.D.; Carmichael, W.W.; Neilan, B.A.; Wood, S.A. Re-evaluation of paralytic shellfish toxin profiles in cyanobacteria using hydrophilic interaction liquid chromatography-tandem mass spectrometry. Toxicon 2019, 158, 1–7. [Google Scholar] [CrossRef]
  93. Gorham, P.R.; McLachlan, J.; Hammer, U.T.; Kim, W.K. Isolation and culture of toxic strains of Anabaena flos-aquae (Lyngb.) de Breäb. Verh. Int. Ver. Theor. Angew. Limnol. 1964, 15, 796. [Google Scholar]
  94. Tollrian, R. Neckteeth formation in Daphnia pulex as an example of continuous phenotypic plasticity: Morphological effects of Chaoborus kairomone concentration and their quantification. J. Plankton Res. 1993, 15, 1309–1318. [Google Scholar] [CrossRef]
  95. Hillebrand, H.; Dürselen, C.D.; Kirshtel, D.; Pollingher, U.; Zohary, T. Biovolume calculation for pelagic and benthic microalgae. J. Phycol. 1999, 35, 403–424. [Google Scholar] [CrossRef]
  96. Sun, J.; Liu, D. Geometric models for calculating cell biovolume and surface area for phytoplankton. J. Plankton Res. 2003, 25, 1331–1346. [Google Scholar] [CrossRef] [Green Version]
  97. Oshima, Y. Postcolumn derivatization liquid chromatographic method for paralytic shellfish toxins. J. AOAC Int. 1995, 78, 528–532. [Google Scholar] [CrossRef]
  98. FAO/WHO. Technical Paper on Toxicity Equivalency Factors for Marine Biotoxins Associated with Bivalve Molluscs; Food and Agriculture Organization/World Health Organization: Rome, Italy, 2016; 108p. [Google Scholar]
  99. Martínez De La Escalera, G.; Antoniades, D.; Bonilla, S.; Piccini, C. Application of ancient DNA to the reconstruction of past microbial assemblages and for the detection of toxic cyanobacteria in subtropical freshwater ecosystems. Mol. Ecol. 2014, 23, 5791–5802. [Google Scholar] [CrossRef] [PubMed]
  100. Willis, A.; Chuang, A.; Dyrhman, S.; Burford, M.A. Differential expression of phosphorus acquisition genes in responses to phosphorus stress in two Raphidiopsis raciborskii strains. Harmful Algae 2019, 82, 19–25. [Google Scholar] [CrossRef]
  101. Livak, K.J.; Schmittgen, T.D. Analysis of relative gene expression data using real-time quantitative PCR and the 2−ΔΔCT method. Methods 2001, 25, 402–408. [Google Scholar] [CrossRef] [PubMed]
Figure 1. Total saxitoxin quota by biovolume of Raphidiopsis raciborskii T3 exposed to Daphnia gessneri infochemicals (gray bars) and under control conditions (white bars). Significant differences (***) = Bonferroni’s test, p < 0.001.
Toxins 13 00406 g001
Figure 2. Relative biovolume toxicity based on the neosaxitoxin (white bars) and saxitoxin (gray bars) content per biovolume of Raphidiopsis raciborskii T3 cells (A) under control conditions and (B) exposed to Daphnia gessneri infochemicals. Different letters indicate significant differences (Bonferroni’s test, p < 0.05).
Toxins 13 00406 g002
Figure 3. Concentrations of (A) intracellular and (B) extracellular saxitoxin in Raphidiopsis raciborskii T3 under control conditions (black bars) and exposed to Daphnia gessneri infochemicals (gray bars). No significant differences were detected between the two conditions.
Toxins 13 00406 g003
Figure 4. Ratio between specific total saxitoxin production rate (µstx) and specific growth rate (µg) obtained from first-order rate kinetics (log phase) for Raphidiopsis raciborskii T3 grown under control conditions (CTRL) and with Daphnia gessneri infochemicals (INFO). The dashed line indicates a 1:1 relationship between µstx and µg. (*) = t-test, p < 0.05.
Toxins 13 00406 g004
Figure 5. Relative expression of (A) sxtI and (B) sxtU genes in Raphidiopsis raciborskii T3 under control conditions (black columns) and exposure to Daphnia gessneri infochemicals (gray columns). Fold change calculated by the 2−ΔΔCT method. Significant differences between the two conditions are indicated by asterisks (****) = Bonferroni’s test, p < 0.0001.
Toxins 13 00406 g005
Figure 6. Growth curves and growth rates estimated by (A) biovolume and (B) chlorophyll-a concentration for Raphidiopsis raciborskii T3 exposed to Daphnia gessneri infochemicals (dashed line) and under control conditions (solid line). Significant differences (*) = p < 0.05; (***) = p < 0.001, Bonferroni’s test.
Toxins 13 00406 g006
Figure 7. Maximum PSII quantum yield derived from the photosynthesis irradiation curve of Raphidiopsis raciborskii T3 control (A) and exposed (B) to Daphnia gessneri infochemicals for 6 days. Significant differences (* p < 0.05; ** p < 0.01; **** p < 0.0001) after Bonferroni’s test.
Toxins 13 00406 g007
Table 1. Photosynthetic parameters of Raphidiopsis raciborskii T3 exposed to Daphnia gessneri infochemicals (INFO) and under control conditions (CTRL). Yield—relative PSII quantum yield—at a saturation pulse of 36 PAR (photosynthetically active radiation), ETRmax—maximum electron transport rate, Ik—light saturation parameter, and alpha (α)—light-harvesting efficiency. SD = standard deviation. Values with the same letter are not significantly different (Bonferroni’s test, p < 0.05).
dayYieldETRmaxIkAlpha
(Relative Fv’/Fm’)(µmol e m−2 s−1)(µmol photon m−2 s−1)(µmol photon m−2 s−1)
CTRL 1INFO 1CTRLINFOCTRLINFOCTRLINFO
00.48 ± 0.0 a0.48 ± 0.0 a81.80 ± 0.0 a81.80 ± 0.0 a353.10 ± 0.0 a353.10 ± 0.0 a0.23 ± 0.0 a0.22 ± 0.0 a
20.59 ± 0.0 a0.48 ± 0.1 a104.07 ± 16.5 a77.70 ± 31.4 a429.23 ± 66.7 a359.10 ± 69.3 a0.23 ± 0.0 a0.23 ± 0.0 a
40.55 ± 0.0 a0.53 ± 0.0 a103.27 ± 15.3 a102.47 ± 8.1 a448.03 ± 56.9 a440.23 ± 36.2 a0.24 ± 0.0 a0.23 ± 0.0 a
60.52 ± 0.0 a0.51 ± 0.0 a118.27 ± 5.7 a109.77 ± 6.7 a531.03 ± 41.9 a514.60 ± 41.9 a0.22 ± 0.0 a0.23 ± 0.0 a
1 All data are shown as mean ± standard deviation.
Publisher’s Note: MDPI stays neutral with regard to jurisdictional claims in published maps and institutional affiliations.

