Sterigmatocystin, 5-Methoxysterigmatocistin, and Their Combinations are Cytotoxic and Genotoxic to A549 and HepG2 Cells and Provoke Phosphorylation of Chk2, but not FANCD2 Checkpoint Proteins


Abstract
:1. Introduction
2. Results
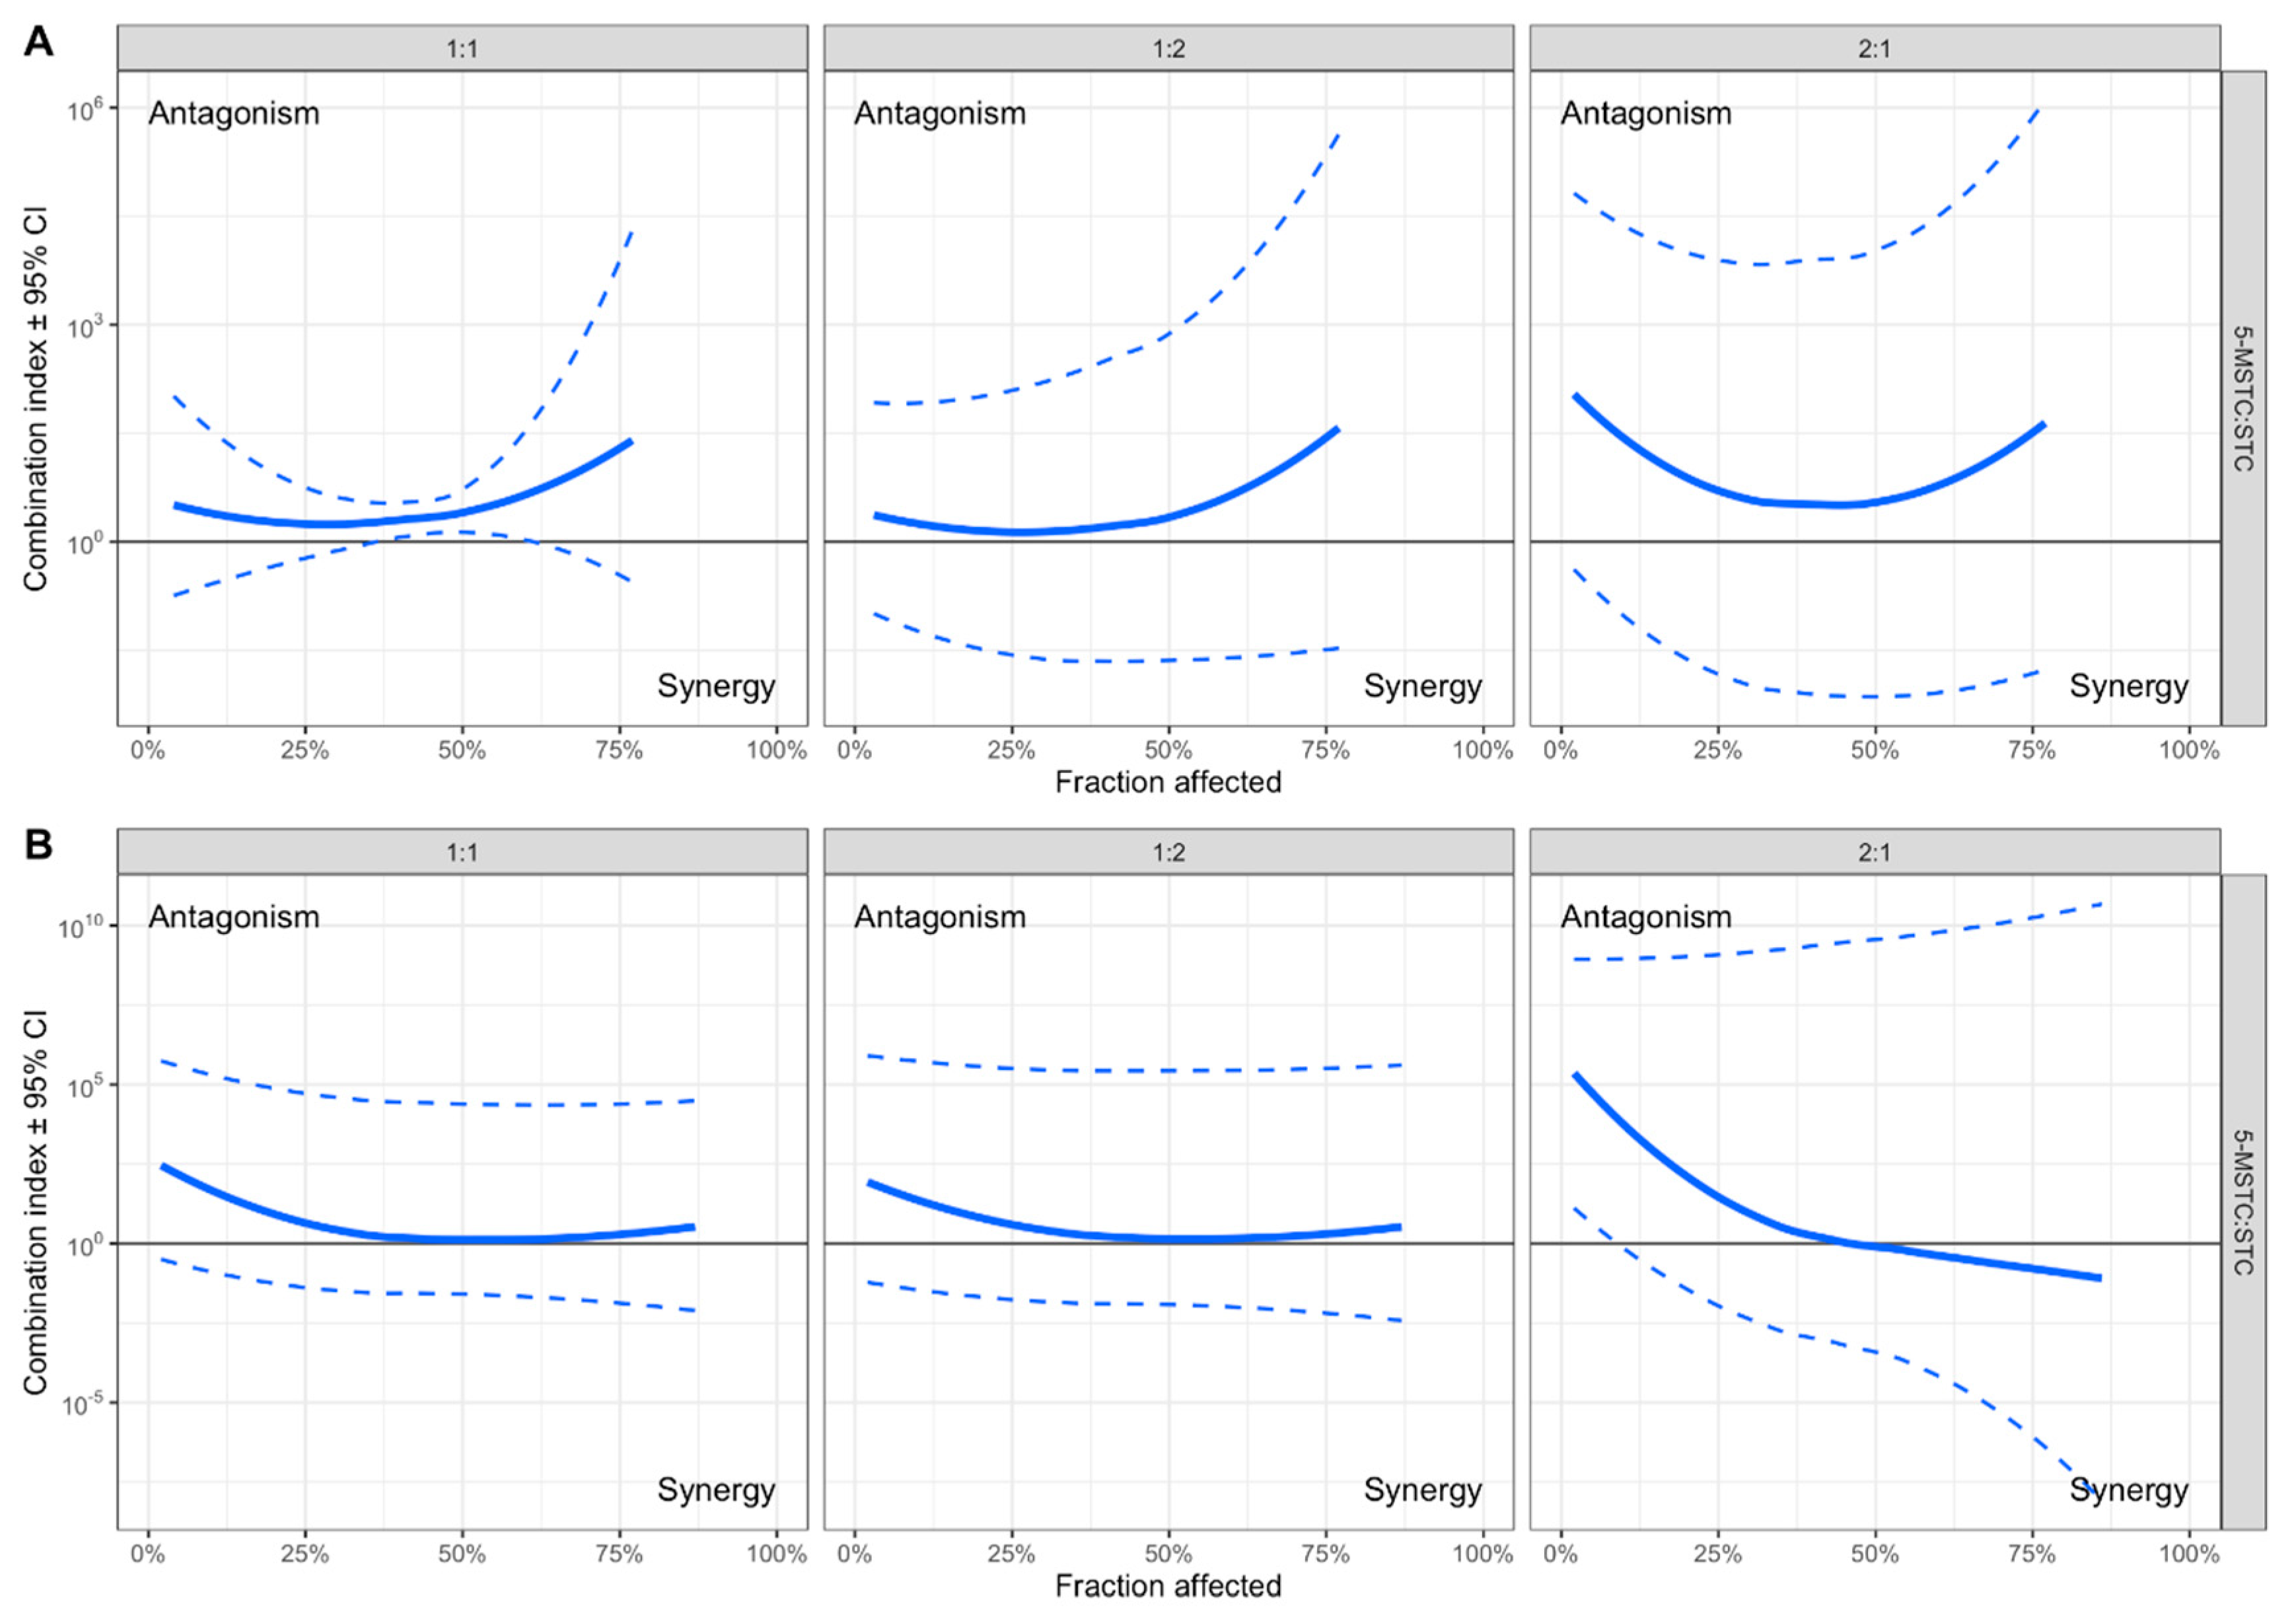
2.1. Cytotoxicity
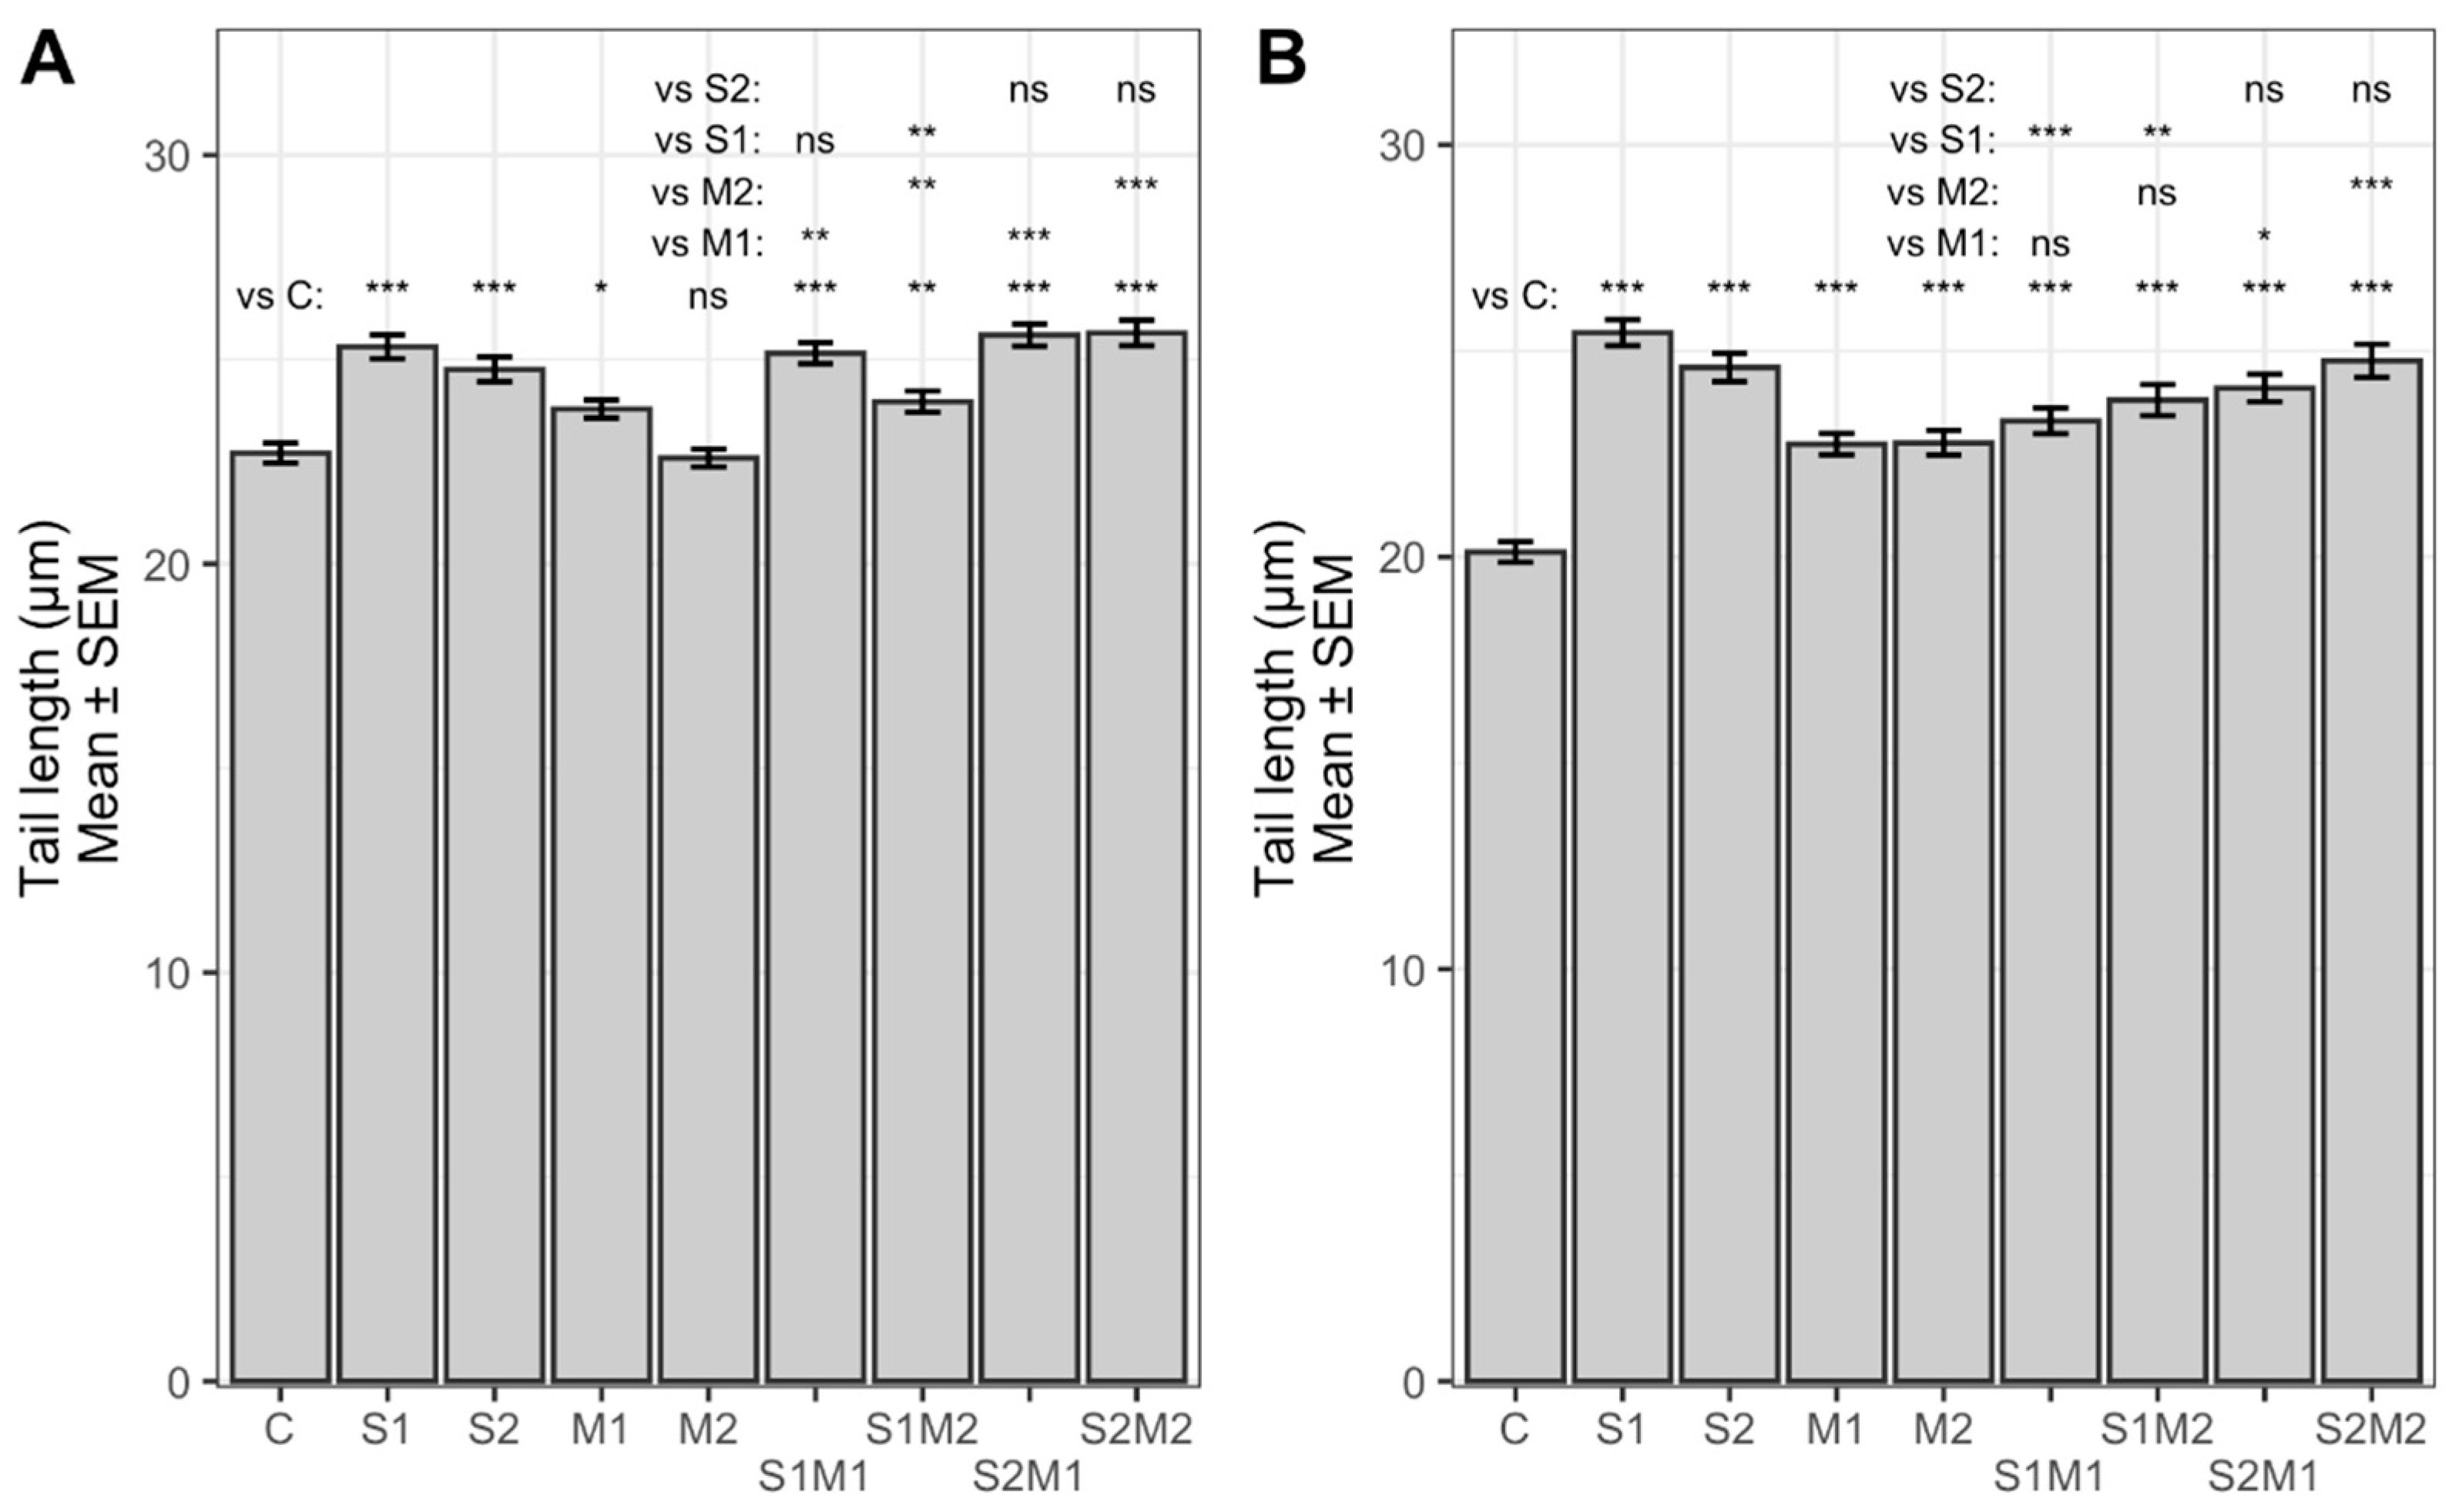
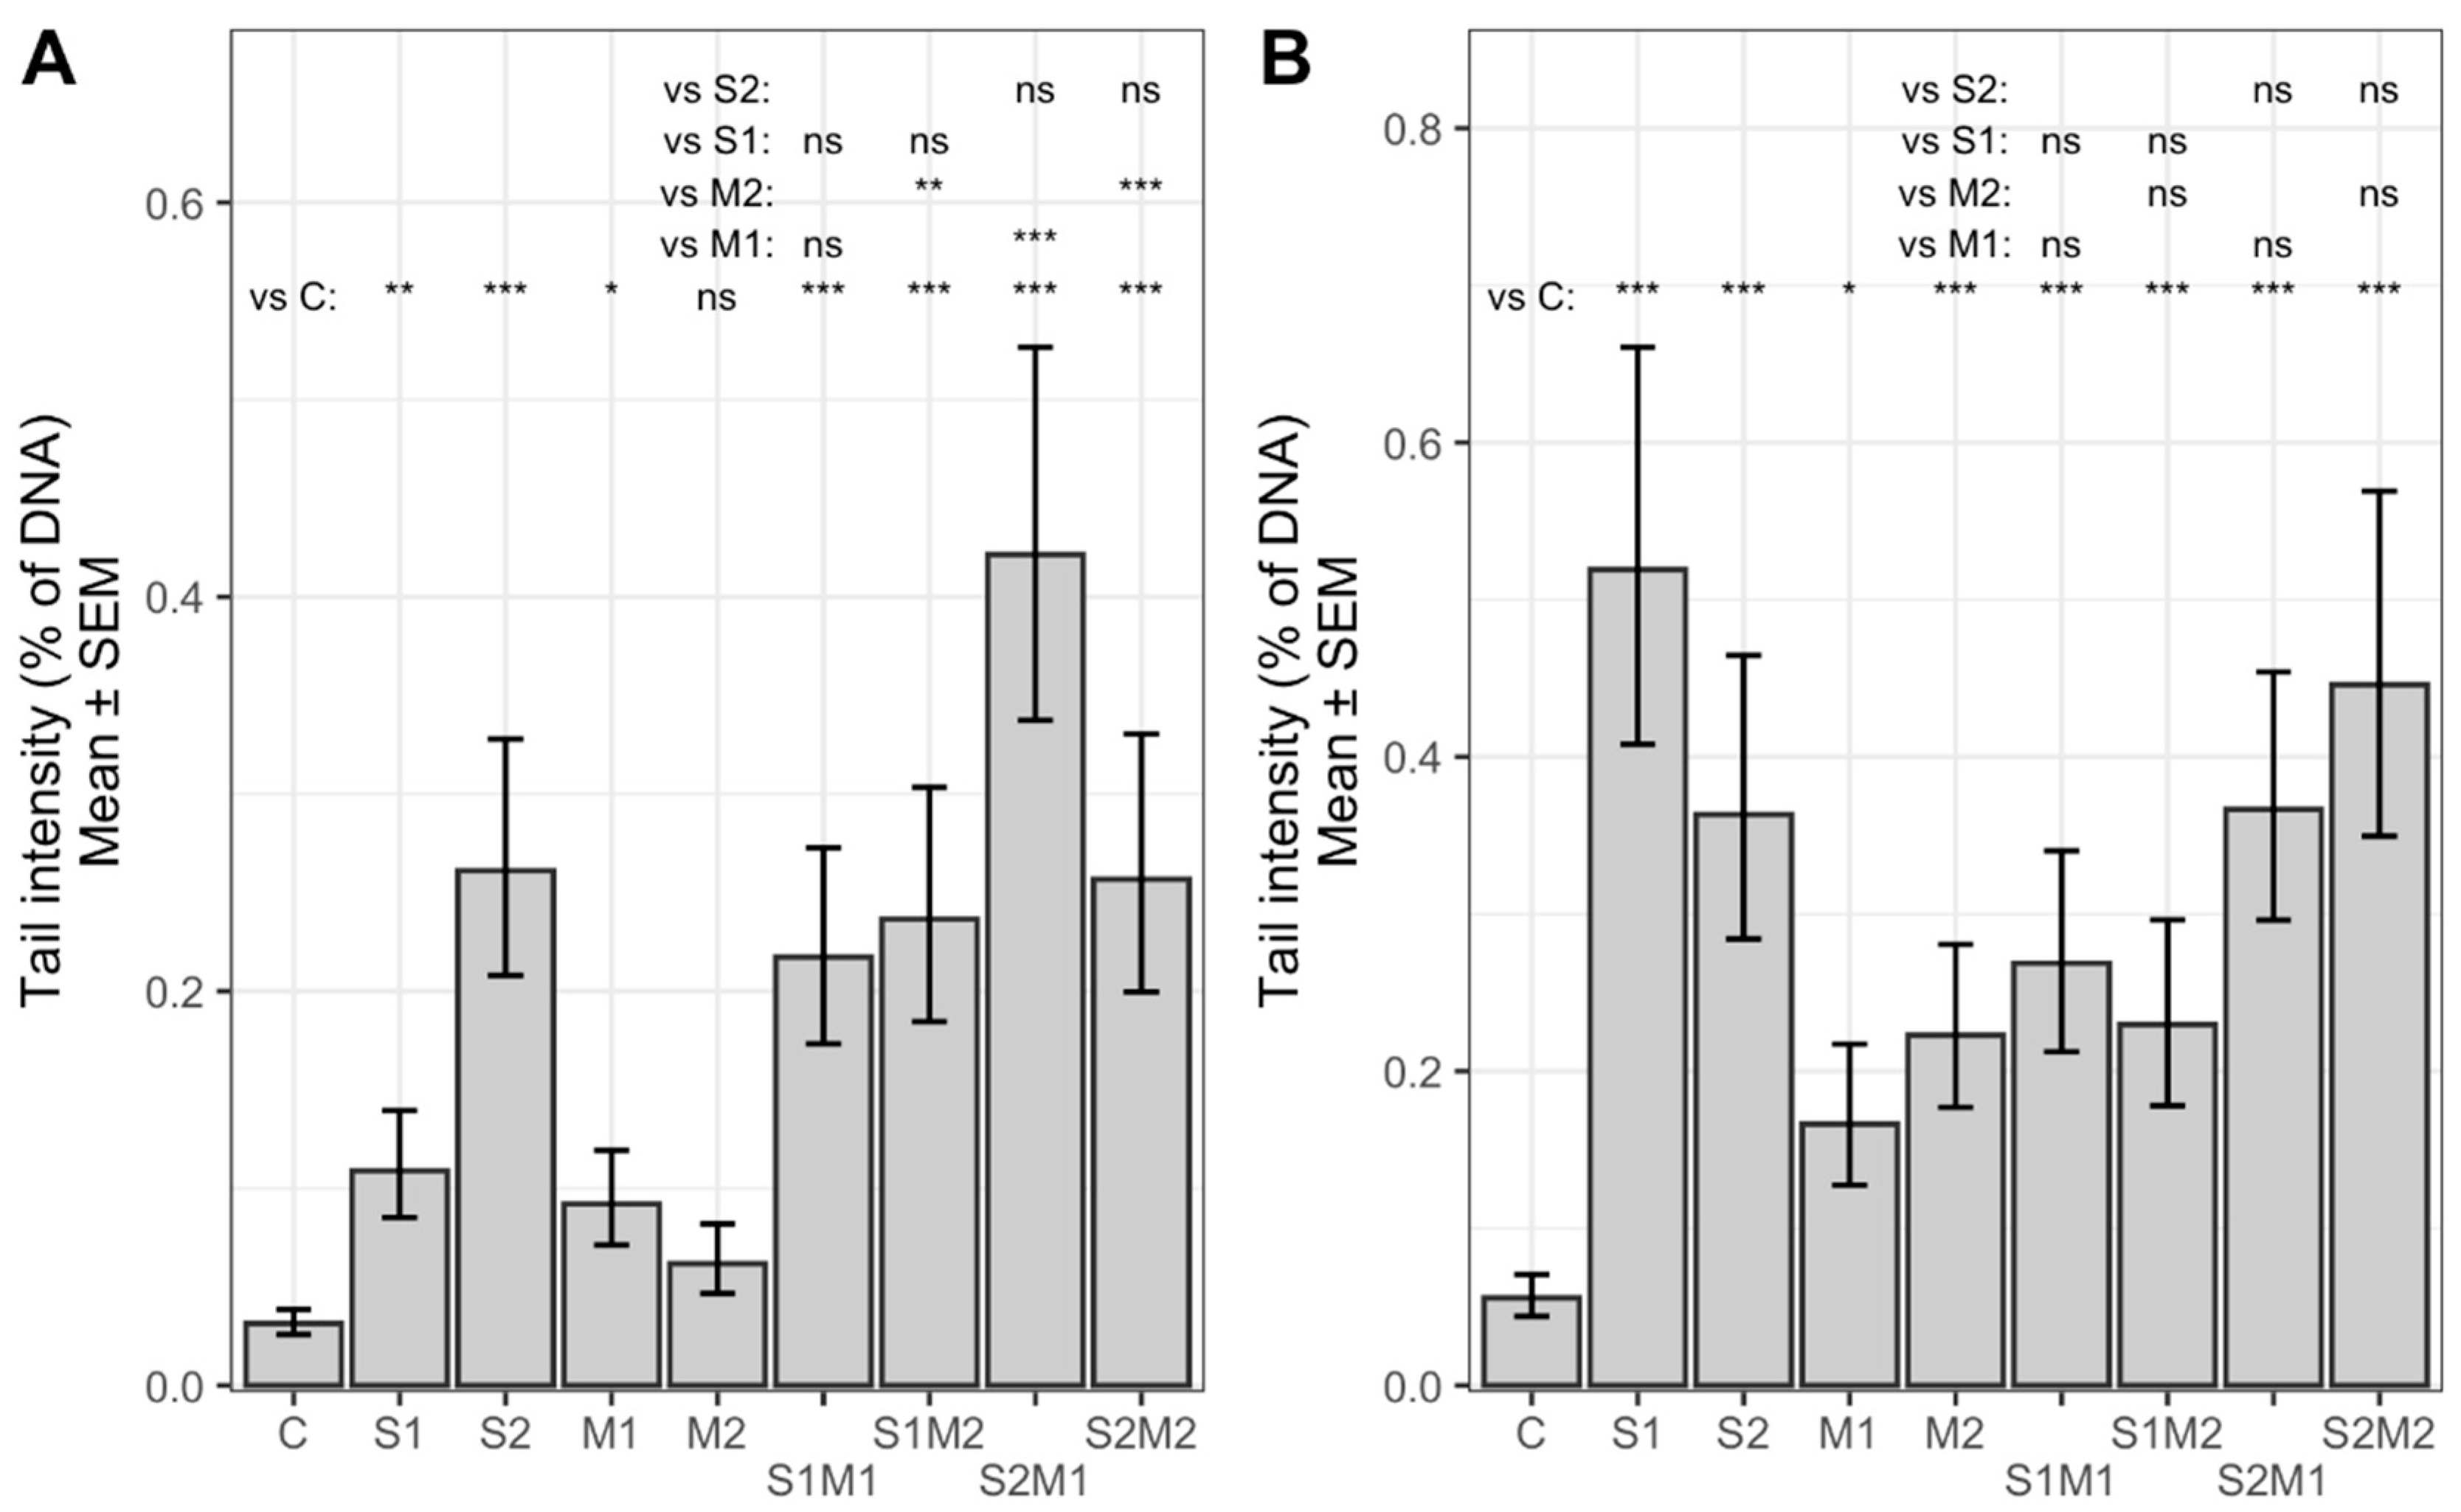
2.2. Genotoxicity
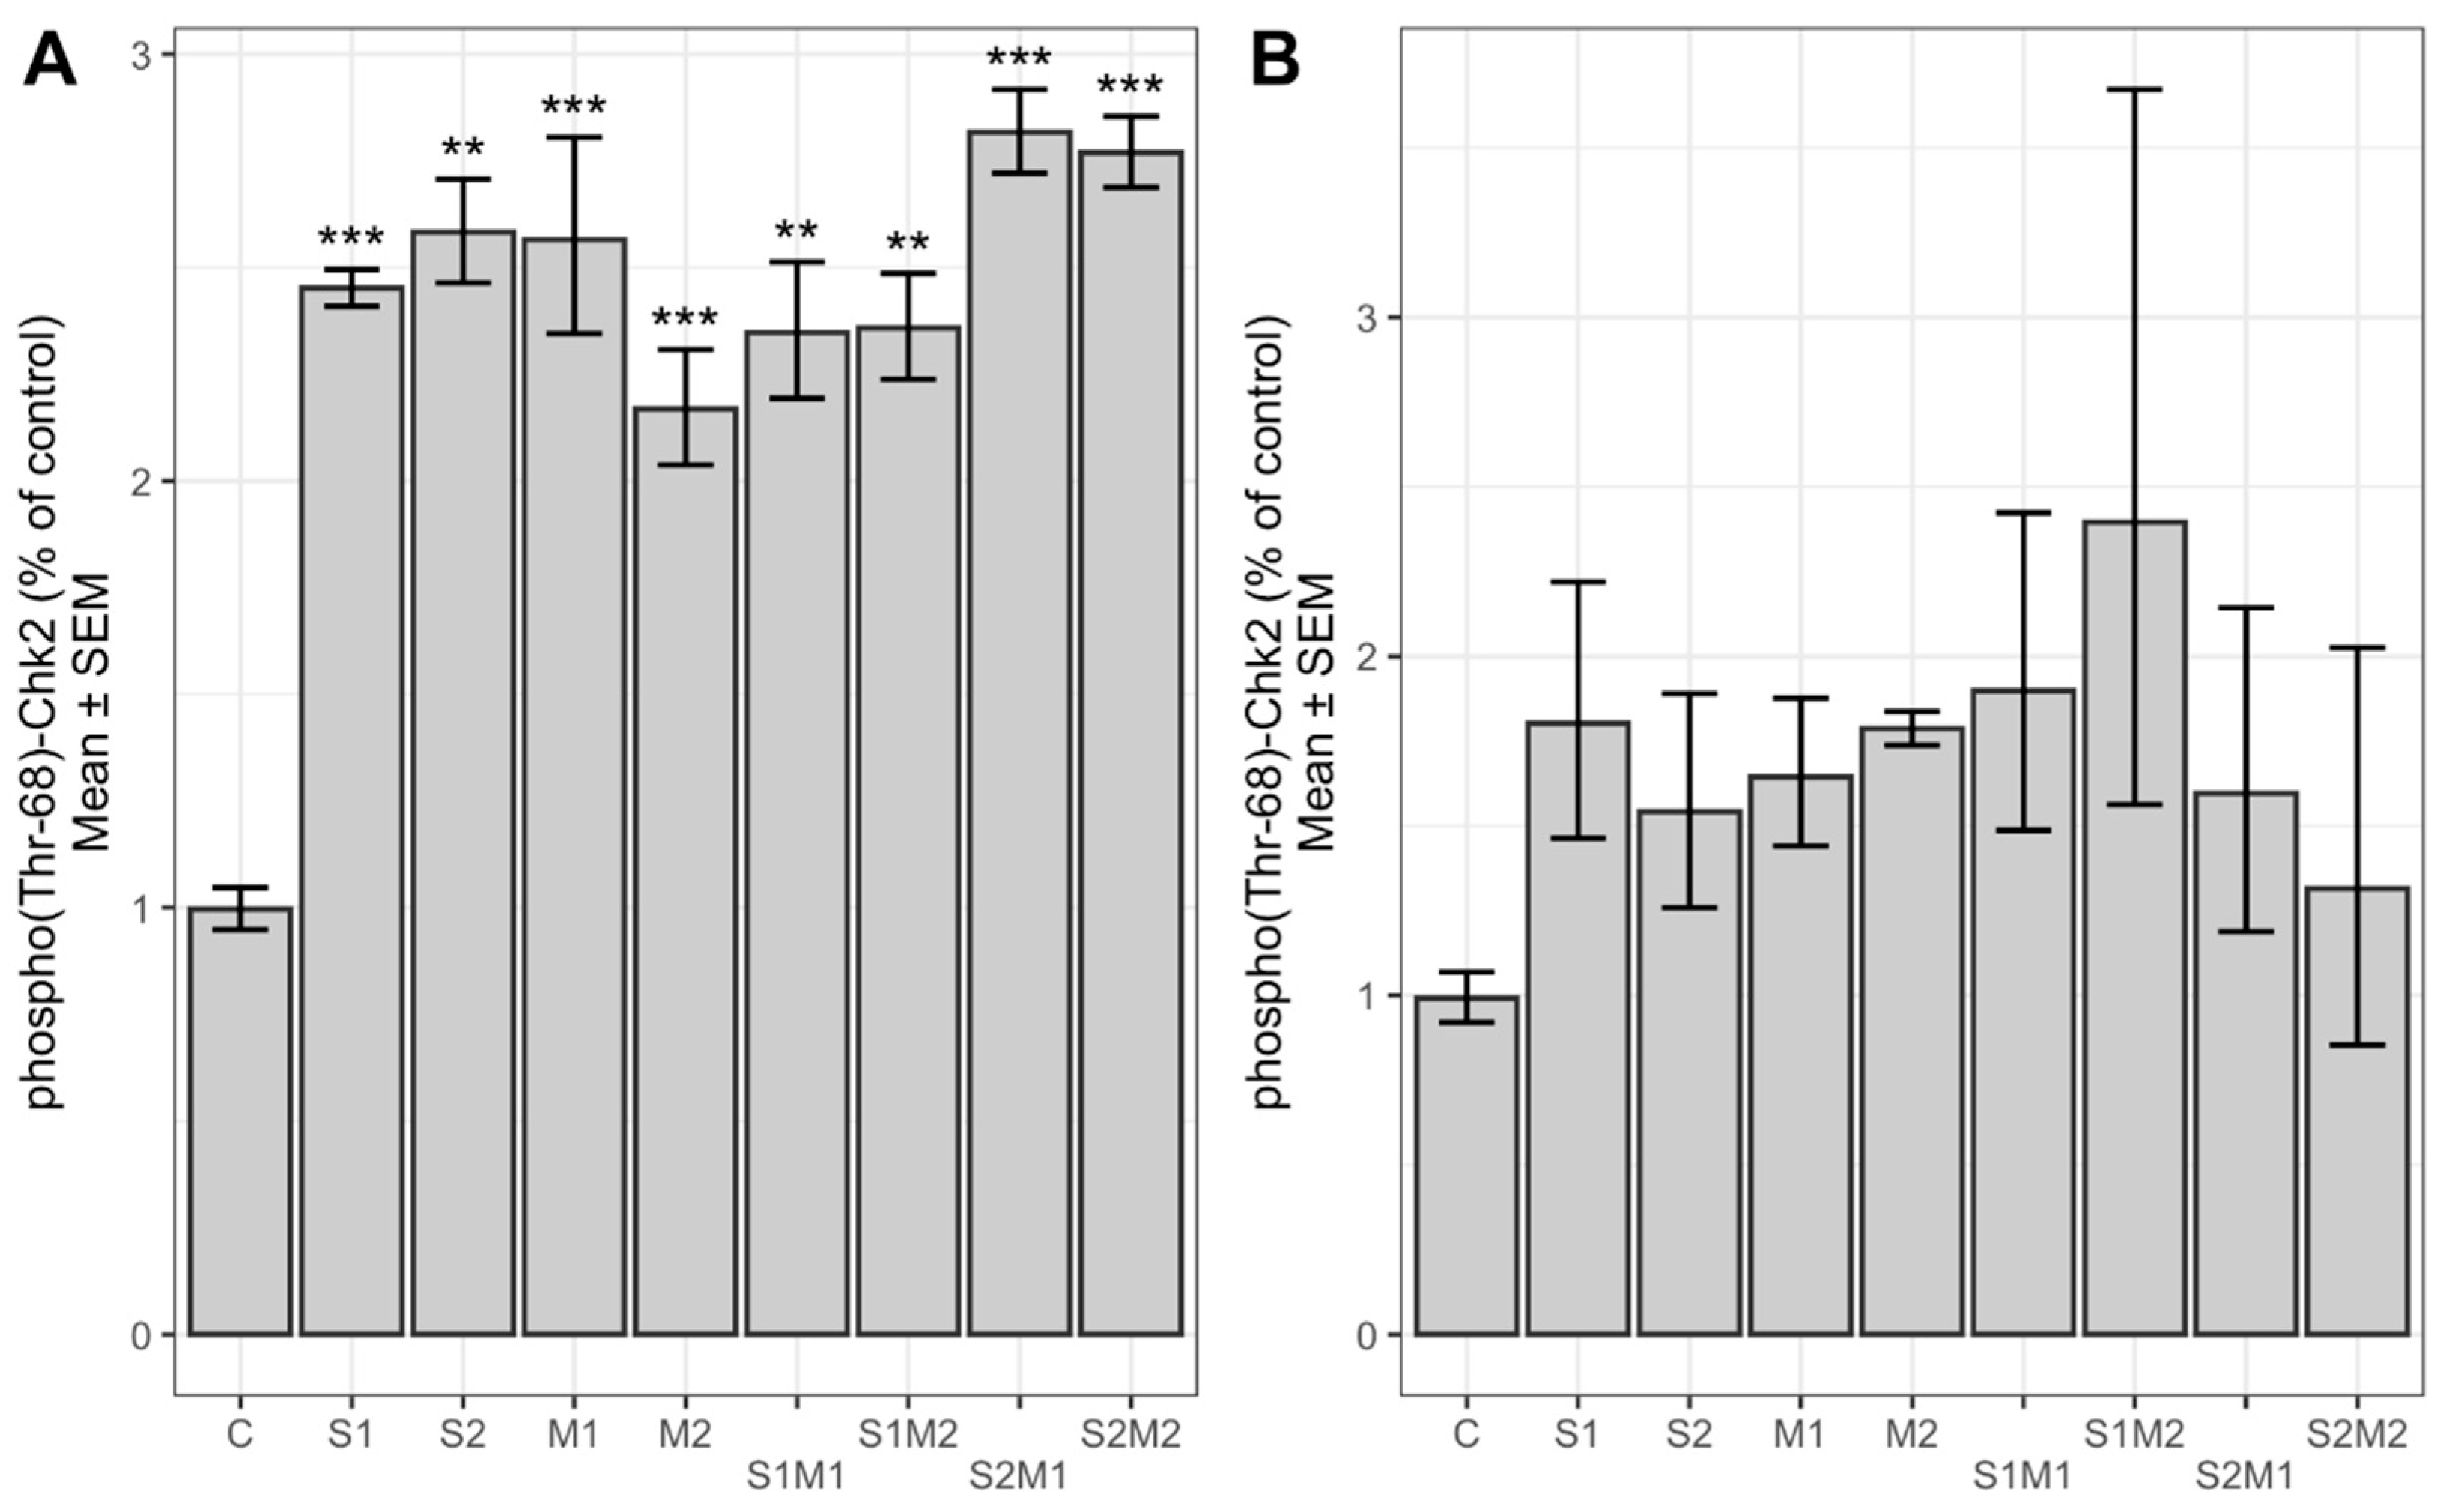
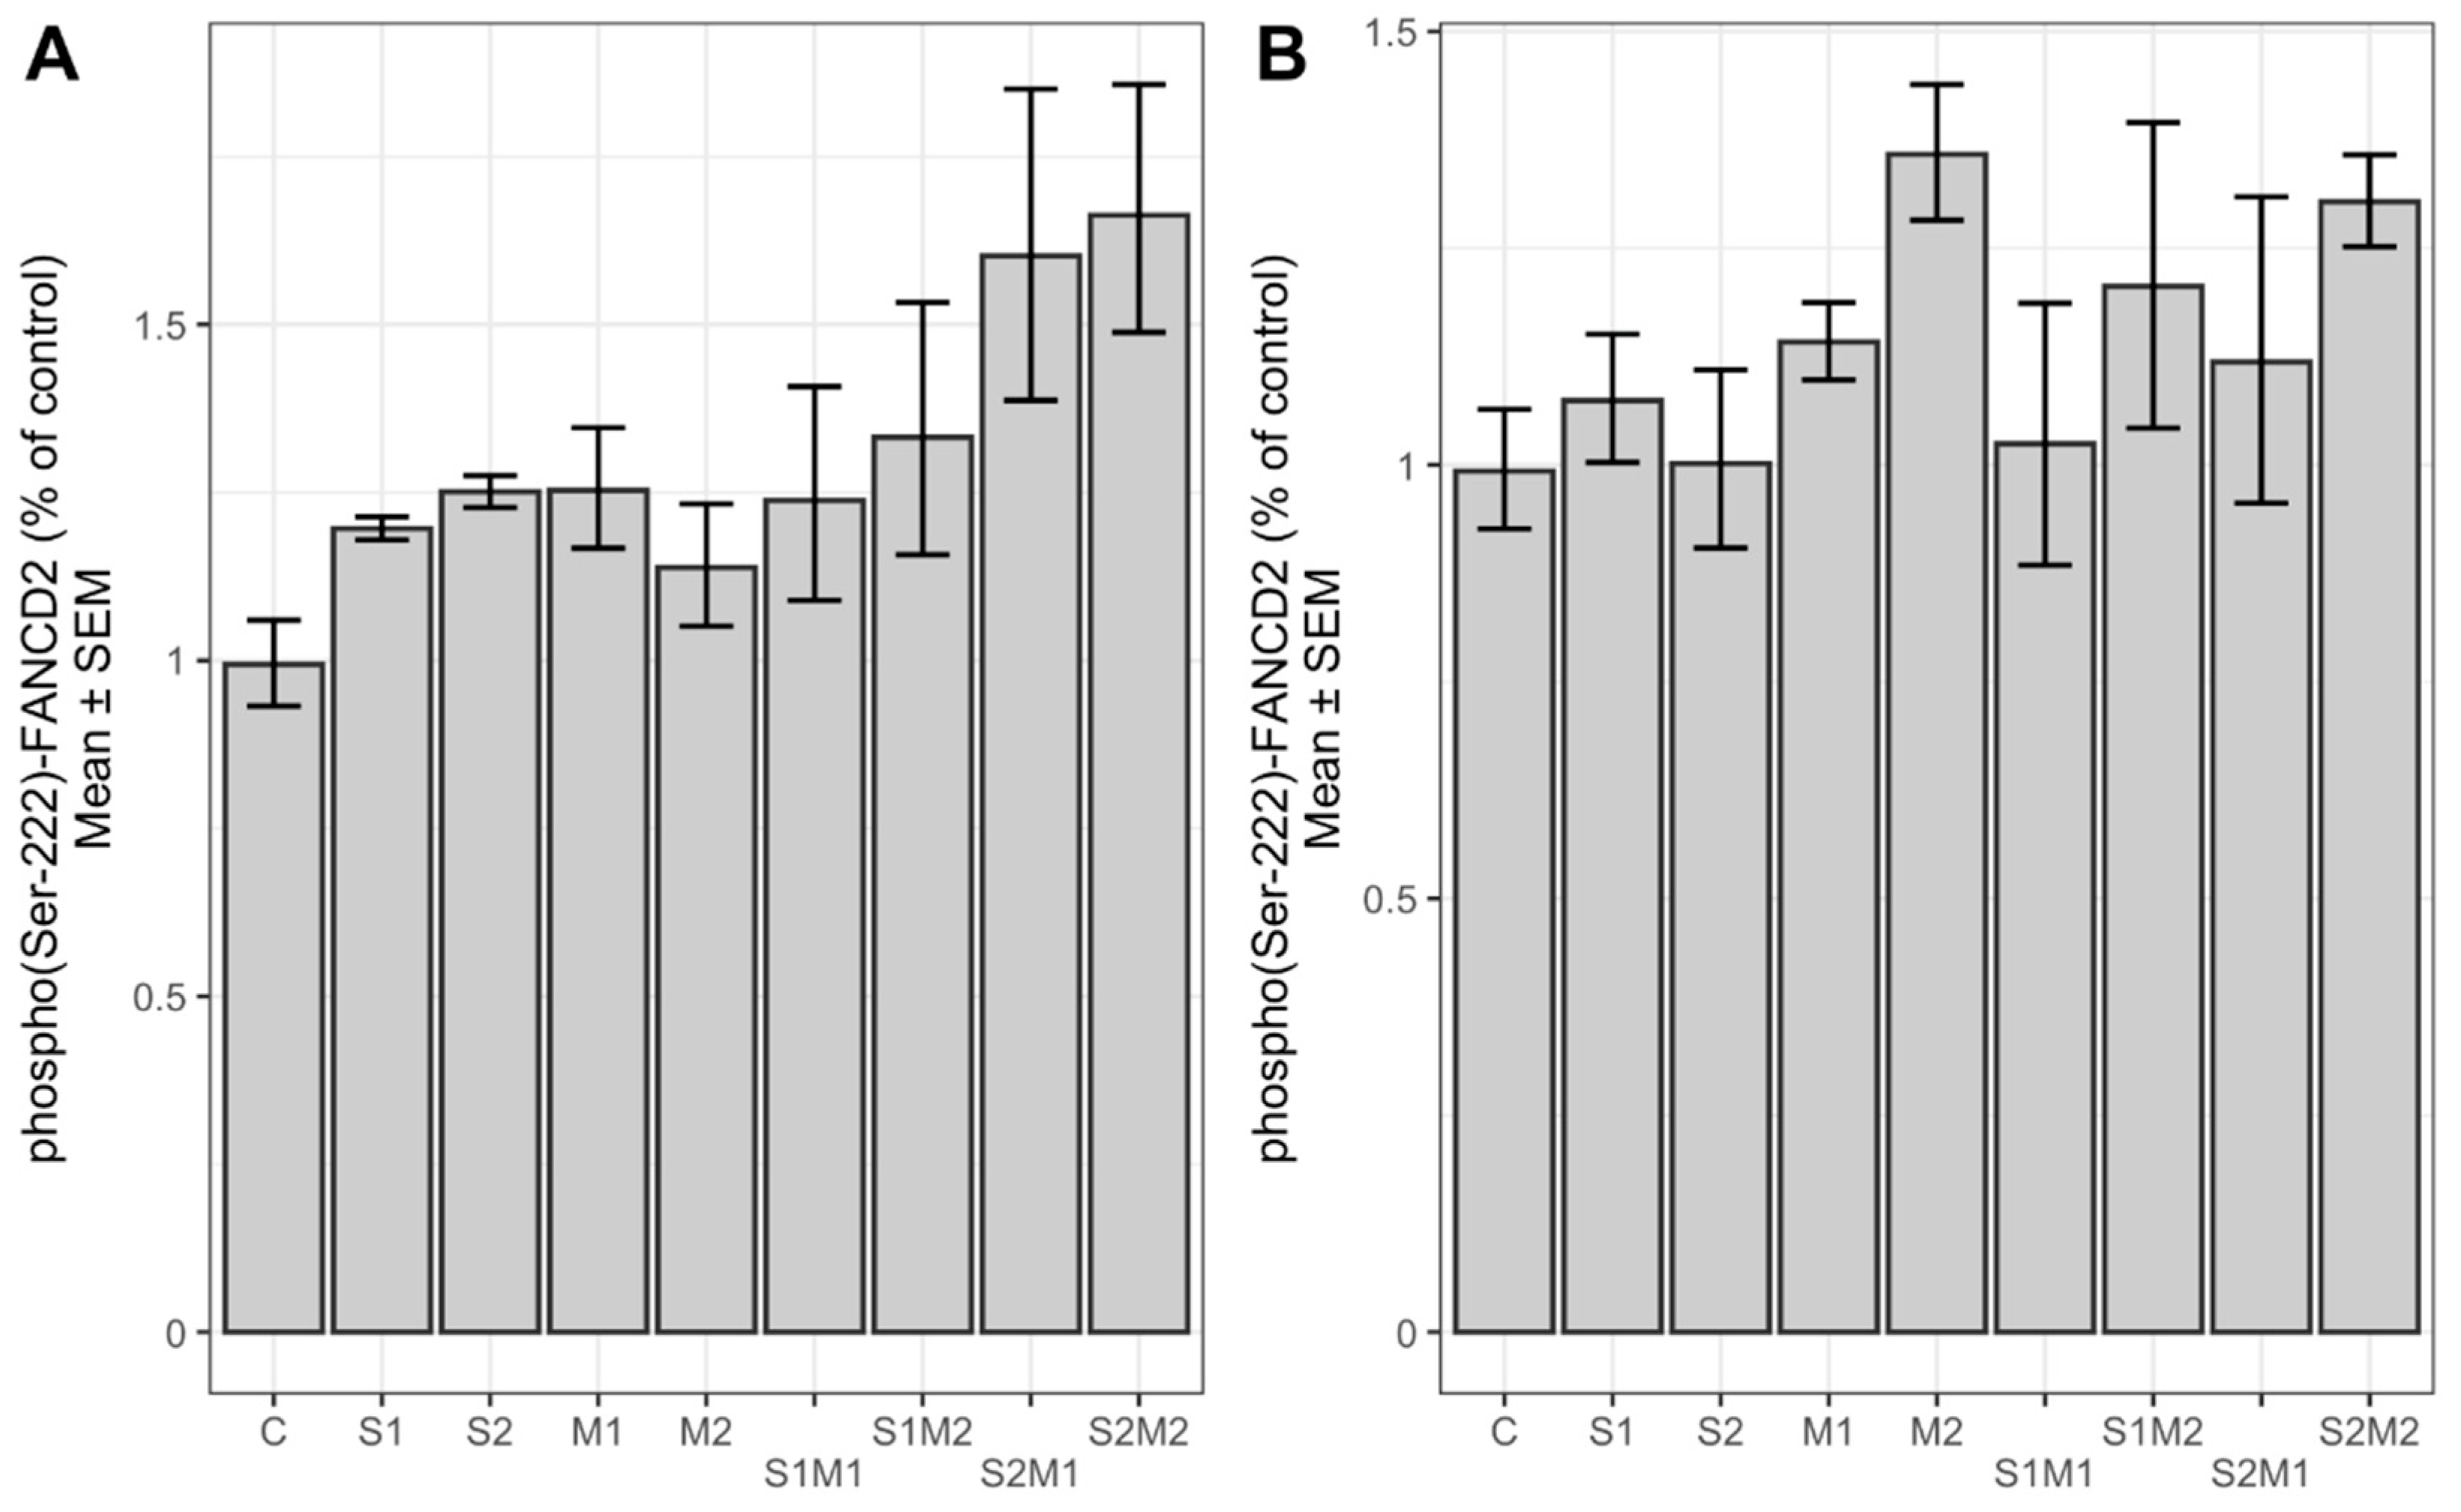
2.3. Determination of Relative Chk2 and FANCD2 Phosphorylation and Protein Expression Level
3. Discussion
4. Conclusions
5. Materials and Methods
5.1. Cell Cultures
5.2. MTT Proliferation Assay
5.3. Alkaline Comet Assay
5.4. Colorimetric Cell-Based ELISA
5.5. Statistical Analysis
Author Contributions
Funding
Institutional Review Board Statement
Informed Consent Statement
Data Availability Statement
Acknowledgments
Conflicts of Interest
References
- Engelhart, S.; Loock, A.; Skutlarek, D.; Sagunski, H.; Lommel, A.; Färber, H.; Exner, M. Occurrence of Toxigenic Aspergillus Versicolor Isolates and Sterigmatocystin in Carpet Dust from Damp Indoor Environments. Appl. Environ. Microbiol. 2002, 68, 3886–3890. [Google Scholar] [CrossRef] [Green Version]
- Jakšić Despot, D.; Kocsubé, S.; Bencsik, O.; Kecskeméti, A.; Szekeres, A.; Vágvölgyi, C.; Varga, J.; Šegvić Klarić, M. New Sterigmatocystin-Producing Species of Aspergillus Section Versicolores from Indoor Air in Croatia. Mycol. Prog. 2017, 16, 63–72. [Google Scholar] [CrossRef]
- Jakšić Despot, D.; Kocsubé, S.; Bencsik, O.; Kecskeméti, A.; Szekeres, A.; Vágvölgyi, C.; Varga, J.; Šegvić Klarić, M. Species Diversity and Cytotoxic Potency of Airborne Sterigmatocystin-Producing Aspergilli from the Section Versicolores. Sci. Total Environ. 2016, 562, 296–304. [Google Scholar] [CrossRef] [PubMed]
- Micheluz, A.; Sulyok, M.; Manente, S.; Krska, R.; Varese, G.C.; Ravagnan, G. Fungal Secondary Metabolite Analysis Applied to Cultural Heritage: The Case of a Contaminated Library in Venice. World Mycotoxin J. 2016, 9, 397–407. [Google Scholar] [CrossRef] [Green Version]
- EFSA Scientific Opinion on the Risk for Public and Animal Health Related to the Presence of Sterigmatocystin in Food and Feed. EFSA J. 2013, 11, 1–81. [CrossRef]
- Segvić Klaric, M.; Jaksic, D.; Kocsube, S.; Kifer, D.; Sulyok, M.; Jelic, D.; Sarkanj, B. Post-Flood Indoor Occurrence of Toxigenic Aspergilli from the Versicolores Clade: Is It Dangerous? Rom. J. Lab. Med. 2018, 26, S12–S13. [Google Scholar]
- Nielsen, K.F.; Gravesen, S.; Nielsen, P.A.; Andersen, B.; Thrane, U.; Frisvad, J.C. Production of Mycotoxins on Artificially and Naturally Infested Building Materials. Mycopathologia 1999, 145, 56. [Google Scholar] [CrossRef] [PubMed] [Green Version]
- Park, J.H.; Sulyok, M.; Lemons, A.R.; Green, B.J.; Cox-Ganser, J.M. Characterization of Fungi in Office Dust: Comparing Results of Microbial Secondary Metabolites, Fungal Internal Transcribed Spacer Region Sequencing, Viable Culture and Other Microbial Indices. Indoor Air 2018, 28, 708–720. [Google Scholar] [CrossRef]
- Díaz Nieto, C.H.; Granero, A.M.; Zon, M.A.; Fernández, H. Sterigmatocystin: A Mycotoxin to Be Seriously Considered. Food Chem. Toxicol. 2018, 118, 460–470. [Google Scholar] [CrossRef]
- Zheng, R.; Xu, H.; Wang, W.; Zhan, R.; Chen, W. Simultaneous Determination of Aflatoxin B1, B2, G1, G2, Ochratoxin A, and Sterigmatocystin in Traditional Chinese Medicines by LC-MS-MS. Anal. Bioanal. Chem. 2014, 406, 3031–3039. [Google Scholar] [CrossRef]
- International Agency for Research on Cancer (IARC). IARC Monographs on the Evaluation of Carcinogenic Risk of Chemicals to Man; IARC Press: Lyon, France, 1976; Volume 10, pp. 245–251. [Google Scholar]
- Gao, W.; Jiang, L.; Ge, L.; Chen, M.; Geng, C.; Yang, G.; Li, Q.; Ji, F.; Yan, Q.; Zou, Y.; et al. Sterigmatocystin-Induced Oxidative DNA Damage in Human Liver-Derived Cell Line through Lysosomal Damage. Toxicol. In Vitro 2015, 29, 1–7. [Google Scholar] [CrossRef]
- Wang, J.; Huang, S.; Xing, L.; Shen, H.; Yan, X.; Wang, J.; Zhang, X. Role of HMLH1 in Sterigmatocystin-Induced G2 Phase Arrest in Human Esophageal Epithelial Het-1A Cells In Vitro. Toxicol. Lett. 2013, 217, 226–234. [Google Scholar] [CrossRef] [PubMed]
- Huang, S.; Wang, J.; Xing, L.; Shen, H.; Yan, X.; Wang, J.; Zhang, X. Impairment of Cell Cycle Progression by Sterigmatocystin in Human Pulmonary Cells In Vitro. Food Chem. Toxicol. 2014, 66, 89–95. [Google Scholar] [CrossRef] [PubMed]
- Cabaret, O.; Puel, O.; Botterel, F.; Pean, M.; Khoufache, K.; Costa, J.M.; Delaforge, M.; Bretagne, S. Metabolic Detoxication Pathways for Sterigmatocystin in Primary Tracheal Epithelial Cells. Chem. Res. Toxicol. 2010, 23, 1673–1681. [Google Scholar] [CrossRef] [PubMed]
- Mori, H.; Sugie, S.; Yoshimi, N.; Kitamura, J.; Niwa, M.; Hamasaki, T.; Kawai, K. Genotoxic Effects of a Variety of Sterigmatocystin-Related Compounds in the Hepatocyte/DNA-Repair Test and the Salmonella Microsome Assay. Mutat. Res. Lett. 1986, 173, 217–222. [Google Scholar] [CrossRef]
- Jakšić, D.; Puel, O.; Canlet, C.; Kopjar, N.; Kosalec, I.; Klarić, M.S. Cytotoxicity and Genotoxicity of Versicolorins and 5-Methoxysterigmatocystin in A549 Cells. Arch. Toxicol. 2012, 86, 1583–1591. [Google Scholar] [CrossRef]
- Kifer, D.; Jakšić, D.; Šegvić Klarić, M. Assessing the Effect of Mycotoxin Combinations: Which Mathematical Model Is (the Most) Appropriate? Toxins 2020, 12, 153. [Google Scholar] [CrossRef] [Green Version]
- Zannini, L.; Delia, D.; Buscemi, G. CHK2 Kinase in the DNA Damage Response and Beyond. J. Mol. Cell Biol. 2014, 6, 442–457. [Google Scholar] [CrossRef] [PubMed] [Green Version]
- Shiloh, Y.; Ziv, Y. The ATM Protein Kinase: Regulating the Cellular Response to Genotoxic Stress, and More. Nat. Rev. Mol. Cell Biol. 2013, 14, 197–210. [Google Scholar] [CrossRef]
- Shang, Z.F.; Huang, B.; Xu, Q.Z.; Zhang, S.M.; Fan, R.; Liu, X.D.; Wang, Y.; Zhou, P.K. Inactivation of DNA-Dependent Protein Kinase Leads to Spindle Disruption and Mitotic Catastrophe with Attenuated Checkpoint Protein 2 Phosphorylation in Response to DNA Damage. Cancer Res. 2010, 70, 3657–3666. [Google Scholar] [CrossRef] [PubMed] [Green Version]
- Moldovan, G.L.; D’Andrea, A.D. How the Fanconi Anemia Pathway Guards the Genome. Annu. Rev. Genet. 2009, 43, 223–249. [Google Scholar] [CrossRef] [Green Version]
- Nepal, M.; Che, R.; Ma, C.; Zhang, J.; Fei, P. FANCD2 and DNA Damage. Int. J. Mol. Sci. 2017, 18, 1804. [Google Scholar] [CrossRef]
- Bartek, J.; Lukas, C.; Lukas, J. Checking on DNA Damage in S Phase. Nat. Rev. Mol. Cell Biol. 2004, 5, 792–804. [Google Scholar] [CrossRef]
- Shaltiel, I.A.; Krenning, L.; Bruinsma, W.; Medema, R.H. The Same, Only Different—DNA Damage Checkpoints and Their Reversal throughout the Cell Cycle. J. Cell Sci. 2015, 128, 607–620. [Google Scholar] [CrossRef] [Green Version]
- Chou, T.-C. Theoretical Basis, Experimental Design, and Computerized Simulation of Synergism and Antagonism in Drug Combination Studies. Pharmacol. Rev. 2006, 58, 621–681. [Google Scholar] [CrossRef]
- Anastasiadi, M.; Polizzi, K.; Lambert, R.J.W. An Improved Model for the Analysis of Combined Antimicrobials: A Replacement for the Chou-Talalay Combination Index Method. J. Appl. Microbiol. 2018, 124, 97–107. [Google Scholar] [CrossRef] [Green Version]
- Cui, J.; Wang, J.; Huang, S.; Jiang, X.; Li, Y.; Wu, W.; Zhang, X. Sterigmatocystin Induced Apoptosis in Human Pulmonary Cells in Vitro. Exp. Toxicol. Pathol. 2017, 69, 695–699. [Google Scholar] [CrossRef]
- Zhang, Y.; Yao, Z.G.; Wang, J.; Xing, L.X.; Xia, Y.; Zhang, X.H. Effects of Sterigmatocystin on TNF-α, IL-6 and IL-12 Expression in Murine Peripheral Blood Mononuclear Cells and Peritoneal Macrophages in Vivo. Mol. Med. Rep. 2012, 5, 1318–1322. [Google Scholar] [CrossRef] [PubMed] [Green Version]
- Jakšić, D.; Šegvić Klarić, M.; Crnolatac, I.; Vujičić, N.Š.; Smrečki, V.; Górecki, M.; Pescitelli, G.; Piantanida, I. Unique Aggregation of Sterigmatocystin in Water Yields Strong and Specific Circular Dichroism Response Allowing Highly Sensitive and Selective Monitoring of Bio-Relevant Interactions. Mar. Drugs 2019, 17, 629. [Google Scholar] [CrossRef] [PubMed] [Green Version]
- Collins, A.R.; Oscoz, A.A.; Brunborg, G.; Gaivão, I.; Giovannelli, L.; Kruszewski, M.; Smith, C.C.; Stetina, R. The Comet Assay: Topical Issues. Mutagenesis 2008, 23, 143–151. [Google Scholar] [CrossRef] [PubMed]
- Collins, A.R. The Comet Assay for DNA Damage and Repair: Principles, Applications, and Limitations. Mol. Biotechnol. 2004, 26, 249–261. [Google Scholar] [CrossRef]
- Zou, L.; Elledge, S.J. Sensing DNA Damage through ATRIP Recognition of RPA-SsDNA Complexes. Science 2003, 300, 1542–1548. [Google Scholar] [CrossRef] [PubMed] [Green Version]
- Matsouka, S.; Huang, M.; Elledge, S.J. Linkage of ATM to Cell Cycle Regulation by the Chk2 Protein Kinase. Science 1998, 282, 1893–1897. [Google Scholar] [CrossRef]
- Takizawa, C.G.; Morgan, D.O. Control of Mitosis by Changes in the Subcellular Location of Cyclin-B1-Cdk1 and Cdc25C. Curr. Opin. Cell Biol. 2000, 12, 658–665. [Google Scholar] [CrossRef]
- Stevens, C.; Smith, L.; La Thangue, N.B. Chk2 Activates E2F-1 in Response to DNA Damage. Nat. Cell Biol. 2003, 5, 401–409. [Google Scholar] [CrossRef] [PubMed]
- Cheng, Q.; Chen, J. Mechanism of P53 Stabilization by ATM after DNA Damage. Cell Cycle 2010, 9, 472–478. [Google Scholar] [CrossRef] [Green Version]
- Zhang, D.; Cui, Y.; Shen, H.; Xing, L.; Cui, J.; Wang, J.; Zhang, X. Sterigmatocystin-Induced DNA Damage Triggers G2 Arrest via an ATM/P53-Related Pathway in Human Gastric Epithelium GES-1 Cells In Vitro. PLoS ONE 2013, 8. [Google Scholar] [CrossRef] [PubMed]
- Jiang, X.; Wang, J.; Xing, L.; Shen, H.; Lian, W.; Yi, L.; Zhang, D.; Yang, H.; Liu, J.; Zhang, X. Sterigmatocystin-Induced Checkpoint Adaptation Depends on Chk1 in Immortalized Human Gastric Epithelial Cells in Vitro. Arch. Toxicol. 2017, 91, 259–270. [Google Scholar] [CrossRef]
- Fei, P.; Yin, J.; Wang, W. New Advances in the DNA Damage Response Network of Fanconi Anemia and BRCA Proteins: FAAP95 Replaces BRCA2 as the True FANCB Protein. Cell Cycle 2005, 4, 80–86. [Google Scholar] [CrossRef]
- Kim, H.; D’Andrea, A.D. Regulation of DNA Cross-Link Repair by the Fanconi Anemia/BRCA Pathway. Genes Dev. 2012, 26, 1393–1408. [Google Scholar] [CrossRef] [Green Version]
- Shen, C.; Houghton, P.J. Targeting FANCD2 for Therapy Sensitization. Oncotarget 2014, 5, 3426–3427. [Google Scholar] [CrossRef] [PubMed]
- Singh, N.P.; McCoy, M.T.; Tice, R.R.; Schneider, E.L. A Simple Technique for Quantitation of Low Levels of DNA Damage in Individual Cells. Exp. Cell Res. 1988, 175, 184–191. [Google Scholar] [CrossRef] [Green Version]
- Ritz, C.; Baty, F.; Streibig, J.C.; Gerhard, D. Dose-Response Analysis Using R. PLoS ONE 2015, 10, e0146021. [Google Scholar] [CrossRef] [Green Version]
- Viechtbauer, W. Conducting Meta-Analyses in R with the Metafor Package. J. Stat. Softw. 2010, 36. [Google Scholar] [CrossRef] [Green Version]
- R Core Team. R Core Team R: A Language and Environment for Statistical Computing; R Foundation for Statistical Computing: Vienna, Austria, 2020. [Google Scholar]


| Cell Line | Concentrations (µM) | Cell Viability (%) ± SD | |
|---|---|---|---|
| STC | 5-M-STC | ||
| HepG2 | 0.1 0.3 1 3 10 30 60 100 150 | 100 ± 1.9 106 ± 1.7 90 ± 1.9 64 ± 1.2 45 ± 0.8 25 ± 0.4 24 ± 0.3 18 ± 0.6 26 ± 1.0 | 80 ± 2.1 60 ± 1.8 45 ± 0.8 39 ± 0.8 31 ± 0.5 27 ± 0.6 25 ± 0.2 20 ± 0.4 20 ± 0.6 |
| A549 | 0.1 0.3 1 3 10 12 30 60 100 150 | 88 ± 0.6 85 ± 0.5 79 ± 1.0 84 ± 0.4 61 ± 0.7 61 ± 0.8 51 ± 0.7 46 ± 0.4 40 ± 1.0 45 ± 0.3 | 96 ± 1.0 88 ± 0.7 94 ± 0.6 77 ± 1.0 40 ± 0.3 n.t. 38 ± 0.5 32 ± 0.7 31 ± 1.3 21 ± 0.3 |
| Cell Line | IC50 (STC) μM ± SEM | IC50 (5-M-STC) μM ± SEM |
|---|---|---|
| HepG2 | 7.0 ± 1.3 | 0.7 ± 1.3 |
| A549 * | 60.0 ± 1.8 | 5.5 ± 1.2 |
| Cell Line | Mixture Ratio 5-M-STC:STC | IC50 Mean ± SEM |
|---|---|---|
| HepG2 | 1:1 1:2 2:1 | 0.7 ± 1.4 0.6 ± 27.8 0.4 ± 69.4 |
| A549 * | 1:1 1:2 2:1 | 2.1 ± 246.7 1.7 ± 726.6 * 5.3 ± 247545 * |
Publisher’s Note: MDPI stays neutral with regard to jurisdictional claims in published maps and institutional affiliations. |
© 2021 by the authors. Licensee MDPI, Basel, Switzerland. This article is an open access article distributed under the terms and conditions of the Creative Commons Attribution (CC BY) license (https://creativecommons.org/licenses/by/4.0/).
Share and Cite
Dabelić, S.; Kifer, D.; Jakšić, D.; Kopjar, N.; Klarić, M.Š. Sterigmatocystin, 5-Methoxysterigmatocistin, and Their Combinations are Cytotoxic and Genotoxic to A549 and HepG2 Cells and Provoke Phosphorylation of Chk2, but not FANCD2 Checkpoint Proteins. Toxins 2021, 13, 464. https://0-doi-org.brum.beds.ac.uk/10.3390/toxins13070464
Dabelić S, Kifer D, Jakšić D, Kopjar N, Klarić MŠ. Sterigmatocystin, 5-Methoxysterigmatocistin, and Their Combinations are Cytotoxic and Genotoxic to A549 and HepG2 Cells and Provoke Phosphorylation of Chk2, but not FANCD2 Checkpoint Proteins. Toxins. 2021; 13(7):464. https://0-doi-org.brum.beds.ac.uk/10.3390/toxins13070464
Chicago/Turabian StyleDabelić, Sanja, Domagoj Kifer, Daniela Jakšić, Nevenka Kopjar, and Maja Šegvić Klarić. 2021. "Sterigmatocystin, 5-Methoxysterigmatocistin, and Their Combinations are Cytotoxic and Genotoxic to A549 and HepG2 Cells and Provoke Phosphorylation of Chk2, but not FANCD2 Checkpoint Proteins" Toxins 13, no. 7: 464. https://0-doi-org.brum.beds.ac.uk/10.3390/toxins13070464