Article

Scalable Reporter Assays to Analyze the Regulation of stx2 Expression in Shiga Toxin-Producing Enteropathogens

by
Martin B. Koeppel
1,2,*,
Jana Glaser
1,2,
Tobias Baumgartner
1,2,
Stefanie Spriewald
1,2,
Roman G. Gerlach
3,
Benedikt von Armansperg
1,2,
John M. Leong
4 and
Bärbel Stecher
1,2,*
1
Max-von-Pettenkofer Institute, LMU Munich, Pettenkoferstr. 9a, 80336 Munich, Germany
2
German Center for Infection Research (DZIF), Partner Site LMU Munich, 80336 Munich, Germany
3
Mikrobiologisches Institut-Klinische Mikrobiologie, Immunologie und Hygiene, Universitätsklinikum Erlangen and Friedrich-Alexander-Universität (FAU) Erlangen-Nürnberg, Wasserturmstraße 3/5, 91054 Erlangen, Germany
4
Department of Molecular Biology and Microbiology, Tufts University School of Medicine, 136 Harrison Ave, Boston, MA 02111, USA
*
Authors to whom correspondence should be addressed.
Submission received: 9 June 2021 / Revised: 27 July 2021 / Accepted: 28 July 2021 / Published: 29 July 2021
(This article belongs to the Special Issue Escherichia coli Toxins and Intestinal Diseases)

Abstract

:
Stx2 is the major virulence factor of EHEC and is associated with an increased risk for HUS in infected patients. The conditions influencing its expression in the intestinal tract are largely unknown. For optimal management and treatment of infected patients, the identification of environmental conditions modulating Stx2 levels in the human gut is of central importance. In this study, we established a set of chromosomal stx2 reporter assays. One system is based on superfolder GFP (sfGFP) using a T7 polymerase/T7 promoter-based amplification loop. This reporter can be used to analyze stx2 expression at the single-cell level using FACSs and fluorescence microscopy. The other system is based on the cytosolic release of the Gaussia princeps luciferase (gluc). This latter reporter proves to be a highly sensitive and scalable reporter assay that can be used to quantify reporter protein in the culture supernatant. We envision that this new set of reporter tools will be highly useful to comprehensively analyze the influence of environmental and host factors, including drugs, small metabolites and the microbiota, on Stx2 release and thereby serve the identification of risk factors and new therapies in Stx-mediated pathologies.
Key Contribution: Development of scalable and well-characterized Shiga toxin reporter systems to be used in future medium–high-throughput drug screening assays.

1. Introduction

Infections with enterohemorrhagic E. coli (EHEC) can cause severe, food-borne disease and pose a significant problem to public health worldwide. The reservoir is mainly cattle, and large-scale EHEC infection outbreaks typically originate from the fecal contamination of vegetables or meat [1,2]. The disease is self-limiting in the majority of cases. Production of the Shiga toxins, Stx1 and Stx2, mediates bloody diarrhea and can cause hemolytic–uremic syndrome (HUS), a life-threatening complication of the infection in a fraction of the infected patients. The rate of EHEC-infected patients affected by HUS ranges between 5 and 30%, which appears to depend on the toxin type and other properties of the EHEC strain. Furthermore, a variety of risk factors for progression to HUS have been identified, including antibiotic treatment, elevated leukocyte count and bloody diarrhea [3,4].
Hitherto, therapy that can effectively prevent the onset of HUS is missing. Moreover, once the patient has progressed to HUS, therapy remains largely symptomatic, including supportive care such as fluid supplementation and plasmapheresis. Antibiotics can be used to treat EHEC infection, but the use of specific antibiotics is contraindicated, as application might stimulate toxin production and/or release [5,6]. A recent outbreak in Germany with 3842 affected patients was caused by a new variant of Stx2 producing E. coli (HUSEC O104:H4) [7]. In total, 855 HUS cases with a fatality rate of 4.1% were observed, once again highlighting the need for the development of novel drugs that block the action of Shiga toxins. Indeed, recent progress has been made in the identification of novel drugs, biologicals and vaccination approaches that inactivate Shiga toxin binding and its delivery into the target cell [8,9,10,11,12]. However, to date, evidence for clinical efficacy in patients is lacking. The amount of Stx2 released by EHEC in the gastrointestinal tract is critical for development of the systemic disease. Thus, application of drugs that interfere with stx expression or release by the pathogen could prevent Stx2 production in the first place.
Stx2 is an AB5 toxin composed of one catalytic subunit A and a pentamer of B subunits, which mediate binding to the Stx receptor globotriaosylceramide (Gb3). Subunit A is translocated into the cell where it eventually leads to a block of protein synthesis and host cell death [13,14]. After release from the pathogen into the gut lumen, Stx2 crosses the epithelial barrier and enters the blood stream via an unknown mechanism where it causes damage to Gb3+ renal endothelial cells [15]. Possibly, the intimate attachment of EHEC via attaching and effacing (A/E) lesions to the gut epithelium enhances the chance of Stx2 translocation. Strain HUSEC O104:H4 may attach even more efficiently by its aggregative adherence phenotype [16].
The genes for stx2AB are encoded within the late gene region of lambdoid prophages, which are integrated in the E. coli chromosome [17]. Stx2AB expression is strictly correlated with induction of the phage lytic cycle by the SOS response [18]. Therefore, DNA damaging agents, including UV radiation, hydrogen peroxide [19] and chemicals (e.g., mitomycin C), can initiate phage DNA replication, Stx2 production and bacterial lysis. Environmental factors that modulate stx2 expression in vivo are largely unknown. DNA-targeting antibiotics (e.g., quinolones) [20] and others, in particular at sub-inhibitory concentrations, can trigger Stx production [21,22]. Furthermore, quorum sensing, catabolite repression and stress affect stx2 regulation [23]. In the past, a number of small molecules that interfere with stx2 expression were characterized. LED209, a small molecule, blocks stx2 expression via inhibition of QseC-dependent quorum sensing [24]. Nowicki and colleagues showed that isothiocyanates have a repressive effect on prophage induction and Stx2 production [25]. Microbiota-derived metabolites, proteins and small molecules may also play a prominent role in modulating Shiga toxin production [26], representing an invaluable resource to be exploited in the future.
Reporter assays are highly useful to screen for inhibitors of toxin expression. EHEC strains require handling in high-containment biosafety level (BSL)-3** laboratories due to the presence of intact stx2AB genes. In most reporter strains, stx2 is replaced by the respective reporter gene. Therefore, inhibitor screens using stx2 reporters can be performed under BSL-2 conditions. In the past, various reporter systems have been employed to investigate the regulation of stx2 expression, including beta-galactosidase [21], alkaline phosphatase [27], photorhabdus luciferase [28], green fluorescent protein (gfp) [25] and selectable in vivo expression technology (SIVET) [29,30]. Although these reporter systems have been successfully used to study stx2 expression, they have certain limitations with respect to scalability, dynamic range and biological readout (e.g., toxin expression and/or release). EHEC strains require handling in high-containment biosafety level (BSL)-3 laboratories due to the presence of intact stx2AB genes. In reporter strains, stx2 is replaced by the respective reporter gene. Therefore, inhibitor screens using stx2 reporters can be performed under BSL-2 conditions.
In this study, we established two alternative stx2 reporter assays: one system is based on superfolder GFP (sfGFP) [31], using a T7 polymerase/T7 promoter-based amplification loop. This reporter can be used to analyze stx2 expression at the single-cell level using FACSs and fluorescence microscopy. The other system is based on the Gaussia princeps luciferase (gluc) [32]. This highly sensitive and scalable reporter assay can be used to quantify the reporter protein in the culture supernatant and thereby assess the influence of inhibitors on toxin expression and release.

2. Results

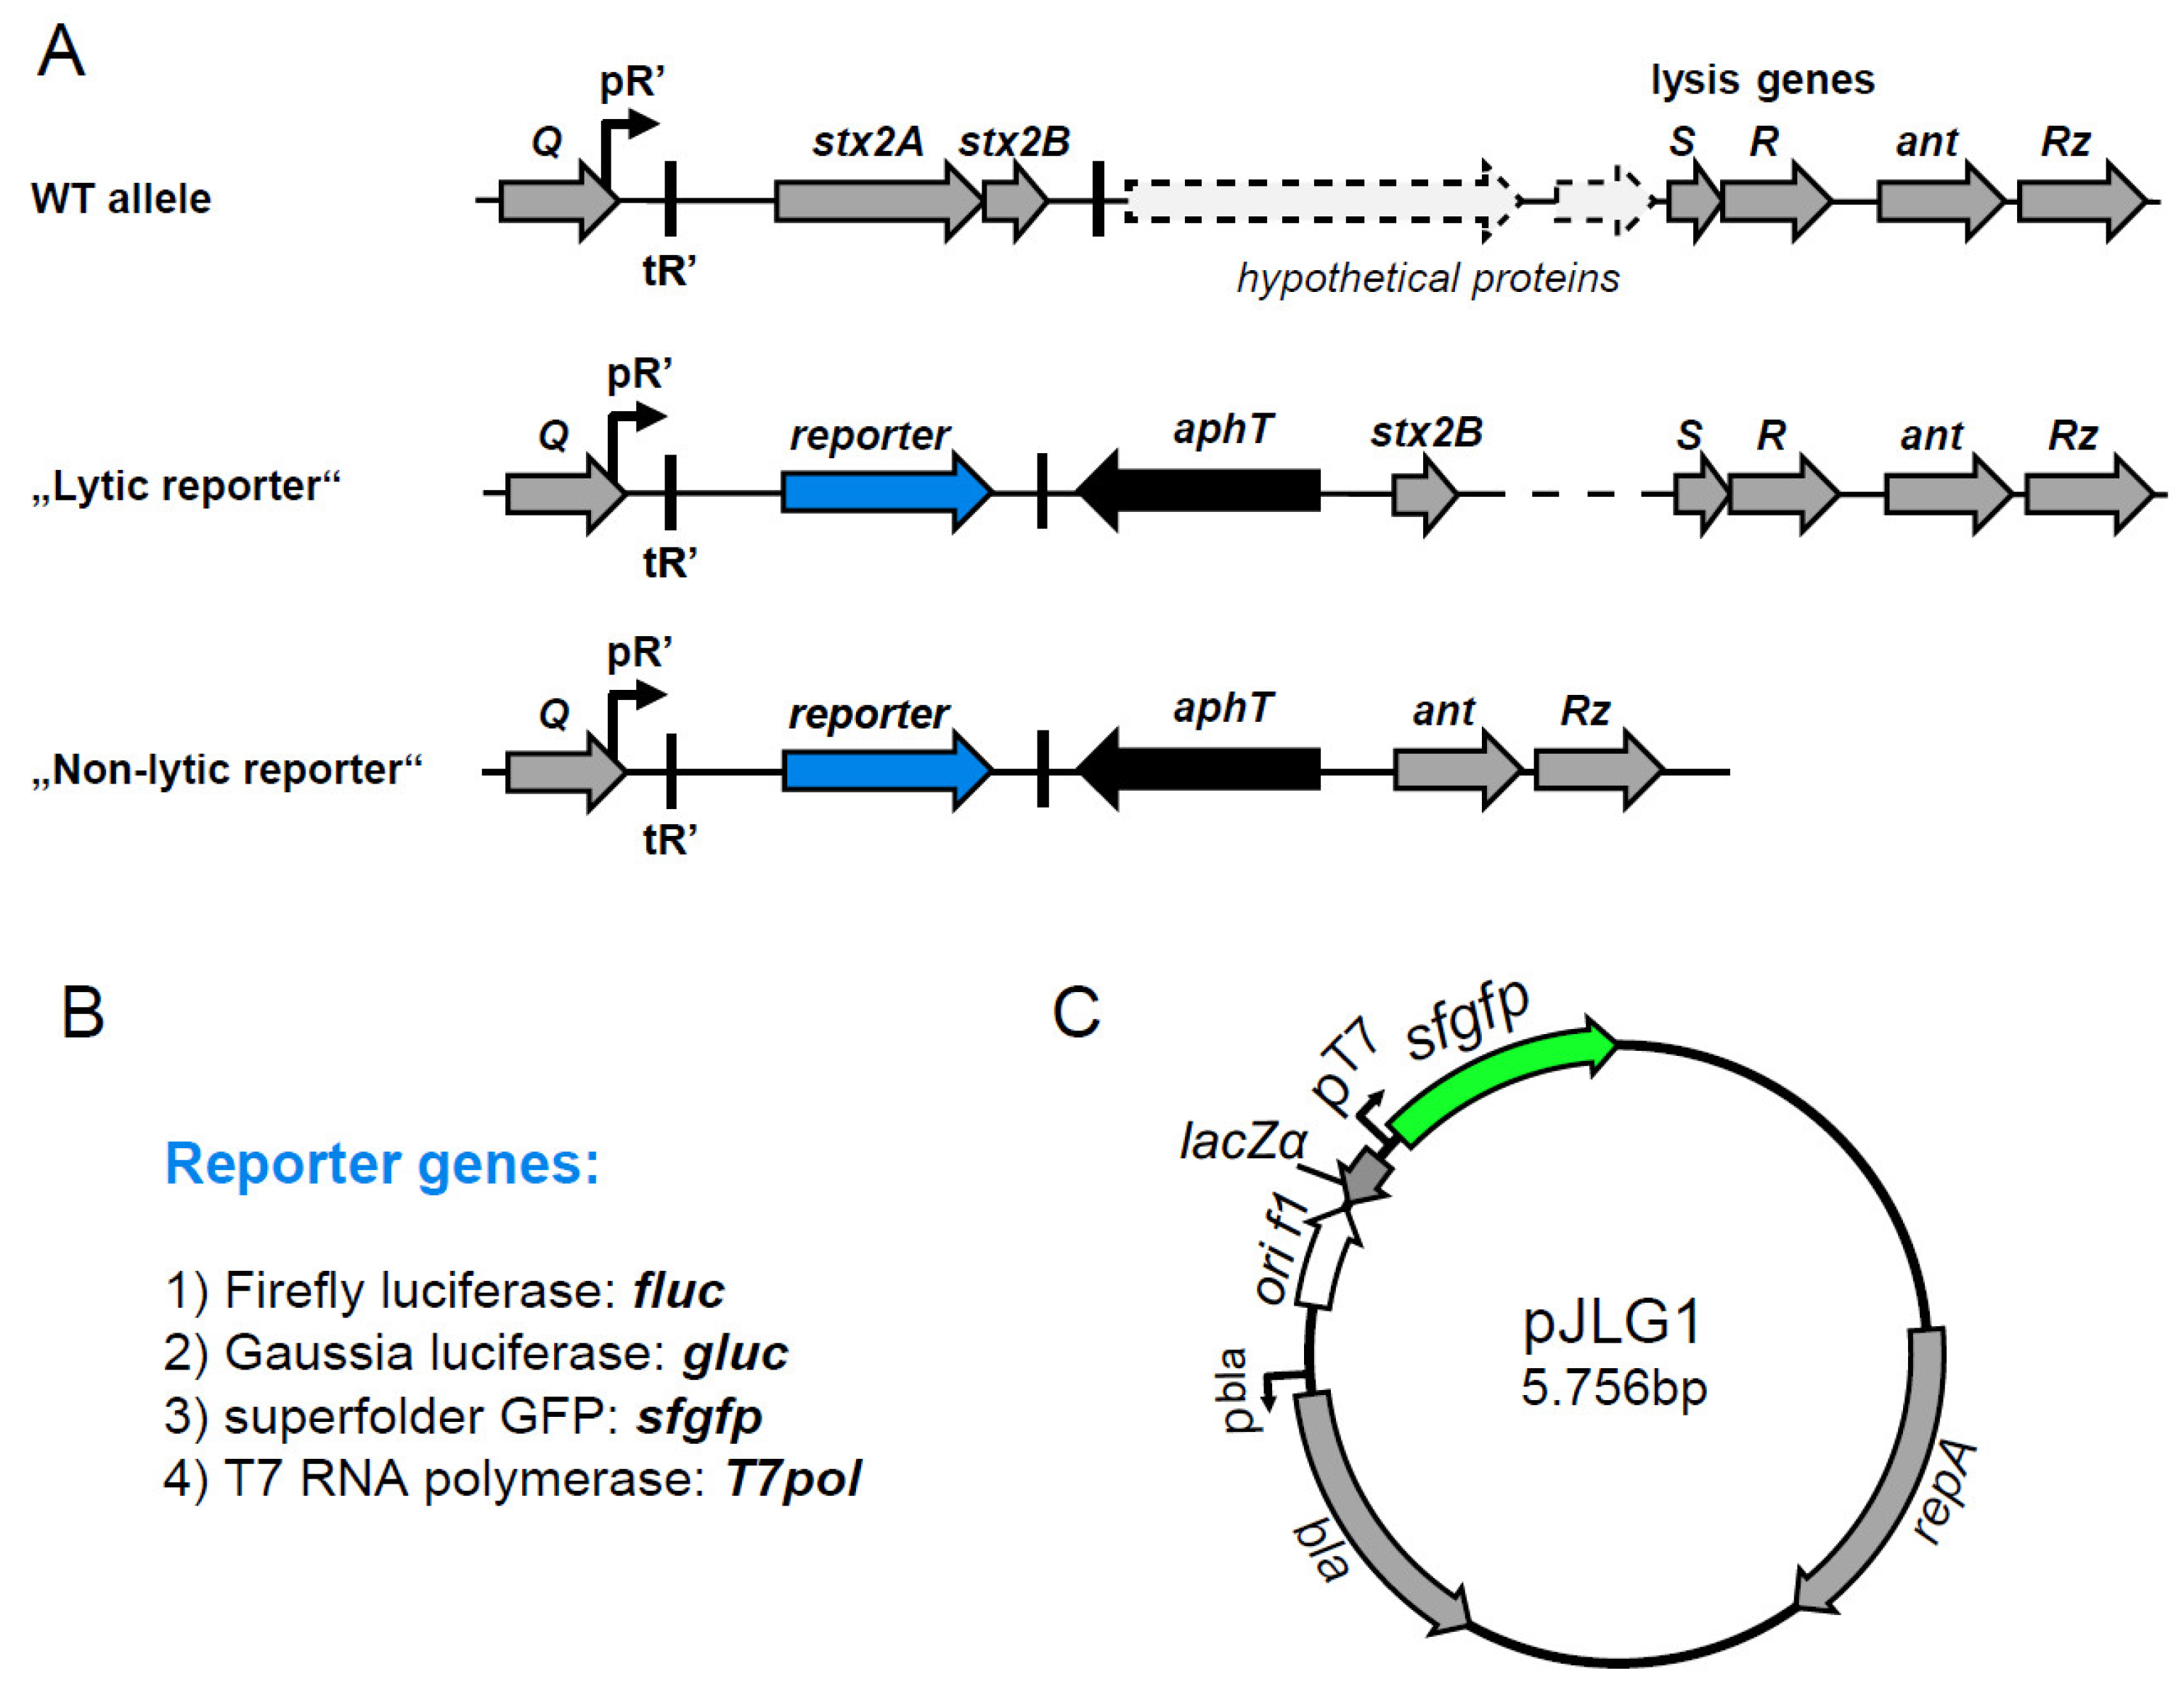
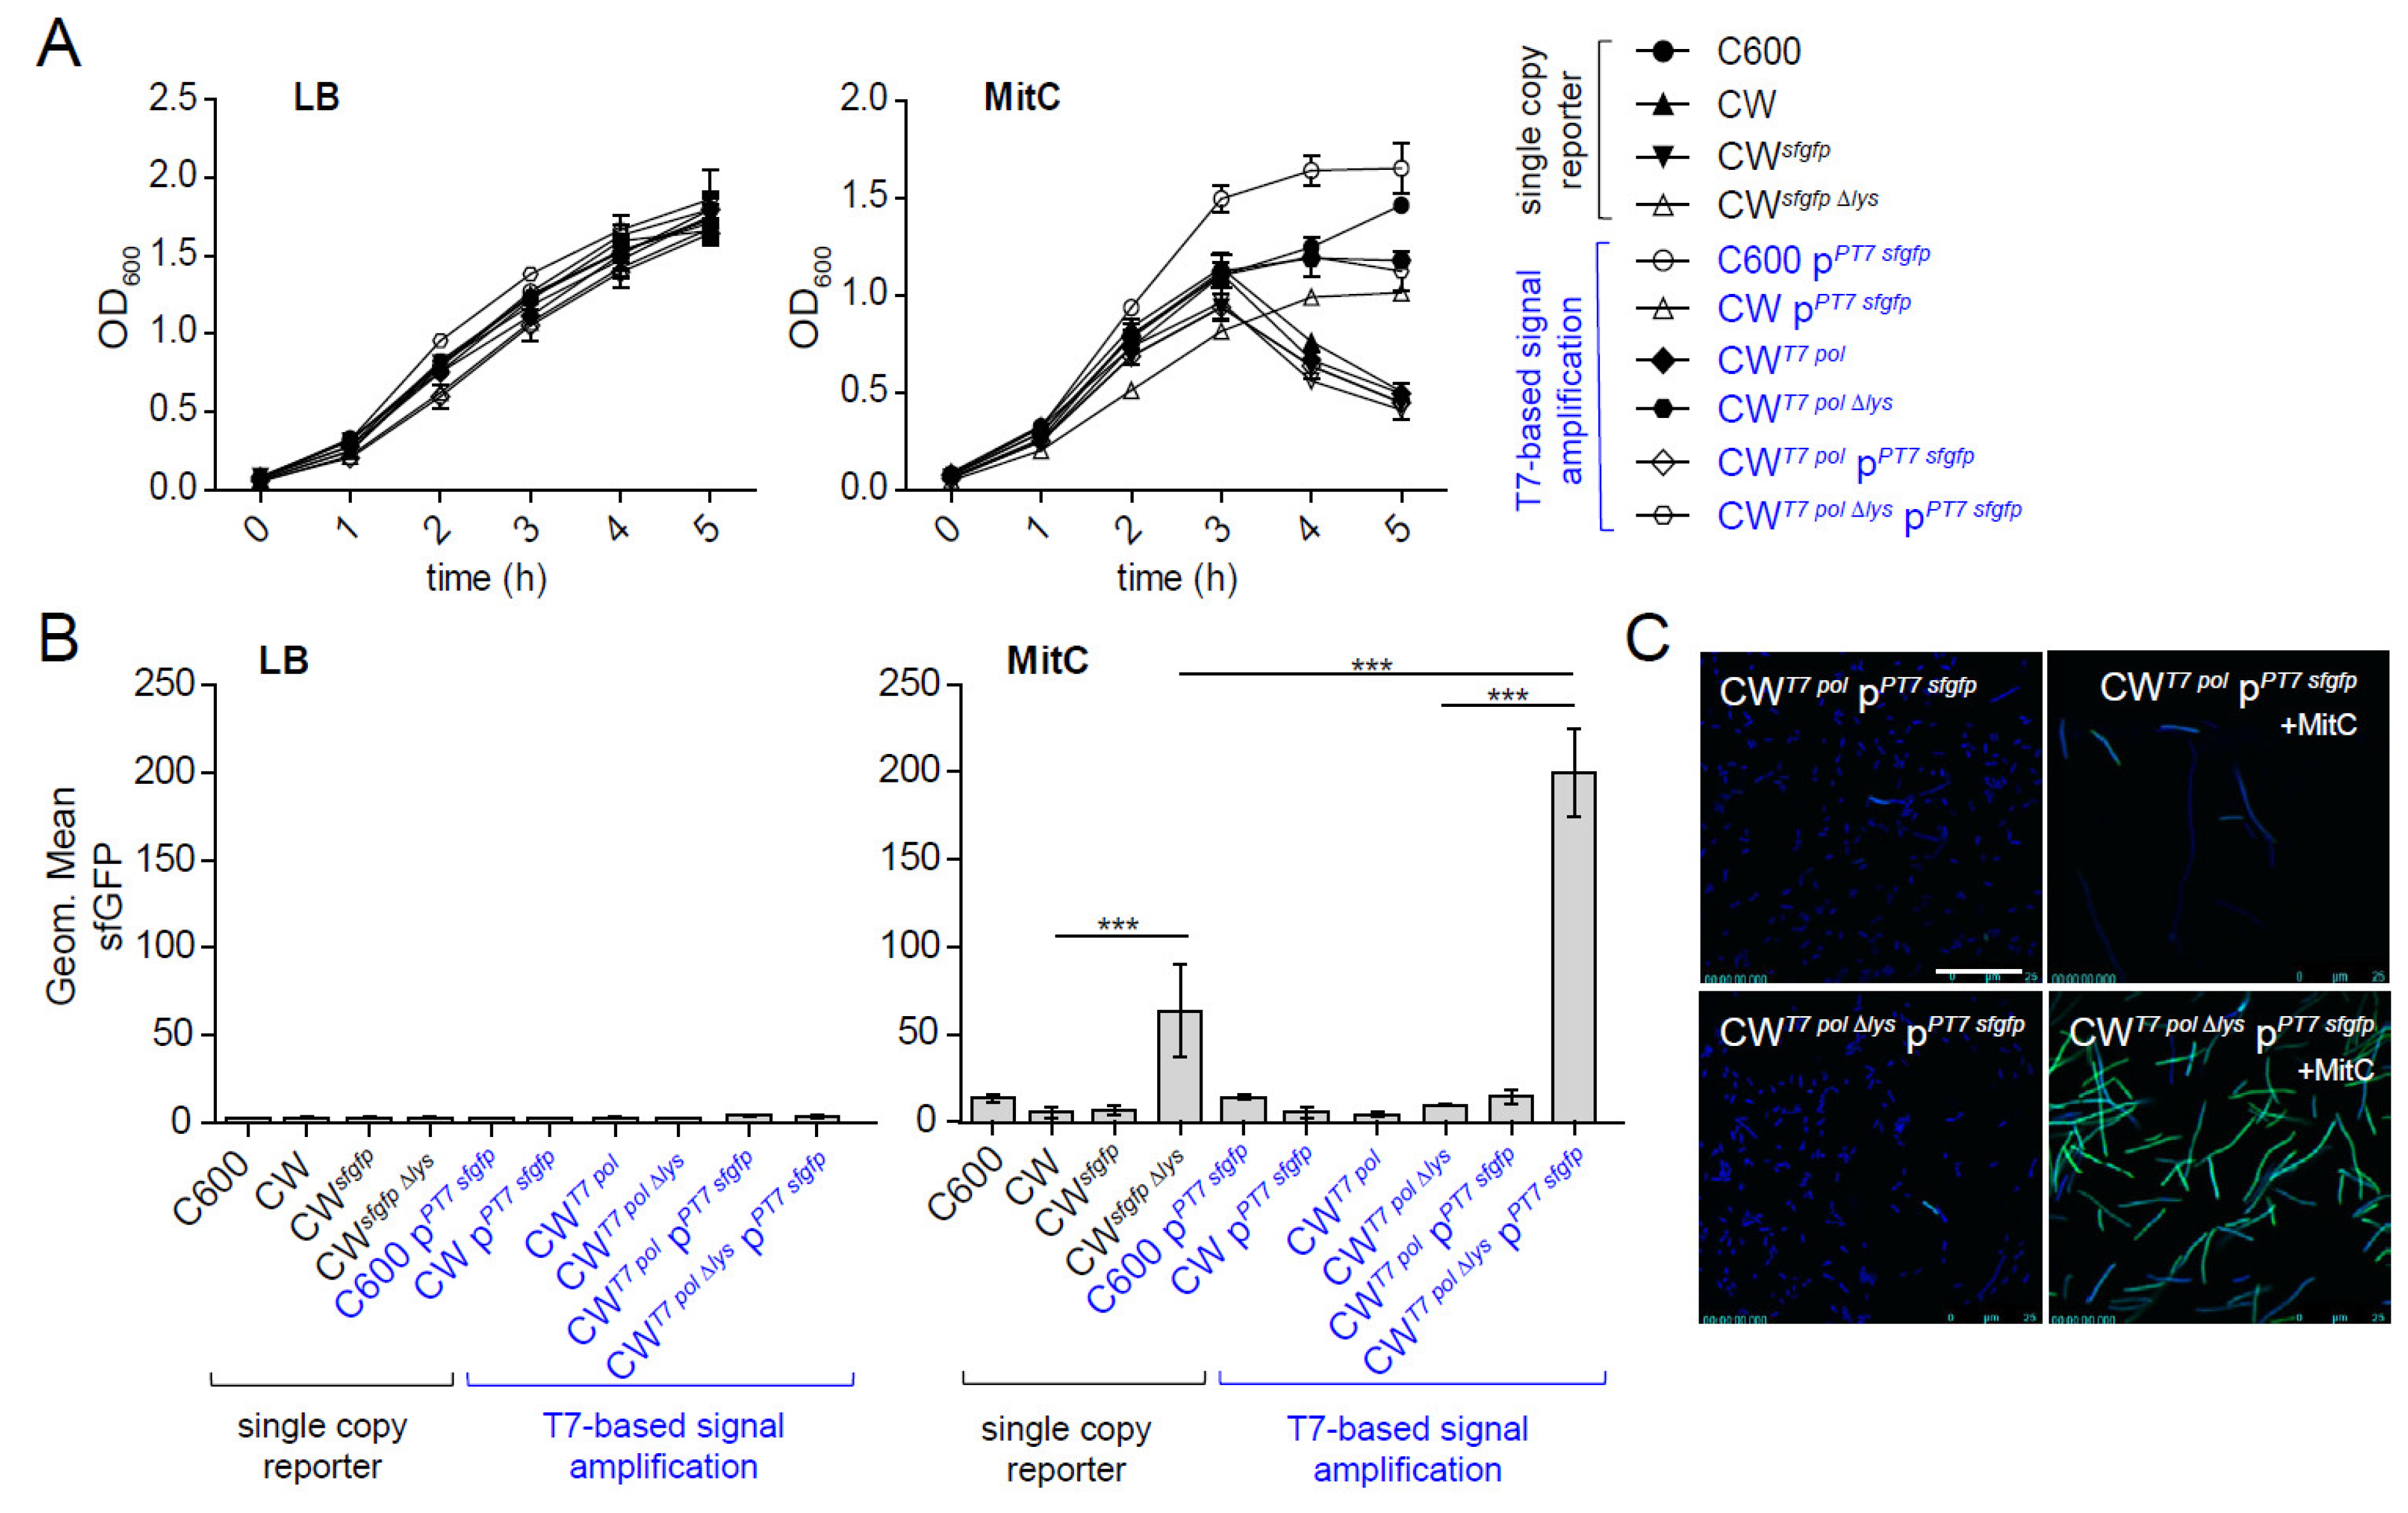
2.1. Generation of a Signal-Amplified sfgfp Reporter to Monitor stx2AB Expression at the Single-Cell Level

In order to analyze regulation of stx2 expression and prophage induction at the single-cell level, two sets of superfolder GFP (sfGFP) reporter strains were constructed in the background of E. coli C600W34 (CW). This strain is lysogenic for the stx2a-encoding phage 933W, which originates from EHEC O157:H7 but is still classified as BSL-2 due to the absence of other EHEC virulence factors [33]. We chose sfGFP because it exhibits higher resistance to chemical denaturants and improved folding kinetics compared to conventional GFP [31]. In one type of reporter strain (‘lytic reporters’), stx2A was exchanged by the sfGFP gene (sfgfp; Figure 1A). In this reporter strain (CWsfgfp), phage 933W is otherwise intact and can still trigger bacterial lysis upon induction with the DNA-damaging antibiotic mitomycin C (MitC). Furthermore, removal of the catalytically active toxin A subunit is sufficient to downgrade the strain to BSL-2. In the other type, stx2AB and four downstream genes, including phage lysis genes (SR), were replaced by the reporter gene cassette (Figure 1A). This reporter type does not lyse and is designated ‘non-lytic’ (CWsfgfpΔlys).
Next, we characterized the growth behavior of wild-type and both reporter strains in lysogeny broth (LB) and LB containing MitC (0.5 µg/mL). No growth differences were observed in LB (Figure 2A). In contrast, 3h after exposure to MitC, the OD600 of lysis-proficient CWsfgfp and reporterless background strain C600W34 (CW) strongly declined, indicating phage lysis, while the 933W-deficient parental strain (C600) and the non-lytic CWsfgfpΔlys continued growing. To study the performance of the reporter strains, we determined the mean fluorescence intensity (MFI) for sfGFP within bacteria by FACS after 5 h (Figure 2B). No signal was observed for both control and reporter strains in LB, showing that the reporter is tightly repressed in the absence of SOS stress. Under MitC-treated conditions, sfGFP MFI was overall slightly increased for all reporter and control strains. This is likely caused by higher the autofluorescence of dead bacterial cells. The lysis-proficient CWsfgfp reporter did not show increased sfGFP MFI compared to C600 or CW, which is likely due to the fact that bacteria inducing the reporter will undergo lysis briefly. Accordingly, for the non-lytic CWsfgfpΔlys, a faint but significant increase in sfGFP MFI was observed (p < 0.001).
We reasoned that the relatively faint sfGFP signal seen in the non-lytic CWsfgfp Δlys strain is due to the fact that the reporter only carries one copy of the sfgfp gene per genome. While this reporter strain could still be valuable for in vitro FACS-based quantification, the signal is too faint for other imaging applications, such as in situ localization of bacteria under infection scenarios. To this end, we used a signal amplification system, based on the T7 polymerase gene T7 pol integrated in the prophage-encoded stx2 locus, and a T7 promotor–sfgfp fusion construct on a medium copy number plasmid (pPT7sfgfp) [34]. Based on this system, we generated a lytic (CWT7pol pPT7sfgfp) and a non-lytic reporter variant (CWT7polΔlys pPT7sfgfp). FACS analysis revealed that the T7 amplification-based reporter system is still tightly repressed in the absence of SOS stress. Moreover, in the absence of the chromosomal T7 polymerase, sfgfp was not expressed from pPT7sfgfp (Figure 2B). Upon induction with MitC, the non-lytic CWT7polΔlys pPT7sfgfp yielded higher sfGFP signals compared to that of the single-copy variant CWsfgfpΔlys. As expected, only a very low sfGFP signal was seen with lytic CWT7pol pPT7sfgfp due to lysis. Growth behavior was overall very similar to the single-copy variants. Overall, the fluorescence intensity of the non-lytic CWT7polΔlys pPT7sfgfp was judged to be sufficiently high for fluorescence microscopy applications (Figure 2C).

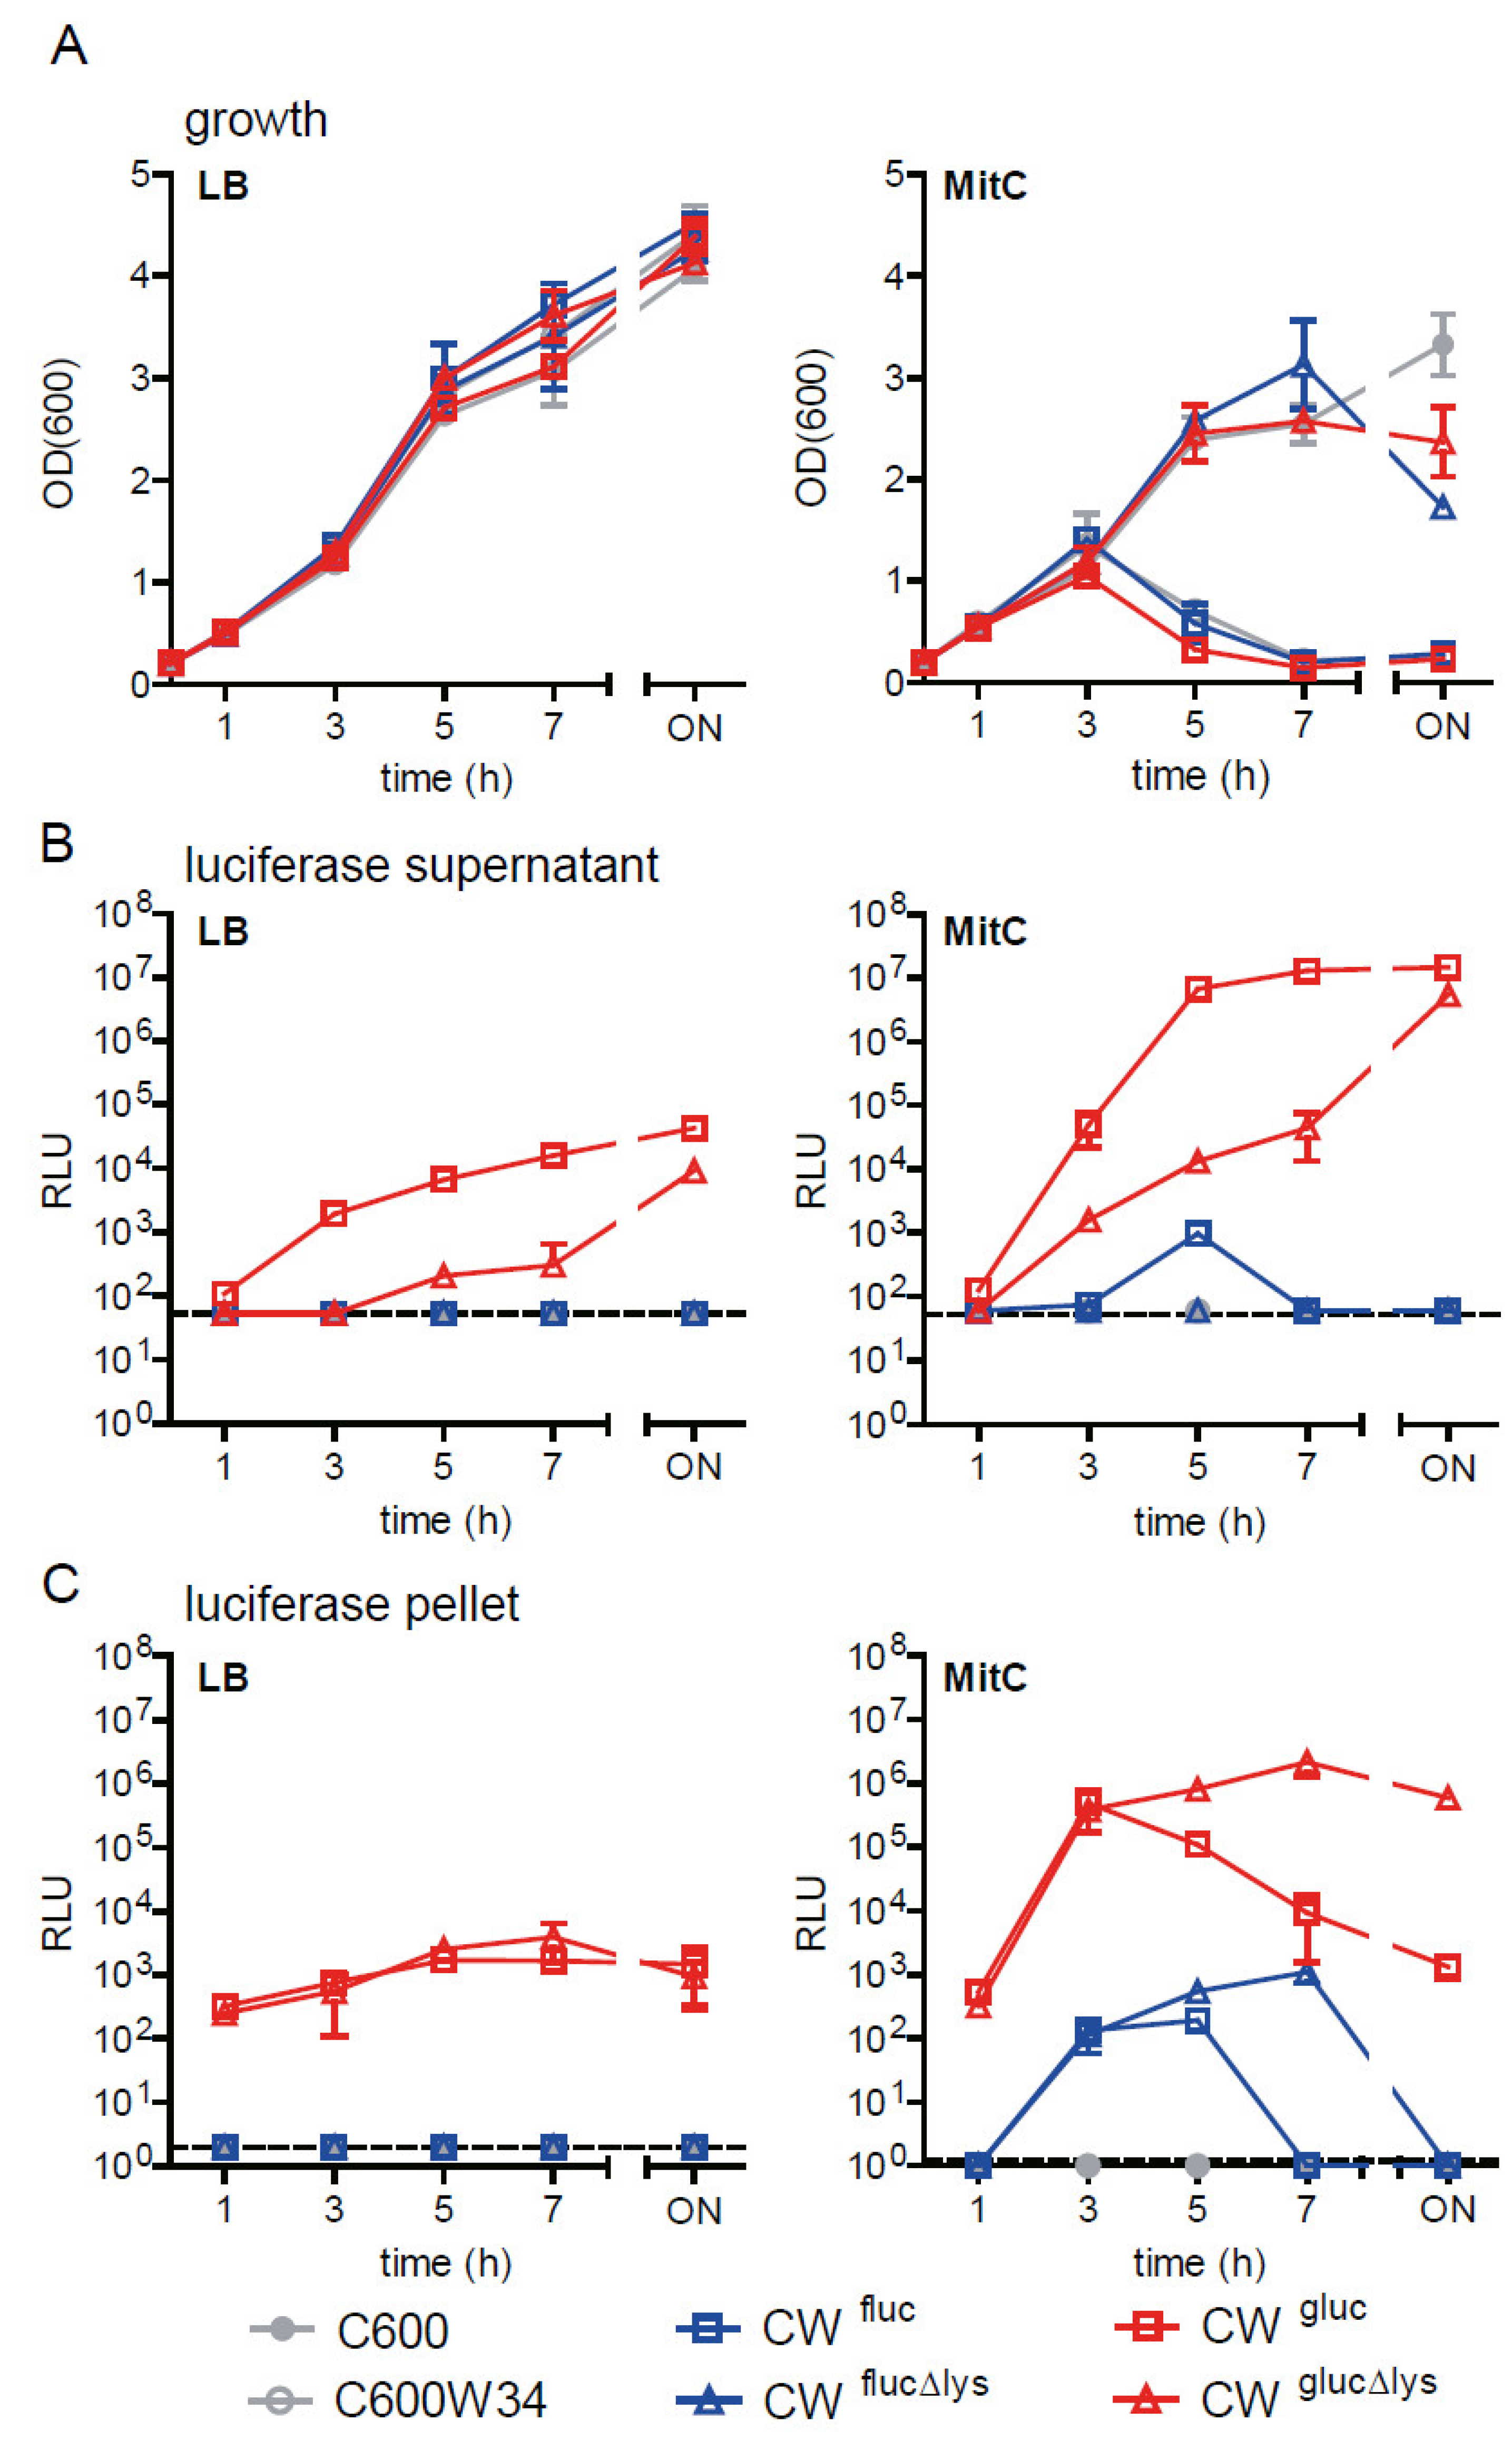
2.2. Comparison of Fluc and Gluc luciferase Reporter Strains to Monitor stx2AB Induction and Φstx-Induced Lysis as a Proxy for Stx2 Release

In addition to the sfGFP reporter, we also established a luciferase-based stx2 reporter system, which offers a higher dynamic signal range and better scalability. The firefly luciferase (Fluc) from the firefly Photinus pyralis is one of the most common reporter enzymes employed in high-throughput assays. Fluc generates a bioluminescent signal through oxidation of a luciferin substrate. Furthermore, Gaussia luciferase (Gluc) became recently available, which exhibits higher enzyme stability and strong luminescence activity [32]. Gluc exhibits a high signal-to-noise ratio, and luminescence is linearly proportional to the amount of Gluc protein over five orders of magnitude. In order to analyze the regulation of stx2AB expression and prophage induction, two sets of luciferase reporter strains were constructed in the background of E. coli C600W34 (CW). Similar to the sfGFP reporters, lytic and non-lytic reporter strains were generated (Figure 1A). For the first, stx2A was exchanged by the fluc or gluc reporter gene cassette (CWfluc and CWgluc), and, for the non-lytic variant, stx2AB and phage lysis were replaced by the reporter gene cassette (CWflucΔlys and CWglucΔlys; Figure 1A).
Next, we characterized growth behavior of wild-type and luciferase reporter strains in LB and LB containing MitC (0.5 µg/mL; Figure 3A) and determined the activity of the two different luciferases (Fluc and Gluc) in the culture supernatant or the bacterial pellet at different time points (Figure 3B,C). Similar to observations made for sfGFP reporters, 3 h after exposure to MitC, the OD600 of C600W34 (CW) and lysis-proficient reporter strains strongly declined, indicating phage lysis. No lysis was seen for strains in LB (Figure 3A) or prophage-deficient C600 and lysis-deficient reporter strains (Figure 3A).
In general, luciferase activity in the culture supernatant was significantly higher with the lytic reporter than the non-lytic (Figure 3B), while activity in the pellet fraction was lower (Figure 3C). Overall, Fluc generated lower relative luminescence unit (RLU) levels and a lower dynamic range compared to that of Gluc (Fluc: ~103 vs. Gluc: ~106). Of note, Fluc activity in the supernatant and pellet harvested at later time points (i.e., 7 h and overnight after MitC exposure) was drastically reduced, reflecting its low enzyme stability. In contrast, Gluc activity remained stable once it reached a maximum in the supernatant (CWgluc) or the pellet (CWglucΔlys). For the lytic reporter CWgluc, Gluc activity in the pellet declined 3h after exposure to MitC (Figure 3C), while at the same time, supernatant activity increased (Figure 3B). This reflects the rapid release of the reporter enzyme into the culture supernatant from lysed cells, where it can be readily detected.

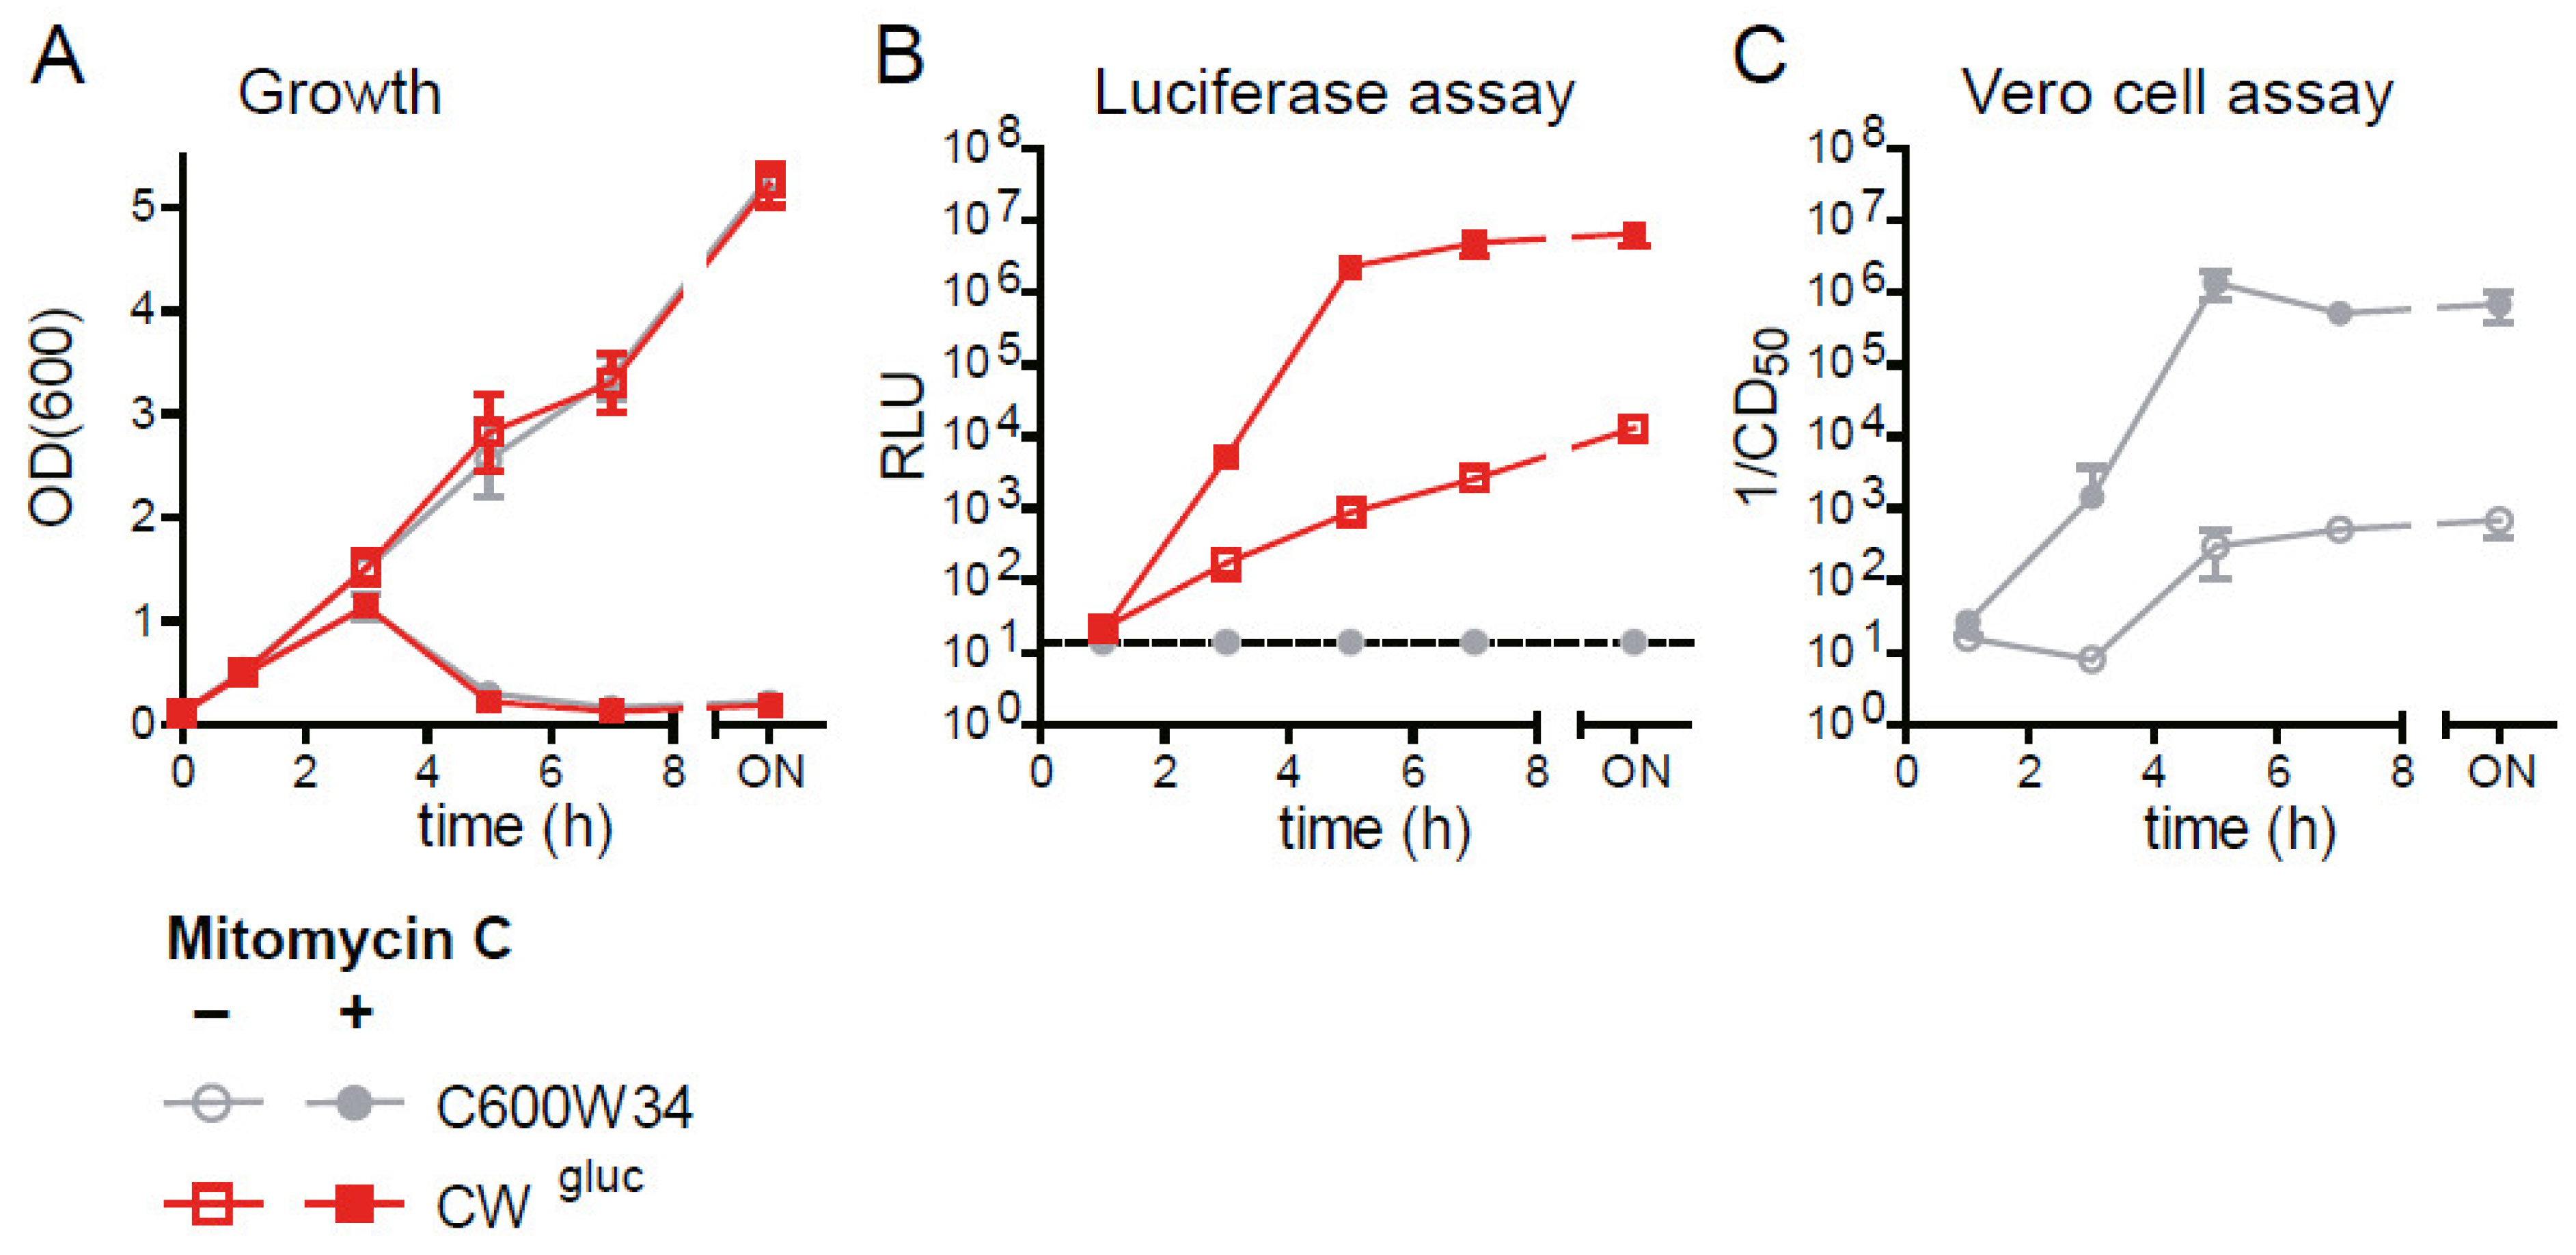
2.3. The Lytic Gluc Reporter Mirrors Kinetics of Stx Release from E. coli

The lytic reporter strain (CWgluc) released Gluc into the culture supernatant within 3 h after MitC induction. Gluc activity in the supernatant reaches a maximum at 5 h, where it remains stable for at least 20 h. Moreover, in the absence of MitC treatment, CWgluc continuously releases low levels of Gluc into the culture supernatant. We hypothesized that Gluc release from CWgluc would reflect the kinetics of phage-mediated Stx2 release from the parental E. coli C600W34 strain. In order to test this idea, we cultured CWgluc and the Stx2a producer C600W34 in LB in the presence and absence of MitC (0.5 µg/mL) and quantified Gluc and Stx2a in parallel in the supernatant. The strains exhibit highly similar growth characteristics (Figure 4A). To quantify Stx2a toxin levels, we used a Vero cell assay. Vero cells are highly susceptible to Stx-mediated killing and can therefore be used for detecting and quantifying Shiga toxins [35]. We determined the reciprocal of the supernatant concentration at which >50% of Vero cells were killed (1/(CD50]): The higher 1/(CD50), the more Stx2a is present in the sample. During growth in LB, CWgluc and C600W34 steadily release Gluc (Figure 4B) and Stx2a (Figure 4C), respectively, into the supernatant. This is likely attributable to the low rates of spontaneous prophage induction in the bacterial population. In response to MitC, both Gluc and Stx2a levels are significantly increased 3 h after treatment and reach a maximum at 5 h (~6 log-fold). This determines that the kinetics of Gluc release are indeed comparable to Stx2a release, and the culture supernatant from the lytic reporter CWgluc can be used as a proxy for Stx2a levels in the bacterial culture supernatant. For this reason, but also due to its ease of use, scalability and high sensitivity, the CWgluc could be employed for medium-to-high-throughput applications, such as metabolite, chemical or drug screening.

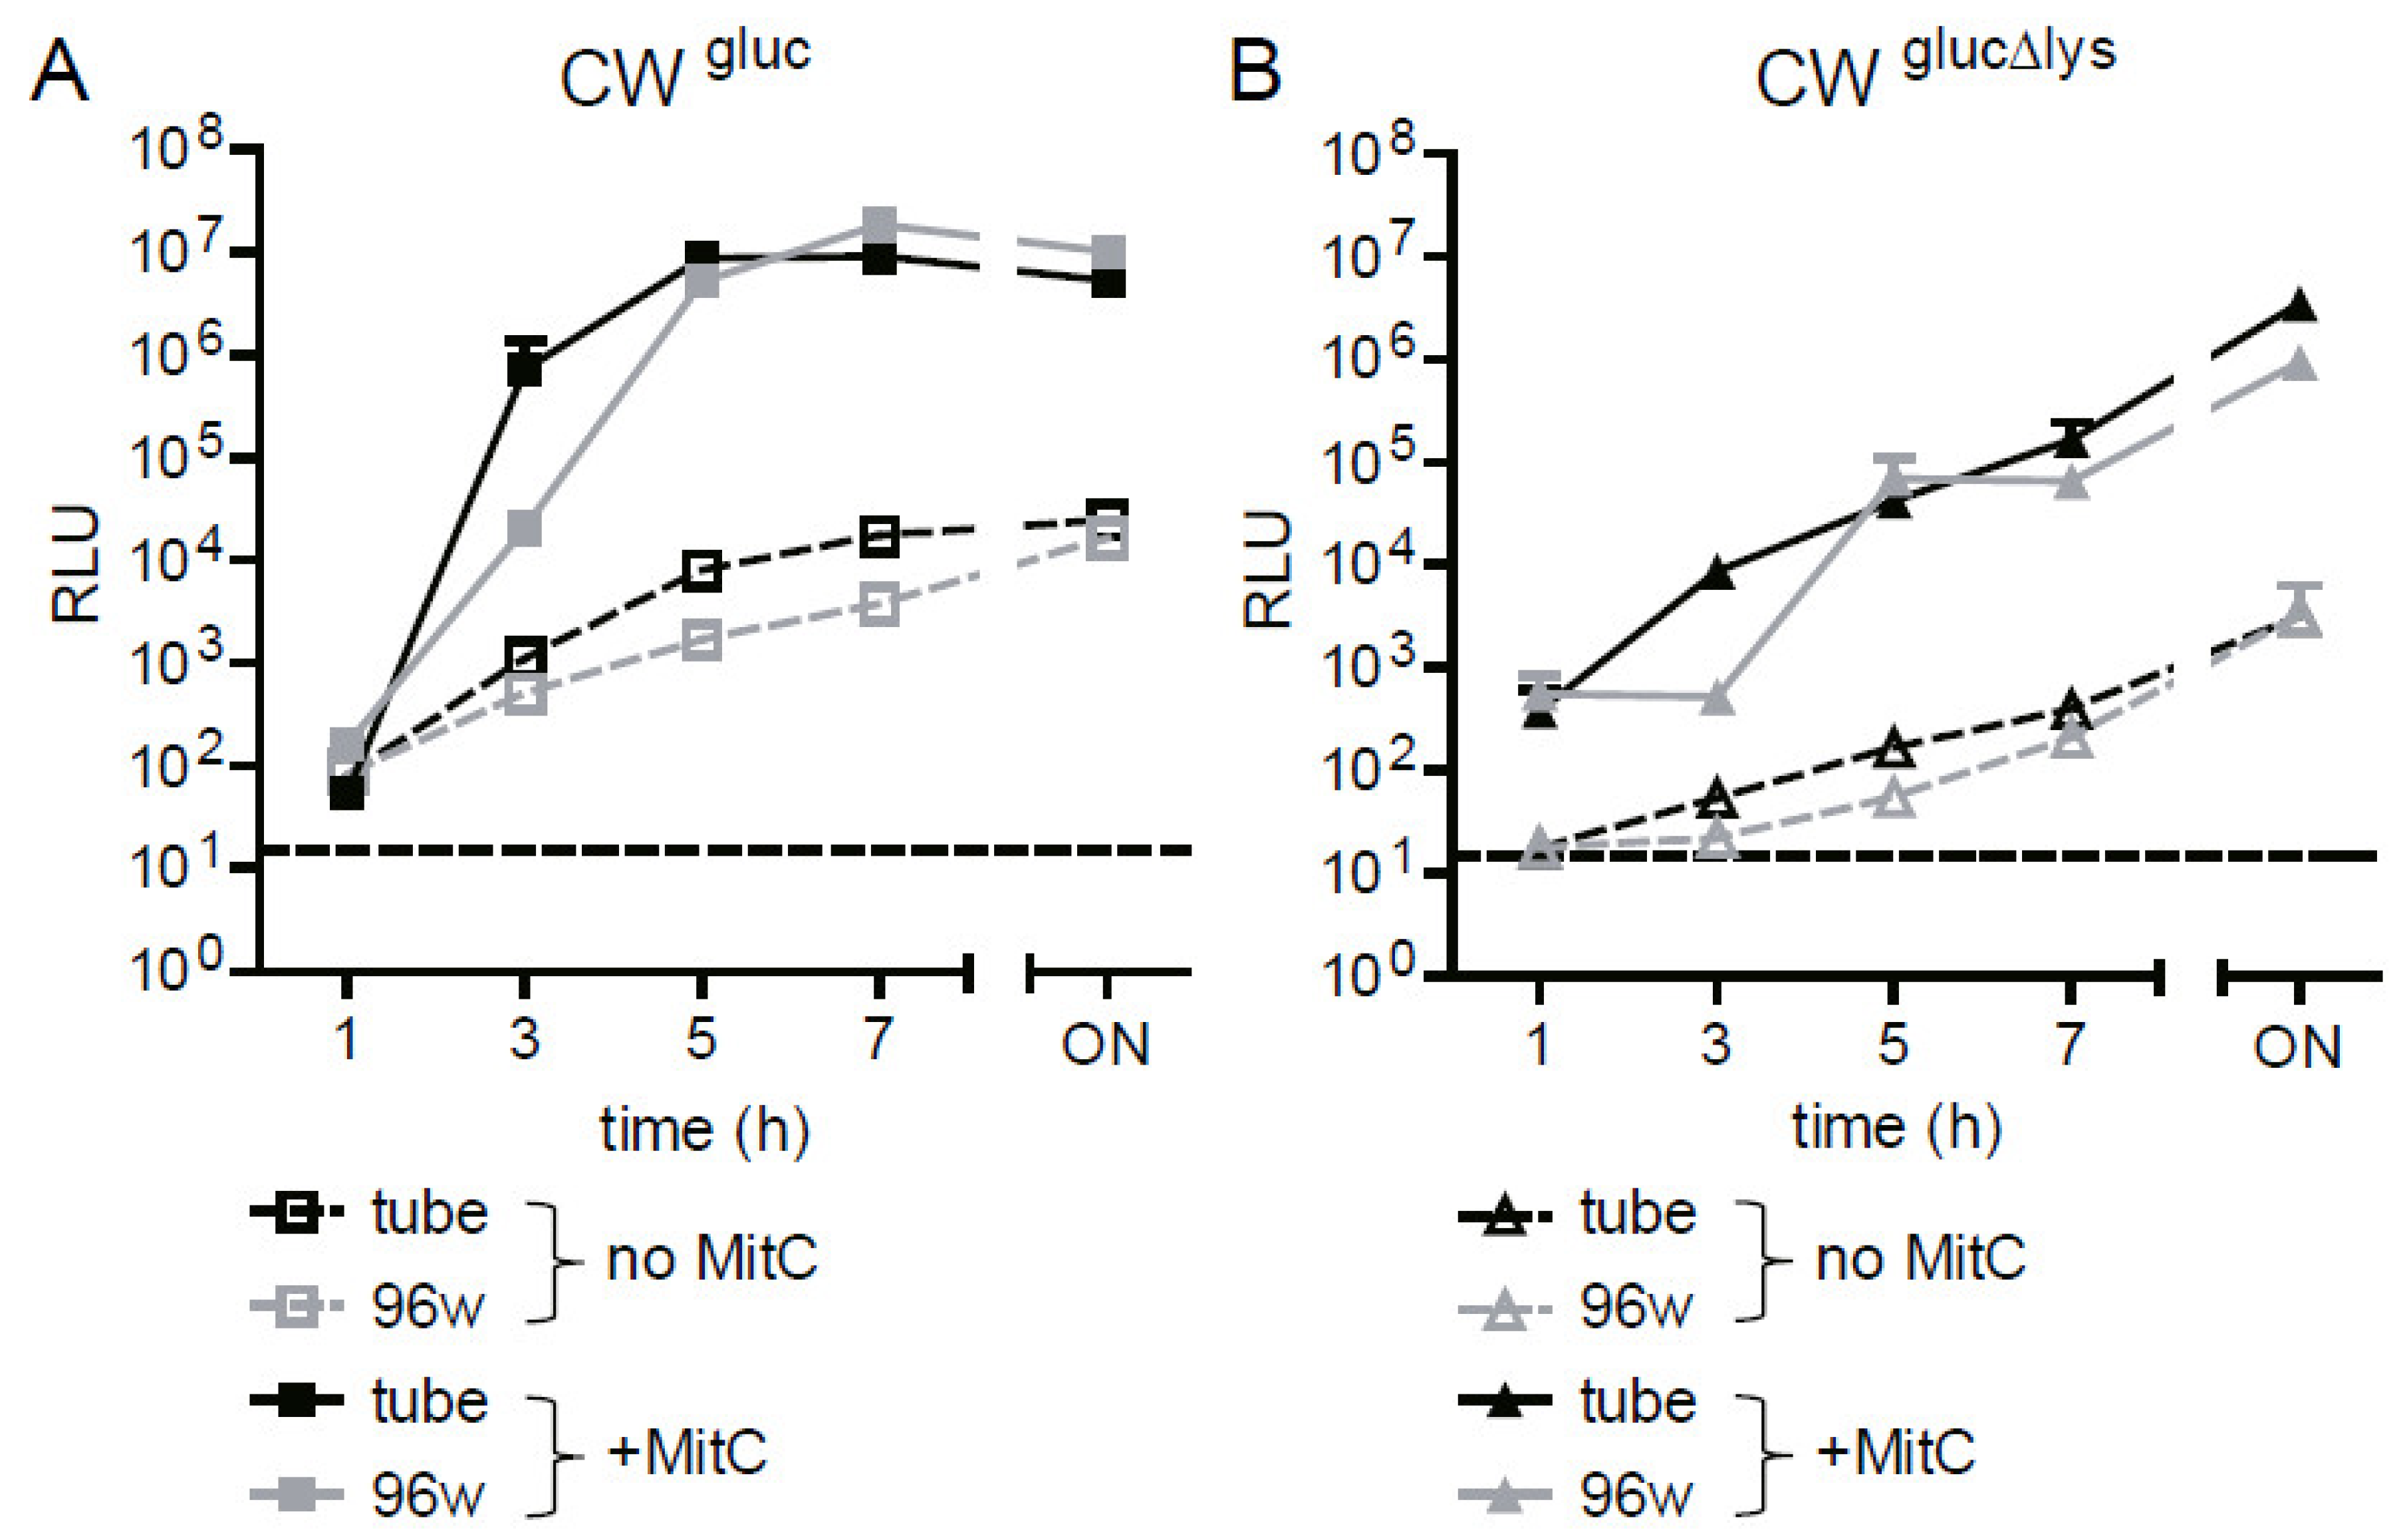
2.4. The Gluc Reporter Assay for Φstx-Induced Lysis Can Be Scaled Up to a 96-Well Format

Next, we aimed to demonstrate that this assay can also be performed in a lower volume format, such as a 96-well plate, e.g., to enable higher throughput screening or automation platforms. We inoculated 250µL of OD600 0.1 (~5 × 10⁷/well) CWgluc or CWglucΔlys in LB (~1 × 10⁹ bacteria/mL) in a 96-well U-bottom plate and incubated at 37 °C with shaking for 20 h. In parallel, the tubes were inoculated with 4 mL of LB harboring the same concentration of reporter strains (~1 × 10⁹ bacteria/mL). Gluc activity was determined in 10 μL of the culture supernatant obtained from the two different formats. Gluc activity from reporter strains grown in 96 wells and tubes was congruent, in particular after 5 h (Figure 5A,B). Therefore, we concluded that the reporter assay can be scaled up to a 96-well format, and the data are comparable to our previous characterization in tube format.

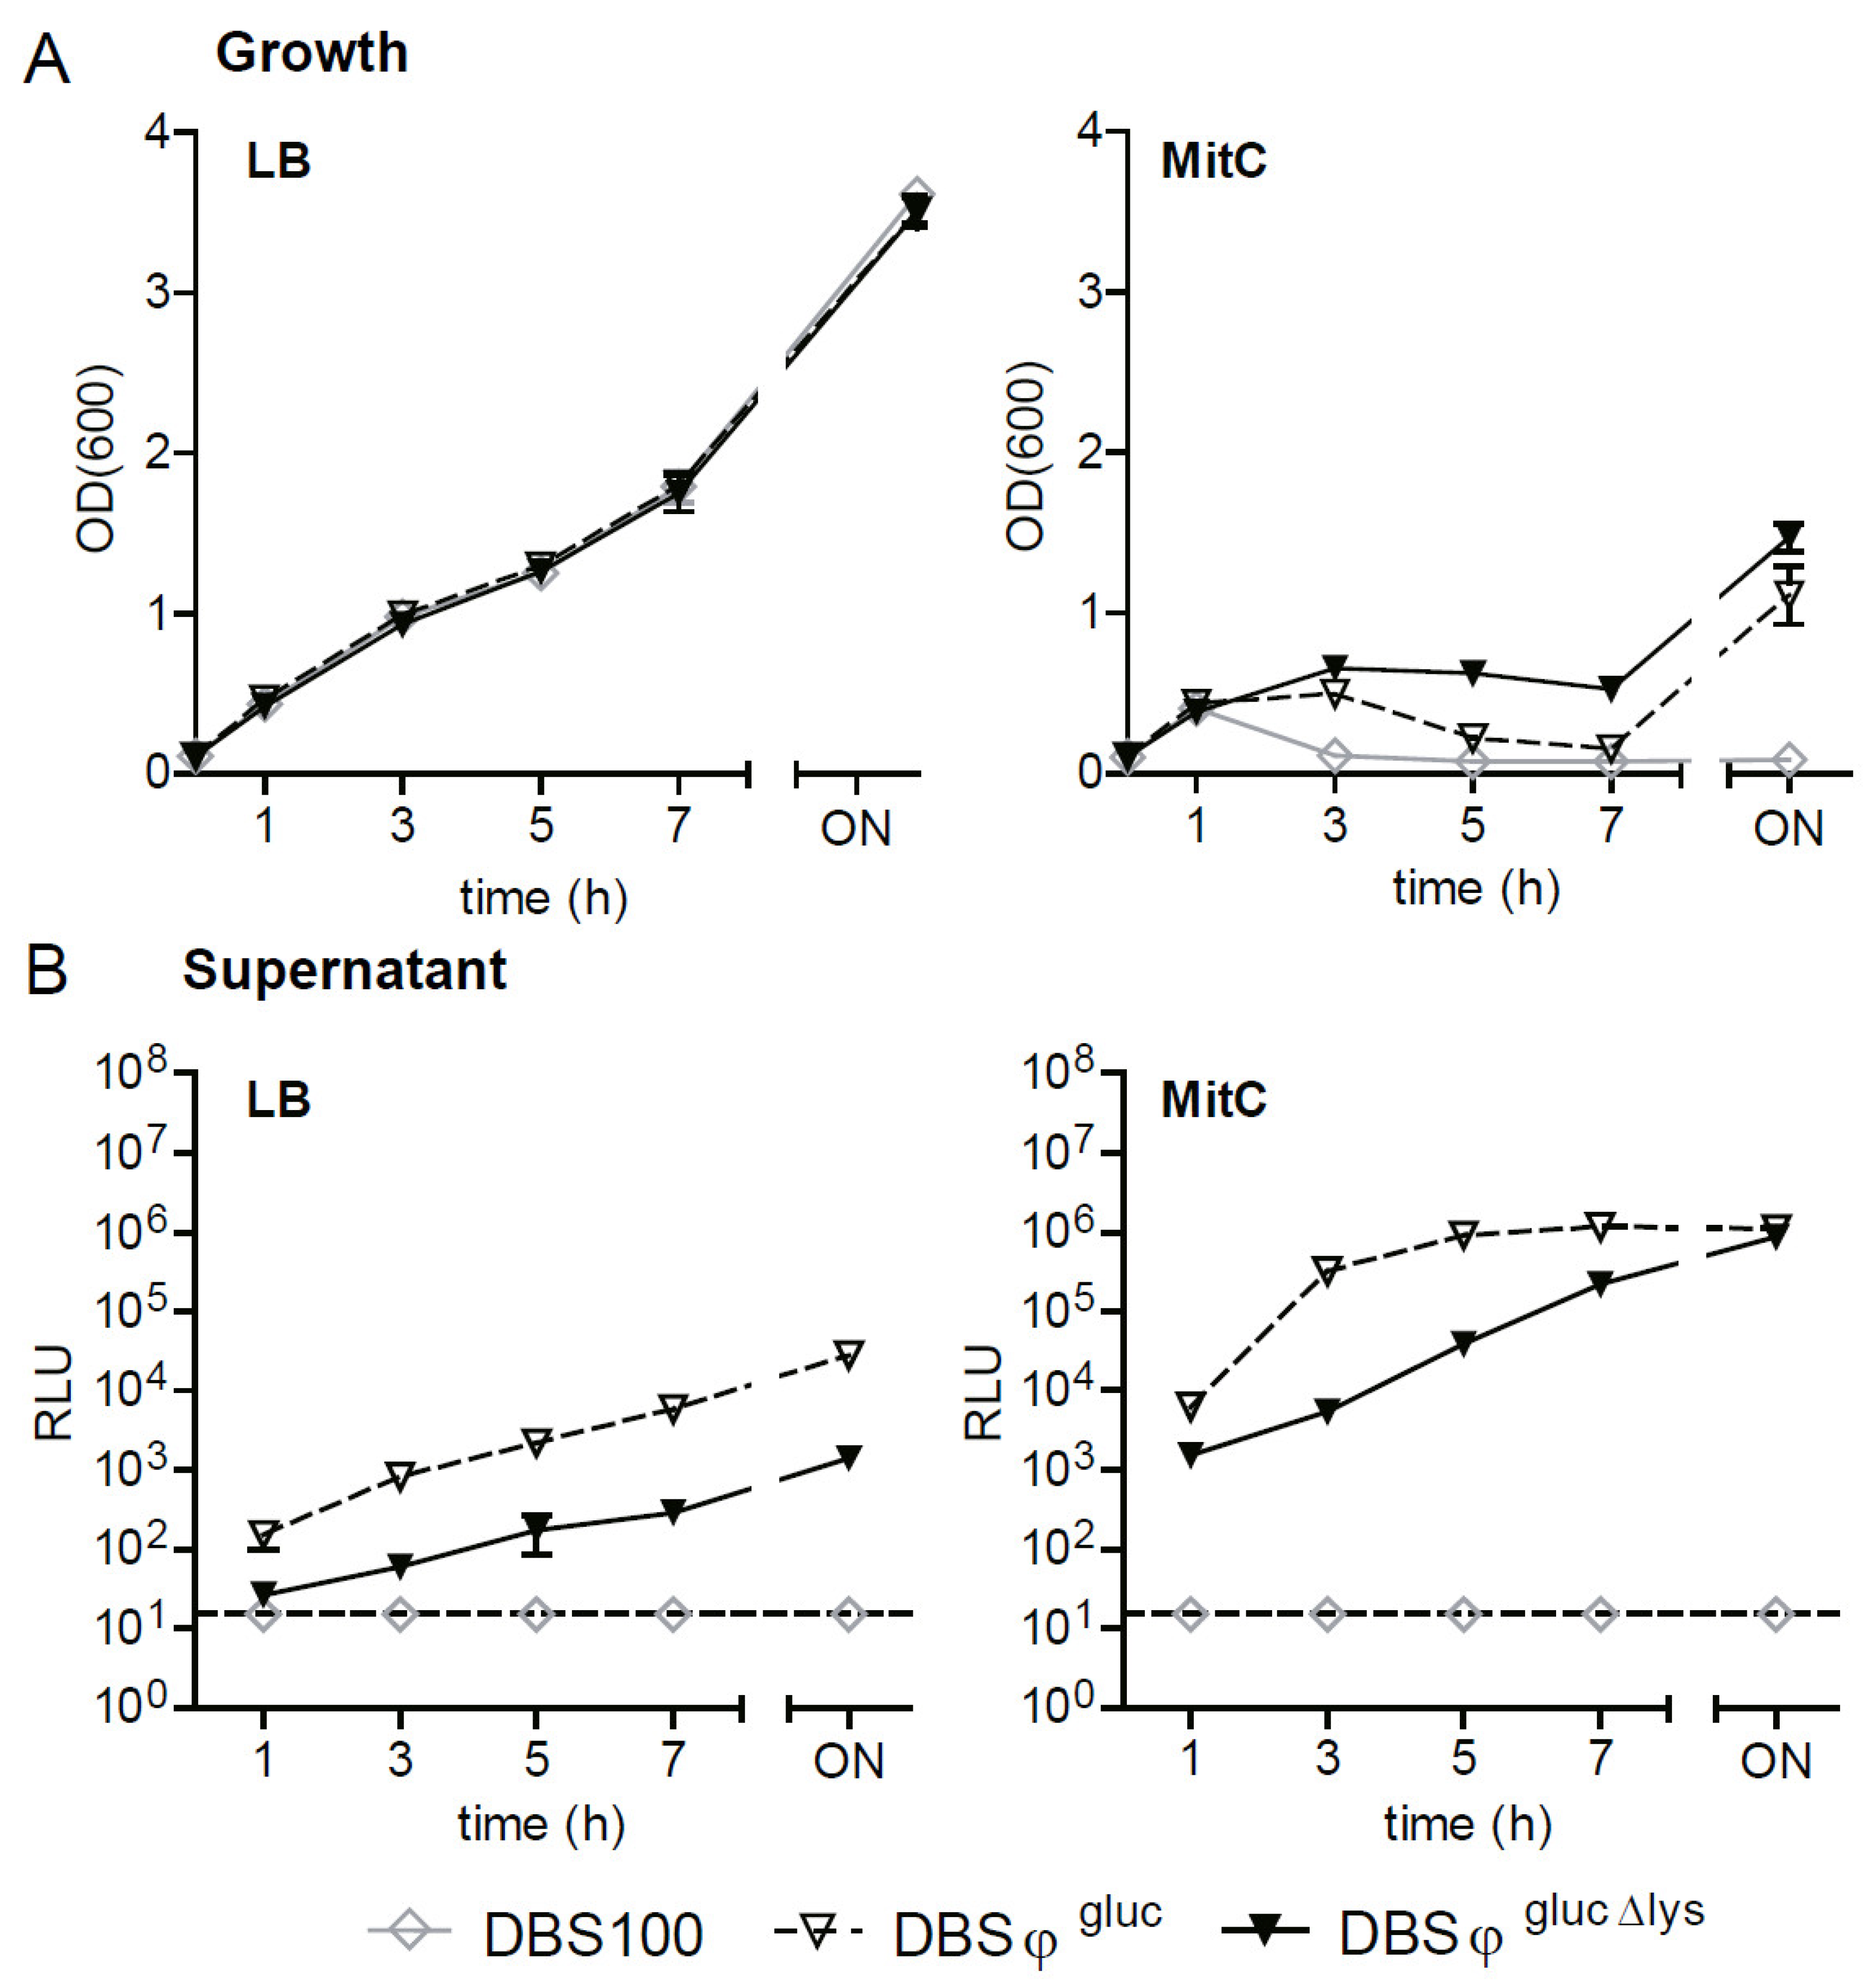
2.5. Generation of BSL-2 Gluc Reporter Strains in a BSL-3** Pathogen

Despite harboring the stx2a encoding phage 933W, E. coli C600 W34 otherwise does not harbor EHEC virulence factors and is a non-pathogenic derivative of the K12 laboratory strain [33]. We sought to determine if the Gluc reporter system could also be established in a pathogenic, Stx2-producing strain. To this end, we chose the mouse pathogen Citrobacter rodentium ϕstx2dact (DBS770), which produces Stx2dact and recapitulates the disease pathology of human EHEC infection in mice [36]. DBS770 is a derivative of C. rodentium DBS100 [37]. Due to the presence of stx2dact, it is considered a BSL-3** level pathogen, and experiments with the strain have to be performed under high containment settings, which impedes experimentation. In the background of DBS770, we generated a lytic (DBSgluc; [38]) and non-lytic reporter strain (DBSglucΔlys). Notably, the replacement of stxA2dact and stxAB2dact lysis genes by the gluc reporter cassette renders the strains BSL-2. Next, we characterized the reporters in LB with or without exposure to MitC (0.5 µg/mL) in the tube format. Compared to E. coli reporters (Figure 3A,B), C. rodentium reporters grew slower and reached a lower maximum OD600 (Figure 6A). MitC treatment led to a more drastic reduction in growth and earlier lysis (Figure 6B). Since C. rodentium DBS100 harbors five intact prophages [39], we assume that these prophages also contribute to lysis. Of note, Gluc activity was detected in the culture supernatant, and this was increased when ϕstx2dact intrinsic lysis genes were intact and the culture stimulated with MitC (Figure 6B).

3. Discussion

Stx2 is the major virulence factor of EHEC and is associated with an increased risk for HUS in infected patients. The conditions influencing its expression in the intestinal tract are largely unknown. Reporter gene assays have proven to be important tools for the efficient and high-throughput analysis of factors involved in bacterial virulence gene expression [40,41,42]. In the case of EHEC strains, transcriptional reporters replacing the stx2 genes have the ancillary benefit that they lead to the downgrading of the pathogen risk class due to deletion of the key virulence factor (ZKBS Az. 6790-10-57, September 2017). Here, we generated a new set of Stx2 reporter strains that can be implemented in different STEC strain backgrounds and used for various applications. The BSL-2 sfGFP reporters allow the monitoring of toxin expression in live bacterial cells or in situ fluorescent microscopic analysis in fixed samples. The BSL-2 Gluc reporter strains are an alternative to classic reporters, as they allow the quantification of toxin release from bacterial cells directly in the culture supernatant. This is a technically simple and robust method that can be readily scaled up to parallelized assay formats. The Gluc reporter will enable testing of the effect of specific drugs, metabolites and peptides on stx2 expression and toxin release in more detail.
In EHEC strains, the stx2 genes are encoded on lambdoid prophages, and toxin expression is tightly linked to the production of phages during the phage lytic cycle [43,44]. The genes encoding the Stx2 AB subunits and the stxAB promoter element are located downstream of the phage late promoter. Here, they are under control of two subsequent processive antitermination systems, N and Q [45]. The latter one, Q, also promotes the expression of stxAB genes by interaction with the RNA polymerase [44]. To minimally interfere with this complex regulatory cascade, we generated a reporter system that allows monitoring of the expression of stx2 genes in its native genomic context, e.g., on the prophage. We show that a single-copy insertion of the fluc or gluc reporter genes enables tight regulation with high reporter signal intensity. MitC-mediated triggering of the bacterial SOS response and concomitant induction of the 933W lytic cycle lead to strong induction of both reporters (Figure 3).
Multicopy plasmids have often facilitated gene expression studies to construct reporter strains [46]. Plasmid-based fluorescent protein reporters were generated for both stx1 and stx2 expression [47,48] Stx1 reporters were shown to be specifically responsive to cues of the SOS response and iron limitation, the environmental cues for stx1 expression [49,50]. Using the stx1-yfp reporter in combination with a recAP-cfp reporter for the SOS response, Berger et al. showed that antimicrobial agents inhibiting transcription and translation can prevent Shiga toxin expression, even after induction of the SOS response [47,51]. This confirms the results of others [22,52] and, recently, also a preclinical study in mice [38]. As the use of plasmid-based reporters can lead to copy number artifacts, we reason that the single-copy reporters generated in our work will be a valuable tool, especially for physiological studies. In the case of sfGFP reporters, only the “non-lytic” variants proved useful in detecting sfGFP-positive bacteria, which activated the stx2 promoter. As stx2 expression entails phage lysis, in the case of the “lytic” variants, the sfGFP reporter protein is released into the culture supernatant and, therefore, cannot be quantified by FACS (Figure 2). The single-copy insertion of the sfgfp leads to a relatively weak fluorescent signal, which is sufficient for FACS-based quantification but too low for fluorescent microscopic applications. In contrast, the integration of a T7 polymerase and plasmid-based signal amplification loop resulted in a bright sfGFP signal while preserving tight regulation.
As bacteria expressing stx2 are doomed to die by phage lysis, intracellular reporter proteins will inevitably be released in the supernatant where they may not be measurable or rapidly loose activity. The BSL-2 Gluc reporters not only allowed us to monitor toxin gene expression within the bacteria but also released reporter in the culture supernatant. Measuring phage-based reporter release rather than its intrabacterial levels is more relevant for assessing free toxin, which can also induce damage to host cells and be translocated to systemic sites. Thus, the “non-lytic” and “lytic” Gluc reporter variants allow for flexible application, such as quantification of the intrabacterial reporter protein and the reporter protein released by phage lysis in the culture supernatant (Figure 3). We show that the half-life of Gluc activity in the culture supernatant is much higher compared to that of Fluc activity, which can be attributed to the higher enzyme stability of Gluc [53]. Moreover, we show that the reporter system can be used to study toxin release by different pathogenic STEC strains—an important benefit, as subtypes of stx2 encoding phages are correlated with variable degrees in toxin release [54]. We envision that using our genetic toolset, reporter strains can be constructed in other newly emerging STEC strains to study strain-specific features of stx2 expression and release.
Shimizu and colleagues generated a chromosome–plasmid hybrid bioluminescent reporter system, using Photorhabdus luminescens luxCDABE genes. This reporter system produces both the enzyme (luciferase) and an internal fatty aldehyde substrate and, therefore, enables real-time monitoring of stx expression in EHEC [28]. However, the luxCDABE system has a much smaller dynamic range compared to that of the Gluc assay and requires the addition of antibiotics to select for the reporter plasmid under some conditions, which may limit its application in high-throughput screening.
In conclusion, the “lytic” Gluc reporter is a scalable reporter system characterized by a high signal/noise ratio, which reports Stx production and/or release. We envision that this new set of reporter tools will be highly useful to screen environmental and host factors, including drugs, small metabolites and the microbiota, on Stx2 release and thereby serve the identification of risk factors and new therapies in EHEC-infected patients.

4. Materials and Methods

4.1. Generation of Bacterial Mutant Strains and Plasmids

Bacterial strains and plasmids used in this study are listed in Table 1.
All strains were generated by λ Red recombination. The strains 933W and DBS770 were transformed with pKD46 [60]. For the construction of the 933W strains, plasmids containing the reporter gene (Table 1) flanked by a kanamycin cassette surrounded by Flp-FRT sites (FRT aphT. FRT) were used as templates for PCR with the respective primers. For the recombination template, a PCR product was generated, containing the reporter gene and the resistance cassette using primers enclosing homology regions of the target region (~50–60 bp). Due to the identical design of the template plasmids, common reverse primers could be used. The combinations of template plasmid, forward and reverse primers are listed in Table S1. Correct insertion of the reporter was verified by PCR using the proof primers listed in Table S2. To construct C. rodentium mutants (DBSφ gluc, DBSφ glucΔlys), longer homology regions were required. Gibson assembly was used to create a template plasmid containing the reporter gene with the kanamycin resistance cassette flanked by the 400 bp region homologous to the target region of DBS770. Primers were designed with the NEBuilder tool (https://nebuilder.neb.com/ accessed on 1 June 2021). Genomic DNA of DBS770 was used as a template for the PCRs: GA DBS Stx2 up Fw and GA DBS Stx2 up Rev to amplify the region upstream of stx2A, and GA DBS Cm dn Fw and GA DBS Cm dn Rev to amplify the region upstream of the lysis gene and the chloramphenicol cassette that was used to generate DBS770. Thus, in DBSφ glucΔlys, the chloramphenicol cassette was removed. The gluc gene and the kanamycin cassette were amplified by PCR with the primers GA DBS GlucKan Fw and GA GlucKan Rev with a linearized pWRG701 as the template. Gibson assembly was performed with the three purified PCR products and pSB377 cut with BamHI and NotI according to the manufacturer’s (NEB) instructions. The resulting plasmid pMKB3 was linearized with EcoRI and used for λ Red recombination. The correct insertion of the construct was verified by PCR using the primers stx2A outside Fw and DBS770 outside Rev.

4.2. Bacterial Growth Conditions

If not otherwise stated, E. coli and C. rodentium strains were grown in 5 mL of LB medium for 12 h under mild aeration at 37 °C in test tubes in a rotor wheel. Antibiotic concentrations used were ampicillin (100 µg/mL) or kanamycin (30 µg/mL). Subcultures were set up (1:100) and grown in a rotor wheel until OD600 of ~0.5 was reached. The first subcultures were normalized to an OD600 = 0.1 and used for inoculation of experimental cultures in tubes (5 mL, triplicates) or 96-well flat-bottom plates (250 µL/well, triplicates) in LB. Experimental cultures were supplemented with mitomycin C (MitC; Roth; 0.5 μg/mL final concentration) and grown for 4–7 h or overnight (18–22 h) at 37 °C under mild aeration. OD600 was recorded at indicated times, and samples were taken for reporter quantification.

4.3. Luciferase Assays

At indicated time points, 250 µL of each subculture (in tubes) was taken, directly placed on ice and then spun down for 5min at 14,000× g/4 °C. The supernatants were transferred to a 96-well plate. In the case of the 96-well subcultures, at each time point, 50 µL was transferred to a fresh 96-well U-bottom plate placed on ice. This plate was centrifuged for 5 min at 3828× g/4 °C. The supernatant was carefully transferred to another plate. All 96-well plates (supernatant) and tubes with the pellets were frozen at −20 °C until the measurement was carried out. The pellets were thawed on ice and resuspended in a 180 µL assay buffer (H2O, Tris-HCl 10 mM, NaCl 0.6 M, EDTA 1 mM; adjust to pH 7.8 with HCl). A total of 50 µL of 0.1 mm glass beads (covered with assay buffer, pipetted up and down thoroughly) was added to the samples. Bacteria were lysed in a pre-cooled TissueLyser LT (4 °C) for 5 min at 50 Hz. Afterward, lysed samples were centrifuged for 5 min at 14,000× g at 4 °C, and 10 µL of the supernatant was used for measurements. Then, 10 µL supernatant/pellet lysate was transferred into an opaque white 96-well plate for measurement of luminescence levels. Adjacent wells were left empty to avoid spillover of the luminescence of very bright wells into the neighbor wells. For wells with Fluc reporters, luciferin reagent (Tricine 20 mM, (MgCO3)4Mg(OH)2 × 5H2O 1 mM, EDTA 0.1 M, D(-) luciferin 470 µM, DTT 33 mM, Li3-coenzym A 270 µM, Mg-ATP 530 µM, glycylglycine 125 µM) and, for Gluc reporters, coelenterazine (CTZ) reagent (coelenterazine 12.5 µM in assay buffer) were used as substrates for the luciferases. Evaluation of the luminescence levels was performed with the CLARIOstar plate reader and a standardized protocol with automated injection and measurement: 40 µL of the substrate (luciferin or CTZ) was injected into the 10 µL of sample followed by 1 s double orbital shaking (4 mm) and a 1 s luminescence measurement (no emission filter; gain 2200; optimized focal height).

4.4. Preparation of Samples for Confocal Fluorescence Microscopy

Bacteria were grown as described above. A total of 250 µL (OD600 1) of culture was spun down for 5 min at 4 °C and 8000 rpm. Pellets were resuspended with 250µL of ice-cold 1× phosphate buffer saline (PBS) and 750 µL of ice-cold 4% paraformaldehyde (PFA) in PBS and incubated for 1 h on ice. Subsequently, bacteria were washed three times with ice-cold PBS. Fixed bacteria were immobilized on poly-L-lysine-coated glass slides (Superfrost Plus, Thermo Scientific, Madrid, Spain) by drying. Immobilized bacteria were additionally fixed for 5min with 4% PFA in PBS and washed 3 times with PBS. Bacterial DNA was stained with 4′6-Diamidin-2-phenylindol (DAPI (1 µg/mL), Roth). Subsequently, bacteria were washed, dried in the dark and mounted with Vectashield (Vector) and then sealed with nail varnish. Using 63× oil objective and a magnification of 1 or 2.4, a minimum of 3 images were taken with a Leica SP5 confocal microscope.

4.5. Flow Cytometry

Bacteria were grown as described and diluted in filtered PBS to a concentration of 107 cfu/mL. Data were recorded by a FACS Canto II running FACSDiva software (Aria Becton Dickinson). Data were analyzed using the FlowJo software (Tree Star, Inc., Ashland, OR, USA).

4.6. Vero Cell Assay

Supernatants from C600W34 culture experiments were directly sterilized via 0.22 µm in-tube filtration (Corning Spin-X). A 1:10 dilution series of the supernatants were generated across a 96-flat-well plate. Vero cells (Vircell, Granada, Spain, reference number: FTVE, lot number: 11VE151) were grown in T75 flakes containing a cell medium of 5% DMEM (Thermo-Fischer) + Pen-Strep (100 U/mL) + L-glutamine (200 U/mL). At 100% confluency, cells were harvested by trypsinization. A total of 100 µL of media containing 2 × 10⁴ Vero cells was pipetted into each well of the plates with the dilution series of the supernatants. The plates were then incubated for 3 d at 37 °C with 5% CO2. The Vero cell assay was evaluated by measuring the optical density after the staining with crystal violet as previously described [64,65]. In short, after the incubation of 3 days, the supernatants in the plates were carefully discarded. A total of 50 µL formalin (2%) was added to each well for 2 min and then flicked out. Next, 50 µL of crystal violet solution (containing 0.13% crystal violet, 5% EtOH and 2% formalin) was added to each well for 2 min and then flicked out. After a washing step with 100 µL of H2Odd for 3 min, 150 µL of 50% EtOH was added, and the plates were softly shaken. Finally, absorbance (595 nm) was measured to quantify cells stained by crystal violet. The highest dilution at which at least 50% of Vero cells were killed (CD50) was defined by an absorption below 50% of the untreated control.

4.7. Statistical Analysis

Statistical analyses were performed with Graph Pad Prism Version 5.01. To compare several groups, ANOVA with Tukey’s multiple comparison test was performed.

Supplementary Materials

The following are available online at https://0-www-mdpi-com.brum.beds.ac.uk/article/10.3390/toxins13080534/s1, Table S1: Information for reporter strain construction, Table S2: Primers used in this study.

Author Contributions

Conceived and designed the experiments: M.B.K., J.G. and B.S. Performed the experiments: J.G., T.B., S.S., B.v.A. and M.B.K. Analyzed the data: M.B.K., J.G., T.B., B.v.A. and S.S. Contributed reagents/materials/analysis tools: R.G.G. and J.M.L. Wrote the paper: M.B.K. and B.S. All authors have read and agreed to the published version of the manuscript.

Funding

The work was funded by the German Center for Infection Research (DZIF) Grant-ID 503-4-7-06.705 and 503-4-8-06.803.

Institutional Review Board Statement

Not applicable.

Informed Consent Statement

Not applicable.

Data Availability Statement

Data is contained within the article or supplementary material.

Acknowledgments

We thank Ombeline Rossier and members of the Stecher lab for discussions.

Conflicts of Interest

The authors declare that no conflict of interest exists.

References

  1. Riley, L.W.; Remis, R.S.; Helgerson, S.D.; McGee, H.B.; Wells, J.G.; Davis, B.R.; Hebert, R.J.; Olcott, E.S.; Johnson, L.M.; Hargrett, N.T.; et al. Hemorrhagic colitis associated with a rare Escherichia coli serotype. N. Engl. J. Med. 1983, 308, 681–685. [Google Scholar] [CrossRef] [PubMed]
  2. Michino, H.; Araki, K.; Minami, S.; Takaya, S.; Sakai, N.; Miyazaki, M.; Ono, A.; Yanagawa, H. Massive outbreak of Escherichia coli O157:H7 infection in schoolchildren in Sakai City, Japan, associated with consumption of white radish sprouts. Am. J. Epidemiol. 1999, 150, 787–796. [Google Scholar] [CrossRef] [Green Version]
  3. Wong, C.S.; Mooney, J.C.; Brandt, J.R.; Staples, A.O.; Jelacic, S.; Boster, D.R.; Watkins, S.L.; Tarr, P.I. Risk factors for the hemolytic uremic syndrome in children infected with Escherichia coli O157:H7: A multivariable analysis. Clin. Infect. Dis. 2012, 55, 33–41. [Google Scholar] [CrossRef] [Green Version]
  4. Tserenpuntsag, B.; Chang, H.G.; Smith, P.F.; Morse, D.L. Hemolytic uremic syndrome risk and Escherichia coli O157:H7. Emerg. Infect. Dis. 2005, 11, 1955–1957. [Google Scholar] [CrossRef]
  5. Wong, C.S.; Jelacic, S.; Habeeb, R.L.; Watkins, S.L.; Tarr, P.I. The risk of the hemolytic-uremic syndrome after antibiotic treatment of Escherichia coli O157:H7 infections. N. Engl. J. Med. 2000, 342, 1930–1936. [Google Scholar] [CrossRef] [Green Version]
  6. Kakoullis, L.; Papachristodoulou, E.; Chra, P.; Panos, G. Shiga toxin-induced haemolytic uraemic syndrome and the role of antibiotics: A global overview. J. Infect. 2019, 79, 75–94. [Google Scholar] [CrossRef] [PubMed]
  7. Bielaszewska, M.; Mellmann, A.; Zhang, W.; Kock, R.; Fruth, A.; Bauwens, A.; Peters, G.; Karch, H. Characterisation of the Escherichia coli strain associated with an outbreak of haemolytic uraemic syndrome in Germany, 2011: A microbiological study. Lancet Infect. Dis. 2011. [Google Scholar] [CrossRef] [Green Version]
  8. Dasgupta, S.; Kitov, P.I.; Sadowska, J.M.; Bundle, D.R. Discovery of inhibitors of Shiga toxin type 2 by on-plate generation and screening of a focused compound library. Angew. Chem. Int. Ed. Engl. 2014, 53, 1510–1515. [Google Scholar] [CrossRef] [PubMed]
  9. Melton-Celsa, A.R.; O’Brien, A.D. New Therapeutic Developments against Shiga Toxin-Producing Escherichia coli. Microbiol. Spectr. 2014, 2. [Google Scholar] [CrossRef] [Green Version]
  10. Li, T.; Tu, W.; Liu, Y.; Zhou, P.; Cai, K.; Li, Z.; Liu, X.; Ning, N.; Huang, J.; Wang, S.; et al. A potential therapeutic peptide-based neutralizer that potently inhibits Shiga toxin 2 in vitro and in vivo. Sci. Rep. 2016, 6, 21837. [Google Scholar] [CrossRef] [Green Version]
  11. Luz, D.; Amaral, M.M.; Sacerdoti, F.; Bernal, A.M.; Quintilio, W.; Moro, A.M.; Palermo, M.S.; Ibarra, C.; Piazza, R.M.F. Human Recombinant Fab Fragment Neutralizes Shiga Toxin Type 2 Cytotoxic Effects in vitro and in vivo. Toxins (Basel) 2018, 10, 508. [Google Scholar] [CrossRef] [Green Version]
  12. Kavaliauskiene, S.; Dyve Lingelem, A.B.; Skotland, T.; Sandvig, K. Protection against Shiga Toxins. Toxins (Basel) 2017, 9, 44. [Google Scholar] [CrossRef]
  13. Endo, Y.; Tsurugi, K.; Yutsudo, T.; Takeda, Y.; Ogasawara, T.; Igarashi, K. Site of action of a Vero toxin (VT2) from Escherichia coli O157:H7 and of Shiga toxin on eukaryotic ribosomes. RNA N-glycosidase activity of the toxins. Eur. J. Biochem. 1988, 171, 45–50. [Google Scholar] [CrossRef]
  14. Bergan, J.; Dyve Lingelem, A.B.; Simm, R.; Skotland, T.; Sandvig, K. Shiga toxins. Toxicon 2012, 60, 1085–1107. [Google Scholar] [CrossRef]
  15. Melton-Celsa, A.R. Shiga Toxin (Stx) Classification, Structure, and Function. Microbiol. Spectr. 2014, 2. [Google Scholar] [CrossRef] [PubMed] [Green Version]
  16. Boisen, N.; Melton-Celsa, A.R.; Scheutz, F.; O’Brien, A.D.; Nataro, J.P. Shiga toxin 2a and Enteroaggregative Escherichia coli—A deadly combination. Gut Microbes 2015, 6, 272–278. [Google Scholar] [CrossRef] [PubMed] [Green Version]
  17. Johansen, B.K.; Wasteson, Y.; Granum, P.E.; Brynestad, S. Mosaic structure of Shiga-toxin-2-encoding phages isolated from Escherichia coli O157:H7 indicates frequent gene exchange between lambdoid phage genomes. Microbiology 2001, 147, 1929–1936. [Google Scholar] [CrossRef] [Green Version]
  18. Neely, M.N.; Friedman, D.I. Functional and genetic analysis of regulatory regions of coliphage H-19B: Location of shiga-like toxin and lysis genes suggest a role for phage functions in toxin release. Mol. Microbiol. 1998, 28, 1255–1267. [Google Scholar] [CrossRef] [PubMed] [Green Version]
  19. Los, J.M.; Los, M.; Wegrzyn, A.; Wegrzyn, G. Hydrogen peroxide-mediated induction of the Shiga toxin-converting lambdoid prophage ST2-8624 in Escherichia coli O157:H7. FEMS Immunol. Med. Microbiol. 2010, 58, 322–329. [Google Scholar] [CrossRef] [PubMed] [Green Version]
  20. Zhang, X.; McDaniel, A.D.; Wolf, L.E.; Keusch, G.T.; Waldor, M.K.; Acheson, D.W. Quinolone antibiotics induce Shiga toxin-encoding bacteriophages, toxin production, and death in mice. J. Infect. Dis. 2000, 181, 664–670. [Google Scholar] [CrossRef]
  21. Kimmitt, P.T.; Harwood, C.R.; Barer, M.R. Toxin gene expression by shiga toxin-producing Escherichia coli: The role of antibiotics and the bacterial SOS response. Emerg. Infect. Dis. 2000, 6, 458–465. [Google Scholar] [CrossRef] [PubMed] [Green Version]
  22. Bielaszewska, M.; Idelevich, E.A.; Zhang, W.; Bauwens, A.; Schaumburg, F.; Mellmann, A.; Peters, G.; Karch, H. Effects of antibiotics on Shiga toxin 2 production and bacteriophage induction by epidemic Escherichia coli O104:H4 strain. Antimicrob. Agents Chemother. 2012, 56, 3277–3282. [Google Scholar] [CrossRef] [Green Version]
  23. Pacheco, A.R.; Sperandio, V. Shiga toxin in enterohemorrhagic E.coli: Regulation and novel anti-virulence strategies. Front. Cell Infect. Microbiol. 2012, 2, 81. [Google Scholar] [CrossRef] [Green Version]
  24. Rasko, D.A.; Moreira, C.G.; Li de, R.; Reading, N.C.; Ritchie, J.M.; Waldor, M.K.; Williams, N.; Taussig, R.; Wei, S.; Roth, M.; et al. Targeting QseC signaling and virulence for antibiotic development. Science 2008, 321, 1078–1080. [Google Scholar] [CrossRef] [PubMed] [Green Version]
  25. Nowicki, D.; Rodzik, O.; Herman-Antosiewicz, A.; Szalewska-Palasz, A. Isothiocyanates as effective agents against enterohemorrhagic Escherichia coli: Insight to the mode of action. Sci. Rep. 2016, 6, 22263. [Google Scholar] [CrossRef] [PubMed] [Green Version]
  26. Pifer, R.; Sperandio, V. The Interplay between the Microbiota and Enterohemorrhagic Escherichia coli. Microbiol. Spectr. 2014, 2. [Google Scholar] [CrossRef] [Green Version]
  27. Licznerska, K.; Dydecka, A.; Bloch, S.; Topka, G.; Nejman-Falenczyk, B.; Wegrzyn, A.; Wegrzyn, G. The Role of the Exo-Xis Region in Oxidative Stress-Mediated Induction of Shiga Toxin-Converting Prophages. Oxid. Med. Cell. Longev. 2016, 2016, 8453135. [Google Scholar] [CrossRef] [PubMed] [Green Version]
  28. Shimizu, T.; Ohta, Y.; Tsutsuki, H.; Noda, M. Construction of a novel bioluminescent reporter system for investigating Shiga toxin expression of enterohemorrhagic Escherichia coli. Gene 2011, 478, 1–10. [Google Scholar] [CrossRef]
  29. Livny, J.; Friedman, D.I. Characterizing spontaneous induction of Stx encoding phages using a selectable reporter system. Mol. Microbiol. 2004, 51, 1691–1704. [Google Scholar] [CrossRef] [Green Version]
  30. Tyler, J.S.; Beeri, K.; Reynolds, J.L.; Alteri, C.J.; Skinner, K.G.; Friedman, J.H.; Eaton, K.A.; Friedman, D.I. Prophage induction is enhanced and required for renal disease and lethality in an EHEC mouse model. PLoS Pathog. 2013, 9, e1003236. [Google Scholar] [CrossRef] [Green Version]
  31. Pedelacq, J.D.; Cabantous, S.; Tran, T.; Terwilliger, T.C.; Waldo, G.S. Engineering and characterization of a superfolder green fluorescent protein. Nat. Biotechnol. 2006, 24, 79–88. [Google Scholar] [CrossRef]
  32. Tannous, B.A.; Kim, D.E.; Fernandez, J.L.; Weissleder, R.; Breakefield, X.O. Codon-optimized Gaussia luciferase cDNA for mammalian gene expression in culture and in vivo. Mol. Ther. 2005, 11, 435–443. [Google Scholar] [CrossRef] [PubMed]
  33. O’Brien, A.D.; Newland, J.W.; Miller, S.F.; Holmes, R.K.; Smith, H.W.; Formal, S.B. Shiga-like toxin-converting phages from Escherichia coli strains that cause hemorrhagic colitis or infantile diarrhea. Science 1984, 226, 694–696. [Google Scholar] [CrossRef]
  34. Spriewald, S.; Stadler, E.; Hense, B.A.; Munch, P.C.; McHardy, A.C.; Weiss, A.S.; Obeng, N.; Muller, J.; Stecher, B. Evolutionary Stabilization of Cooperative Toxin Production through a Bacterium-Plasmid-Phage Interplay. mBio 2020, 11. [Google Scholar] [CrossRef]
  35. Konowalchuk, J.; Speirs, J.I.; Stavric, S. Vero response to a cytotoxin of Escherichia coli. Infect. Immun. 1977, 18, 775–779. [Google Scholar] [CrossRef] [Green Version]
  36. Mallick, E.M.; McBee, M.E.; Vanguri, V.K.; Melton-Celsa, A.R.; Schlieper, K.; Karalius, B.J.; O’Brien, A.D.; Butterton, J.R.; Leong, J.M.; Schauer, D.B. A novel murine infection model for Shiga toxin-producing Escherichia coli. J. Clin. Investig. 2012, 122, 4012–4024. [Google Scholar] [CrossRef] [PubMed]
  37. Lenz, A.; Tomkins, J.; Fabich, A.J. Draft Genome Sequence of Citrobacter rodentium DBS100 (ATCC 51459), a Primary Model of Enterohemorrhagic Escherichia coli Virulence. Genome Announc. 2015, 3. [Google Scholar] [CrossRef] [Green Version]
  38. Muhlen, S.; Ramming, I.; Pils, M.C.; Koeppel, M.; Glaser, J.; Leong, J.; Flieger, A.; Stecher, B.; Dersch, P. Identification of Antibiotics That Diminish Disease in a Murine Model of Enterohemorrhagic Escherichia coli Infection. Antimicrob. Agents Chemother. 2020, 64. [Google Scholar] [CrossRef]
  39. Magaziner, S.J.; Zeng, Z.; Chen, B.; Salmond, G.P.C. The Prophages of Citrobacter rodentium Represent a Conserved Family of Horizontally Acquired Mobile Genetic Elements Associated with Enteric Evolution towards Pathogenicity. J. Bacteriol. 2019, 201. [Google Scholar] [CrossRef] [Green Version]
  40. Valdivia, R.H.; Falkow, S. Fluorescence-based isolation of bacterial genes expressed within host cells. Science 1997, 277, 2007–2011. [Google Scholar] [CrossRef] [PubMed] [Green Version]
  41. Dunstan, S.J.; Simmons, C.P.; Strugnell, R.A. Use of in vivo-regulated promoters to deliver antigens from attenuated Salmonella enterica var. Typhimurium. Infect. Immun. 1999, 67, 5133–5141. [Google Scholar] [CrossRef] [PubMed] [Green Version]
  42. Aviv, G.; Gal-Mor, O. lacZ Reporter System as a Tool to Study Virulence Gene Regulation in Bacterial Pathogens. Methods Mol. Biol. 2018, 1734, 39–45. [Google Scholar] [CrossRef] [PubMed]
  43. Tyler, J.S.; Mills, M.J.; Friedman, D.I. The operator and early promoter region of the Shiga toxin type 2-encoding bacteriophage 933W and control of toxin expression. J. Bacteriol. 2004, 186, 7670–7679. [Google Scholar] [CrossRef] [Green Version]
  44. Suardana, I.W.; Pinatih, K.J.P.; Widiasih, D.A.; Artama, W.T.; Asmara, W.; Daryono, B.S. Regulatory elements of stx2 gene and the expression level of Shiga-like toxin 2 in Escherichia coli O157:H7. J. Microbiol. Immunol. Infect. 2018, 51, 132–140. [Google Scholar] [CrossRef] [PubMed] [Green Version]
  45. Friedman, D.I.; Court, D.L. Transcription antitermination: The lambda paradigm updated. Mol. Microbiol. 1995, 18, 191–200. [Google Scholar] [CrossRef] [Green Version]
  46. Spriewald, S.; Glaser, J.; Beutler, M.; Koeppel, M.B.; Stecher, B. Reporters for Single-Cell Analysis of Colicin Ib Expression in Salmonella enterica Serovar Typhimurium. PLoS ONE 2015, 10, e0144647. [Google Scholar] [CrossRef]
  47. Aertsen, A.; Van Houdt, R.; Michiels, C.W. Construction and use of an stx1 transcriptional fusion to gfp. FEMS Microbiol. Lett. 2005, 245, 73–77. [Google Scholar] [CrossRef]
  48. Huerta-Uribe, A.; Marjenberg, Z.R.; Yamaguchi, N.; Fitzgerald, S.; Connolly, J.P.; Carpena, N.; Uvell, H.; Douce, G.; Elofsson, M.; Byron, O.; et al. Identification and Characterization of Novel Compounds Blocking Shiga Toxin Expression in Escherichia coli O157:H7. Front. Microbiol. 2016, 7, 1930. [Google Scholar] [CrossRef] [Green Version]
  49. Wagner, P.L.; Livny, J.; Neely, M.N.; Acheson, D.W.; Friedman, D.I.; Waldor, M.K. Bacteriophage control of Shiga toxin 1 production and release by Escherichia coli. Mol. Microbiol. 2002, 44, 957–970. [Google Scholar] [CrossRef]
  50. Calderwood, S.B.; Mekalanos, J.J. Iron regulation of Shiga-like toxin expression in Escherichia coli is mediated by the fur locus. J. Bacteriol. 1987, 169, 4759–4764. [Google Scholar] [CrossRef] [Green Version]
  51. Berger, M.; Aijaz, I.; Berger, P.; Dobrindt, U.; Koudelka, G. Transcriptional and Translational Inhibitors Block SOS Response and Shiga Toxin Expression in Enterohemorrhagic Escherichia coli. Sci. Rep. 2019, 9, 18777. [Google Scholar] [CrossRef]
  52. McGannon, C.M.; Fuller, C.A.; Weiss, A.A. Different classes of antibiotics differentially influence shiga toxin production. Antimicrob. Agents Chemother. 2010, 54, 3790–3798. [Google Scholar] [CrossRef] [Green Version]
  53. Wiles, S.; Ferguson, K.; Stefanidou, M.; Young, D.B.; Robertson, B.D. Alternative luciferase for monitoring bacterial cells under adverse conditions. Appl. Environ. Microbiol. 2005, 71, 3427–3432. [Google Scholar] [CrossRef] [PubMed] [Green Version]
  54. Ogura, Y.; Mondal, S.I.; Islam, M.R.; Mako, T.; Arisawa, K.; Katsura, K.; Ooka, T.; Gotoh, Y.; Murase, K.; Ohnishi, M.; et al. The Shiga toxin 2 production level in enterohemorrhagic Escherichia coli O157:H7 is correlated with the subtypes of toxin-encoding phage. Sci. Rep. 2015, 5, 16663. [Google Scholar] [CrossRef] [Green Version]
  55. Blattner, F.R.; Plunkett, G., 3rd; Bloch, C.A.; Perna, N.T.; Burland, V.; Riley, M.; Collado-Vides, J.; Glasner, J.D.; Rode, C.K.; Mayhew, G.F.; et al. The complete genome sequence of Escherichia coli K-12. Science 1997, 277, 1453–1474. [Google Scholar] [CrossRef] [PubMed] [Green Version]
  56. Moller, A.K.; Leatham, M.P.; Conway, T.; Nuijten, P.J.; de Haan, L.A.; Krogfelt, K.A.; Cohen, P.S. An Escherichia coli MG1655 lipopolysaccharide deep-rough core mutant grows and survives in mouse cecal mucus but fails to colonize the mouse large intestine. Infect. Immun. 2003, 71, 2142–2152. [Google Scholar] [CrossRef] [PubMed] [Green Version]
  57. Appleyard, R.K. Segregation of New Lysogenic Types during Growth of a Doubly Lysogenic Strain Derived from Escherichia coli K12. Genetics 1954, 39, 440–452. [Google Scholar] [CrossRef]
  58. Schauer, D.B.; Zabel, B.A.; Pedraza, I.F.; O’Hara, C.M.; Steigerwalt, A.G.; Brenner, D.J. Genetic and biochemical characterization of Citrobacter rodentium sp. nov. J. Clin. Microbiol. 1995, 33, 2064–2068. [Google Scholar] [CrossRef] [Green Version]
  59. Gerlach, R.G.; Holzer, S.U.; Jackel, D.; Hensel, M. Rapid engineering of bacterial reporter gene fusions by using Red recombination. Appl. Environ. Microbiol. 2007, 73, 4234–4242. [Google Scholar] [CrossRef] [Green Version]
  60. Datsenko, K.A.; Wanner, B.L. One-step inactivation of chromosomal genes in Escherichia coli K-12 using PCR products. Proc. Natl. Acad. Sci. USA 2000, 97, 6640–6645. [Google Scholar] [CrossRef] [Green Version]
  61. Mirold, S.; Rabsch, W.; Rohde, M.; Stender, S.; Tschape, H.; Russmann, H.; Igwe, E.; Hardt, W.D. Isolation of a temperate bacteriophage encoding the type III effector protein SopE from an epidemic Salmonella typhimurium strain. Proc. Natl. Acad. Sci. USA 1999, 96, 9845–9850. [Google Scholar] [CrossRef] [Green Version]
  62. Wille, T.; Blank, K.; Schmidt, C.; Vogt, V.; Gerlach, R.G. Gaussia princeps luciferase as a reporter for transcriptional activity, protein secretion, and protein-protein interactions in Salmonella enterica serovar typhimurium. Appl. Environ. Microbiol. 2012, 78, 250–257. [Google Scholar] [CrossRef] [PubMed] [Green Version]
  63. Wang, R.F.; Kushner, S.R. Construction of versatile low-copy-number vectors for cloning, sequencing and gene expression in Escherichia coli. Gene 1991, 100, 195–199. [Google Scholar] [CrossRef]
  64. Gentry, M.K.; Dalrymple, J.M. Quantitative microtiter cytotoxicity assay for Shigella toxin. J. Clin. Microbiol. 1980, 12, 361–366. [Google Scholar] [CrossRef] [PubMed] [Green Version]
  65. Tran, S.L.; Billoud, L.; Lewis, S.B.; Phillips, A.D.; Schuller, S. Shiga toxin production and translocation during microaerobic human colonic infection with Shiga toxin-producing E. coli O157:H7 and O104:H4. Cell. Microbiol. 2014, 16, 1255–1266. [Google Scholar] [CrossRef] [PubMed] [Green Version]
Figure 1. Genetic organization of reporter strains. (A) Genetic organization of the stxΦ locus wild-type allele and reporter location E. coli and C. rodentium strains. For the “Lytic reporter”, the reporter gene (list is shown in B) and the kanamycin resistance cassette (aphT) replaces stx2AB genes, and the phage lysis genes remain intact. For the “Non-lytic reporter”, the reporter gene and aphT also replaces part of the phage lysis genes. (B) List of reporter genes and abbreviations used in the study. (C) Schematic view of the pT7 reporter plasmid pJLG1-harboring T7 promoter-driven sfgfp gene.
Toxins 13 00534 g001
Figure 2. Characterization of E. coli sfgfp reporter strains. Single-copy and T7-based signal-amplified E. coli reporter strains were grown in LB or in LB supplemented with 0.5 µg/mL MitC at 0 h. (A) OD600 was recorded at indicated time points (mean ± StD of 3 independent experiments). (B) At time point 5 h, bacteria were analyzed for sfGFP signal intensities by flow cytometry. The geometric mean of sfGFP fluorescence (3 independent experiments) is plotted. (C) Fluorescent microscopic images of cultures of CWT7pol pPT7sfgfp and CWT7polΔlys pPT7sfgfp ± MitC. Green: sfGFP. Blue: DAPI. Statistical analysis was performed using ANOVA with Tukey’s multiple comparison test (* p < 0.05, ** p < 0.01, *** p < 0.001).
Toxins 13 00534 g002
Figure 3. Comparison of E. coli stx2-Fluc versus -Gluc reporter strains. Reporter strains (CWfluc, CWflucΔlys, CWgluc and CWglucΔlys) in E. coli C600W34 background and control strains were grown in LB (left panels) or in LB supplemented with 0.5 µg/mL MitC (right panels) over the course of 20 h. MitC was added at time point 0. (A) Growth kinetics as monitored by OD600. Fluc and Gluc luciferase activity in the culture supernatant (B) and in intact bacteria (pellet) at indicated time points with respect to MitC treatment (C). The relative luminescence units (RLUs) for a fixed volume of 10 µL (mean ± StD of 3 biological replicates) are shown.
Toxins 13 00534 g003
Figure 4. Comparison of Gluc and Stx2 release kinetics in CWgluc and C600W34. (A) Overnight cultures of E. coli C600W34 and CWgluc were grown in 5 mL of LB medium until an OD600 of 0.5. Afterward, bacteria were diluted either in LB or in LB supplemented with MitC (0.5 µg/mL) to an OD600 of 0.1. Bacteria were then incubated with shaking at 37 °C for 18 h. At indicated time points, culture supernatant was sampled and analyzed for Gluc activity (B) or Stx2 activity by Vero cell assay (C). For the Vero cell assay, samples were incubated in 1:2 dilutions (with PBS) in 96-well plates with Vero cells (2 × 10⁴ cells/well) for 3 d. Afterward, cell death was quantified by crystal violet staining. The reciprocal of the highest dilution at which at least 50% of Vero cells were killed 1/(CD50) is depicted. Data are shown as mean ± standard deviation of 3 replicates.
Toxins 13 00534 g004
Figure 5. Comparison of Gluc reporter assay in tubes and 96-well format. Precultures of reporter strains CWgluc (A) or CWglucΔlys (B) in E. coli C600W34 background were grown in LB until mid-log phase (OD600 of approximately 0.5). Afterward, bacteria were diluted either in LB or in LB supplemented with MitC (0.5 µg/mL) to an OD600 of 0.1. The 250 µL/well (96-well plate) and 4 mL/tube were transferred and incubated at 37 °C while shaking. Samples were taken at indicated time points, and Gluc activity was measured as described in Materials and Methods in the culture supernatant depicted as RLU per 10µL supernatant. Data are shown as mean ± standard deviation of 3 replicates.
Toxins 13 00534 g005
Figure 6. Growth and Gluc release by C. rodentium Gluc reporter strains. Precultures of reporter strains DBSgluc or DBSglucΔlys in C. rodentium ϕstx2dact background were grown in LB until mid-log phase (OD600 of approximately 0.5). Afterward, bacteria were diluted either in LB or in LB supplemented with MitC (0.5 µg/mL) to an OD600 of 0.1. Samples were taken at different time points after incubation at 37 °C while shaking, and OD600 was determined (A,B). Gluc activity was measured in the culture supernatant depicted as RLU per 10 µL (C,D). Data are shown as mean ± standard deviation of 3 replicates.
Toxins 13 00534 g006
Table 1. Bacteria and plasmids used in this study.
E. coli StrainsDesignationDescription/GenotypeReference
DH5αEcDH5αF Φ80lacZΔM15 Δ(lacZYA-argF) U169 recA1 endA1 hsdR17(rk, mk+) phoA supE44 thi-1 gyrA96 relA1 λInvitrogen
MG1655EcMG1655E. coli K-12 strain MG1655, F λ ilvG rfb-50 rph-1; RifR, SmR[55,56]
C600C600 [57]
C600W34C600W34E. coli C600 transduced with phage 933W from EHEC strain EDL933[33]
MBK1CW sfgfpC600W34 stx2A::sfgfp aphTThis study
MBK4CW sfgfpΔlysC600W34 stx2AB SR::sfgfp aphT, phage lysis-deficient strainThis study
MBK6CW flucC600W34 stx2A::fluc aphTThis study
MKB7CW flucΔlysC600W34 stx2AB SR::fluc aphT, phage lysis-deficient strainThis study
JLG5CW glucC600W34 stx2A::gluc aphT[38]
JLG6CW glucΔlysC600W34 stx2AB SR::gluc aphT, phage lysis-deficient strainThis study
JLG11CW T7polC600W34 stx2A::T7pol aphTThis study
JLG12CW T7polΔlysC600W34 stx2AB SR::T7pol aphT, phage lysis-deficient strainThis study
C. rodentium Strains
DBS100DBS100Citrobacter rodentium wild-type strain[58]
DBS770DBSφC. rodentium transduced with phage stx2φ17220[36]
MBK22DBSφ glucΔlysDBS770 stx2AB SR::gluc aphT, phage lysis-deficient strainThis study
MBK23DBSφ glucDBS770 stx2A::gluc aphT[38]
Plasmids
p3121 High-copy vector, colE1-replicon; carries firefly luc aphT flanked by FRT sequences; ampicillin resistance[59]
pKD46 Temperature-sensitive replication (repA101ts); encodes λ-Red genes (exo, bet, gam); native terminator (tL3) after exo gene; arabinose-inducible promoter for expression (ParaB); encodes araC for repression of ParaB promoter; ampicillin resistance[60]
pMBK3 pSB377stx2AB SR Cm::gluc,aphTThis study
pMBK4 pSB377stx2aA::gluc,aphT[38]
pSB377 tetAB oriR6K[61]
pJLG1 pM955, PT7::sfgfp Amp100[34]
pJLG2 p2795, T7 gene 1 aphT Amp100, Kan30[34]
pACYC184 New England Biolabs
pWRG7 High-copy vector, colE1-replicon; carries sfgfp aphT flanked by FRT sequences; ampicillin resistance[46]
pWRG215 High-copy vector, colE1-replicon; carries Gaussia luciferase (flash kinetics) GlucM43 aphT flanked by FRT sequences; ampicillin resistance[62]
pWRG701 High-copy vector, colE1-replicon; carries Gaussia luciferase (glow kinetics) GlucM43LM110L aphT flanked by FRT sequences; ampicillin resistance[38]
pWKS30 Low-copy vector; pSC101-based replicon; ampicillin-resistance marker[63]
Publisher’s Note: MDPI stays neutral with regard to jurisdictional claims in published maps and institutional affiliations.

