Article

In Vitro Biological Control of Aspergillus flavus by Hanseniaspora opuntiae L479 and Hanseniaspora uvarum L793, Producers of Antifungal Volatile Organic Compounds

by
Paula Tejero
1,2,
Alberto Martín
1,2,
Alicia Rodríguez
1,2,*,
Ana Isabel Galván
3,
Santiago Ruiz-Moyano
1,2 and
Alejandro Hernández
1,2
1
Food Quality and Microbiology, School of Agricultural Engineering, University of Extremadura, Avda. de Adolfo Suárez, s/n, 06007 Badajoz, Spain
2
University Institute for Research in Agri-Food Resources (INURA), University of Extremadura, Avda. de la Investigación, s/n, 06006 Badajoz, Spain
3
Finca La Orden-Valdesequera Research Centre (CICYTEX), Horticulture, Junta de Extremadura, 06187 Badajoz, Spain
*
Author to whom correspondence should be addressed.
Submission received: 9 August 2021 / Revised: 28 August 2021 / Accepted: 8 September 2021 / Published: 17 September 2021

Abstract

:
Aspergillus flavus is a toxigenic fungal colonizer of fruits and cereals and may produce one of the most important mycotoxins from a food safety perspective, aflatoxins. Therefore, its growth and mycotoxin production should be effectively avoided to protect consumers’ health. Among the safe and green antifungal strategies that can be applied in the field, biocontrol is a recent and emerging strategy that needs to be explored. Yeasts are normally good biocontrol candidates to minimize mold-related hazards and their modes of action are numerous, one of them being the production of volatile organic compounds (VOCs). To this end, the influence of VOCs produced by Hanseniaspora opuntiae L479 and Hanseniaspora uvarum L793 on growth, expression of the regulatory gene of the aflatoxin pathway (aflR) and mycotoxin production by A. flavus for 21 days was assessed. The results showed that both yeasts, despite producing different kinds of VOCs, had a similar effect on inhibiting growth, mycotoxin biosynthetic gene expression and phenotypic toxin production overall at the mid-incubation period when their synthesis was the greatest. Based on the results, both yeast strains, H. opuntiae L479 and H. uvarum L793, are potentially suitable as a biopreservative agents for inhibiting the growth of A. flavus and reducing aflatoxin accumulation.
Key Contribution: Two yeast strains, producers of volatile organic compounds, seem to be an effective strategy to control toxigenic Aspergillus flavus.

1. Introduction

Aflatoxins are a group of 18 highly toxic secondary metabolites produced mainly by species belonging to the genus Aspergillus. Among them, aflatoxins B1, B2, G1 and G2 and their metabolic products, aflatoxins M1 and M2, are the most common and threatening ones because of dietary exposure. Multiple health effects have been described related to aflatoxin exposure, such as hepatotoxicity [1], immunotoxicity [2], genotoxicity [3], changes in the microbial population of the gut [4] and reproductive damage [5]. Specifically, aflatoxin B1 has been classed as group I by the International Agency for Research on Cancer, which implies that this compound is carcinogenic to humans [6]. It has been reported that exposure of consumers to aflatoxin B1 is related to cancer in the lungs [7] and liver [8]. In order to protect consumer health, on the basis of a risk assessment, the European Commission has set maximum limits of 5–12 µg/kg for aflatoxin B1 and 4–15 µg/kg for the sum of aflatoxins B1, B2, G1 and G2 for oilseeds, almonds, pistachios and nuts, dried fruits, maize and cereals and spices [9].
The most worrying aflatoxin-producing species mainly belong to Aspergillus section Flavi [10]. Among the 33 species belonging to Aspergillus section Flavi, Aspergillus flavus, together with Aspergillus parasiticus, is the most concerning one. Dietary exposure to aflatoxins synthesized by this species takes place primarily because of the colonization and development of aflatoxigenic strains of vegetable-origin foods with a low water activity (aw) and high polysaccharide content, at both preharvest and post-harvest stages. For example, A. flavus has been isolated from maize-derived products [11,12], paprika [13] and dried figs [14].
Ecophysiological factors, primarily aw and temperature [15], strongly affect growth and aflatoxin synthesis. Temperatures close to 30 °C and high aw values (≈0.99 aw) encourage A. flavus growth, while optimal conditions for aflatoxin production are usually linked to suboptimal growth conditions [16,17,18]. The control of relative humidity and temperature during processing and storage of raw materials, ingredients and food products is an effective strategy for diminishing mold damage. However, there are other strategies that have been reported in recent years. Passone et al. [19] proposed the combination of four antioxidants to inhibit A. flavus development in peanuts. In addition, various essential oils, such as Satureja hortensis [20], turmeric, summer savory, clove [21], cinnamon [22] and Curcuma longa [23], present antifungal and antiaflatoxigenic properties. Furthermore, chemical fungicides, which provoke environmental and consumer health problems, are used extensively to control the growth of unwanted filamentous fungi in the field [24].
Biological control seems to be another valuable and promising strategy to control A. flavus. Thus, some studies have evaluated the ability of some microorganisms to control the growth of this toxigenic species, e.g., Bueno et al. [25] checked the capacity of Lactobacillus casei and Lactobacillus rhamnosus to acidify the medium, and Zhang et al. [26] tested the synthesis of antifungal compounds by Bacillus subtillis. Another strategy based on biological control is the selection and application of nontoxigenic strains [27,28].
In addition, the utilization of various yeast species, such as Saccharomyces cerevisiae, in a concentration-dependent manner [29], and Pichia anomala, which may inhibit spore production [30], is another effective antagonistic strategy that can be implemented against A. flavus.
The production of antifungal volatile organic compounds (VOCs) by biocontrol agents is one of the least explored mechanisms for the control of unwanted fungal development. Jaibangyang et al. [31] found that 49 out of 330 yeast strains were VOC producers and showed activity against A. flavus development. Candida nivariensis achieved a good level of fungal control and inhibition of aflatoxin contamination, associated with the synthesis of 1-pentanol. The compound 2-phenylethanol, the main VOC produced by P. anomala, has been linked to the inhibition of spore germination, growth, toxin production and gene expression of A. flavus [30]. In addition, it has been described that blockage or alterations in the expression of genes associated with mycotoxin biosynthesis is produced by the presence of antagonistic yeast [32]. The ubiquity of A. flavus and its capacity to synthesize aflatoxins in a wide range of nutritional and environmental conditions make necessary the search for efficient strategies to minimize the impact of the presence of this toxigenic mold species and mycotoxin accumulation in foods. To the best of our knowledge, there are no studies examining the production of VOCs by antagonistic yeast and their effect on aflatoxin biosynthetic genes and further phenotypic production. For this reason, it is important to identify VOCs produced by selected antagonistic yeasts in the presence of the toxigenic mold strain of interest and to investigate their influence on both mycotoxin production and the expression of a key gene involved in the aflatoxin biosynthesis pathway.
The aims of this work were to: (a) identify the VOCs produced by two yeast strains (Hanseniaspora opuntiae L479 and Hanseniaspora uvarum L793) in the presence of A. flavus and (b) examine the effectiveness of VOCs produced by the two antagonistic yeast strains on growth, the expression of the regulatory aflR gene involved in aflatoxin biosynthesis and phenotypic mycotoxin production.

2. Results and Discussion

2.1. Identification of Volatile Organic Compounds Produced by Antagonistic Yeasts

In this work, the identification of VOCs produced by the two yeasts in the presence of A. flavus was carried out. This was important for an in-depth analysis of whether these volatile compounds were really the main cause of reduced or minimized growth and aflatoxin production in this pathogenic fungus.
Eighty-eight different volatile compounds were identified in three batches of DDS (AF, AF + L793, AF + L479) during the 21-day incubation. The compounds identified belonged to acids (7), aldehydes (6), aromatic compounds (12), ethers (1), esters (16), furans (3), hydrocarbons (24), cyclic hydrocarbons (3), ketones (3), alcohols (8), sulphurs (1), terpenes (2) and miscellaneous compounds (2). In batches AF + L793 and AF + L479, the relative abundance of the family of volatile compounds based on total area of volatile compounds encountered was 2.87 and 1.97 times, respectively, higher than those found in the control batch (AF). The relative abundance of the family of volatile compounds was characterized by 33.38% hydrocarbons, 29.35% aromatic compounds and 15.38% alcohols in control samples without antagonistic yeasts. In the case of batch AF + L479, this was made up of 52.17% acids, 13.00% aromatic compounds, and 19.78% hydrocarbons. Finally, in the case of batch AF + L793, average values of 43.78% esters, 24.77% alcohols, 14.64% aromatic compounds and 12.25% hydrocarbons were shown. Significant differences (p ≤ 0.05) were found in other minority families of volatile compounds such as aldehydes, with 3.28%, 0.50% and 1.21% relative abundances for batches AF, AF + L479 and AF + L793, respectively.
Table 1 shows those VOCs that presented differences among the three batches and their mean relative abundances in each confrontation. In total, 22 compounds out of 88 presented differences among treatments. Eight of these compounds belonged to esters, four to acids, three to alcohols, two to benzene derived compounds, two to hydrocarbons, one to aldehydes, one to ketones and one to furans. In the case of batch AF + L479, H. opuntiae L479 produced large amounts of acetic acid (43.38%) in the presence of A. flavus. Other acids such as 2-methylbutanoic acid (6.91%) and isobutyric acid (1.45%) presented greater (p ≤ 0.05) relative abundances in batch AF + L479, whereas the alcohols, 2-methylbutanol and isoamyl alcohol decreased in relative abundances (p ≤ 0.001) with respect to their content in the remaining two batches (AF and AF + L793). The production of acetic acid by apiculate yeasts has been well documented [33,34], while volatile fatty acids such as 2-methylbutanoic acid and isobutyric acid have been associated with yeast metabolism during apple cider production [35]. The presence of 2-methylbutanoic acid in apple juice reduced Penicillium expansum growth; conversely, these compounds produced an increase in patulin accumulation [36]. Differences in the production of branched alcohols such as 2-methylbutanol and isoamyl alcohol among Hanseniaspora species have been proven previously [37,38].
In batch AF + L793, an increase in the abundances of esters, such as ethyl acetate (18.18%), isoamyl acetate (9.60%), 2-phenylethyl acetate (8.46%) and 2-methylbutyl acetate (3.27%), and alcohols, such as isoamyl alcohol (12.77%), 2-methyl-1-butanol (11.54%) and phenethyl alcohol (4.56%), was observed. These esters, with fruity, green and honey odors [35], have been associated with the metabolism of different Hanseniaspora species. For example, Hanseniaspora osmophila and Hanseniaspora guilliermondii increased the content of 2-phenylethyl acetate during wine fermentation [39,40]. Several of these esters and alcohols produced by yeasts have demonstrated antifungal properties. Ruiz-Moyano et al. [41] associated the control of Botrytis cinerea with the volatile esters produced by H. uvarum L793 cited before and other minority esters such as furfuryl acetate. Candida maltose produced isoamyl acetate with fungistatic properties against Aspergillus brasilensis [42]. Pichia anomala, a producer of 2-phenylethyl alcohol, has been described as an effective antagonist against Aspergillus flavus [30], in agreement with di Francesco et al. [43], who found that 2-pehnylethyl alcohol was the most active compound produced by Aureobasidium pullulans against different molds.
The composition of VOCs varied throughout the 21 days of the assay depending on the compound family. Figure 1 shows a principal component analysis (PCA) relating days of analysis to VOCs synthesized by yeasts utilized as biocontrol agents. With respect to the confrontation between A. flavus and H. opuntiae L479 (batch AF + L479; Figure 1A,B), the PCA of the three components explained 55.53% of the variability. Volatile compounds presented in batch AF (control batch), mainly composed of alcohols and hydrocarbons, were placed on the positive axis of principal component 1 (PC1) and the negative axis of PC3. The main VOCs produced by the yeast (acetic acid, 2-methylbutanoic acid and isobutyric acid) were associated with the first sampling days (3, 6 and 10 days) on the positive axis of principal component 2. Volatile compounds present on the last days of confrontations (days 15 and 21) for batches AF (control) and AF + L479 were associated with hydrocarbons and alcohols in the center of three axes.
PCA of the confrontations of A. flavus with H. uvarum L793 (batch AF + L793; Figure 1C,D) across the days of the assay explained 61.28% of the variability. On the first sampling days, this was related to esters, alcohols and aromatic compounds on the positive axes of PC1 and PC3. On the last days of incubation, compounds of AF + L793 were grouped with AF (control batch) and presented an association with hydrocarbons in the negative axes of the three principal components.
The analysis of the evolution of the volatile profile of DDS batches showed that potential compounds involved in the control of A. flavus by antagonistic yeast were mainly produced in the first 12 days of the assay. Figure 2 shows the evolution of the main volatile compounds produced by the two antagonistic yeasts with respect to the initial day of analysis. Acetic acid, the most abundant volatile produced by L479, reached its maximum production at day 3, and then there was a steady decline (≈40%). After a rise in the production of the other two acids, isobutyric acid and 2-methylbutyl acid, their levels were 1.63 ± 0.00 and 1.43 ± 0.09 times higher at day 6 than at day 3, respectively; there was a noticeable decrease in values lower than the limit of detection during the remaining incubation period (Figure 2A). The main alcohols synthesized by L793, isoamyl alcohol and 2-methyl butanol, were mostly produced at days 9 and 12, respectively. Maximal production of esters was observed at 3 or 6 days of incubation (Figure 2B). Interestingly, these results disagree with the findings of Contarino et al. [44], which revealed changes in the rate of ethyl alcohol and ethyl acetate production by different antagonistic yeast species. These changes were dependent on yeast strains but, in general, ethyl alcohol was highly accumulated in the first 5 days of analysis, and ethyl acetate was the main accumulated compound after 9 days of incubation. In this study, the maximum quantities of esters as isoamyl acetate and 2-methylbutyl acetate were produced before the alcohols isoamyl alcohol and 2-methylbutyl alcohol. Previous works indicated a high capacity for ester production by Kloeckera apiculata (anamorph of H. uvarum), and hydrolyzed esters by esterases, with the possible use of acetate as a carbon source [45].
An analysis of VOCs of the two yeast-inoculated batches (AF + L479 and AF + L793) showed that both yeasts mainly synthesized such antifungal compounds during the first 12 days of the assay. However, the profiles of VOCs produced by both yeasts were different, while L479 mainly produced acetic acid, 2-methylbutanoic acid and isobutyric acid, L793 synthesized various esters, alcohols and aromatic compounds, with the main ones being 2-methyl-1-butanol and isoamyl alcohol.

2.2. Influence of VOCs on Growth Parameters of Aspergillus Flavus

The effect of VOCs produced by the two yeast strains tested in this study by their antagonistic activity on growth parameters of A. flavus was evaluated in order to analyze their capacity to inhibit or control A. flavus development.
Table 2 shows the size of mycelia, lag phase prior to growth and growth rate of A. flavus in the presence and absence of the two antagonistic yeasts (L479 and L793) during a 21-day incubation period at 25 °C. The mold in the absence of the yeasts grew from 13.55 ± 0.55 mm at day 3 to 75.20 ± 0.42 mm at day 21. A significant reduction in growth (p ≤ 0.05) on all sampling days was observed when H. uvarum L793 was coinoculated with A. flavus. The presence of H. opuntiae L479 reduced A. flavus growth (p ≤ 0.050) from day 3 to day 12 of incubation.
In the presence of L793 (batch L793 + AF), a maximum reduction in the size of A. flavus mycelium (34.43%) was achieved at 3 days of incubation, while a reduction of 17.10% was observed at 10 days of incubation in the presence of L479 (batch AF+ L479). Regarding the lag phase prior to growth, A. flavus had a shorter lag phase when inoculated alone (0.58 days) than when co-inoculated with L479 (0.87 days) and L793 (1.07 days). In the linear phase of growth, the growth rate of the control treatment was 4.58 ± 0.03 mm/day. Significant declines (p < 0.001) in the growth rates were observed when A. flavus was exposed to VOCs from antagonistic yeast strains. Growth rates of 4.00 ± 0.08 and 3.54 ± 0.08 mm/day were obtained for A. flavus growing in the presence of H. opuntiae L479 and H. uvarum L793, respectively.
The reduction in growth parameters of molds by VOC-producing yeasts can be attributed to inter-species differences. Hanseniaspora opuntiae L479 and H. uvarum L793 reduced both mycelial diameter and growth rate and significantly increased the lag phase of A. flavus. Other yeast species such as A. pullulans, Filobasidium oeirense and Vishniacozyma carnescens inhibited B. cinerea development by VOC production [41]. Jaibangyang et al. [31] found 46 out of 49 which reduced A. flavus mycelial growth. The high prevalence of antifungal VOC-producing strains and their high biocontrol throughout the production of volatiles could be related to the effect of CO2 and its synergy with VOCs [44]. Candida nivariensis was found to be the most effective yeast whose activity was associated with the production of alcohols such as 1-pentanol, 3-methyl-1-butanol and 2-methyl-1-propanol [31] beyond CO2.
It seems that the presence of VOCs can control the growth of A. flavus, inhibiting its mycelium diameter and lengthening the lag phase prior to growth and slowing down the growth rate of this pathogenic filamentous fungi. This effect was more pronounced when L793 was used and up to day 15 of incubation.

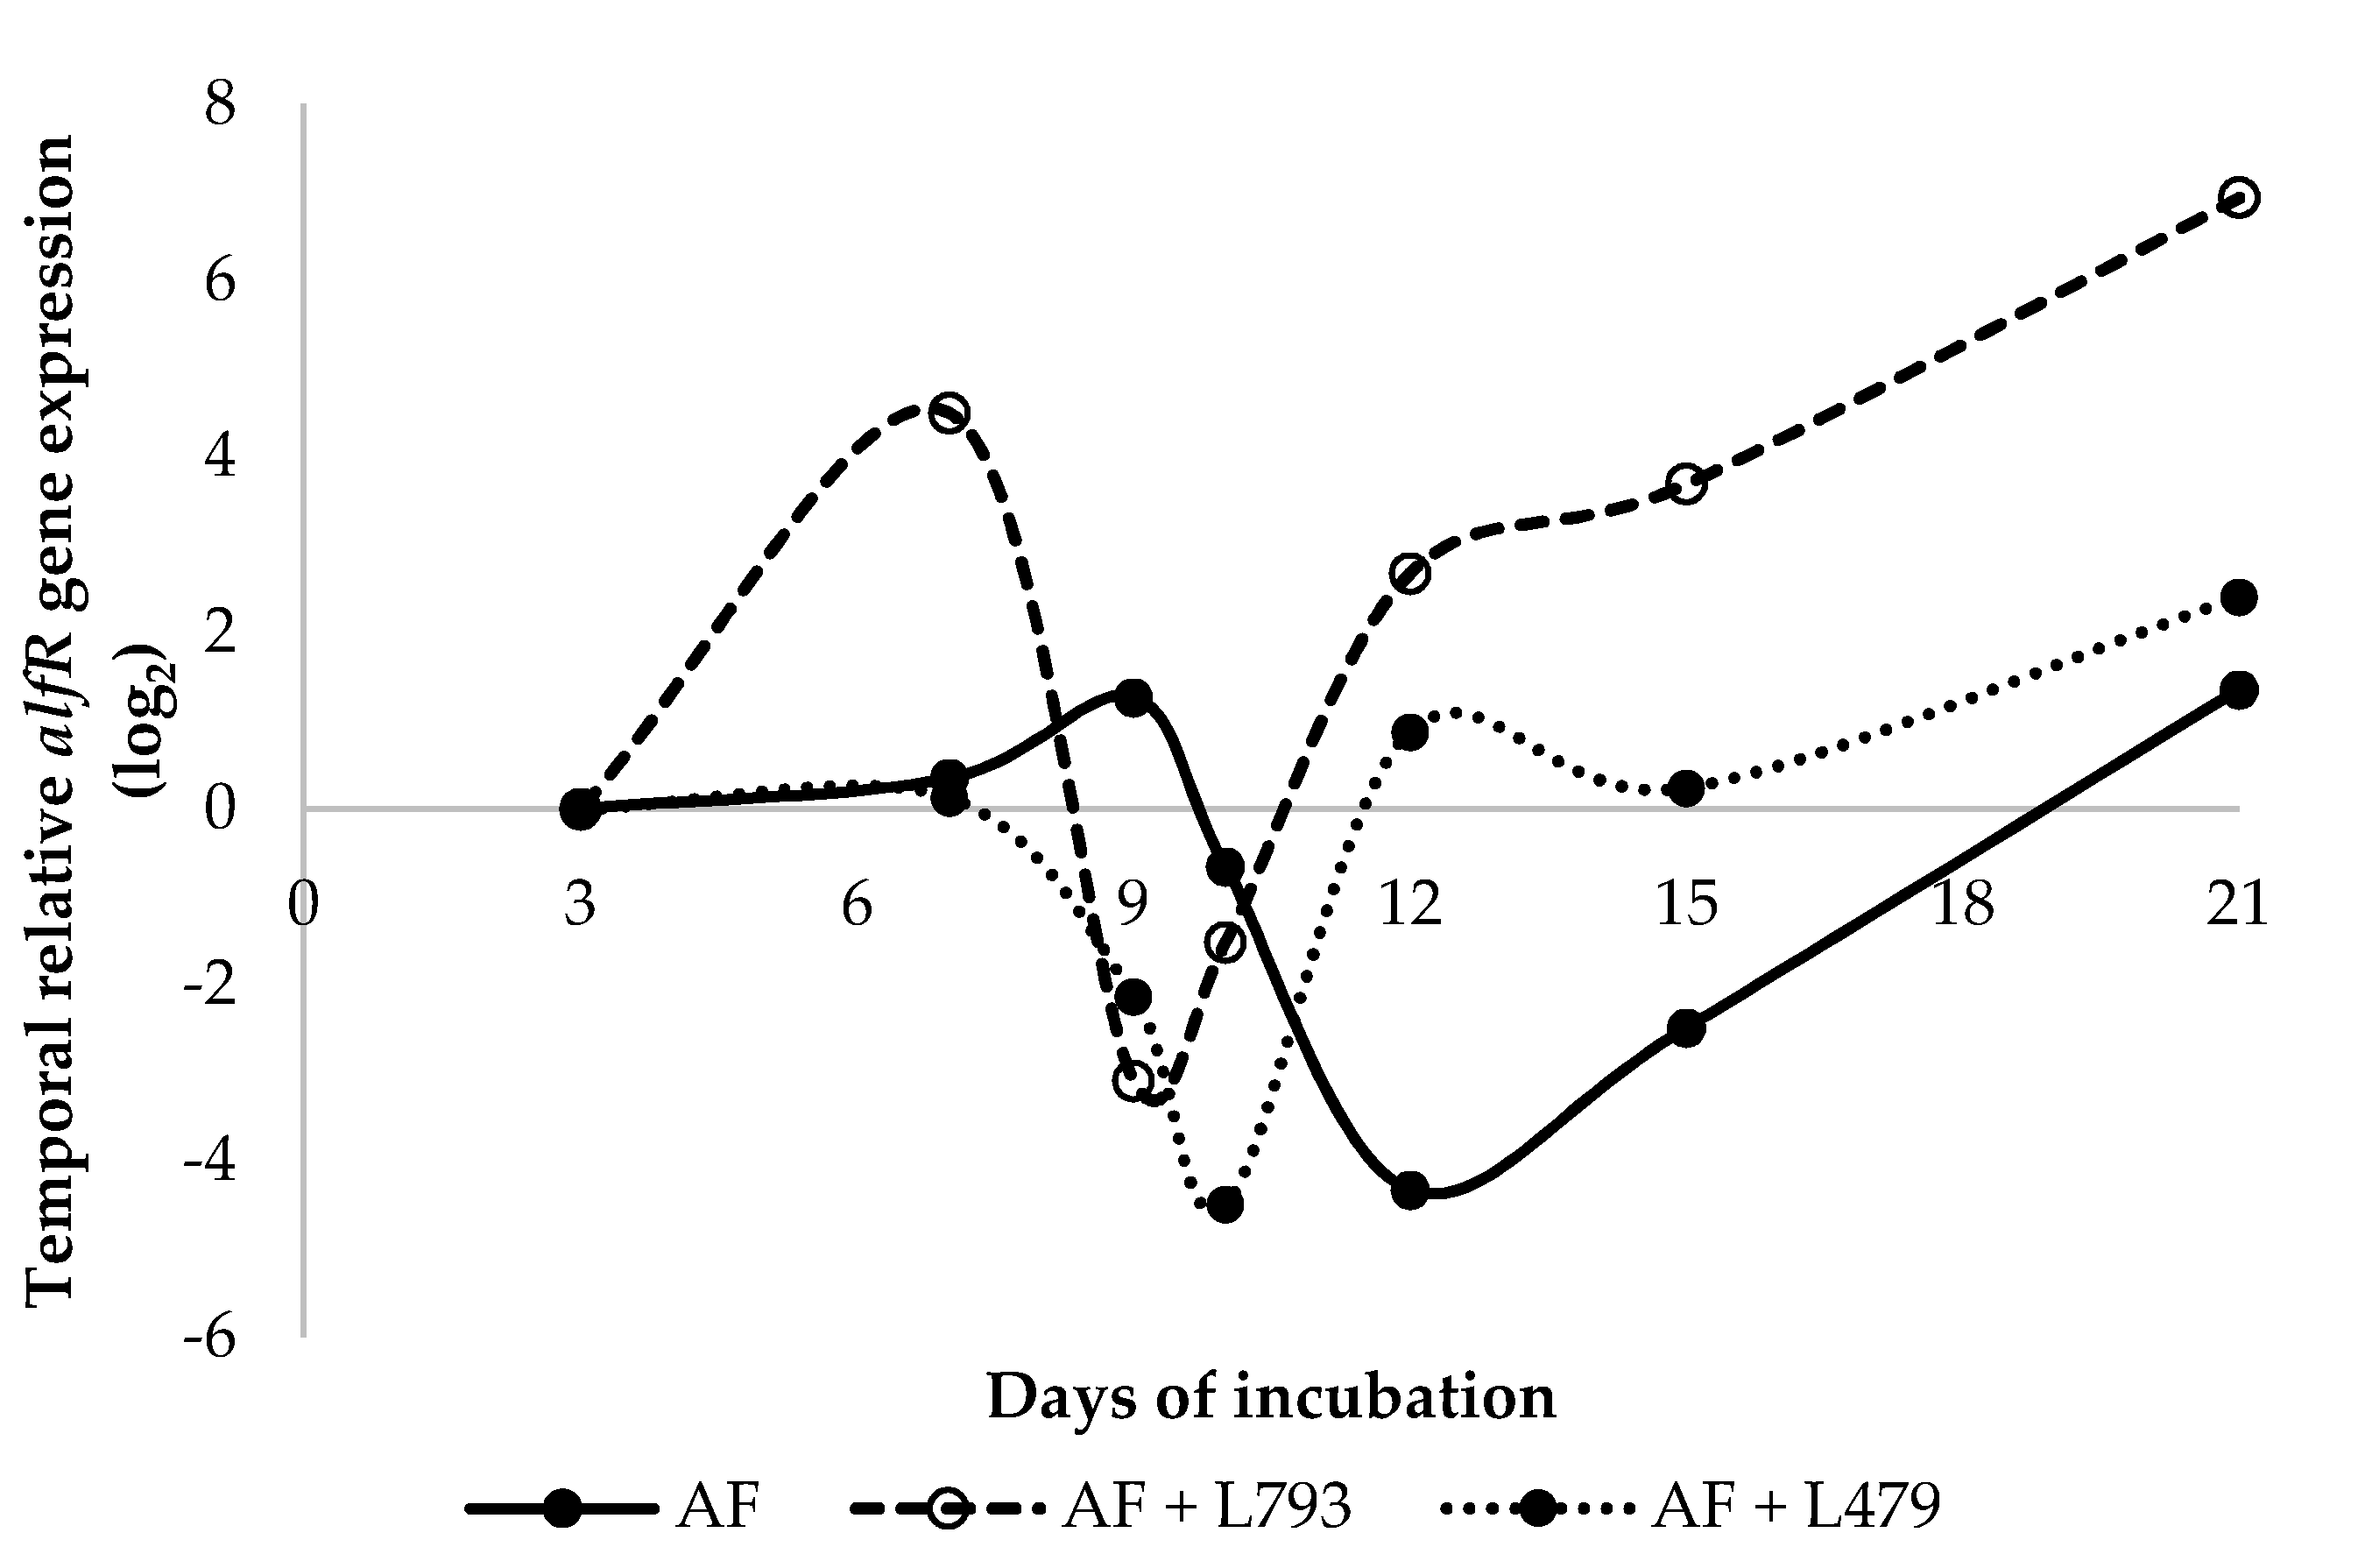
2.3. Gene Expression

The effect of VOCs produced by the two antagonistic yeasts on the temporal relative aflR gene expression by A. flavus over a 21-day incubation period was evaluated (Figure 3). The aflR gene is a key regulatory gene involved in the aflatoxin pathway [46], and its expression has been associated with aflatoxin production under different experimental conditions [47,48]. The relative expression of the target gene at different sampling times was evaluated and compared with that in the control samples when A. flavus was grown in the absence (AF) and presence (AF + L479, AF + L793) of yeasts at 3 days of incubation. As can be observed in Figure 3, there were changes in the expression of the target gene throughout the incubation time. These changes agree with other studies that demonstrate that the expression of aflatoxin-related genes normally varies over time [48,49,50]. Regarding the control batch (AF), after a slow rise, where a maximum value of aflR gene expression was observed at day 9 of incubation, there was a steady decline in gene expression values before they increased again up until to the end of the incubation time. The results of the temporal relative aflR gene expression of the control batch (AF) agree with those found in previous studies. Schmidt-Heydt et al. [51,52,53] suggested that the expression of aflatoxin-related genes was optimal after 8–10 days of growth. Regarding both yeast- and A. flavus-inoculated batches (AF + L479 and AF + L793), in general, their aflR gene expression patterns were quite similar (Figure 3), with only small differences. In the case of batch AF + L479, aflR gene expression values remained constant during the first 6 days of incubation before decreasing noticeably at days 9–10 of incubation and then increasing considerably at day 12. Later, after a slight decrease, there was a gene expression activation on day 21. In the case of batch AF + L793, there was a dramatic rise in aflR gene expression on day 6 of incubation. After that, substantial inhibition of expression of this gene was observed on day 9 of incubation. Next, aflR gene expression values generally increased at each incubation time to reach their highest levels at the end of the incubation period (21 days). Results from both batches inoculated with yeast producers of VOCs cannot be compared with those of previous studies, since this is the first time that temporal relative gene expression profiles have been carried out in order to determine the influence of these antifungal compounds on the expression of a mycotoxin–gene biosynthetic pathway. It is important to highlight that, at day 9 of incubation, VOCs produced by the yeast strains L793 and L479, respectively, could inactivate aflR gene expression only when the maximum expression of this gene was found in the control batch (AF), in accordance with findings published by Schmidt-Heydt et al. [51], who demonstrated that the expression of the aflR gene reached its maximum at 9–10 days of incubation. In addition, it is also significant to point out that the aflR gene expression values of batches AF + L479 and AF + L793 were higher than those encountered in the control batch (AF) at the final sampling time (21 days).
Figure 4 shows the expression of the aflR gene by A. flavus when confronted with VOCs produced by yeasts L479 and L793 at each incubation time. The results show that there was an inhibition of the expression of the aflatoxin regulatory gene at days 9 and 10 of incubation in the presence of VOCs synthesized by the two yeasts, as well as at the first sampling day (3 days) in the case of L793. Moreover, activation of the expression of the aflatoxin-related gene was observed from day 12 of incubation until the end of the incubation period. These results coincided with previous studies demonstrating that a biocontrol agent does not always provoke inhibition of the expression of a mycotoxin-biosynthetic gene [47,54]. The presence of antifungal compounds may activate such mycotoxin biosynthetic routes.

2.4. Aflatoxin Amounts

Figure 5 shows the effect of VOCs produced by H. opuntiae L479 and H. uvarum L793 on AFB1 and AFB2 production by A. flavus during a 21-day incubation period. Both aflatoxins were inhibited in the presence of VOCs produced by both yeasts (p < 0.001 and p = 0.003, respectively). However, AFB1 amounts were significantly higher than AFB2 quantities produced by the aflatoxigenic strain in the presence and absence of both yeast strains (p ≤ 0.050). These results agree with those previously published by Schmidt-Heydt et al. [51] and Galván et al. [18].
Regarding AFB1, the amount produced by A. flavus in the control batch on the first sampling day (day 3) was 451 ± 621 ppb. The amount of toxin increased considerably from day 3 to day 15 (19,813 ± 981 ppb) and then fell substantially in the final days of incubation (3102 ± 5372 ppb). The quantities of AFB1 in the presence of antagonistic yeasts began with 47 ± 11 and 3 ± 3 ppb for the AF + L479 and AF + L793 batches, respectively. The presence of AFB1 remained stable in the AF + L479 confrontations from day 7 to day 21, with concentrations around 5000–6000 ppb. A peak of AFB1 production was observed at 12 days in the AF + L793 batch, with values of 11,669 ± 5554 ppb. Finally, no AFB1 was detected at 21 days of incubation in this batch. Generally, AFB1 amounts were inhibited by the action of VOCs produced by both yeasts at each incubation time. From day 3 to day 10 of incubation, both yeasts had a similar effect on toxin synthesis; however, on day 12 of incubation, L479 provoked a higher reduction in toxin amounts than L793, while on the last three incubation days tested, the last yeast strain had a greater influence on minimizing the amount of AFB1 synthesized by A. flavus. These findings coincide with those reported by Al-Saad et al. [47] and Peromingo et al. [54], who used biocontrol agents to control the carcinogenic toxin amounts produced by this filamentous fungal species. Thus far, no studies have been conducted to evaluate the impact of VOCs synthesized by microorganisms on mycotoxin production.
In terms of AFB2 production, the amounts of this toxin varied between 0.9 and 334 ppb in the control batch, but this increase was not constant throughout the incubation time: a main peak of production was observed at day 10 of incubation and a secondary peak at day 15 of incubation. In the case of batches AF + L479 and AF + L793, A. flavus produced similar quantities of this mycotoxin that practically levelled off throughout the incubation time. The main difference found between the two abovementioned batches was that, in the presence of strain L479, A. flavus synthesized AFB2 at the end of the incubation period, whereas, in the presence of strain L793, it did not. In this case, the greatest inhibition of production of this toxin by VOCs produced by both yeasts was encountered at day 10 of incubation.

3. Conclusions

This study proved that the two antagonistic yeasts evaluated in this work (H. opuntiae L479 and H. uvarum L793) mainly produced VOCs in the presence of A. flavus during the first 12 days of incubation. Although the VOCs synthesized by the two yeast strains were chemically different, their influence on A. flavus development and colonization was quite similar. H. uvarum L793 strictly controlled this toxigenic filamentous fungus throughout the entire incubation period; however, the two yeasts had a similar inhibitory effect on the expression of the aflatoxin regulatory gene aflR and mycotoxin production overall at the midpoint of the incubation period (9–10 days) when the synthesis of VOCs by yeasts reached its maximum. Based on the results, both yeast strains, H. opuntiae L479 and H. uvarum L793, are potentially suitable as biopreservative agents for inhibiting the growth of A. flavus and reducing aflatoxin accumulation. It seems that the application of both antagonistic yeast strains at the early post-harvest stages of fruit or cereals is critical to minimize health hazards due to aflatoxin development in these types of products. In further studies, inoculation of H. opuntiae L479 and H. uvarum L793 several times during the post-harvest handling of these vegetable-origin foods should be evaluated.

4. Materials and Methods

4.1. VOC-Producing Yeasts

Two different strains representing different species of antifungal-VOC-producing yeast were used in this work. H. opuntiae L479 and H. uvarum L793 were previously selected for their capacity to produce antifungal VOCs [41]. Cryogenized yeast strains were inoculated on acidified (10% tartaric acid, Sharlab, Barcelona, Spain) potato dextrose agar (PDA, Scharlab) and incubated at 25 °C for 48 h. A loop of the fresh yeast culture was recovered and resuspended in sterile distilled water. Cells were counted using a Neubauer chamber, adjusted to a final concentration of 2 × 10⁷ cells/mL and used as inocula. Both yeast strains can be ceded to other research groups for scientific purposes by a material transfer agreement between both research groups.

4.2. Aspergillus Flavus Strain

The A. flavus CQ8 strain was taken from the Fungi Culture Collection of the Agricultural Engineering School (Extremadura University, Badajoz, Spain) and was previously characterized by Casquete et al. [13]. Cryogenized conidia were seeded on acidified PDA and cultivated at 25 °C until complete sporulation. Conidia were recovered with 0.05% of Tween 80 solution (v/v, Sigma-Aldrich, Madrid, Spain) and quantified by direct observation in an optical microscope with a Neubauer chamber. Conidia solution was diluted up to 106 conidia/mL and used as inoculum.

4.3. Competitiveness of VOC-Producing Yeasts against Aspergillus Flavus Assessed Using Double-Dish Systems

The antagonistic yeast strains (H. uvarum L793 and H. opuntiae L479) and A. flavus were confronted in double-dish systems (DDS) essentially as described by Ruiz-Moyano et al. [41]. Briefly, 5 µL of A. flavus inoculum was inoculated onto the center of the bottom PDA plate, which had previously been covered by a porous cellophane disc (Packaging Limited, UK). Then, 100 µL of each of the two antagonistic yeast solutions was inoculated separately with a Digralsky spatula on the upper plate. Subsequently, both Petri plates were joined with a piece of ParafilmTM. Finally, four holes (3 mm × 5 mm) were perforated in the union of both plates. A control set of DDS was performed without the presence of antagonistic yeasts. The study was composed of three DDS batches: (a) AF + L793 (A. flavus in the presence of H. uvarum L793), (b) AF + L479 (A. flavus in the presence of H. opuntiae L479) and (c) AF (A. flavus in the absence of yeasts, control batch). The three batches were stored at 25 °C, and sampling was carried out at 3, 7, 9, 10, 11, 12, 15 and 21 days of incubation. Growth parameters, aflR gene expression and aflatoxin production were determined on each sampling day. The assay was conducted twice, and three replicates were performed for each repetition.

4.4. Analysis of Volatile Compounds

Extraction and analysis of VOCs produced by the two yeast strains in the presence and absence of the filamentous fungus were conducted as described by Ruiz-Moyano et al. [41]. These volatile compounds were extracted by using a 10-mm long, 75-μm thick fiber coated with carboxen/polydimethylsiloxane from the space of each DDS by solid-phase microextraction (SPME) (Supelco, Bellefonte, PA, USA). The origin of volatile compounds from PDA and A. flavus was assigned by extraction and analyses of batch AF.
After volatile compound extraction, analyses were conducted by gas chromatography mass spectrometry (GC/MS) using an Agilent 6890 GC-5973 MS system (Agilent Technologies, Little Falls, DE, USA) equipped with a 5% phenyl-95% polydimethylsiloxane column (30 m × 0.32 mm inner diameter, 1.05 μm film thickness, Hewlett-Packard). The Kovats index of the compounds was calculated by analysis of n-alkanes (R-8769, Sigma Chemical Co., St. Louis, MO, USA) run under the same conditions as the samples. The NIST/EPA/NIH mass spectrum library (comparison quality > 90%) and Kovats index were used to identify the volatile compounds produced by the two yeast strains. Additionally, the identity of certain compounds was confirmed by a comparison of the retention time and MS spectra, using a laboratory-built MS spectral database, obtained from chromatographic runs of pure compounds performed under the same experimental conditions by using the same equipment. Quantitative data were obtained from the total ion current chromatograms by integration of the GC peak areas.
The volatile compounds associated with yeast strains in batches AF + L479 and AF + L793 were determined by comparison of volatile compounds found in such batches with those encountered in a PDA control without yeast inocula and in batch AF (batch control inoculated only with A. flavus). The production of those volatile compounds that were not detected in both control PDA and PDA inoculated with A. flavus (batch AF), or those whose relative abundances were significantly lower than those encountered in yeast-inoculated batches (AF + L479 and AF + L793), was exclusively linked to the strains H. opuntiae L479 and H. uvarum L793 according to the methodology described in Ruiz-Moyano et al. [41].

4.5. Determination of Growth Parameters of Aspergillus Flavus

The diameter of the A. flavus colony was measured in two perpendicular directions and recorded on each sampling day. Growth curves were obtained by graphical representation of the mycelium diameter (mm) against the incubation times (days). Data plots showed, after a lag phase, a linear trend with time; therefore, a linear model was applied. The growth rate (µ; mm/day) was determined from the slope of the growth curve during the linear phase of growth. The lag phase (λ; days) was determined from the linear regression equation equaling the regression line formula to the original inoculum size (diameter, mm) according to León et al. [55].

4.6. Relative Quantification of the Expression of the aflR Gene

4.6.1. Sample Preparation

After each incubation period, the mycelium was scraped from the surface and collected under sterile conditions, quickly frozen in liquid nitrogen and stored at −80 °C until RNA extraction.

4.6.2. RNA Extraction

Frozen mycelium was used for RNA extraction with the SpectrumTM Plant Total RNA Kit (Sigma-Aldrich). RNA concentration (µg/mL) and purity (A260/A280 ratio) were determined using a 1.5-μL aliquot on a NanoDropTM spectrophotometer (Thermo Fisher Scientific, Madrid, Spain). Samples were diluted to 0.1 μg/μL and treated with DNAse I (Thermo Fisher Scientific) to remove genomic DNA traces that could be co-extracted with RNA.

4.6.3. Two-Step Reverse-Transcription Real-Time PCR

Retrotranscription Reaction

Synthesis of complementary DNA (cDNA) was carried out using 5 µL of total RNA according to the manufacturer’s instructions of the PrimeScript™ RT reagent Kit (Takara Bio Inc., Kusatsu, Shiga, Japan). The reaction conditions were incubation at 37 °C for 15 min and reverse transcriptase inactivation at 85 °C for 5 s. Then, cDNA samples were stored at −20 °C until gene expression analysis.

Real-Time PCR Reactions

The real-time PCR (qPCR) reactions were conducted in a 7300 Real-Time PCR System (Applied Biosystems, Carlsbad, CA, USA) using SYBR® Green technology. The amplification of aflR and β-tubulin genes was conducted according to the methodology described by Peromingo et al. [48].
Briefly, the final volume of the reaction mixture for the amplification of each gene was 12.5 μL and consisted of 6.25 μL of SYBR® Premix Ex Taq™ (Takara Bio Inc., Kusatsu, Japan), 0.05μL of ROX plus (Takara Bio Inc.) and 2.5μL of cDNA template. For the aflR gene, the final concentration of the primer pair AflRTaq1/AflRTaq2 was 300 nM each, while that of the primers F-TUBjd/R-TUBjd used to amplify the β-tubulin gene was 400 nM each.
The thermal cycling conditions for amplification of both genes included one initial denaturation step at 95 °C for 10 min, and 40 cycles at 95 °C for 15 s and 60 °C for 30 s. After the final PCR cycle, melting curve analyses of the PCR products were conducted and checked to ensure the fidelity of the results.
The quantification cycle (Cq), the cycle in which fluorescence reaches a defined threshold, was automatically calculated by the instrument using the default parameters of the 7300 Fast System Software (Applied Biosystems).

4.6.4. Calculation of Relative Gene Expression

Relative quantification of the expression of the aflR gene was basically performed as previously detailed by Peromingo et al. [48]. The expression ratio was calculated using the 2−ΔΔCT method [56]. The β-tubulin gene was used as an endogenous control. Calibrators corresponded to the A. flavus strain grown in the absence of yeast (batch AF, control), and the samples were incubated for 3 days (first sampling day).

4.7. Aflatoxin Analysis

Aflatoxin extraction was conducted per the method described by Ruiz-Moyano et al. [57], with some modifications. The content of one Petri dish was transferred to a filter plastic bag and macerated with 100 mL of chloroform in a Stomacher Lab-Blender 400 (Seward Medical, Worthing, UK) for 2 min. After 1 h in darkness at room temperature, the slurry was filtered twice through anhydrous sodium sulphate with Whatman no. 1 filter paper (Whatman International, Maidstone, UK). Then, the filtrate was evaporated in a rotatory evaporator model Hei-Vap (Heidolph, Schwabach, Germany) at 37 °C. The residue was resuspended in 6 mL of chloroform, transferred to a new tube and evaporated to dryness in a Myvac vacuum centrifuge evaporator (Genevac, Winchester, UK) heated to 37 °C. The residue was resuspended in 1 mL of HPLC-grade methanol, followed by the addition of 1 mL of HPLC-grade water and filtered through a 0.22-μM pore-size filter into HPLC vials for quantification.
Aflatoxin concentration was determined using an Agilent 1100 Series HPLC system (Agilent Technologies, USA) coupled to a fluorescence detector (Agilent) using a SUPELCOSIL LC-18 column (15 cm × 4.6 mm, 5-µm particle size; Supelco, Bellefonte, PA, USA) after post-column derivatization with pyridinium bromide at 0.005% (w/v; Sigma). The post-column derivatization reagents were pumped at 0.3 mL/min by means of an HPLC pump from an Agilent 1100 Series HPLC apparatus. The fluorescence detector was set to excitation and emission wavelengths of 360 and 430 nm, respectively. Separation of aflatoxins was achieved with a mobile phase containing a mixture of MeOH:ACN:water (20:20:60 v/v/v), which was delivered at an isocratic flow rate of 1 mL/min. All solvents used were of HPLC grade (Thermo Fisher Scientific). The injection volume was 100 μL and calibrations were carried out with an aflatoxin mix standard (AFB1, AFB2, AFG1 and AFG2) purchased from Sigma-Aldrich.

4.8. Statistical Analysis of Results

Data for growth parameters, aflatoxin production, relative gene expression and volatile compound areas at each sampling day of confrontations were analyzed separately using IBM SPSS Statistics, Version 19.0. (Armonk, NY, USA: IBM Corp.). Differences in the mean values of parameters were tested by one-way analysis of variance (ANOVA) followed by Tukey’s honestly significant difference test (p ≤ 0.050). In addition, PCA was performed to relate the days of analysis to the family of VOCs synthesized by the yeasts (H. opuntiae L479 and H. uvarum L793) utilized as biocontrol agents in this study to control A. flavus.

Author Contributions

Conceptualization, A.M., A.R. and A.H.; Formal Analysis, P.T., A.R. and A.H.; Funding Acquisition: A.M. and A.H.; Investigation: P.T., A.M., A.R., S.R.-M., and A.H.; Methodology: P.T., A.R., A.M., A.I.G., S.R.-M., and A.H.; Project Administration: A.M. and A.H.; Supervision: A.R., A.M., and A.H.; Validations: A.M., A.R., A.I.G., and A.H.; Visualization: P.T., A.M., A.R. and A.M., Resources: A.M., S.R.-M. and A.H.; Writing—Original Draft Preparation: A.R. and A.H.; Writing—Review and Editing: P.T., A.R., A.M., A.I.G., S.R.-M. and A.H. All authors have read and agreed to the published version of the manuscript.

Funding

This research was funded by the Spanish Ministry of Science, Innovation and Universities, grant number RTI2018-096882-B-I00 and the Junta de Extremadura and FEDER grant number GR18098 and GR18165.

Institutional Review Board Statement

Not applicable.

Informed Consent Statement

Not applicable.

Data Availability Statement

The data presented in this study are available in Tejero, P.; Martín, A.; Rodríguez, A.; Galván, A.I.; Ruíz-Moyano, S.; Hernandez, A. In Vitro Biological Control of Aspergillus flavus by Hanseniaspora opuntiae L479 and Hanseniaspora uvarum L793, Producers of Antifungal Volatile Organic Compounds. Toxins 2021, 13, 663, doi:10.3390/toxins13090663.

Acknowledgments

Mariano Cabrera and Juan Hernández-Barneto are acknowledged for their excellent technical support.

Conflicts of Interest

The authors declare no conflict of interest. The funders had no role in the design of the study; in the collection, analyses or interpretation of data; in the writing of the manuscript or in the decision to publish the results.

References

  1. Abdel-Wahhab, M.A.; Ahmed, H.H.; Hagazi, M.M. Prevention of aflatoxin B1-initiated hepatotoxicity in rat by marine algae extracts. J. Appl. Toxicol. 2006, 26, 229–238. [Google Scholar] [CrossRef]
  2. Meissonnier, G.M.; Pinton, P.; Laffitte, J.; Cossalter, A.M.; Gong, Y.Y.; Wild, C.P.; Bertin, G.; Galtier, P.; Oswald, I.P. Immunotoxicity of aflatoxin B1: Impairment of the cell-mediated response to vaccine antigen and modulation of cytokine expression. Toxicol. Appl. Pharmacol. 2008, 231, 142–149. [Google Scholar] [CrossRef] [PubMed]
  3. Scientific Committee for Food. Reports of the Scientific Committee for Food. In Opinion of the Scientific Committee for Food on Aflatoxins, Ochratoxin A and Patulin; 35th Series; The European Union: Luxembourg, 1994; p. 45. [Google Scholar]
  4. Wang, J.; Tang, L.; Glenn, T.C.; Wang, J.S. Aflatoxin B1 induced compositional changes in gut microbial communities of male F344 rats. Toxicol. Sci. 2016, 150, 54–63. [Google Scholar] [CrossRef] [Green Version]
  5. Shuaib, F.M.; Ehiri, J.; Abdullahi, A.; Williams, J.H.; Jolly, P.E. Reproductive health effects of aflatoxins: A review of the literature. Reprod. Toxicol. 2010, 29, 262–270. [Google Scholar] [CrossRef] [PubMed]
  6. International Agency for Research on Cancer (IARC). Summaries and Evaluations: Aflatoxins; IARC Press: Lyon, France, 2002; Volume 82, p. 171. [Google Scholar]
  7. He, X.Y.; Tang, L.; Wang, S.L.; Cai, Q.S.; Wang, J.S.; Hong, J.Y. Efficient activation of aflatoxin B1 by cytochrome P450 2A13, an enzyme predominantly expressed in human respiratory tract. Int. J. Cancer 2006, 118, 2665–2671. [Google Scholar] [CrossRef] [PubMed]
  8. Magnussen, A.; Parsi, M.A. Aflatoxins, hepatocellular carcinoma and public health. World J. Gastroenterol. 2013, 19, 1508. [Google Scholar] [CrossRef] [PubMed]
  9. European Commission. Commission Regulation (EC) No 1881/2006 of 19 December 2006 setting maximum levels for certain contaminants in foodstuffs. Off. J. Eur. Union 2006, 364, 5–24. [Google Scholar]
  10. Frisvad, J.C.; Hubka, V.; Ezekiel, C.N.; Hong, S.B.; Nováková, A.; Chen, A.J.; Arzanlou, M.; Larsen, T.O.; Sklenár, F.; Mahakarnchanakul, W.; et al. Taxonomy of Aspergillus section Flavi and their production of aflatoxins, ochratoxins and other mycotoxins. Stud. Mycol. 2019, 93, 1–63. [Google Scholar] [CrossRef] [PubMed]
  11. Giorni, P.A.O.L.A.; Magan, N.; Pietri, A.M.E.D.E.O.; Bertuzzi, T.; Battilani, P. Studies on Aspergillus section Flavi isolated from maize in northern Italy. Int. J. Food Microbiol. 2007, 113, 330–338. [Google Scholar] [CrossRef]
  12. Lai, X.; Zhang, H.; Liu, R.; Liu, C. Potential for aflatoxin B1 and B2 production by Aspergillus flavus strains isolated from rice samples. Saudi J. Biol. Sci. 2015, 22, 176–180. [Google Scholar] [CrossRef] [Green Version]
  13. Casquete, R.; Rodríguez, A.; Hernández, A.; Martín, A.; Bartolomé, T.; Córdoba, J.J.; Córdoba, M.G. Occurrence of toxigenic fungi and mycotoxins during smoked paprika production. J. Food Protect. 2017, 80, 2068–2077. [Google Scholar] [CrossRef]
  14. Iamanaka, B.T.; de Menezes, H.C.; Vicente, E.; Leite, R.S.; Taniwaki, M.H. Aflatoxigenic fungi and aflatoxins occurrence in sultanas and dried figs commercialized in Brazil. Food Control 2007, 18, 454–457. [Google Scholar] [CrossRef]
  15. Kosegarten, C.E.; Ramírez-Corona, N.; Mani-López, E.; Palou, E.; López-Malo, A. Description of Aspergillus flavus growth under the influence of different factors (water activity, incubation temperature, protein and fat concentration, pH, and cinnamon essential oil concentration) by kinetic, probability of growth, and time-to-detection models. Int. J. Food Microbiol. 2017, 240, 115–123. [Google Scholar] [PubMed]
  16. Abdel-Hadi, A.; Schmidt-Heydt, M.; Parra, R.; Geisen, R.; Magan, N. A systems approach to model the relationship between aflatoxin gene cluster expression, environmental factors, growth and toxin production by Aspergillus flavus. J. Royal Soc. Interface. 2012, 9, 757–767. [Google Scholar] [CrossRef] [Green Version]
  17. Bernáldez, V.; Córdoba, J.J.; Magan, N.; Peromingo, B.; Rodríguez, A. The influence of ecophysiological factors on growth, aflR gene expression and aflatoxin B1 production by a type strain of Aspergillus flavus. LWT-Food Sci. Technol. 2017, 83, 283–291. [Google Scholar] [CrossRef] [Green Version]
  18. Galván, A.I.; Rodríguez, A.; Martín, A.; Serradilla, M.J.; Martínez-Dorado, A.; Córdoba, M.G. Effect of temperature during drying and storage of dried figs on growth, gene expression and aflatoxin production. Toxins 2021, 13, 134. [Google Scholar] [CrossRef]
  19. Passone, M.A.; Ruffino, M.; Ponzio, V.; Resnik, S.; Etcheverry, M.G. Postharvest control of peanut Aspergillus section Flavi populations by a formulation of food-grade antioxidants. Int. J. Food Microbiol. 2009, 131, 211–217. [Google Scholar] [CrossRef]
  20. Dikbas, N.; Kotan, R.; Dadasoglu, F.; Sahin, F. Control of Aspergillus flavus with essential oil and methanol extract of Satureja hortensis. Int. J. Food Microbiol. 2008, 124, 179–182. [Google Scholar] [CrossRef]
  21. Omidbeygi, M.; Barzegar, M.; Hamidi, Z.; Naghdibadi, H. Antifungal activity of thyme, summer savory and clove essential oils against Aspergillus flavus in liquid medium and tomato paste. Food Control 2007, 18, 1518–1523. [Google Scholar] [CrossRef]
  22. Tian, J.; Huang, B.; Luo, X.; Zeng, H.; Ban, X.; He, J.; Wang, Y. The control of Aspergillus flavus with Cinnamomum jensenianum Hand.-Mazz essential oil and its potential use as a food preservative. Food Chem. 2012, 130, 520–527. [Google Scholar] [CrossRef]
  23. Ferreira, F.D.; Kemmelmeier, C.; Arrotéia, C.C.; da Costa, C.L.; Mallmann, C.A.; Janeiro, V.; Ferreira, F.M.D.; Mossini, S.A.G.; Silva, E.L.; Machinski Jr, M. Inhibitory effect of the essential oil of Curcuma longa L. and curcumin on aflatoxin production by Aspergillus flavus Link. Food Chem. 2013, 136, 789–793. [Google Scholar] [CrossRef] [PubMed] [Green Version]
  24. da Cruz Cabral, L.; Fernández-Pino, V.; Patriarca, A. Control of infection of tomato fruits by Alternaria and mycotoxin production using plant extracts. Eur. J. Plant Pathol. 2016, 145, 363–373. [Google Scholar] [CrossRef]
  25. Bueno, D.J.; Silva, J.O.; Oliver, G.; Gonzalez, S.N. Lactobacillus casei CRL 431 and Lactobacillus rhamnosus CRL 1224 as biological controls for Aspergillus flavus strains. J. Food Protect. 2006, 69, 2544–2548. [Google Scholar] [CrossRef]
  26. Zhang, T.; Shi, Z.Q.; Hu, L.B.; Cheng, L.G.; Wang, F. Antifungal compounds from Bacillus subtilis B-FS06 inhibiting the growth of Aspergillus flavus. World J. Microbiol. Biotechnol. 2008, 24, 783. [Google Scholar] [CrossRef]
  27. Abbas, H.K.; Zablotowicz, R.M.; Bruns, H.A.; Abel, C.A. Biocontrol of aflatoxin in corn by inoculation with non-aflatoxigenic Aspergillus flavus isolates. Biocontrol Sci. Technol. 2006, 16, 437–449. [Google Scholar] [CrossRef]
  28. Dorner, J.W. Biological control of aflatoxin contamination in corn using a nontoxigenic strain of Aspergillus flavus. J. Food Protect. 2009, 72, 801–804. [Google Scholar] [CrossRef]
  29. Persons, K.; Raines, J.M.; Rodriguez, J.M. Antagonistic effects of Saccharomyces cerevisiae on the growth of Aspergillus flavus and Aspergillus parasiticus at varying temperatures. Mycology 2013, 4, 38–43. [Google Scholar] [CrossRef]
  30. Hua, S.S.T. Progress in prevention of aflatoxin contamination in food by preharvest application of a yeast strain, Pichia anomala WRL-076. Mod. Multidiscip. Appl. Microbiol. Exploit. Microbes Interact. 2006, 322–326. [Google Scholar] [CrossRef]
  31. Jaibangyang, S.; Nasanit, R.; Limtong, S. Biological control of aflatoxin-producing Aspergillus flavus by volatile organic compound-producing antagonistic yeasts. BioControl 2020, 65, 377–386. [Google Scholar] [CrossRef]
  32. Gil-Serna, J.; Patiño, B.; Cortés, L.; González-Jaén, M.T.; Vázquez, C. Mechanisms involved in reduction of ochratoxin A produced by Aspergillus westerdijkiae using Debaryomyces hansenii CYC 1244. Int. J. Food Microbiol. 2011, 151, 113–118. [Google Scholar] [CrossRef]
  33. Rojas, V.; Gil, J.V.; Piñaga, F.; Manzanares, P. Acetate ester formation in wine by mixed cultures in laboratory fermentations. Int. J. Food Microbiol. 2003, 86, 181–188. [Google Scholar] [CrossRef]
  34. Romano, P.; Fiore, C.; Paraggio, M.; Caruso, M.; Capece, A. Function of yeast species and strains in wine flavour. Int. J. Food Microbiol. 2003, 86, 169–180. [Google Scholar] [CrossRef]
  35. Rosend, J.; Kuldjärv, R.; Rosenvald, S.; Paalme, T. The effects of apple variety, ripening stage, and yeast strain on the volatile composition of apple cider. Heliyon 2019, 5, e01953. [Google Scholar] [CrossRef] [PubMed] [Green Version]
  36. Taguchi, T.; Ishihara, A.; Nakajima, H. Effects of volatile compounds in apple juices on fungal growth and patulin production of Penicillium expansum. JSM Mycotoxins 2014, 64, 1–14. [Google Scholar] [CrossRef] [Green Version]
  37. de Arruda Moura, G.; dos Santos, C.M.E.; Sauer, E.; Wosiacki, G.; Nogueira, A. Influence of fermentation with Hanseniaspora sp. yeast on the volatile profile of fermented apple. J. Agric. Food Chem. 2012, 60, 9815–9821. [Google Scholar] [CrossRef] [PubMed]
  38. Xu, Y.; Zhao, G.A.; Wang, L.P. Controlled formation of volatile components in cider making using a combination of Saccharomyces cerevisiae and Hanseniaspora valbyensis yeast species. J. Indust. Microbiol. Biotechnol. 2006, 33, 192–196. [Google Scholar] [CrossRef]
  39. Moreira, N.; Pina, C.; Mendes, F.; Couto, J.A.; Hogg, T.; Vasconcelos, I. Volatile compounds contribution of Hanseniaspora guilliermondii and Hanseniaspora uvarum during red wine vinifications. Food Control 2011, 22, 662–667. [Google Scholar] [CrossRef]
  40. Viana, F.; Gil, J.V.; Vallés, S.; Manzanares, P. Increasing the levels of 2-phenylethyl acetate in wine through the use of a mixed culture of Hanseniaspora osmophila and Saccharomyces cerevisiae. Int. J. Food Microbiol. 2009, 135, 68–74. [Google Scholar] [CrossRef]
  41. Ruiz-Moyano, S.; Hernández, A.; Galvan, A.I.; Córdoba, M.G.; Casquete, R.; Serradilla, M.J.; Martín, A. Selection and application of antifungal VOCs-producing yeasts as biocontrol agents of grey mould in fruits. Food Microbio. 2020, 92, 103556. [Google Scholar] [CrossRef]
  42. Ando, H.; Hatanaka, K.; Ohata, I.; Yamashita-Kitaguchi, Y.; Kurata, A.; Kishimoto, N. Antifungal activities of volatile substances generated by yeast isolated from Iranian commercial cheese. Food Control 2012, 26, 472–478. [Google Scholar] [CrossRef]
  43. Di Francesco, A.; Ugolini, L.; Lazzeri, L.; Mari, M. Production of volatile organic compounds by Aureobasidium pullulans as a potential mechanism of action against postharvest fruit pathogens. Biol. Control 2015, 81, 8–14. [Google Scholar] [CrossRef]
  44. Contarino, R.; Brighina, S.; Fallico, B.; Cirvilleri, G.; Parafati, L.; Restuccia, C. Volatile organic compounds (VOCs) produced by biocontrol yeasts. Food Microbiol. 2019, 82, 70–74. [Google Scholar] [CrossRef]
  45. Plata, C.; Millán, C.; Mauricio, J.C.; Ortega, J.M. Formation of ethyl acetate and isoamyl acetate by various species of wine Yeats. Food Microbiol. 2003, 20, 217–224. [Google Scholar] [CrossRef]
  46. Georgianna, D.R.; Payne, G. Genetic regulation of aflatoxin biosynthesis: From gene to genome. Fungal Genet. Biol. 2009, 26, 113–125. [Google Scholar] [CrossRef] [PubMed]
  47. Al-Saad, L.A.; Al-Badran, A.I.; Al-Jumayli, S.A.; Magan, N.; Rodríguez, A. Impact of bacterial biocontrol agents on aflatoxin biosynthetic genes, aflD and aflR expression, and phenotypic aflatoxin B1 production by Aspergillus flavus under different environmental and nutritional regimes. Int. J. Food Microbiol. 2016, 217, 123–129. [Google Scholar] [CrossRef] [PubMed]
  48. Peromingo, B.; Rodríguez, M.; Delgado, J.; Andrade, M.J.; Rodríguez, A. Gene expression as a good indicator of aflatoxin contamination in dry-cured ham. Food Microbiol. 2017, 67, 31–40. [Google Scholar] [CrossRef] [PubMed]
  49. Lozano-Ojalvo, D.; Rodríguez, A.; Bernáldez, V.; Córdoba, J.J.; Rodríguez, M. Influence of temperature and substrate conditions on the omt-1 gene expression of Aspergillus parasiticus in relation to its aflatoxin production. Int. J. Food Microbiol. 2013, 166, 263–269. [Google Scholar] [CrossRef]
  50. Rodríguez, A.; Medina, A.; Córdoba, J.J.; Magan, N. The influence of salt (NaCl) on ochratoxin A biosynthetic genes, growth and ochratoxin A production by three strains of Penicillium nordicum on a dry-cured ham-based medium. Int. J. Food Microbiol. 2014, 178, 113–119. [Google Scholar] [CrossRef]
  51. Schmidt-Heydt, M.; Abdel-Hadi, A.; Magan, N.; Geisen, R. Complex regulation of the aflatoxin biosynthesis gene cluster of Aspergillus flavus in relation to various combinations of water activity and temperature. Int. J. Food Microbiol. 2009, 135, 231–237. [Google Scholar] [CrossRef] [Green Version]
  52. Schmidt-Heydt, M.; Magan, N.; Geisen, R. Stress induction of mycotoxin biosynthesis genes by abiotic factors. FEMS Microbiol. Lett. 2008, 284, 142–149. [Google Scholar] [CrossRef] [PubMed] [Green Version]
  53. Schmidt-Heydt, M.; Rüfer, C.E.; Abdel-Hadi, A.; Magan, N.; Geisen, R. The production of aflatoxin B1 or G1 by Aspergillus parasiticus at various combinations of temperature and water activity is related to the ratio aflS to aflR expression. Mycotoxin Res. 2010, 26, 241–246. [Google Scholar] [CrossRef] [PubMed] [Green Version]
  54. Peromingo, B.; Andrade, M.J.; Delgado, J.; Sánchez-Montero, L.; Núñez, F. Biocontrol of aflatoxigenic Aspergillus parasiticus by native Debaryomyces hansenii in dry-cured meat products. Food Microbiol. 2019, 82, 269–276. [Google Scholar] [CrossRef]
  55. León, A.M.; Cataño, C.S.; Yepes, E.Q.; Villarroel, R.G.; De Antoni, G.L.; Giannuzzi, L. Inhibitory activity of lactic and acetic acid on Aspergillus flavus growth for food preservation. Food Control 2012, 24, 177–183. [Google Scholar] [CrossRef]
  56. Livak, K.J.; Schmittgen, T.D. Analysis of relative gene expression data using real-time quantitative PCR and the 2(-Delta Delta C(T)) Method. Methods 2001, 25, 402–408. [Google Scholar] [CrossRef] [PubMed]
  57. Ruiz-Moyano, S.; Benito, M.J.; Martín, A.; Aranda, E.; Hernández, A.; Córdoba, M.G. Characterization of molds isolated from smoked paprika by PCR-RFLP and micellar electrokinetic capillary electrophoresis. Food Microbiol. 2009, 26, 776–782. [Google Scholar] [CrossRef] [PubMed]
Figure 1. The principal component analysis (PCA) score plots (A,C) and loading plots (B,D) using the first three principal components derived from volatile compounds emitted by A. flavus on different sampling days (indicated by numbers), and their confrontations with H. opuntiae L479 (A,B) and H. uvarum L793 (C,D).
Toxins 13 00663 g001
Figure 2. Evolution of the volatile compound profiles of H. opuntiae L479 (A) and H. uvarum L793 (B) in the presence of A. flavus (AF + L479 and AF + L793) throughout the 21-day incubation period.
Toxins 13 00663 g002
Figure 3. Temporal relative expression of the aflR gene by A. flavus in the absence (AF) and presence of H. opuntiae L479 (AF + L479) and H. uvarum L793 (AF + L793) throughout the 21-day incubation period. Calibrators (samples of each batch incubated at 3 days) always take the value of 0.
Toxins 13 00663 g003
Figure 4. Effect of volatile organic compounds produced by H. opuntiae L479 (AF + L479) and H. uvarum L793 (AF + L793) on the relative expression of the aflR gene in Aspergillus flavus throughout the 21-day incubation period. Calibrators (samples of batch AF at each incubation time) always take the value of 0.
Toxins 13 00663 g004
Figure 5. Temporal aflatoxin B1 (A) and B2 (B) production by A. flavus in the absence (AF) and presence of H. opuntiae L479 (AF + L479) and H. uvarum L793 (AF + L793) throughout the 21-day incubation period.
Toxins 13 00663 g005
Table 1. Volatile compounds (including family, Kovats index and retention times) and their relative abundances in the three batches analyzed in this study: AF (batch inoculated only with Aspergillus flavus), AF + L479 (batch inoculated with Aspergillus flavus and Hanseniaspora opuntiae L479) and AF + L793 (batch inoculated with Aspergillus flavus and Hanseniaspora uvarum L793).
Volatile CompoundsFamily aKI bPeak NumberRetention TimeMean Relative Abundancesp
AF cAF + L479 dAF + L793 e
1-Propanolol554v45.10.280.00 *0.08 *0.032
2-Methylpentaneh560v55.32.290.73 *0.23 *0.024
3-Methylpentaneh581v65.82.580.95 *0.25 *0.050
Acetic acidac595v96.80.0043.38 +0.000.000
Ethyl acetatees612v106.81.892.59 +18.184 +0.023
Propanoic acidac705v2010.70.090.22 +0.24 +0.008
n-Propyl acetatees706v2211.00.000.35 +0.70 +0.049
Isoamyl alcoholol732v2611.99.540.81 *12.77 +0.001
2-Methyl-1-butanolol740v2712.14.360.43 *11.54 +0.000
Isobutyric acidac775v2912.80.841.45 +0.410.021
2-Methylbutanoic acidac854v4216.80.596.91 +0.280.017
1,3-Dimethylbenzeneb875v4418.80.720.31 *0.10 *0.047
Isoamyl acetatees878v4518.90.330.329.60 +0.043
2-methylbutyl acetatees880v4619.00.610.303.27 +0.039
2-Heptanonek889v4819.50.000.03 +0.30 +0.007
Furfuryl acetatef997v5724.40.000.000.26 +0.006
Hexyl acetatees1010v5825.10.000.03 +0.13 +0.048
Ethyl heptanoatees1085v6728.70.000.03 +0.08 +0.048
Nonanalal1104v6829.10.200.08 *0.23 +0.046
Phenethyl alcoholb1110/1141v6929.80.000.004.56 +0.007
Phenylmethyl acetatees1170v7031.60.000.000.13 +0.043
2-Phenylethyl acetatees1258v7635.03.021.488.46 +0.045
a ol: alcohols; h: hydrocarbons; ac: acids; es: esters; b: benzene derivates; k: ketones; al: aldehydes; f: furans; al: aldehydes. b Kovats index. Batches: c AF (A. flavus in the absence of yeasts, control batch), d AF + L793 (A. flavus in the presence of H. uvarum L793), e AF + L479 (A. flavus in the presence of H. opuntiae L479). * Means with lower relative abundances (p < 0.050). + Means with higher relative abundances (p < 0.050).
Table 2. Growth parameters (size of mycelia), growth rate (µ; mm/day) and lag phase (λ; days) of Aspergillus flavus in the absence (AF) or presence of H. opuntiae L479 (AF + L479) or H. uvarum L793 (AF + L793).
TreatmentDiameter of Mycelium (mm)µ (mm/Day)λ (Days)
Days of Incubation
37910121521
AF13.55 ± 0.52c 134.50 ± 1.11c43.72 ± 0.75b47.50 ± 0.74c57.55 ± 1.83c70.83 ± 0.96b75.20 ± 0.44b4.58 ± 0.03c0.58 ± 0.04a
AF + L47912.00 ± 0.50b29.74 ± 0.97b37.95 ± 1.84a39.37 ± 0.99b50.26 ± 4.18b63.87 ± 4.38b73.20 ± 2.38b4.00 ± 0.08b0.87 ± 0.10b
AF + L7938.88 ± 1.26a25.39 ± 1.93a32.36 ± 2.60a35.55 ± 2.85a42.81 ± 3.47a52.00 ± 5.13a57.00 ± 7.37a3.54 ± 0.08a1.07 ± 0.08b
p<0.001<0.001<0.001<0.001<0.001<0.0010.015<0.0010.001
Data are expressed as mean value ± standard deviation. 1 within columns, different letters denote significant differences for the same incubation day between treatments (p ≤ 0.05).
Publisher’s Note: MDPI stays neutral with regard to jurisdictional claims in published maps and institutional affiliations.

