Article

Host-Species Variation and Environment Influence Endophyte Symbiosis and Mycotoxin Levels in Chinese Oxytropis Species

1
Key Laboratory of Resource Biology and Biotechnology in Western China, Ministry of Education, College of Life Sciences, Northwest University, Xi’an 710069, China
2
Provincial Key Laboratory of Biotechnology of Shaanxi Province, College of Life Sciences, Northwest University, Xi’an 710069, China
3
Peiwen School of Peking University, Jinzhong 030619, China
4
Institute of Biology, Environmental and Rural Science, Aberystwyth University, Aberystwyth SY23 3FL, UK
5
Agriculture and Animal Husbandry College, Qinghai University, Xining 810016, China
6
Key Laboratory of Grassland Resources of Ministry of Education, College of Grassland, Resources and Environment, Inner Mongolia Agricultural University, Hohhot 010018, China
*
Authors to whom correspondence should be addressed.
Submission received: 13 December 2021 / Revised: 25 February 2022 / Accepted: 26 February 2022 / Published: 28 February 2022

Abstract

:
Oxytropis plants are widely distributed in the grasslands in northern China. Some Oxytropis species have been reported to contain the mycotoxin swainsonine, an alkaloid which causes poisoning in livestock, referred to as locoism. Previous studies showed that endophytic fungi (Alternaria oxytropis) symbiotically associate with these Oxytropis species to produce swainsonine. However, the influence of variation within the Oxytropis genus on the fixation or loss of symbiosis and toxicity is poorly understood, as is the influence of environmental factors. Here we used a collection of 17 common Oxytropis species sampled in northern China to assess genetic diversity using genotyping by sequencing which was compared with the levels of the endophyte and swainsonine. Results showed that nine Oxytropis species have detectable A. oxytropis colonisation, and seven Oxytropis species contain sufficient swainsonine to be considered poisonous, whereas the rest may be non-toxic. Species variation rather than the genetic lineage was associated with the fixation or loss of endophyte and swainsonine production, which appears to have resulted from genetic drift. Genotype × Environment (G × E) effects were also found to influence endophyte and swainsonine levels amongst species of the Oxytropis genus. Our study will provide a better understanding about the evolutionary basis of A. oxytropis symbiosis and swainsonine biosynthesis in locoweeds.
Key Contribution: Genetic diversity, endophyte and swainsonine concentrations were determined in 17 common Oxytropis species sampled in northern China. Species variation, rather than the genetic lineage, was associated with the fixation or loss of endophyte and swainsonine production, and Genotype × Environment (G × E) effects were found to influence endophyte colonisation and swainsonine levels amongst species of the Oxytropis genus.

1. Introduction

The symbiosis between plants and endophytic fungi is common in nature [1,2,3], and the fungi have beneficial, neutral or detrimental effects to the host plants. Some hosts exhibit a preference for certain endophytic fungal interactions [4]. The diversity and distribution of endophytes across biomes and their effects on plant phylogeny and host tissues have attracted considerable attention [5]. Oxytropis spp. (Fabaceae) are important perennial herbs that are native to temperate to frigid zones in Europe, Asia and North America [6,7]. Some Oxytropis species form a symbiotic interaction with the endophytic fungi Alternaria (sect. Undifilum) oxytropis, to synthesise a mycotoxin, swainsonine [8,9,10]. Swainsonine, an indolizidine alkaloid, has the inhibitory activity of α-mannosidase [11,12] and can cause poisoning of livestock (mainly sheep and horses). Poisonous Oxytropis species, together with the poisonous Astragalus species, are known as “locoweeds”, and pose a serious threat to animal husbandry in China and the U.S. [6,13,14,15]. When combined with overstocking, poisonous Oxytropis species can become dominant in the plant community, as observed in many grasslands in China [16]. Therefore, understanding what can influence mycotoxin production in the OxytropisA. oxytropis symbiont is of considerable importance, not only to reduce the risk of livestock poisoning, but also to improve our knowledge of key aspects of host–endophyte symbiosis.
Swainsonine producing strains of A. sect. Undifilum are considered to form a commensal association with the two related genera of Astragalus and Oxytropis [17]. The levels of swainsonine vary in different plant species, tissues and at different phenological stages [18]. Another important variable influencing swainsonine concentrations in the plant is the chemotype of A. oxytropis, with high- and low-swainsonine-producing variants being identified in O. sericea [19]. This may reflect genetic variation in the swainsonine-producing gene cluster. Such a gene cluster has been identified in A. sect. Undifilum, comprising SwnR, SwnN, SwnH1, SwnH2 and SwnK [20]. Swainsonine levels are also related to the amount of endophyte in a host population [21,22,23,24,25]. A recent study showed that different strains of A. fulva (also belonging to A. sect. Undifilum) may exist in the same host, but swainsonine concentration is largely determined by the amounts of the dominant chemotype [26].
Our previous study showed that O. ochrocephala, the most common toxic Oxytropis species in China, could be differentiated into two large genetically distinct groups, within which there were considerable variations in endophyte infection patterns and swainsonine content [27]. Different growth conditions also had an impact on the production of swainsonine, once the symbiosis was fixed in the host population. As such, host genetics and environments (G × E) together could have shaped the symbiosis and mycotoxin biosynthesis. However, the distribution of A. oxytropis in some of the other Oxytropis species remains cryptic. Swainsonine production in different Oxytropis species has been linked to the same conspecies, designated as A. oxytropis [21,22,23,28]. Nevertheless, since A. oxytropis has been reported as strictly vertically transmitted [24], it is difficult to understand how the same endophyte is differently distributed between different locoweed species which are reproductively isolated. This may reflect the monophyletic maintenance or loss of endophytic symbiosis at divergence from a common Oxytropis ancestor. Alternatively, this could arise from independent variation occurring post-divergence. In this study, we aimed to characterise the genetic diversity of both swainsonine-positive and swainsonine-negative Oxytropis hosts. By determining the endophyte and swainsonine levels, we considered whether genetic lineage within the genus could be related to the colonisation of A. oxytropis and swainsonine biosynthesis. We also addressed the relationship between plant genetics, environment parameters, endophyte and swainsonine content. The results of our study suggested A. oxytropis symbiosis and swainsonine biosynthesis in Oxytropis may be influenced by G × E effects.

2. Results

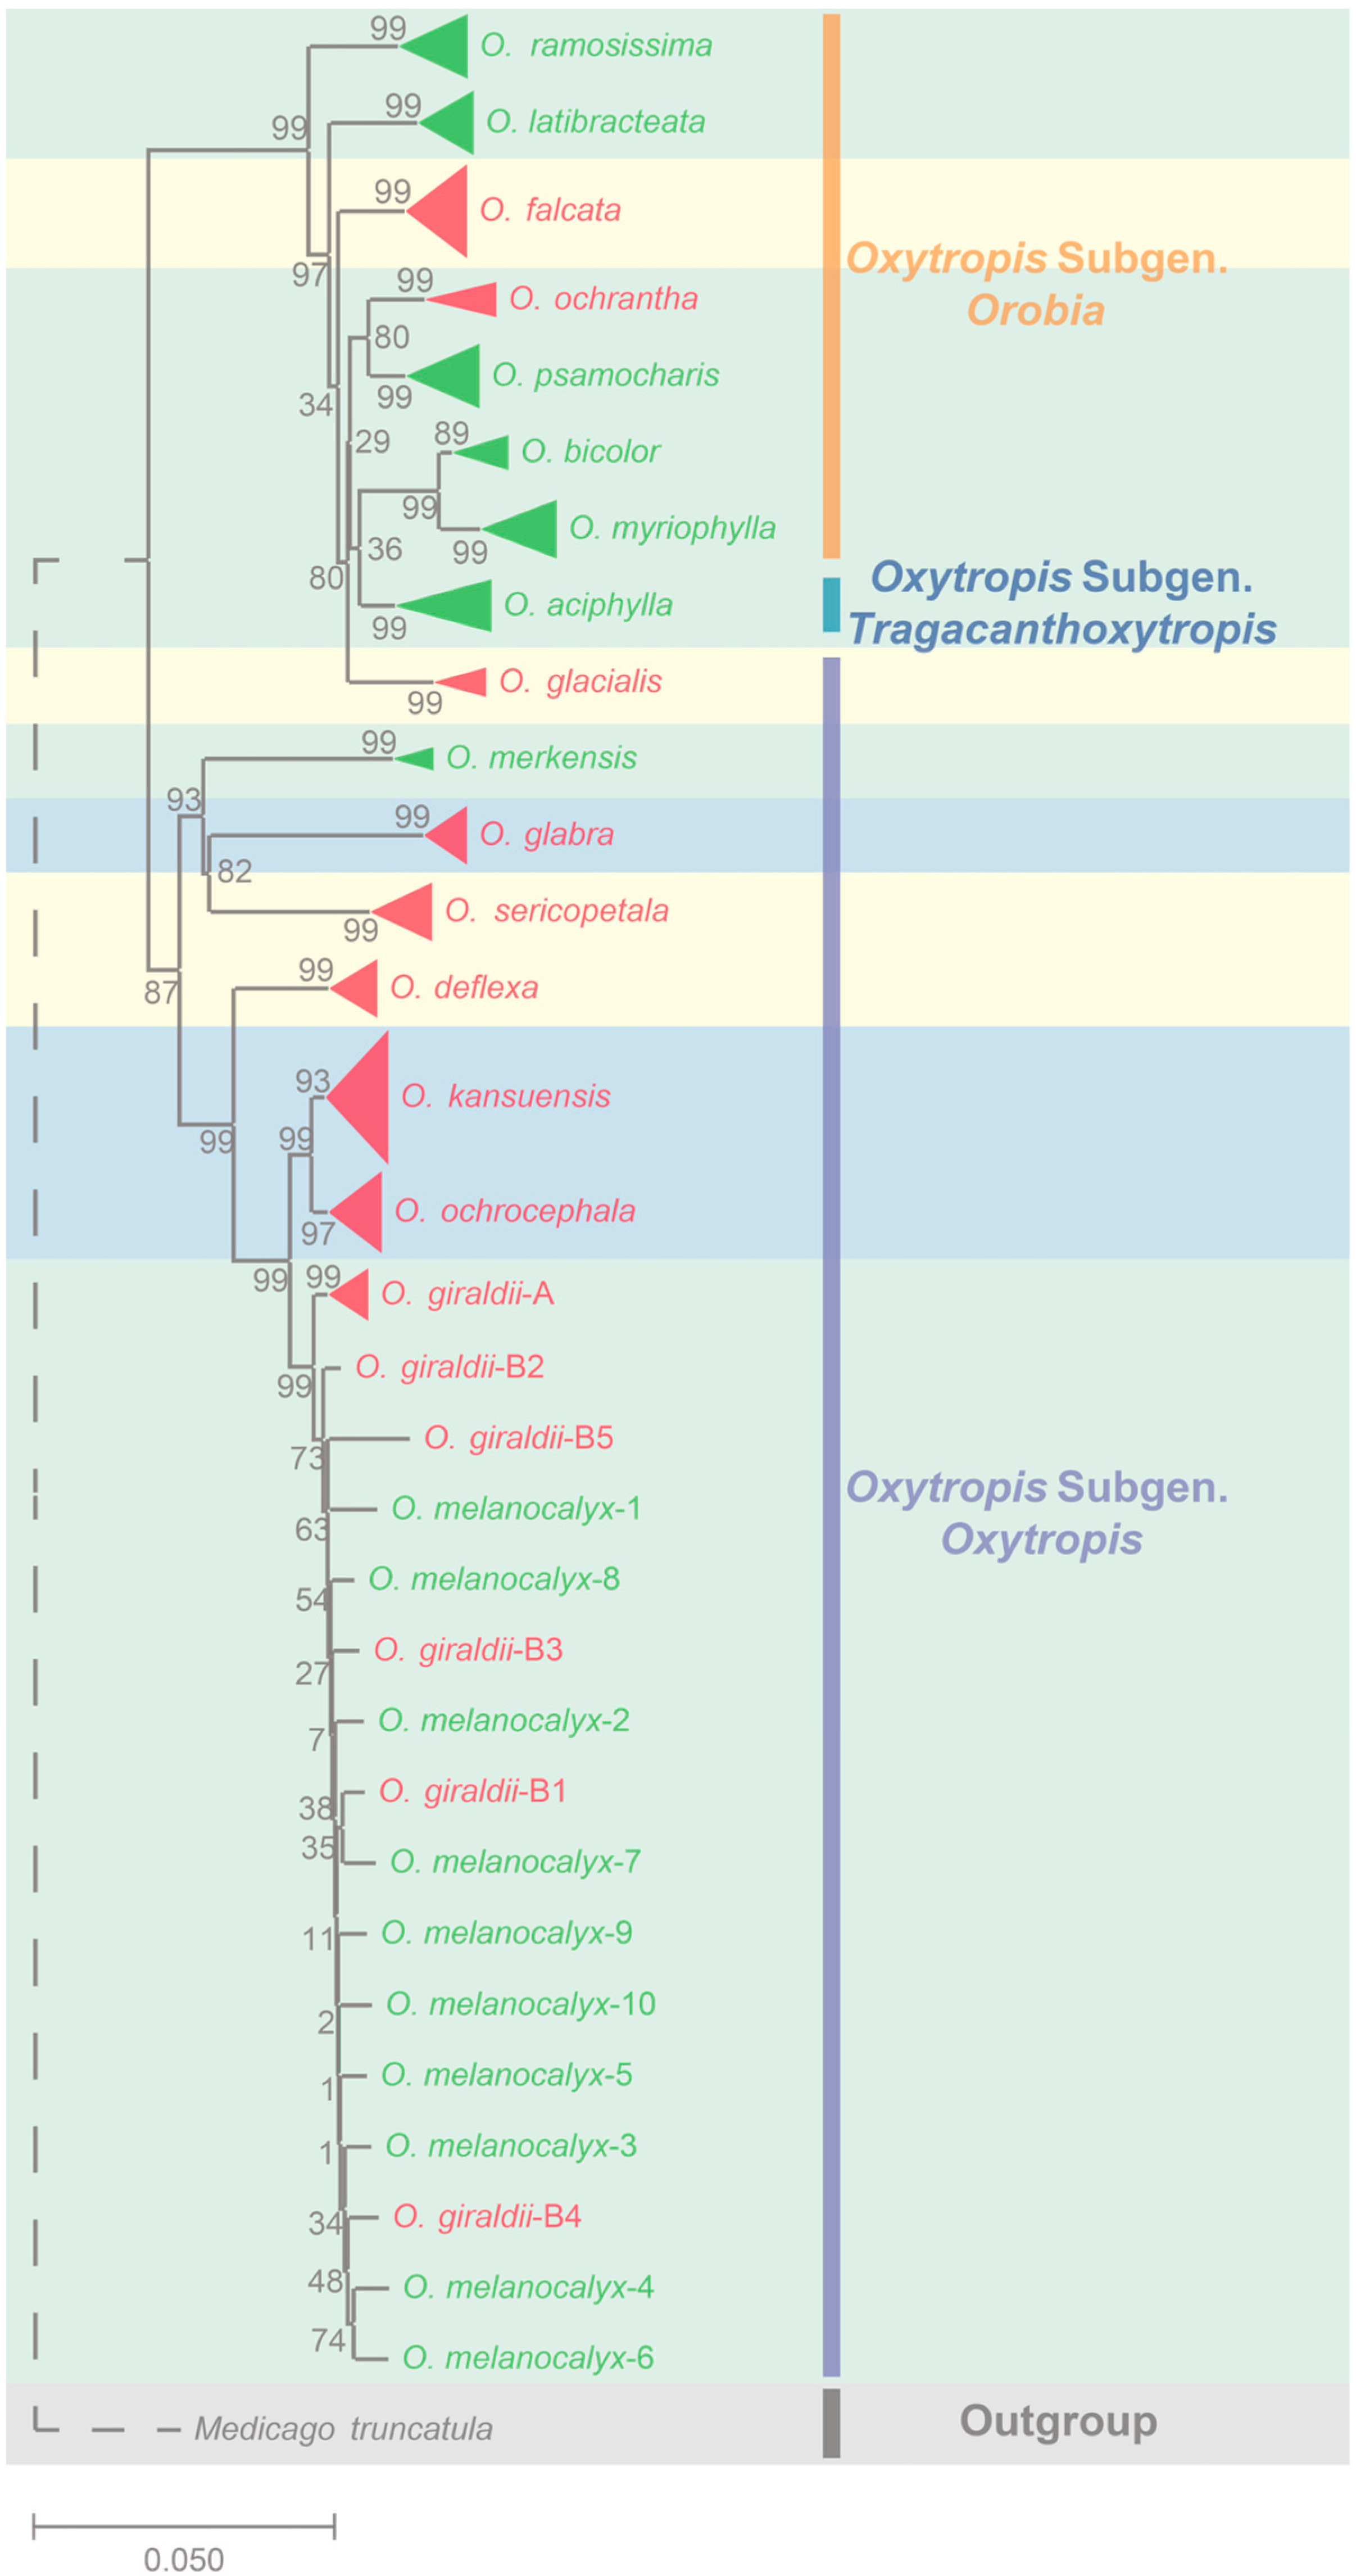
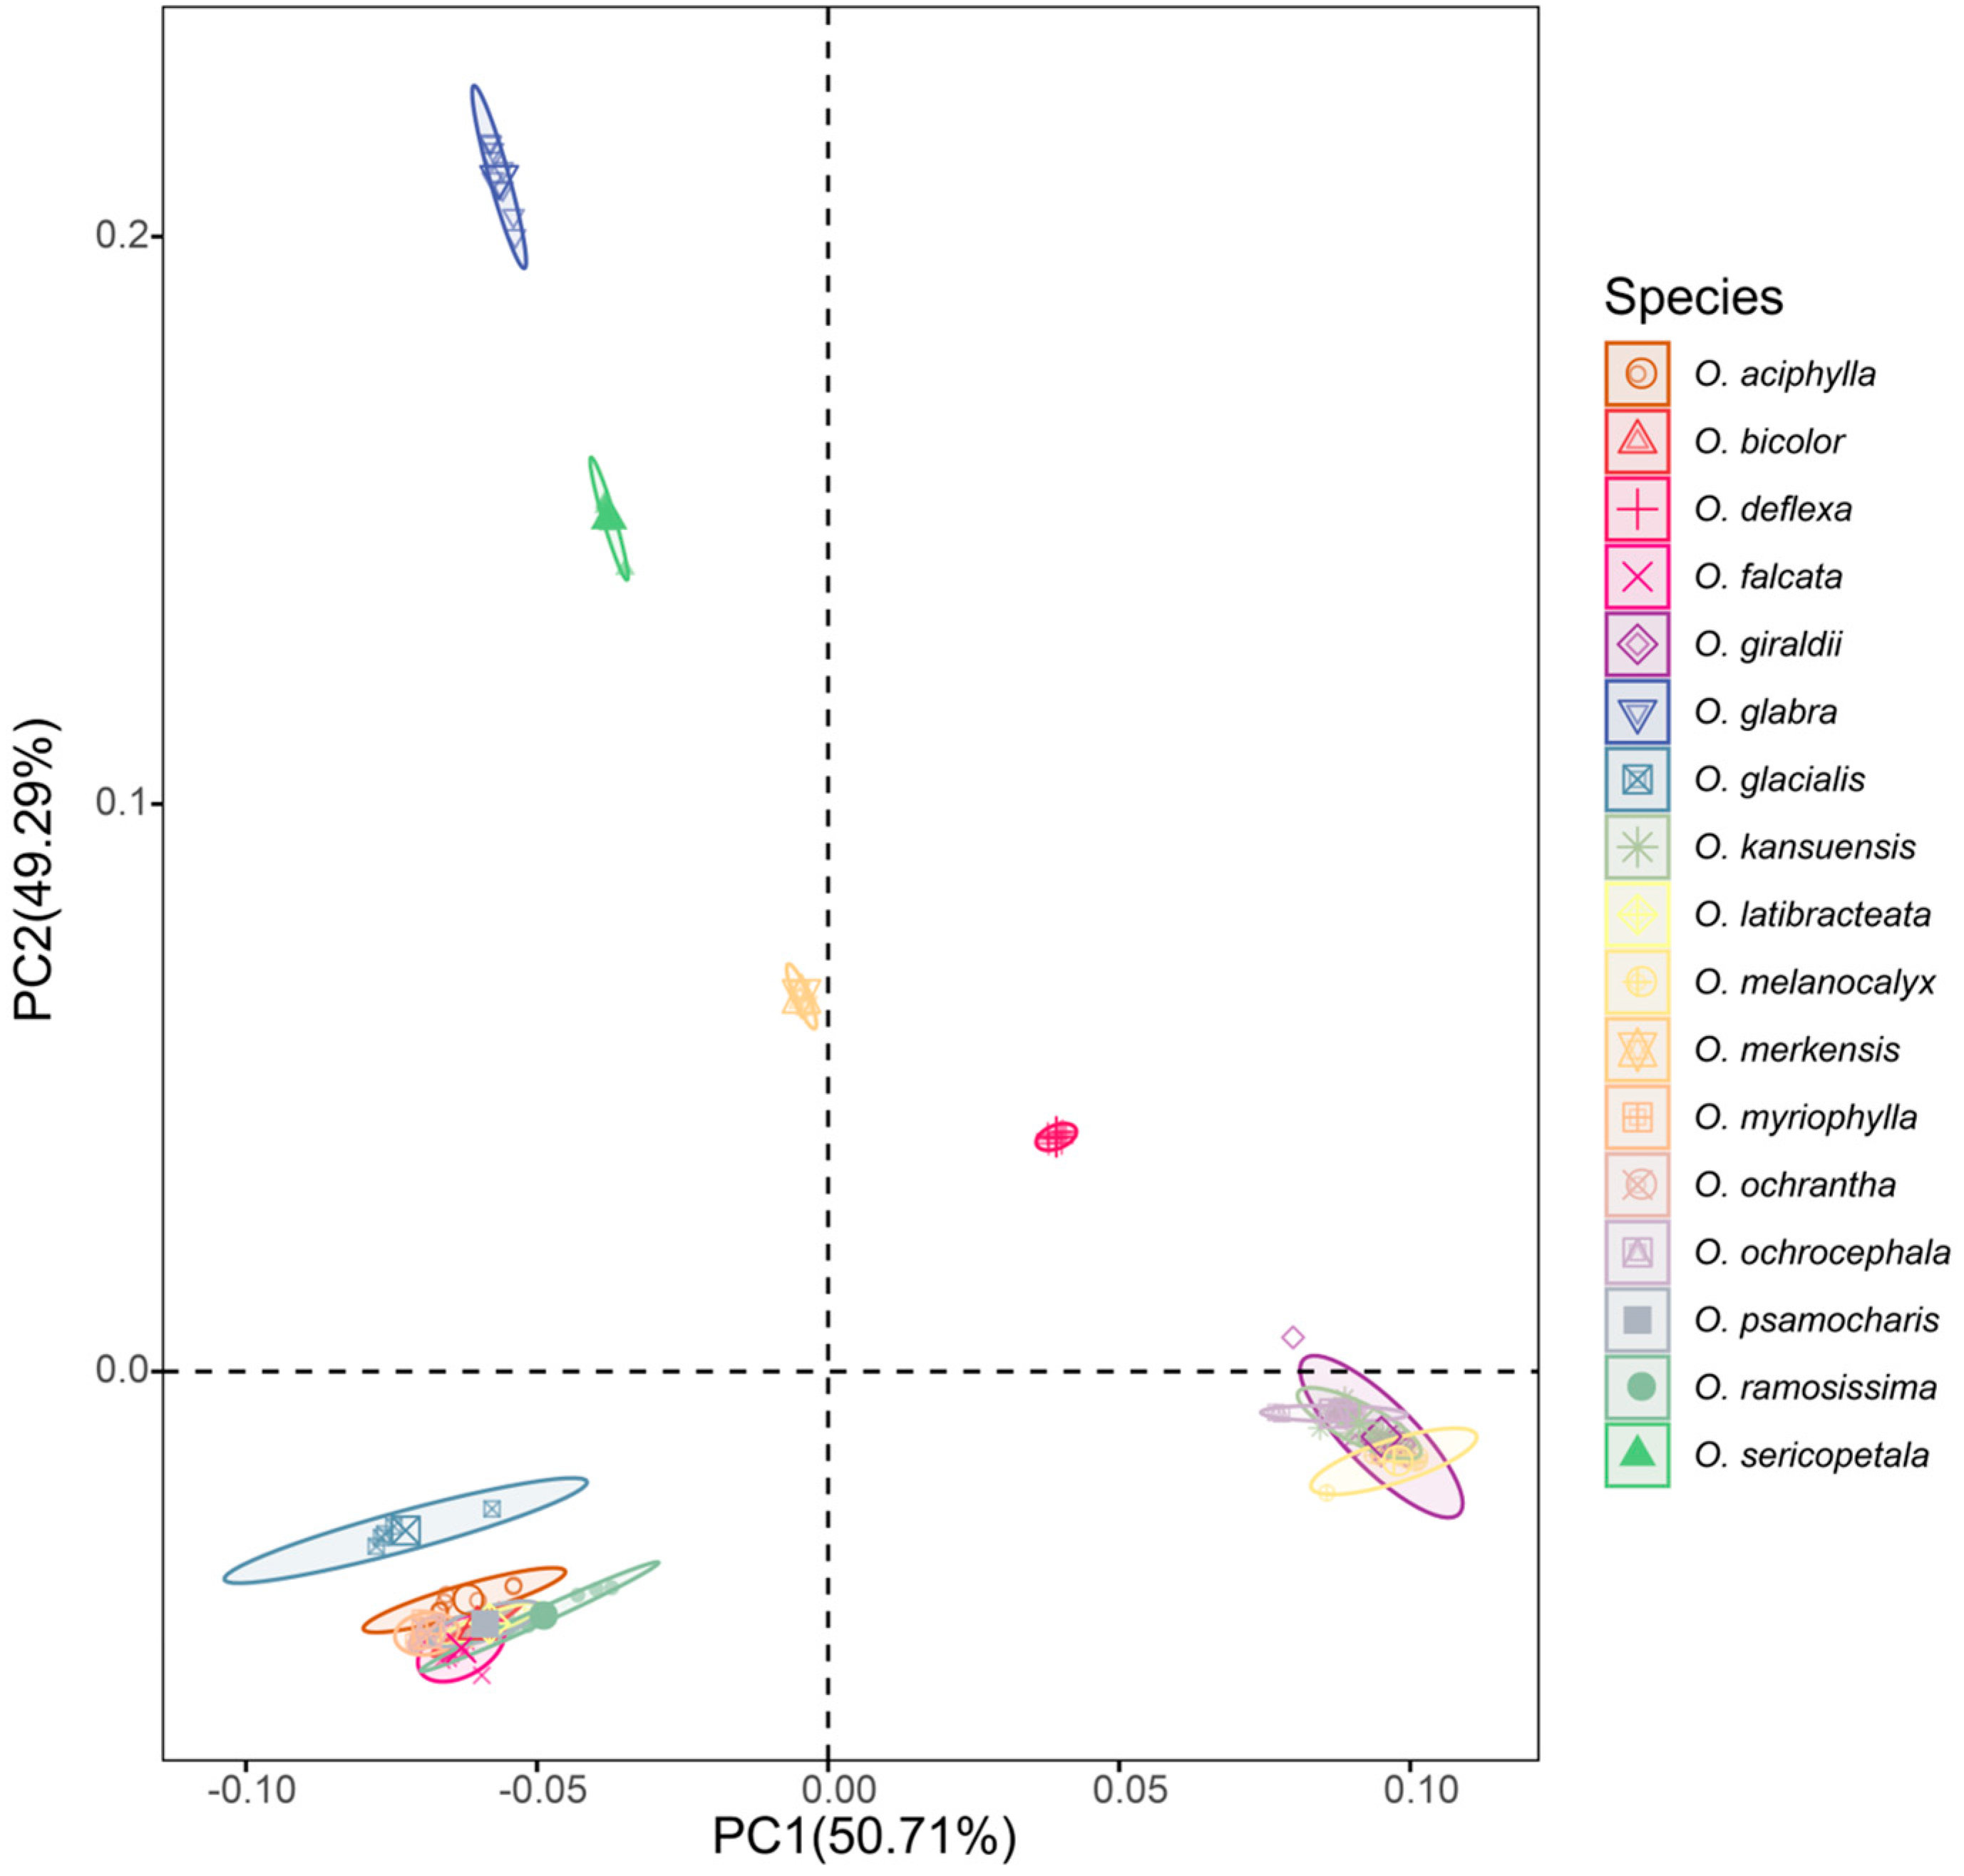
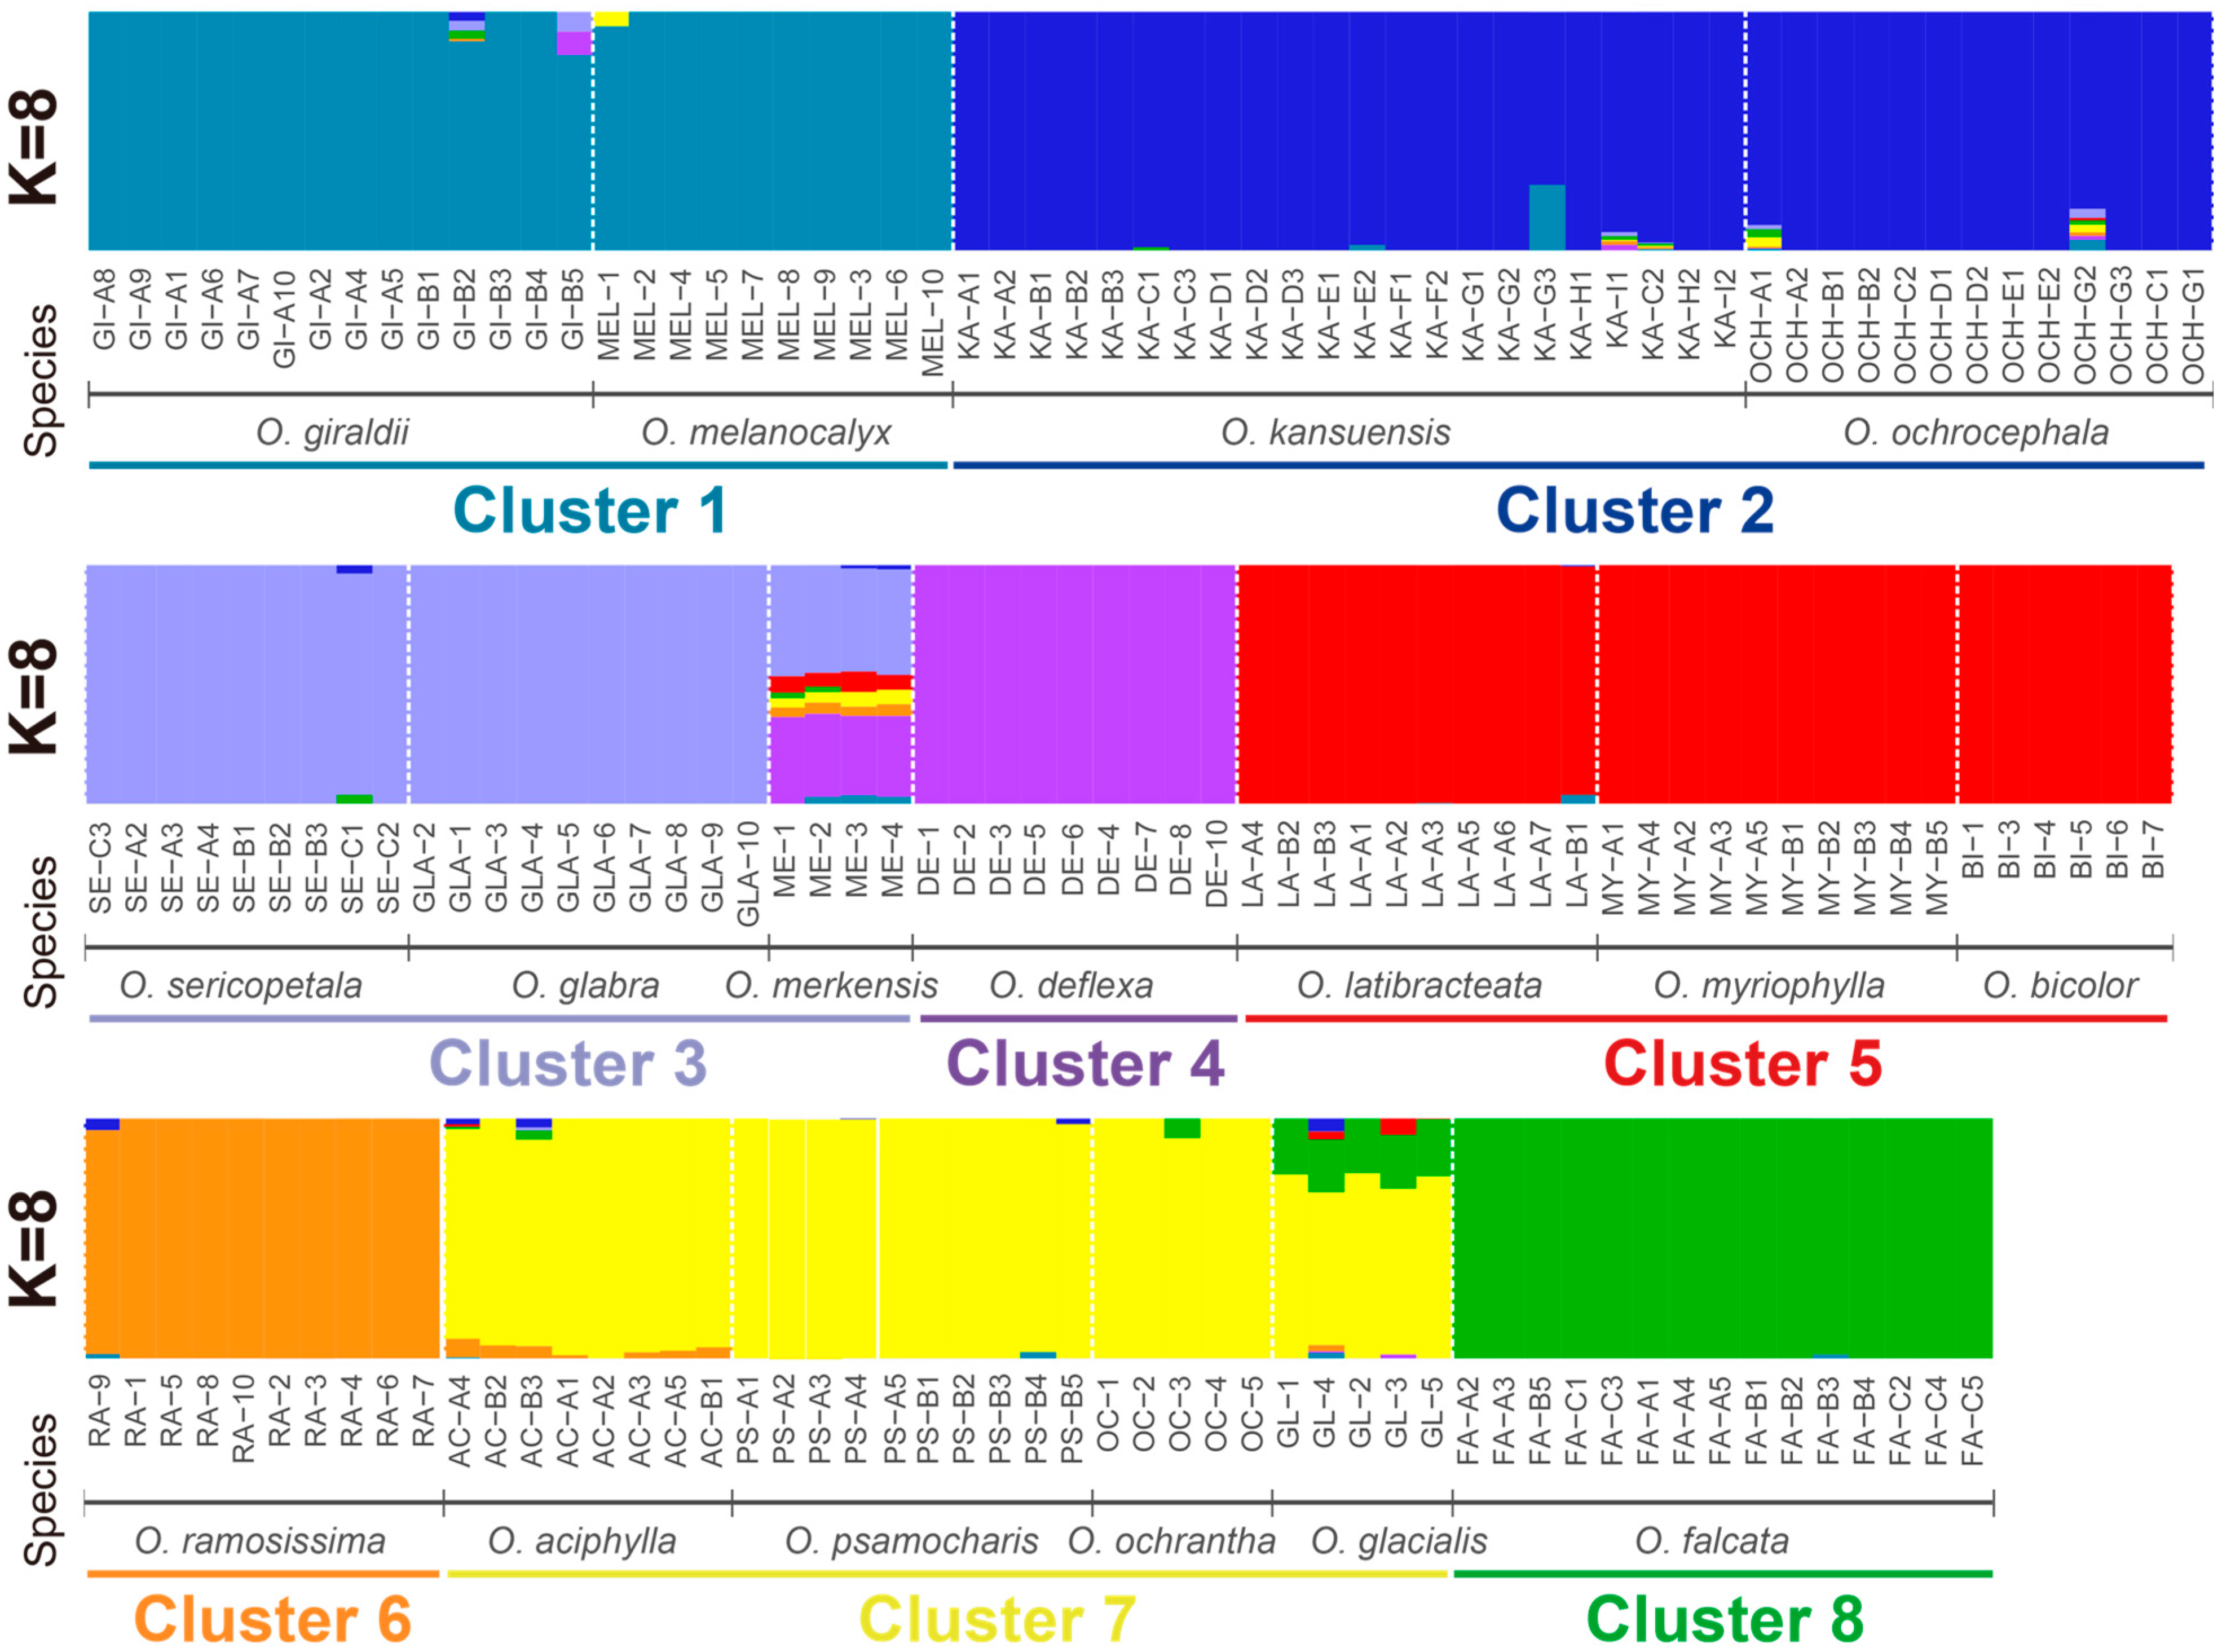
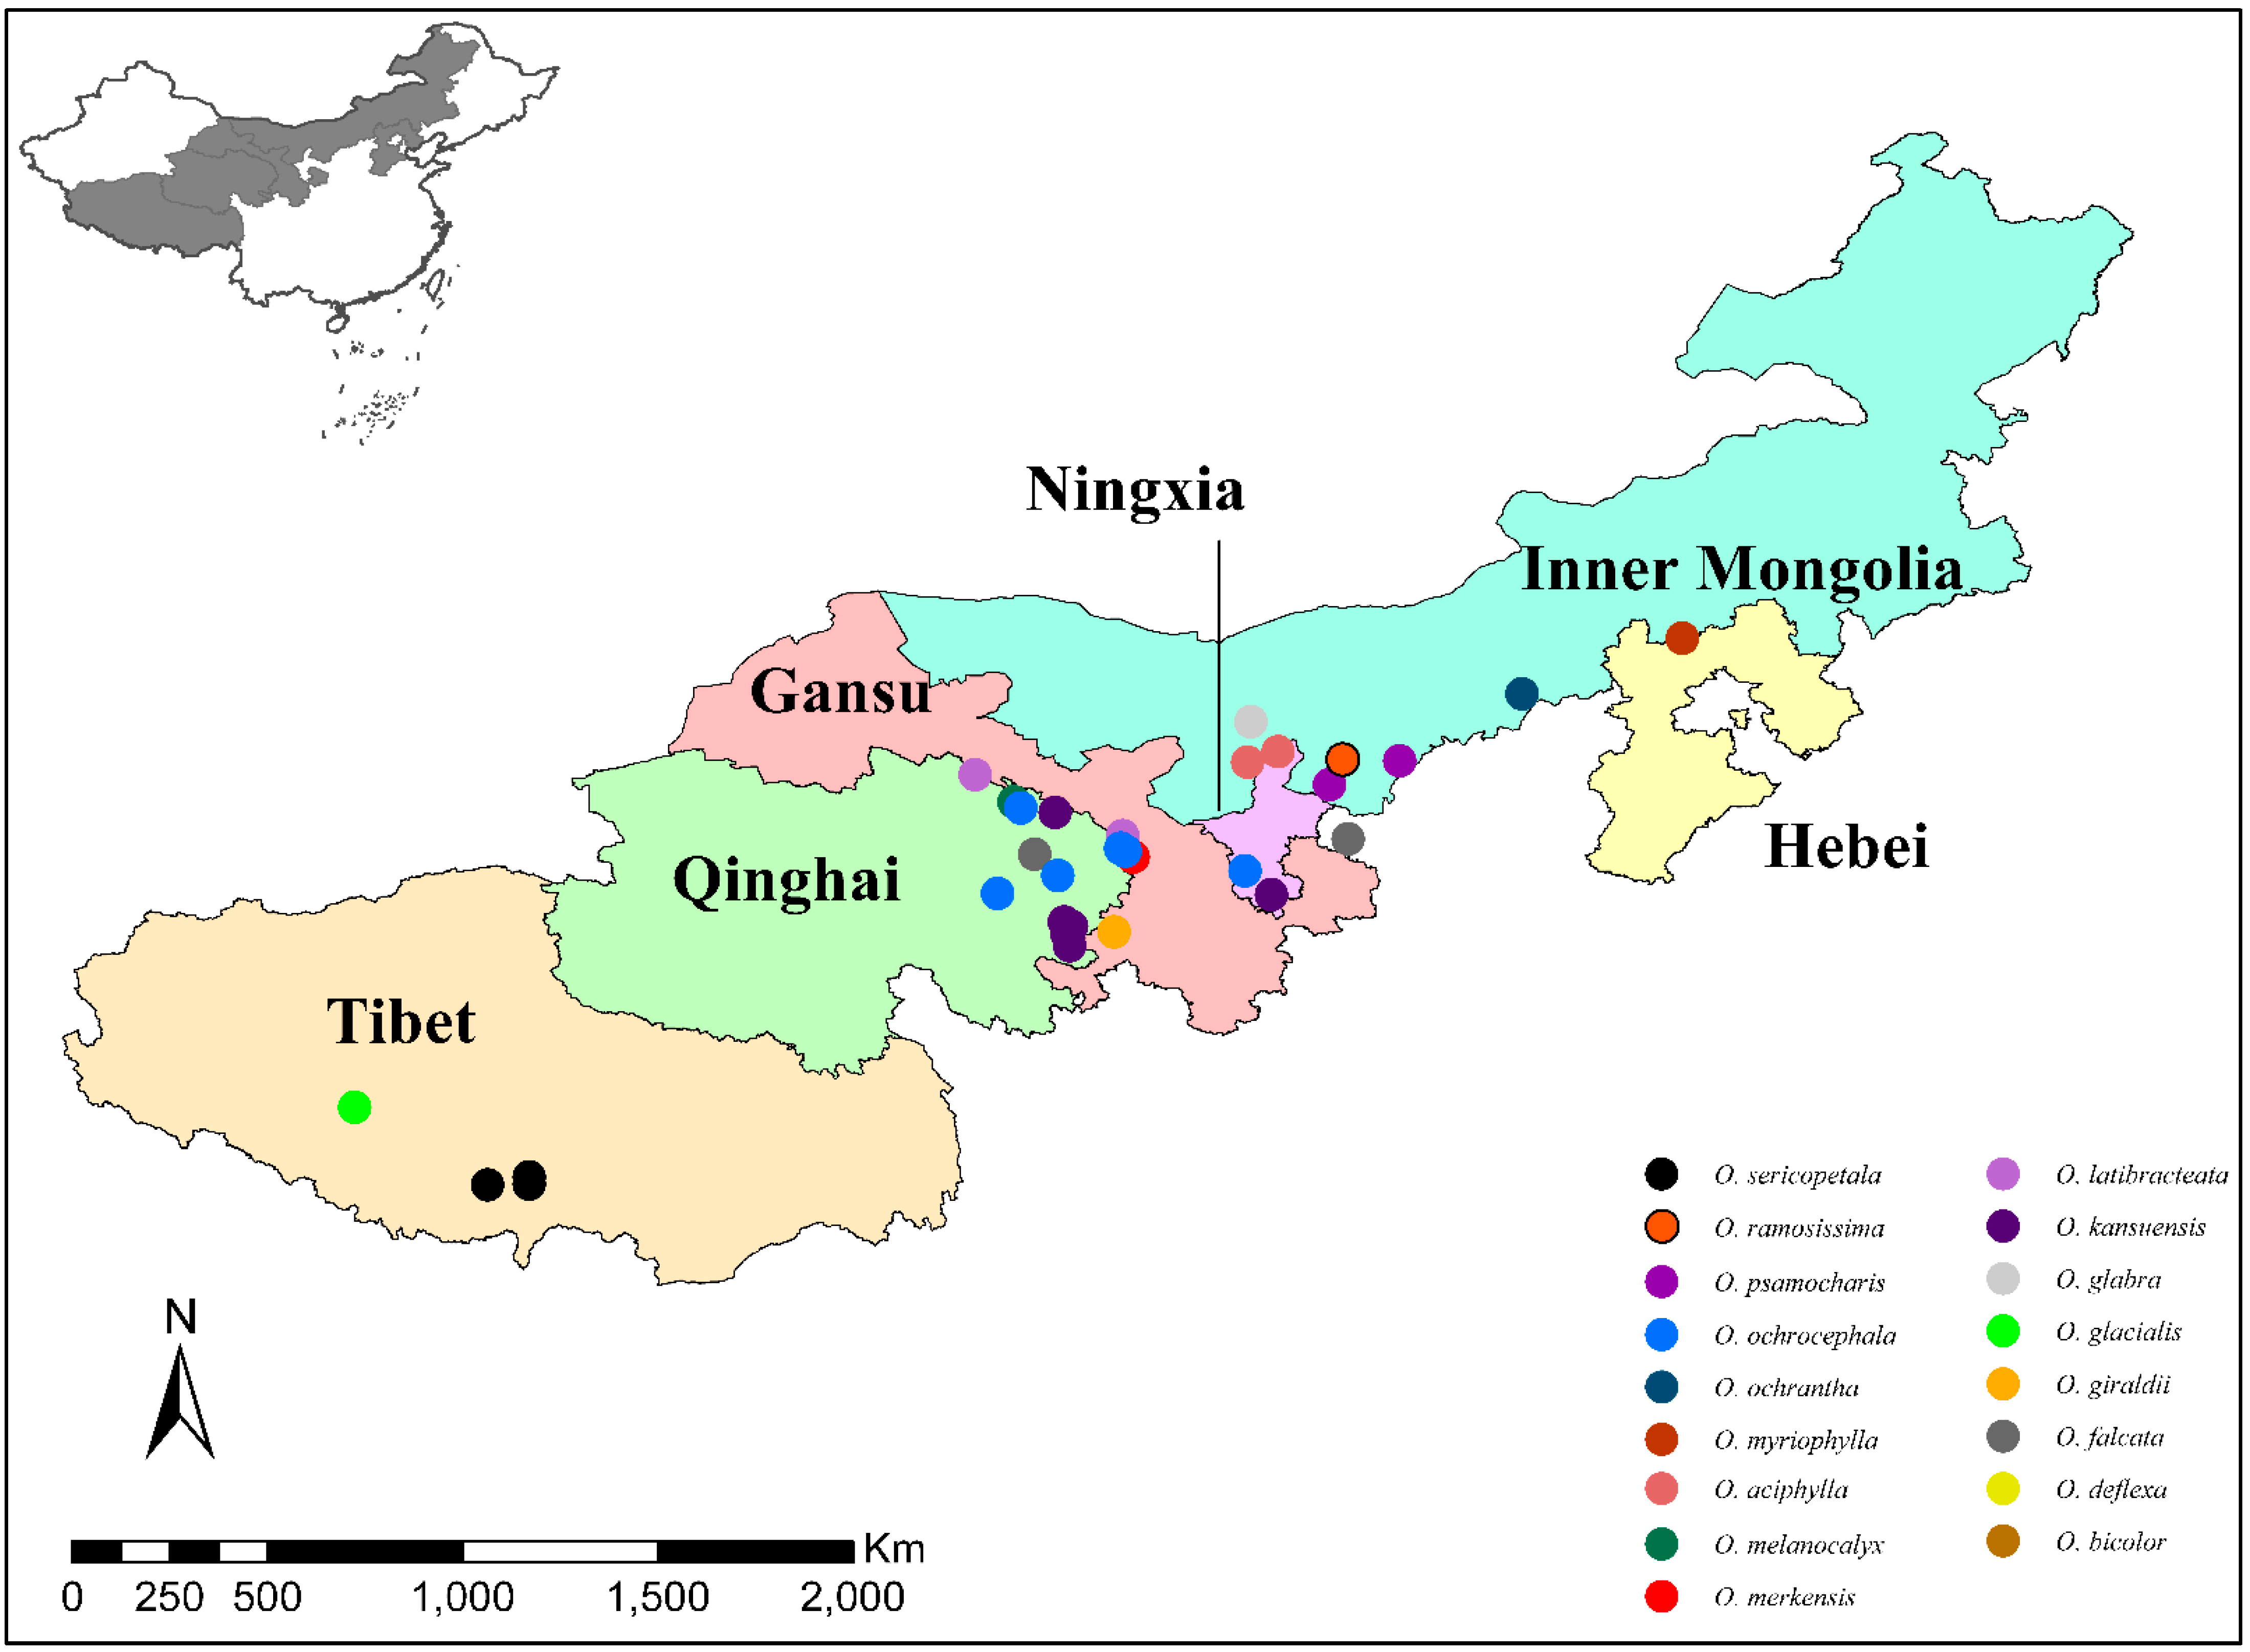
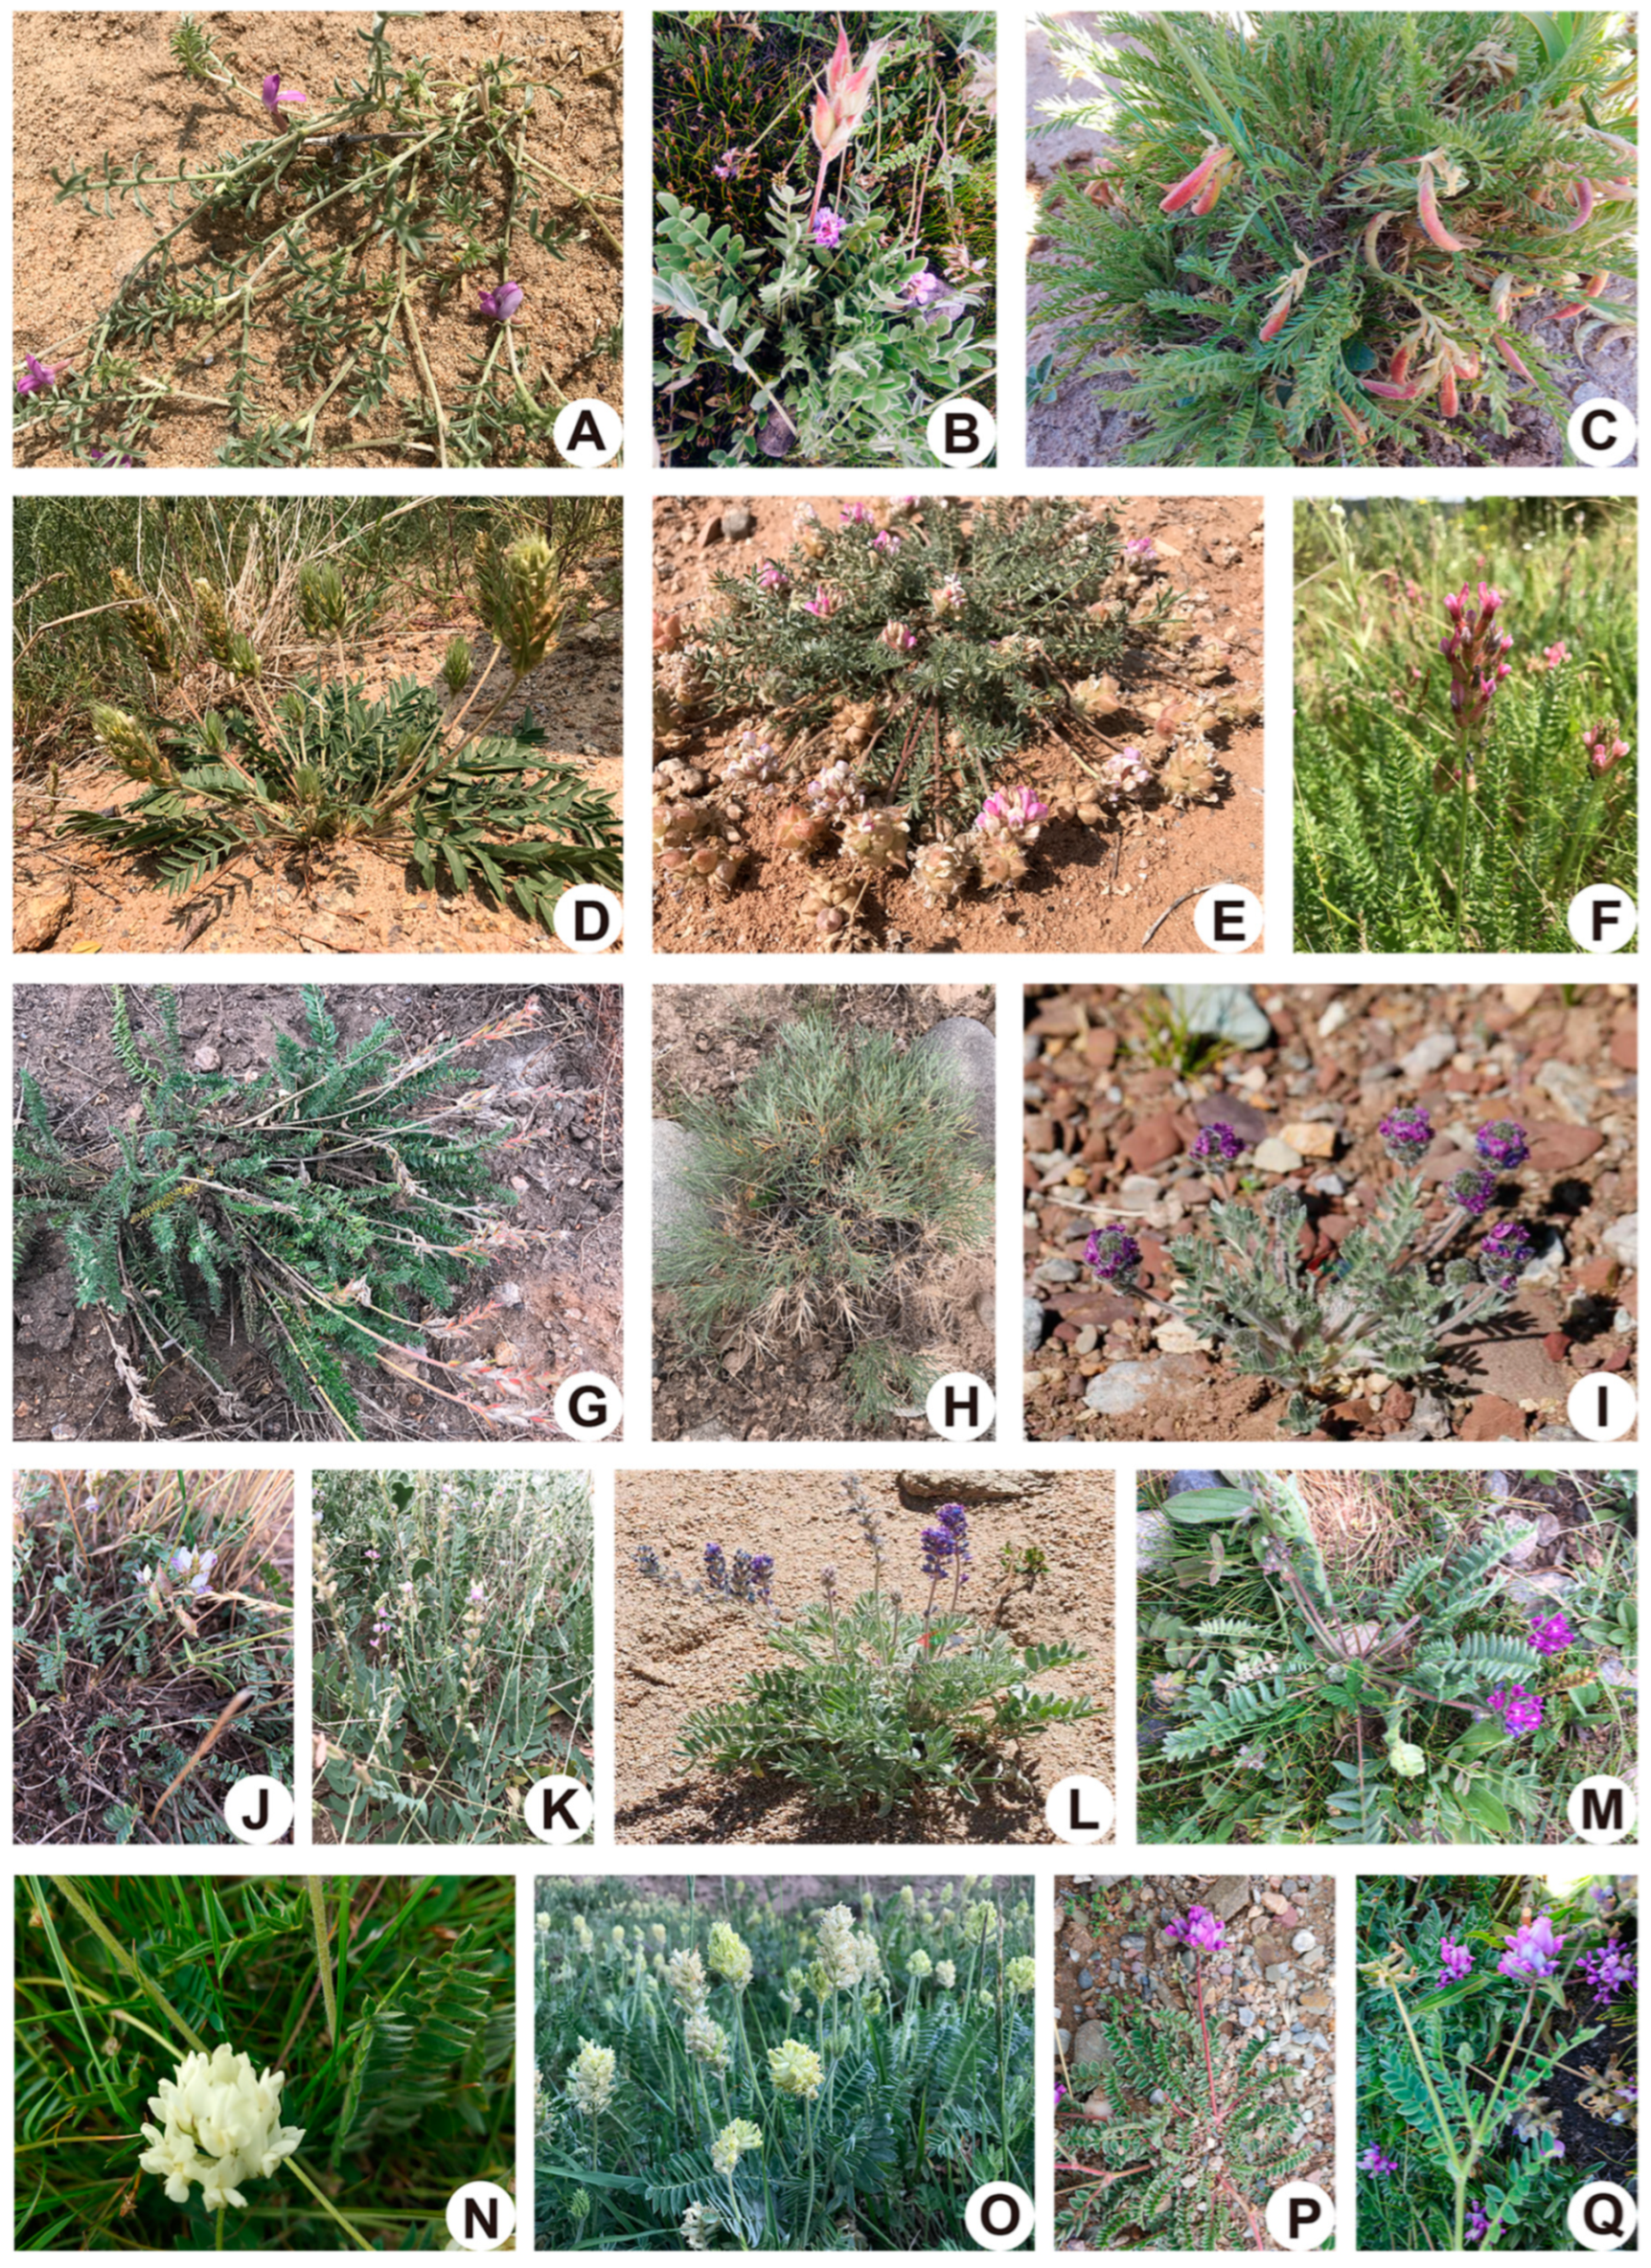
2.1. Genetic Evolution of the Natural Population of Oxytropis spp.

Data obtained from 181 experimental samples of SLAF-seq (Specific-Locus Amplified Fragment Sequencing) were derived including 170 plant individuals from 17 Oxytropis species, with 10 randomly selected samples as replicates and Medicago truncatula as the outgroup. On average, Q30 was 97.13% and the GC content was 41.31%. The average sequencing depth was 19.46×, with these sequences revealed as 21,539,214 SLAFs. A total of 1,239,417,229 SNPs were identified.
The K2P model measured the genetic similarity matrix between the species. The genetic distance (GD) value of the Oxytropis populations of the 17 species was 0.0026~0.1032 (Table S1). The analysis revealed a large genetic distance between the populations, high overall genetic differentiation and a wide genetic basis. Among the species, O. glabra (GLA) and O. myriophylla (MY) were the most distant species, whereas O. giraldii (GI) and O. melanocalyx (MEL) were the closest. Nucleotide diversity (PI) was used to show the extent of genetic diversity amongst the 17 species. O. aciphylla had the largest PI (0.000114), and the PI of O. glabra was the smallest (0.000057) (Table S2).
Phylogenetic assessment indicated two different clusters among the 17 Oxytropis species (Figure 1). This generally agreed with the subgenera classification, where Clade I (top) included eight species belonging to the Oxytropis subgen. Orobia, the Oxytropis subgen. Tragacanthoxytropis and a species of the Oxytropis subgen. Oxytropis; and Clade II (bottom) included nine species but only in the Oxytropis subgen. Oxytropis (available at http://www.cfh.ac.cn/ (accessed on 30 November 2021)). Most of the plant individuals from the same species clustered together and formed their own branch, except O. giraldii (GI) and O. melanocalyx (MEL), which are morphologically similar and had the least genetic distance between them.
The set of 1,239,417,229 SNPs (after removal of SNPs with MAF less than 0.05) were used for PCA analysis (Figure 2). Two principal components (PC) accounted for 49.29% and 50.71% of total variability, respectively. The 17 Oxytropis species could be arbitrarily divided into six different groups. From the top to the bottom they were as follows: (i–iv) the first four groups were composed exclusively of O. glabra, O. sericopetala, O. merkensis and O. deflexa, respectively; (v) the fifth plurispecific group comprised O. giraldii, O. melanocalyx, O. kansuensis and O. ochrocephala; and (vi) the sixth plurispecific group contained O. myriophylla, O. bicolor, O. ramosissima, O. psamocharis, O. aciphylla, O. ochrantha, O. glacialis, O. falcata and O. latibracteata, which is in accord with Clade I in the phylogenetic tree.
Admixture analysis was used to reveal the genetic structure of the samples. K = 8 was determined to be the most likely as indicated by CV errors (Figure S1) and we saw the admixture results of eight clusters (Figure 3, Figures S1 and S2). Cluster 1 contained both O. giraldii (GI) and O. melanocalyx samples. This agreed with the phylogenetic tree in which the two species cannot be resolved. Two individuals from GI-B, which were all collected from Qinghai Province (Figure 4, Table S3), showed genetic mixture with other clusters. Cluster 2 included O. kansuensis and O. ochrocephala composed of 35 samples from wide-ranging sampling sites (Qinghai, Gansu and Ningxia) (Figure 4, Table S3). The two species have similar morphological characteristics, such as flower colour and leaf morphology (Figure 5). Cluster 1 and 2 together represented the unresolved groups in PCA (group v). Clusters 3 and 4 contained the four well-separated species in PCA (group i–iv). O. sericopetala, O. glabra and O. merkensis formed Cluster 3, corresponding to their grouping in the phylogetetic tree, but in Cluster 4, O. deflexa, seemed to have introgressed into O. merkensis. This is also different from the evolutionary tree, in which O. deflexa shares an ancestor node with O. giraldii, O. melanocalyx, O. kansuensis and O. ochrocephala (Clusters 1 and 2). The admixture results of Clusters 5–8 distinguished the nine mixed samples in PCA (group vi) from each other. Samples of O. latibracteata, O. myriophylla and O. bicolor formed Cluster 5. Cluster 6 was formed by O. ramosissima only. Cluster 7 comprised O. aciphylla, O. psamocharis, O. ochrantha and O. glacialis, which showed considerable genetic admixture, especially in O. glacialis where O. falcata as Cluster 8 had introgressed. Compared with the phylogenetic tree, Clusters 1–4 relate to Clade I, and Clusters 5–8 relate to Clade II.
AMOVA analysis showed that 67.66% of the total genetic variation was between the 17 species, with 4.26% between sampled populations (from different geographical locations) within each species, and 28.09% between individuals within each of the 39 populations (Table 1). The fixation indices showed that genetic differentiation at all the three hierarchical levels was highly significant (Fsc = 0.13165, Fst = 0.71915 and Fct = 0.67657, p < 0.001).

2.2. Quantification of A. oxytropis and Swainsonine of Oxytropis Plants

Endophyte infection rates and swainsonine concentration in each individual plant were measured to see if these could be related to species. The levels of endophyte A. oxytropis ranged from 0.03 to 1.00 pg/ng as indicated by fungal/plant DNA ratios, and swainsonine contents ranged from 0.0006% to 1.19% as in plant dry mass (Table 2). A. oxytropis was detected in 9 out of the 17 species. These nine species all contained swainsonine. In these nine species, O. glacialis contained the highest level of swainsonine, but surprisingly, only one in five samples had detectable A. sect. Undifilum, and in that single sample, the levels were low.

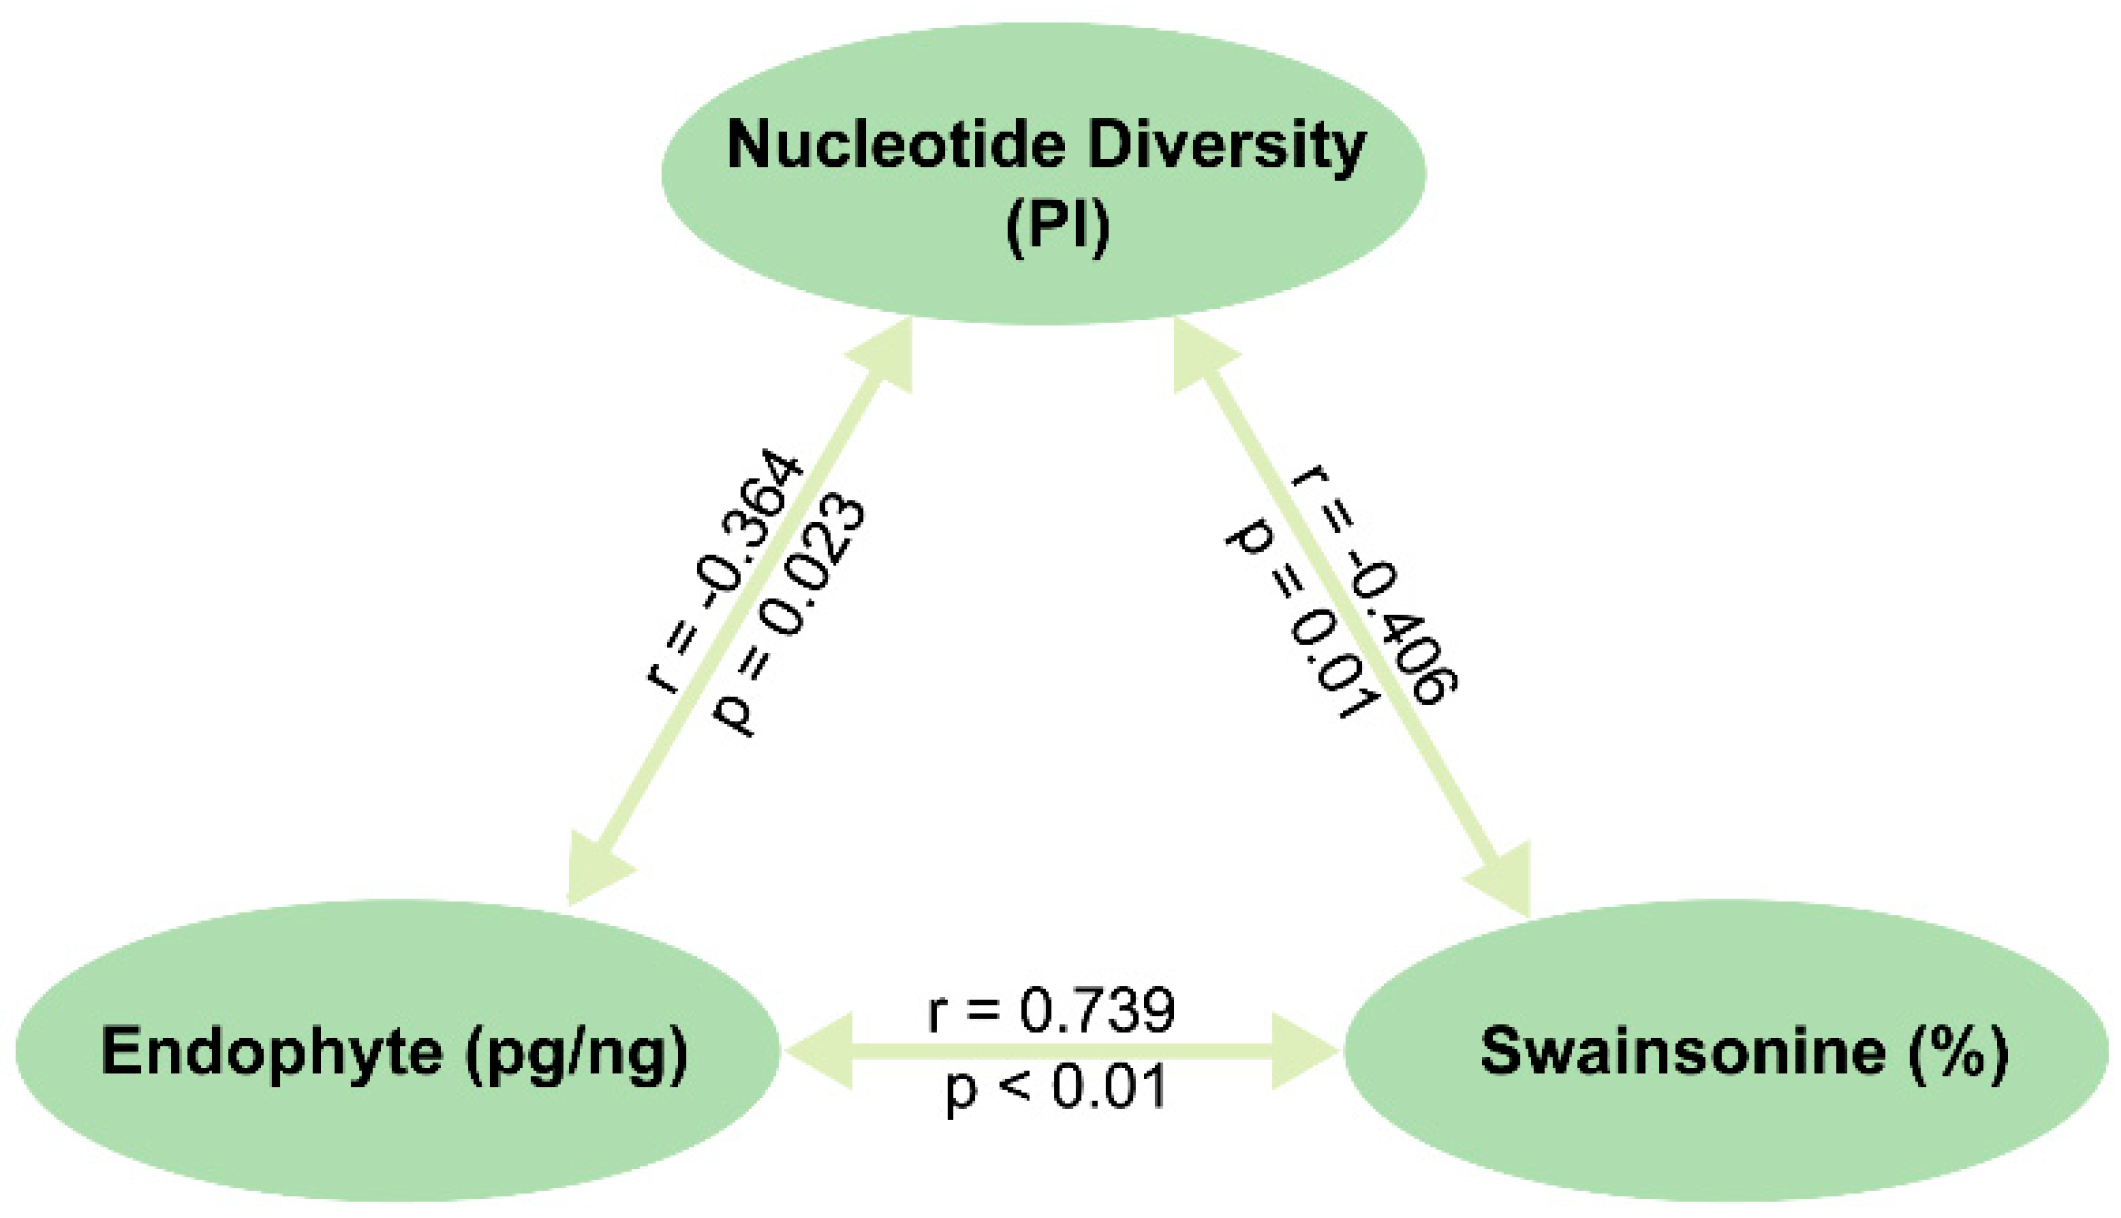
2.3. Interaction between Genetics and Environment and Their Integrated Effect on Endophyte Symbiosis and Swainsonine Production

To determine how host variation, endophyte interactions and environment could be related, a series of stepwise assessments were undertaken. The two genetic clades in the neighbour-joining tree of Oxytropis species did not distinguish the A. oxytropis positive or negative or the chemotypes of plants, e.g., the common ancestor of one clade did not correspond to monophyletic inheritance of symbiosis or toxicity (Figure 1, Table 2). Thus, the genetic variation of the host plants after speciation could be linked to the presence or absence of the endophytic fungi, such as genetic drift. We then analysed whether environmental factors play a role in plant genetic variation. To do this, we analysed how geographical and genetic distances of samples could be correlated. Correlation between geographical distance was weakly correlated with genetic distance (r = 0.2560, p < 0.001, n = 39) (Tables S4 and S5).
We further explored whether environmental factors had any impact on genetic diversity and the levels of endophytic fungi and swainsonine content in the Oxytropis plants (Table 3). Results showed that environmental variation had no influence on host genetic diversity in the populations (n = 39). The endophyte amount in the detectable individual samples was weakly correlated with annual average temperature (r = 0.301, p < 0.05, n = 59) and relative humidity (r = −0.322, p < 0.05, n = 59). The swainsonine content of each individual plant was weakly correlated with annual average water vapor pressure (r = −0.286, p < 0.05, n = 59) and moderately with relative humidity (r = −0.433, p < 0.01, n = 59), percentage sunlight (r = 0.363, p < 0.01, n = 59) and altitude (r = 0.341, p < 0.01, n = 59).
We then assessed whether there was a correlation between three factors, namely genetic diversity (as indicated by nucleotide diversity), endophyte and swainsonine content in the 39 Oxytropis populations (Figure 6). Results showed that there was a weak negative correlation between genetic diversity and endophyte levels (r = −0.364, p < 0.05, n = 39). These results indicated that genetic diversity in plant populations may have affected the infection of endophytic fungi to a certain extent, resulting in the different levels of the endophytic fungi in plants. Secondly, there was a moderate negative correlation between plant genetic diversity and swainsonine content (r = −0.406, p = 0.01, n = 39). Finally, there was a considerable correlation between endophytic and swainsonine levels in populations (r = 0.739, p < 0.01, n = 39).

3. Discussion

In this research, we examined the genetic variation of common Oxytropis spp. in China using genome-wide SNP data. Genetic differentiation was significant at the three genetic hierarchies amongst these species, but such differentiation was not influenced by environmental variation. Previous assessments of phylogenetic relationships and genetic diversity with Oxytropis plants employed the molecular approaches used at the time [29,30,31,32]. Most of these studies were based solely on such as 5.8SrDNA, ITS and cpDNA fragments (trnH-psbA, trnL–trnF, and trnS–trnG), or AFLP markers to reveal the developmental relationship between certain specific Oxytropis species [32,33,34,35,36,37]. Thus, the resulting inferences of Oxytropis evolutionary history and the division of certain morphologically similar species could be reappraised, especially with the development of high-throughput sequencing to identify SNPs. This approach has allowed the better characterisation of the determinants of plant–microbe interactions [38].
There are some obvious geographical barriers that could influence the distribution of Oxytropis species such as the Qinghai-Tibet Plateau and the Qilian and Helan mountain range. Such geographical effects were also seen in previous studies on Oxytropis campestris var. chartacea in eastern North America [32] and these may have caused the isolation of species and populations. Indeed, based on the phylogenetic relationships, most of the Oxytropis species we examined belong to their own clade showing diversity linked to speciation. However, it is worth noting that O. giraldii and O. melanocalyx could not be resolved. Given that these two species are morphologically alike and originated from a common ancestor, it may be that these could be regarded as subspecies but this awaits confirmation following further investigation. Alternatively, the hybridisation barrier may not function in these two species, so they are able to cross-pollinate and may have caused genetic introgression [39]. In addition, the traditional placement of O. glacialis to Oxytropis subgen. Oxytropis and O. aciphylla to Oxytropis subgen. Tragacanthoxoytropis may need to be revisited as both species are genetically close to the species in the Oxytropis subgen. Orobia. In a previous study, ITS and trnL-F sequences were used to group O. glacialis and other Oxytropis subgen. Oxytropis together [40], indicating that different molecular identification methods may have different results. Although PCA and admixture models resulted in six and eight clusters in the 17 species, they generally agreed with the phylogenetic tree in genetic relatedness. Genetic introgressions were observed in the admixture analysis. This may indicate those species diversified in specification in relatively recent evolutionary events.
In order to examine the endophyte levels, we developed a new qPCR primer set to avoid the nonspecific amplification observed in our previous work [27]. The new primer set was successfully used in the 17 species, demonstrating the effectiveness for future detection of the endophyte. There were significant differences in A. oxytropis content among different species of Oxytropis, but this was not detected in eight Oxytropis species. Swainsonine was detected in all of the 17 species, including species with traceable amount. This may be due to the highly sensitive swainsonine detection method we used in this study. According to a previous classification, four species—O. glacialis, O. deflexa, O. sericopetala and O. falcata—are type I Oxytropis plants, which indicates potent toxicity. Three species, previously reported as toxic locoweeds—O. glabra, O. ochrocephala and O. kansuensis—are less toxic due to having intermediate swainsonine content. According to previous reports, among the many Oxytropis species, nine of them—O. ochrocephala, O. glabra, O. kansuensis, O. glacialis, O. falcata, O. sericopetala, O. deflexa, O. latibracteata and O. hirta—are the most common poisonous Oxytropis species found in China [6,41,42]. However, our result suggested that O. latibracteata is only a Chemotype II plant, and thus much less toxic or considered as non-toxic. Chemotype I and Chemotype II plants were found in the same species in various locations (Table S4), which could suggest that conversion between toxic or non-toxic Oxytropis plants is possible. In O. sericea, the content of A. oxytropis, host plant site, biological stage, planting site and the genotype of the endophyte would all possibly affect the levels of swainsonine [18,19,23,43]. Therefore, we speculate that the results of the above differences may also be related to the joint action of the amount of endophyte, climate environment and soil microbes as well as other factors, which all need to be further studied.
In this study, endophyte levels and swainsonine concentrations were fairly well correlated in the 17 species surveyed. However, in some species, for example O. glacialis, endophyte infection rates and levels were low but this species had the highest swainsonine concentration. This may reflect the presence of other swainsonine-producing strains [20], such as either other A. oxytropis-related fungi in A. sect. Undifilum which were not able to be detected by the qPCR primer set, or other endophytes, as many fungi contain the swnK gene (as suggested by a blast search against the NCBI database, data not shown). It is also possible that swainsonine is produced in other organs in the host, but transferred into the leaf via vascular tissues. Similar results were found in our previous study [27].
Previously, we speculated that G × E interactions influence swainsonine biosynthesis in an Oxytropis species [27]. In this study, we took this further in different Oxytropis species at the genus level. Since A. oxytropis is considered to be vertically transmitted only, its presence in different Oxytropis species may indicate such symbiosis was shared in the common ancestor of the Oxytropis genus. During evolution, genetic divergence of the common ancestor of a certain lineage may result in the loss of A. oxytropis in different species, if an unknown selection force has worked as a driver [42,43,44]. If this were the case, the genetic similarity of several host species should reflect the presence or absence of A. oxytropis symbiosis. However, we observed that Oxytropis species with or without the endophyte symbiosis did not cluster together in separate lineages. On the other hand, we found that the genetic variation of the host is negatively correlated with the content of A. oxytropis and swainsonine at the population level. Therefore, we speculate that genetic drift could have led to the gradual loss or tune-down of this symbiotic capability. This could also indicate that the symbiosis may be selectively neutral as the hosts evolve and is being stochastically lost in several species. Meanwhile, several environmental factors were correlated with the amount of A. oxytropis and swainsonine. Since the levels of endophyte and swainsonine are positively correlated, environment may have an indirect or direct impact on swainsonine biosynthesis. Such a mechanism needs further investigation.

4. Conclusions

In this study we characterised the genetic diversity and levels of endophyte symbiosis and swainsonine in 17 common Oxytropis species in China. We showed that speciation, possibly with genetic drift, rather than the genetic lineage, is associated with the fixation or loss of endophyte and swainsonine production, which appears to be a random event. Similar to the influence at the species level, G × E also affects endophyte symbiosis and swainsonine production in the Oxytropis genus. Our study will provide better understanding about the evolutionary basis of A. oxytropis symbiosis and swainsonine biosynthesis in locoweeds.

5. Materials and Methods

5.1. Plant Materials and Genomic DNA Extraction

A total of 170 individuals from 17 Oxytropis species were collected from grasslands in China during the summer of 2017 (Figure 4 and Figure 5) and the associated geographical information was recorded (Table S3). Upon collection, foliar tissue was desiccated in airtight bags with silica. Voucher samples and specimens were stored in Northwest University, China. Taxonomic identification was performed by Prof. Chaoyang Chang from Northwest Agriculture and Forest University, who specialises in Oxytropis and Fabaceae. Leaves were ground to powder using a Tissue Lyser II bead-mill (Qiagen, Hilden, Germany). DNA was extracted from the ground tissue using the DNEasy plant mini-kit (Qiagen). DNA integrity was determined on 1% agarose gel and the concentration was measured on a NanoDrop ND-1000 Spectrophotometer (NanoDrop Technologies, Wilmington, DE, USA). DNA samples were aliquoted and stored at −20 °C and −80 °C until use.

5.2. SLAF Sequencing and SNP Calling

Genotypes of 170 individuals from 17 species of Oxytropis were analysed by SLAF-seq, a genotyping by sequencing approach. SLAF-seq library construction and high-throughput sequencing were performed as described previously [45]. After a quality check of the sequencing data, the BLAT program [46] was used to cluster SLAF tags for each sample according to sequence similarity to obtain polymorphic SLAF tags. Then, the “mem” program of BWA was used to compare the filtered high-quality data to the reference genome of O. ochrocephala available in our laboratory (PRJNA771236 in NCBI), and the comparison parameters were set as default. The comparison result was outputted in sam format. The “SortSam” command of Picard 1.107 was used to sort the sam files. Next, GATK (Genomics Analysis K V3.8) [47] was used to detect SNPs, which were further filtered to obtain high-quality SNP markers. The filter conditions were set as follows: (1) Coverage multiple ≥ 16, major SNP coverage multiple ≥ 8, major SNP coverage multiple /minor SNP coverage multiple ≥ 5; (2) MQ (RMS Mapping Quality) ≥ 25; (3) QD (Variant Confidence/Quality by Depth) ≥ 2.

5.3. Characterisation of Genetic Diversity and Genetic Structure

To reveal the genetic structure among all individuals, we constructed the phylogenetic tree and performed principal component analysis (PCA), and inferred a group genetic structure. Using the neighbor-joining algorithm, the Kimura 2-parameter model was selected to construct the phylogenetic tree of 17 Oxytropis species with 1000 bootstraps using MEGA7.0 [48]. Medicago truncatula (Mt) was selected as the outgroup and used as the root. The population structure was analysed using ADMIXTURE [49], and the cluster number (K value) of all samples was determined for K = 1–10. The optimal cluster number K (best taxa) was determined as the one with the minimum cross-validation error rate (CV). GCTA [50] (http://www.complextraitgenomics.com/software/gcta/ (accessed on 30 November 2021)) was used for the PCA analysis.
In order to analyse the genetic structure of Oxytropis, in addition to calculating genetic distance, AMOVA [51] was used to estimate the degree of genetic differentiation among and within populations/species.

5.4. Determination of Endophyte and Swainsonine Concentration

Most of the samples used for SLAF-seq were assessed for levels of A. oxytropis. A quantitative real-time PCR method (qPCR) was used to determine the amount of the endophytic DNA of A. oxytropis which was contained in the extracted total genomic DNA from the plant [52]. In view of the limitation of the previous method for quantifying endophyte A. oxytropis in two Oxytropis species due to unspecific amplification (in O. kansuensis and O. ochrocephala) [27], a new primer set was developed based on a polyketide gene swnK. A standard curve (Figure S3) was established using a dilution series of the endophyte DNA extracted from pure fungal culture, and the amount of endophyte calculated. All the qPCR reactions were performed in quadruplicate using the forward and reverse primer SwnK-q-S/SwnK-q-AS (Table S6). The reaction conditions are described in Table S7 and in Figure S4.
Swainsonine extraction was performed as described by [53]. The samples were analysed by flow infusion electro-spray ionisation high-resolution mass spectrometry (FI-ESI-MS). The mass spectra were acquired on an Accela (ThermoFinnigan, San Jose, CA, USA) ultra-performance liquid chromatography system coupled to an Exactive Orbitrap (ThermoFinnigan, San Jose, CA, USA) mass spectrometer. For determination, 20 μL of sample was injected and delivered to the ESI source via ultra-pure H2O (18.2 Ω) and pre-mixed HPLC grade MeOH (Fisher Scientific, Hampton, NH, United States) or a flow solvent (mobile phase) at a ratio of 3:7. For the first 1.5 min, the flow rate was 200 μL·min−1 and 600 μL·min−1 for the remaining 1.5 min of the method. Both ionisation modes were acquired at the same time. The maximum injection time was 205 ms and the mass resolution was 100,000 with an automatic gain control (AGC) of 5 × 10⁵ for both modes of ionisation. Swainsonine peak intensities (m/z 174.1124 [M+H]+) were converted to ug/mL concentration based on the derivation of a standard curve using commercially obtained swainsonine (Santa Cruz Biotechnology, Dallas, TX, USA) that was assessed by FI-FI-ESI-MS.
Endophyte levels were calculated and represented as the DNA content of endophyte A. oxytropis in plant DNA content (pg/ng). Swainsonine content in each sample was obtained and represented as the percentage of swainsonine in plant dry weight (%). To keep consistent with previous studies, we applied a 0.0001% limit for swainsonine. Any value below this value was considered as not detected [50].

5.5. Statistical Analysis

In order to obtain more accurate plant genetic distance and geographic distance analysis results, after re-dividing all samples into 39 populations according to sampling locations, we used the K2P model in MEGA 7.0 to recalculate the genetic distance matrix. The geographic distance matrix between any two sampling locations was calculated by the latitude and longitude information in Google Earth (V7. 15. 1557). Finally, the “ade4” program in the R package was used to conduct Mental tests to analyse the correlation between the genetic distance and geographical distance of Oxytropis spp.
We also examined the influence of different climate factors and altitude on plant genetic diversity, endophytic fungus content and swainsonine content. Climate data at county level relevant to the 39 populations for 1988–2018 were downloaded from the China Meteorological Data Network (http://data.cma.cn/ (accessed on 20 September 2019)), and Kriging interpolation on the data was performed in ArcGIS 10.2 software based on the coordination of the 39 populations (Table S2). To analyse the correlation for endophyte and swainsonine, only individuals with detectable endophyte were used for Pearson correlation analysis by SPSS Statistics v22.
Finally, in order to show the relationship between the genetic diversity and the contents of A. oxytropis and swainsonine in Oxytropis, we first characterised the genetic diversity parameter nucleotide diversity (PI) in the 39 populations using vcftools [54]. Then we used SPSS Statistics V22 to perform a Spearman bivariate correlation analysis of nucleotide diversity, endophytic fungus content and swainsonine.

Supplementary Materials

The following supporting information can be downloaded at: https://0-www-mdpi-com.brum.beds.ac.uk/article/10.3390/toxins14030181/s1, Figure S1: CV value of ADMIXTURE, Figure S2: Results of ADMIXTURE, Figure S3: A standard curve of qPCR reaction, Figure S4: Reaction procedures of qPCR reaction, Table S1: Genetic distances separating the 17 Oxytropis species, Table S2: The climate factors, altitude, nucleotide diversity, endophytic fungi and swainsonine content information of 39 populations of Oxytropis species, Table S3: The sampling information of Oxytropis species, Table S4: Genetic distance of Kimura 2-parameter matrix of Oxytropis species, Table S5: Geographic distance of Kimura 2-parameter matrix of Oxytropis species, Table S6: Gene primer information, Table S7: qPCR reaction system.

Author Contributions

Conceptualization, W.H. and L.A.J.M.; Data curation, L.Z. and Q.Z.; Formal analysis, Q.Z. and C.G.; Funding acquisition, W.H. and L.A.J.M.; Investigation, C.G., Q.Z., M.B. and H.P.; Resources, W.H. and C.M.; Visualization, C.G., L.Z and H.M.; Writing—review & editing, C.G., W.H. and L.A.J.M. All authors have read and agreed to the published version of the manuscript.

Funding

This research was funded by National Natural Science Foundation of China (31402133); Key Laboratory Research Fund of Department of Education of Shaanxi Province [18JS110]; International Collaboration Fund of Department of Science and Technology of Shaanxi Province [2020KW-030]; Key Laboratory of Grassland Resources of Ministry of Education in Inner Mongolia Agricultural University (2020); Biotechnology and Biological Sciences Research Council [BB/R02118X/1]. Special Aid Fund for Qinghai Province (2020-QY-210).

Institutional Review Board Statement

Not applicable.

Informed Consent Statement

Not applicable.

Data Availability Statement

The data presented in this study are available on request from the corresponding author.

Acknowledgments

We thank Chaoyang Chang from Northwest Agriculture and Forest University for the taxonomic identification of the Oxytropis plants.

Conflicts of Interest

The authors declare that they have no conflict of interest.

References

  1. Rodriguez, R.J.; White, J.F., Jr.; Arnold, A.E.; Redman, R.S. Fungal endophytes: Diversity and functional roles. New Phytol. 2009, 182, 314–330. [Google Scholar] [CrossRef]
  2. Saikkonen, K.; Young, C.A.; Helander, M.; Schardl, C.L. Endophytic Epichloё species and their grass hosts: From evolution to applications. Plant Mol. Biol. 2016, 90, 665–675. [Google Scholar] [CrossRef] [PubMed]
  3. Martin, F.M.; Uroz, S.; Barker, D.G. Ancestral alliances: Plant mutualistic symbioses with fungi and bacteria. Science 2017, 356, eaad4501. [Google Scholar] [CrossRef]
  4. Zhao, Z.; Li, X.; Liu, M.F.; Merckx, V.S.F.T.; Saunders, R.M.K.; Zhang, D. Specificity of assemblage, not fungal partner species, explains mycorrhizal partnerships of mycoheterotrophic Burmannia plants. ISME J. 2021, 15, 1614–1627. [Google Scholar] [CrossRef]
  5. Harrison, J.G.; Grifin, E.A. The diversity and distribution of endophytes across biomes, plant phylogeny and host tissues: How far have we come and where do we go from here? Environ. Microbiol. 2020, 22, 2107–2123. [Google Scholar] [CrossRef] [PubMed]
  6. Zhao, M.; Gao, X.; Wang, J.; He, X.; Han, B. A review of the most economically important poisonous plants to the livestock industry on temperate grasslands of China. J. Appl. Toxicol. 2013, 33, 9–17. [Google Scholar] [CrossRef]
  7. Cook, D.; Gardner, D.R.; Lee, S.T.; Pfister, J.A.; Stonecipher, C.A.; Welsh, S.L. A swainsonine survey of North American Astragalus and Oxytropis taxa implicated as locoweeds. Toxicon 2016, 118, 104–111. [Google Scholar] [CrossRef]
  8. Wang, Q.; Nagao, H.; Li, Y.; Wang, H.; Kakishima, M. Embellisia Oxytropis, a new species isolated from Oxytropis kansuensis in China. Mycotaxon 2006, 95, 255–260. [Google Scholar]
  9. Pryor, B.; Creamer, R.; Shoemaker, R.; McLain-Romero, J.; Hambleton, S. Undifilum, a new genus for endophytic Embellisia oxytropis and parasitic Helminthosporium bornmuelleri on legumes. Botany 2009, 87, 178–194. [Google Scholar] [CrossRef]
  10. Woudenberg, J.H.C.; Groenewald, J.Z.; Binder, M.; Crous, P.W. Alternaria redefined. Stud Mycol 2013, 75, 171–212. [Google Scholar] [CrossRef]
  11. Molyneux, R.; James, L. Loco intoxication: Indolizidine alkaloids of spotted locoweed (Astragalus lentiginosus). Science 1982, 216, 190–191. [Google Scholar] [CrossRef] [PubMed]
  12. Colegate, S.M.; Dorling, P.R.; Huxtable, C.R. A spectroscopic investigation of swainsonine: An α-Mannosidase inhibitor isolated from Swainsona canescens. Aust. J. Chem. 1979, 32, 2257–2264. [Google Scholar] [CrossRef]
  13. Zhao, B.; Liu, Z.; Wan, X.; Huo, X.; Guo, X.; Wang, J.; Liu, Z.; Sun, L.; Shi, Z. Damage and control of poisonous-weeds in Chinese western grassland. Sci. Agric. Sin. 2008, 41, 3094–3103. [Google Scholar]
  14. Cook, D.; Ralphs, M.H.; Welch, K.D.; Stegelmeier, B.L. Locoweed poisoning in livestock. Rangelands 2009, 31, 16–21. [Google Scholar] [CrossRef]
  15. Lu, H.; Cao, D.; Ma, F.; Wang, S.; Yang, X.; Wang, W.; Zhou, Q.; Zhao, B. Characterisation of locoweeds and their effect on livestock production in the western rangelands of China: A review. Rangel. J. 2014, 36, 121–131. [Google Scholar] [CrossRef]
  16. China National Animal Husbandry Station. China’s Grassland Biological Disasters; China Agriculture Press: Beijing, China, 2018. [Google Scholar]
  17. Creamer, R.; Baucom, D. Fungal endophytes of locoweeds: A commensal relationship? J. Plant Physiol. Pathol. 2013, 1, 2. [Google Scholar] [CrossRef]
  18. Cook, D.; Shi, L.; Gardner, D.R.; Pfister, J.A.; Grum, D.; Welch, K.D.; Ralphs, M.H. Influence of phenological stage on swainsonine and endophyte concentrations in Oxytropis sericea. J. Chem. Ecol. 2012, 38, 195–203. [Google Scholar] [CrossRef]
  19. Cook, D.; Grum, D.S.; Gardner, D.R.; Welch, K.D.; Pfister, J.A. Influence of endophyte genotype on swainsonine concentrations in Oxytropis sericea. Toxicon 2013, 61, 105–111. [Google Scholar] [CrossRef]
  20. Cook, D.; Donzelli, B.G.G.; Creamer, R.; Baucom, D.L.; Gardner, D.R.; Pan, J.; Moore, N.; Krasnoff, S.B.; Jaromczyk, J.W.; Schardl, C.L. Swainsonine biosynthesis genes in diverse symbiotic and pathogenic fungi. G3 Genes|Genomes|Genet. 2017, 7, 1791–1797. [Google Scholar] [CrossRef]
  21. Cook, D.; Gardner, D.R.; Grum, D.; Pfister, J.A.; Ralphs, M.H.; Welch, K.D.; Green, B.T. Swainsonine and endophyte relationships in Astragalus mollissimus and Astragalus lentiginosus. J. Agric. Food Chem. 2011, 59, 1281–1287. [Google Scholar] [CrossRef]
  22. Ralphs, M.H.; Creamer, R.; Baucom, D.; Gardner, D.R.; Welsh, S.L.; Graham, J.D.; Hart, C.; Cook, D.; Stegelmeier, B.L. Relationship between the endophyte Embellisia spp. and the toxic alkaloid swainsonine in major locoweed species (Astragalus and Oxytropis). J. Chem. Ecol. 2008, 34, 32–38. [Google Scholar] [CrossRef] [PubMed]
  23. Cook, D.; Gardner, D.R.; Ralphs, M.H.; Pfister, J.A.; Welch, K.D.; Green, B.T. Swainsoninine concentrations and endophyte amounts of Undifilum oxytropis in different plant parts of Oxytropis sericea. J. Chem. Ecol. 2009, 35, 1272–1278. [Google Scholar] [CrossRef] [PubMed]
  24. Ralphs, M.H.; Cook, D.; Gardner, D.R.; Grum, D.S. Transmission of the locoweed endophyte to the next generation of plants. Fungal Ecol. 2011, 4, 251–255. [Google Scholar] [CrossRef]
  25. Grum, D.S.; Cook, D.; Gardner, D.R.; Roper, J.M.; Pfister, J.A.; Ralphs, M.H. Influence of seed endophyte amounts on swainsonine concentrations in Astragalus and Oxytropis locoweeds. J. Agric. Food Chem. 2012, 60, 8083–8089. [Google Scholar] [CrossRef] [PubMed]
  26. Harrison, J.G.; Parchman, T.L.; Cook, D.; Gardner, D.R.; Forister, M.L. A heritable symbiont and host-associated factors shape fungal endophyte communities across spatial scales. J. Ecol. 2018, 106, 2274–2286. [Google Scholar] [CrossRef]
  27. He, W.; Guo, L.; Wang, L.; Zhao, Q.; Guo, L.; Cao, W.; Mur, L.A.J.; Wei, Y. Host genotype and precipitation influence of fungal endophyte symbiosis and mycotoxin abundance in a locoweed. Int. J. Mol. Sci. 2019, 20, 5285. [Google Scholar] [CrossRef] [PubMed]
  28. Gardner, D.R.; Mclain-Romero, J.M.; Ralphs, M.H.; Creamer, R. Correlation of an endophytic fungus (Alternaria spp.) with the presence of swainsonine in lambert locoweed (Oxytropis lambertii). Poisonous Plants Relat. Toxins 2004, 3, 32–37. [Google Scholar]
  29. Kholina, A.B.; Koren’, O.G.; Zhuravlev, Y.N. High polymorphism and autotetraploid origin of the rare endemic species Oxytropis chankaensis Jurtz. (Fabaceae) inferred from allozyme data. Russ. J. Genet. 2004, 40, 393–400. [Google Scholar] [CrossRef]
  30. Schönswetter, P.; Tribsch, A.; Niklfeld, H. Amplified Fragment Length Polymorphism (AFLP) reveals no genetic divergence of the Eastern Alpine endemic Oxytropis campestris subsp. tiroliensis (Fabaceae) from widespread subsp. campestris. Plant Syst. Evol. 2004, 244, 245–255. [Google Scholar] [CrossRef]
  31. Artyukova, E.V.; Kholina, A.B.; Kozyrenko, M.M.; Zhuravlev, Y.N. Analysis of genetic variation in rare endemic species Oxytropis chankaensis Jurtz. (Fabaceae) using RAPD markers. Russ. J. Genet. 2004, 40, 710–716. [Google Scholar] [CrossRef]
  32. Chung, M.; Gelembiuk, G.; Givnish, T.J. Population genetics and phylogeography of endangered Oxytropis campestris var. chartacea and relatives: Arctic-alpine disjuncts in eastern North America. Mol. Ecol. 2004, 13, 3657–3673. [Google Scholar] [CrossRef] [PubMed]
  33. Kholina, A.B.; Kozyrenko, M.M.; Artyukova, E.V.; Sandanov, D.V.; Andrianova, E.A. Phylogenetic relationships of the species of Oxytropis DC. subg. Oxytropis and Phacoxytropis (Fabaceae) from Asian Russia inferred from the nucleotide sequence analysis of the intergenic spacers of the chloroplast genome. Russ. J. Genet. 2016, 52, 780–793. [Google Scholar] [CrossRef]
  34. Tekpinar, A.D.; Erkul, S.K.; Aytaç, Z.; Kaya, Z. Phylogenetic relationships between Oxytropis DC. and Astragalus L. species native to an Old World diversity center inferred from nuclear ribosomal ITS and plastid matK gene sequences. Turk. J. Biol. 2016, 40, 250–263. [Google Scholar] [CrossRef]
  35. Almerekova, S.; Mukhitdinov, N.; Abugalieva, S. Phylogenetic study of the endemic species Oxytropis almaatensis (Fabaceae) based on nuclear ribosomal DNA ITS sequences. BMC Plant Biol. 2017, 17, 173. [Google Scholar] [CrossRef] [PubMed]
  36. Shavvon, R.S.; Osaloo, S.K.; Maassoumii, A.A.; Moharrek, F.; Erkul, S.K.; Lemmon, A.R.; Lemmon, E.M.; Michalak, I.; Muellner-Riehl, A.N.; Favre, A. Increasing phylogenetic support for explosively radiating taxa: The promise of high-throughput sequencing for Oxytropis (Fabaceae). J. Syst. Evol. 2017, 55, 385–404. [Google Scholar] [CrossRef]
  37. Archambault, A.; Strömvik, M. Evolutionary relationships in Oxytropis species, as estimated from the nuclear ribosomal internal transcribed spacer (ITS) sequences point to multiple expansions into the Arctic. Botany 2012, 90, 770–779. [Google Scholar] [CrossRef]
  38. Knief, C. Analysis of plant microbe interactions in the era of next generation sequencing technologies. Front. Plant Sci. 2014, 5, 216. [Google Scholar] [CrossRef]
  39. Kozurahova, E.; Richards, A.J. Breeding systems of rare and endemic Asytagalus, Oxytropis and Onobrychis species (Fabaceae) tested with alternative methods. C. R. I’académie Bulg. Des. Sci. 2016, 69, 1571–1580. [Google Scholar]
  40. Li, Y.; Lan, F.; Chang, Z.; Guo, Z. Molecular phylogeny of Oxytropis DC.of Qinghai-Tibetan Plateau by ITS and trnL-F sequences. J. Northwest A F Univ. (Nat. Sci. Ed.) 2011, 39, 187–193. [Google Scholar] [CrossRef]
  41. Schirrmann, M.K.; Zoller, S.; Croll, D.; Stukenbrock, E.H.; Leuchtmann, A.; Fior, S. Genomewide signatures of selection in Epichloё reveal candidate genes for host specialization. Mol. Ecol. 2018, 27, 3070–3086. [Google Scholar] [CrossRef]
  42. Gladieux, P. What makes a specialized endophyte special? Mol. Ecol. 2018, 27, 3037–3039. [Google Scholar] [CrossRef] [PubMed]
  43. Oldrup, E.; McLain-Romero, J.; Padilla, A.; Moya, A.; Gardner, D.; Creamer, R. Localization of endophytic Undifilum fungi in locoweed seed and influence of environmental parameters on a locoweed in vitro culture system. Botany 2010, 88, 512–521. [Google Scholar] [CrossRef]
  44. Saikkonen, K.; Wäli, P.; Helander, M.; Faeth, S.H. Evolution of endophyte-plant symbioses. Trends Plant Sci. 2004, 9, 275–280. [Google Scholar] [CrossRef]
  45. Sun, X.; Liu, D.; Zhang, X.; Li, W.; Liu, H.; Hong, W.; Jiang, C.; Guan, N.; Ma, C.; Zeng, H.; et al. SLAF-seq: An efficient method of large-scale de novo SNP discovery and genotyping using high-throughput sequencing. PLoS ONE 2013, 8, e58700. [Google Scholar] [CrossRef] [PubMed]
  46. Kent, W.J. Blat-the BLAST-like alignment tool. Genome Res. 2001, 12, 656–664. [Google Scholar] [CrossRef]
  47. McKenna, A.; Hanna, M.; Banks, E.; Sivachenko, A.; Cibulskis, K.; Kernytsky, A.; Garimella, K.; Altshuler, D.; Gabriel, S.; Daly, M.; et al. The genome analysis toolkit: A mapreduce framework for analyzing next-generation DNA sequencing data. Genome Res. 2010, 20, 1297–1303. [Google Scholar] [CrossRef]
  48. Kumar, S.; Stecher, G.; Tamura, K. Mega7: Molecular evolutionary genetics analysis version 7.0 for bigger datasets. Mol. Biol. Evol. 2016, 33, 1870–1874. [Google Scholar] [CrossRef]
  49. Pickrell, J.K.; Pritchard, J.K. Inference of population splits and mixtures from genome-wide allele frequency data. PLoS Genet. 2012, 8, e1002967. [Google Scholar] [CrossRef]
  50. Gardner, D.R.; Molyneux, R.J.; Ralphs, M.H. Analysis of swainsonine: Extraction methods, detection, and measurement in populations of locoweeds (Oxytropis spp.). J. Agric. Food Chem. 2001, 49, 4573–4580. [Google Scholar] [CrossRef]
  51. Meirmans, P.G. Using the AMOVA framework to estimate a standardized genetic differentiation measure. Evolution 2006, 60, 2399–2402. [Google Scholar] [CrossRef]
  52. Cook, D.; Gardner, D.R.; Welch, K.D.; Roper, J.M.; Ralphs, M.H.; Green, B.T. Quantitative PCR method to measure the fungal endophyte in locoweeds. J. Agric. Food Chem. 2009, 57, 6050–6054. [Google Scholar] [CrossRef] [PubMed]
  53. Gardner, D.R.; Cook, D. A comparison of alternative sample preparation procedures for the analysis of swainsonine using LC-MS/MS. Phytochem. Anal. 2011, 22, 124–127. [Google Scholar] [CrossRef] [PubMed]
  54. Danecek, P.; Auton, A.; Abecasis, G.; Albers, C.A.; Banks, E.; DePristo, M.A.; Handsaker, R.E.; Lunter, G.; Marth, G.T.; Sherry, S.T.; et al. The variant call format and VCFtools. Bioinformatics 2011, 27, 2156–2158. [Google Scholar] [CrossRef] [PubMed]
Figure 1. Neighbour-joining tree of the 181 individuals of the 17 Oxytropis species. Medicago truncatula was used as the outgroup. Samples clustered into a single clade and belonging to the same species are displayed by triangles. The size of each triangle represents the number of samples merged here, proportionally. The colour of the triangle and the label represents whether the corresponding sample contained endophyte A. oxytropis; red/green represent +/− symbiosis with A. oxytropis, respectively. Subgenus classification in traditional Oxytropis taxonomy is indicated by bars with different colours. Orange: Oxytropis subgen. Orobia; blue: Oxytropis subgen. Tragacanthoxytropis; purple: Oxytropis subgen oxytropis. The background colours represent different swainsonine content. Light yellow: swainsonine content > 0.1% (chemotype I); light green: swainsonine content < 0.01% (chemotype II); light blue: swainsonine content: 0.01–0.1%. Values next to nodes correspond to bootstrap values. The dotted line indicates that the substitution rate was not proportional.
Toxins 14 00181 g001
Figure 2. The principal component analysis (PCA) based on the entire SNP set for the 17 Oxytropis species.
Toxins 14 00181 g002
Figure 3. Population structure of Oxytropis estimated by ADMIXTURE. Each color represents one ancestral population (K = 8). Each individual is represented by a bar, and the length of each colored segment in the bar represents the proportion contributed from the ancestral population.
Toxins 14 00181 g003
Figure 4. The geographical locations of Oxytropis plants sampled.
Toxins 14 00181 g004
Figure 5. Morphological diversity of representative species of the Oxytropis genus. (A) O. ramosissima (B) O. latibracteata (C) O. falcata (D) O. ochrantha (E) O. psamocharis (F) O. bicolor (G) O. myriophylla (H) O. aciphylla (I) O. glacialis (J) O. merkensis (K) O. glabra (L) O. sericopetala (M) O. deflexa (N) O. kansuensis (O) O. ochrocephala (P) O. giraldii (Q) O. melanocalyx. Among those, O. glacialis and O. sericopetala were illustrated using the records from the Chinese Field Herbarium and the rest of the photos were taken during the sampling collection.
Toxins 14 00181 g005
Figure 6. Correlation analysis results between nucleotide diversity (PI), concentration of A. oxytropis (pg/ng) and swainsonine (%) in the 39 Oxytropis populations.
Toxins 14 00181 g006
Table 1. Analysis of molecular variance (AMOVA) of the genetic diversity in Oxytropis.
Source of Variationd.f.Sum of SquaresVariance
Components
Percentage
of Variation
Fixation Indices
Among 17 species1630,048.556175.96679 Va67.66Fsc = 0.13165 ***
Among populations within each species222388.91511.07451 Vb4.26Fst = 0.71915 ***
Among individuals within each of the 39 populations1319569.12473.04675 Vc28.09Fct = 0.67657 ***
Total16942,006.594260.08805100
Asterisks (***) indicate significant genetic differentiation (p < 0.001).
Table 2. Endophytic fungi and swainsonine content in Oxytropis.
SpeciesNumber of
Samples
Number of Endophyte + SamplesEndophyte Concn.
(Mean pg/ng ± S.E.)
Swainsonine
(Mean % ± S.E.)
Chemotype
O. glacialis510.03 ± 0.031.1900 ± 0.3278Chemotype I
O. deflexa990.99 ± 0.140.3267 ± 0.0788Chemotype I
O. sericopetala991.00 ± 0.050.2140 ± 0.0445Chemotype I
O. falcata15130.60 ± 0.080.1643 ± 0.0423Chemotype I
O. glabra1050.51 ± 0.170.0668 ± 0.0164Intermediate
O. ochrocephala1390.26 ± 0.090.0479 ± 0.0177Intermediate
O. kansuensis2260.06 ± 0.020.0145 ± 0.0042Intermediate
O. giraldii1440.22 ± 0.110.0030 ± 0.0019Chemotype II
O. ochrantha530.10 ± 0.040.0022 ± 0.0012Chemotype II
O. latibracteata10n.d.n.d.0.0022 ± 0.0008Chemotype II
O. melanocalyx10n.d.n.d.0.0021 ± 0.0014Chemotype II
O. myriophylla10n.d.n.d.0.0015 ± 0.0007Chemotype II
O. merkensis4n.d.n.d.0.0010 ± 0.0005Chemotype II
O. psamocharis10n.d.n.d.0.0008 ± 0.0001Chemotype II
O. bicolor6n.d.n.d.0.0007 ± 0.0001Chemotype II
O. ramosissima10n.d.n.d.0.0007 ± 0.0001Chemotype II
O. aciphylla8n.d.n.d.0.0006 ± 0.0001Chemotype II
Swainsonine contents of >0.1% or <0.01% are considered as the thresholds to define the plants as chemotype I or chemotype II plant [21], based on which Oxytropis appeared to group into three categories. Four species (O. glacialis, O. deflexa, O. sericopetala and O. falcata) contained swainsonine contents of >0.1%, thus were Chemotype I. O. glabra, O. ochrocephala and O. kansuensis were intermediate between Chemotypes I and II; and all the other 10 species were Chemotype II plants.
Table 3. Correlation analysis between environmental factors, altitude and content of endophytic fungi and swainsonine.
Nucleotide Diversity (PI)Endophyte (pg/ng)Swainsonine
(%)
Annual average precipitation (mm)−0.062−0.090−0.077
Annual average air pressure (hpa)−0.004−0.004−0.196
Annual average wind speed (m/s)0.037−0.0040.063
Annual average temperature (°C)−0.1460.301 *−0.038
Annual average water vapor pressure (hpa)−0.1150.072−0.286 *
Annual relative humidity (%)−0.012−0.322 *−0.433 **
Annual sunlight percentage (%)0.0870.2130.363 **
Altitude (m)0.036−0.0600.341 **
Note: * p < 0.05; ** p < 0.01.
Publisher’s Note: MDPI stays neutral with regard to jurisdictional claims in published maps and institutional affiliations.

