Does Bentonite Cause Cytotoxic and Whole-Transcriptomic Adverse Effects in Enterocytes When Used to Reduce Aflatoxin B1 Exposure?

 ,
,  , , , and
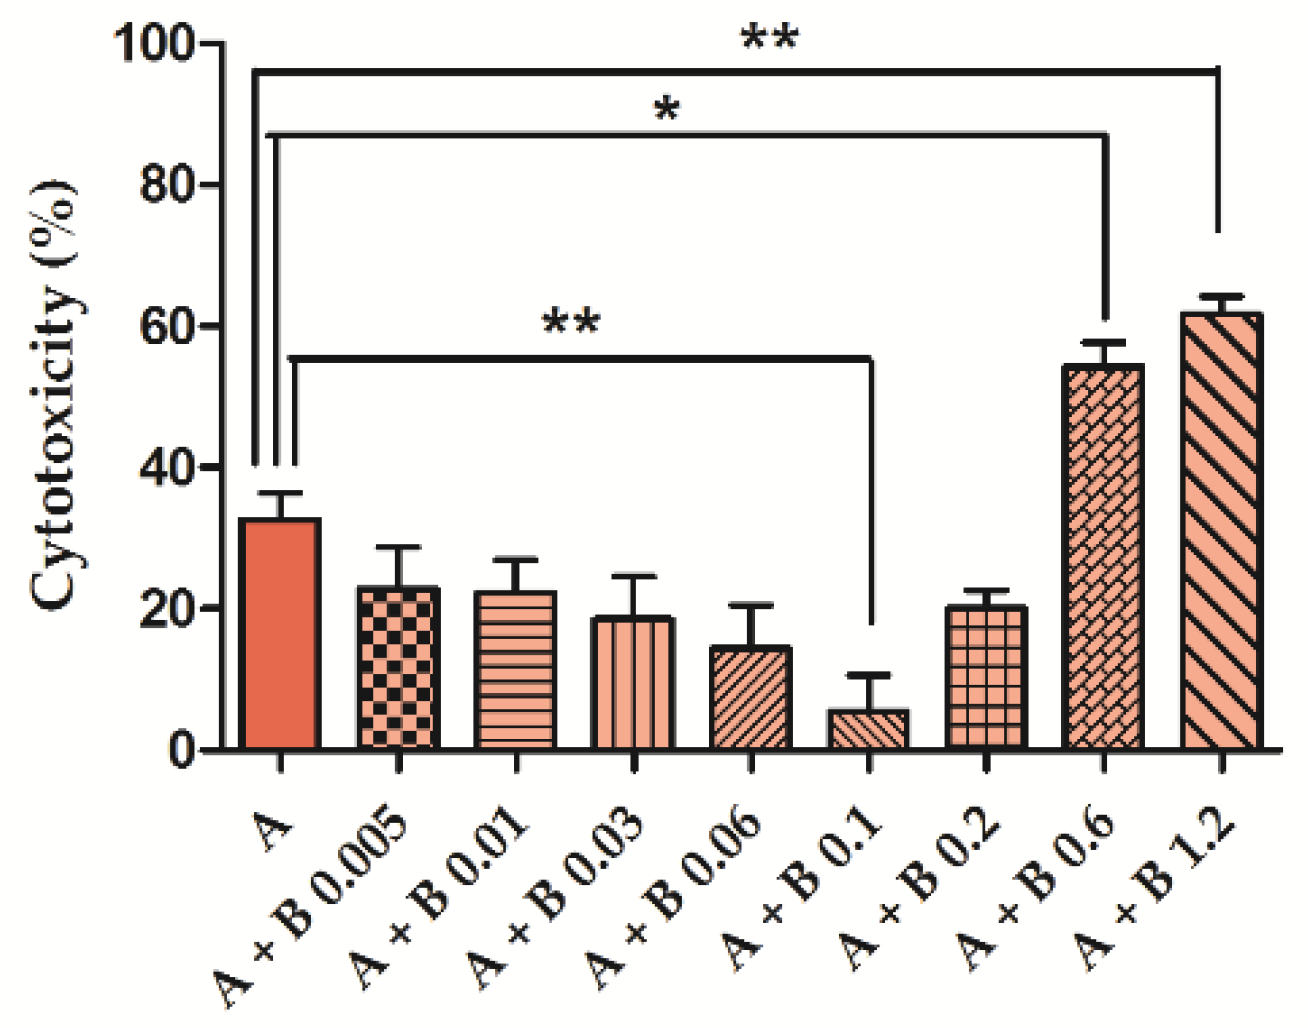
Abstract
:1. Introduction
2. Results
2.1. Cytochrome P450 3A4 Induction
2.2. Assessment of BEN and AFB1 Cytotoxicity as Single Agents or in Combination
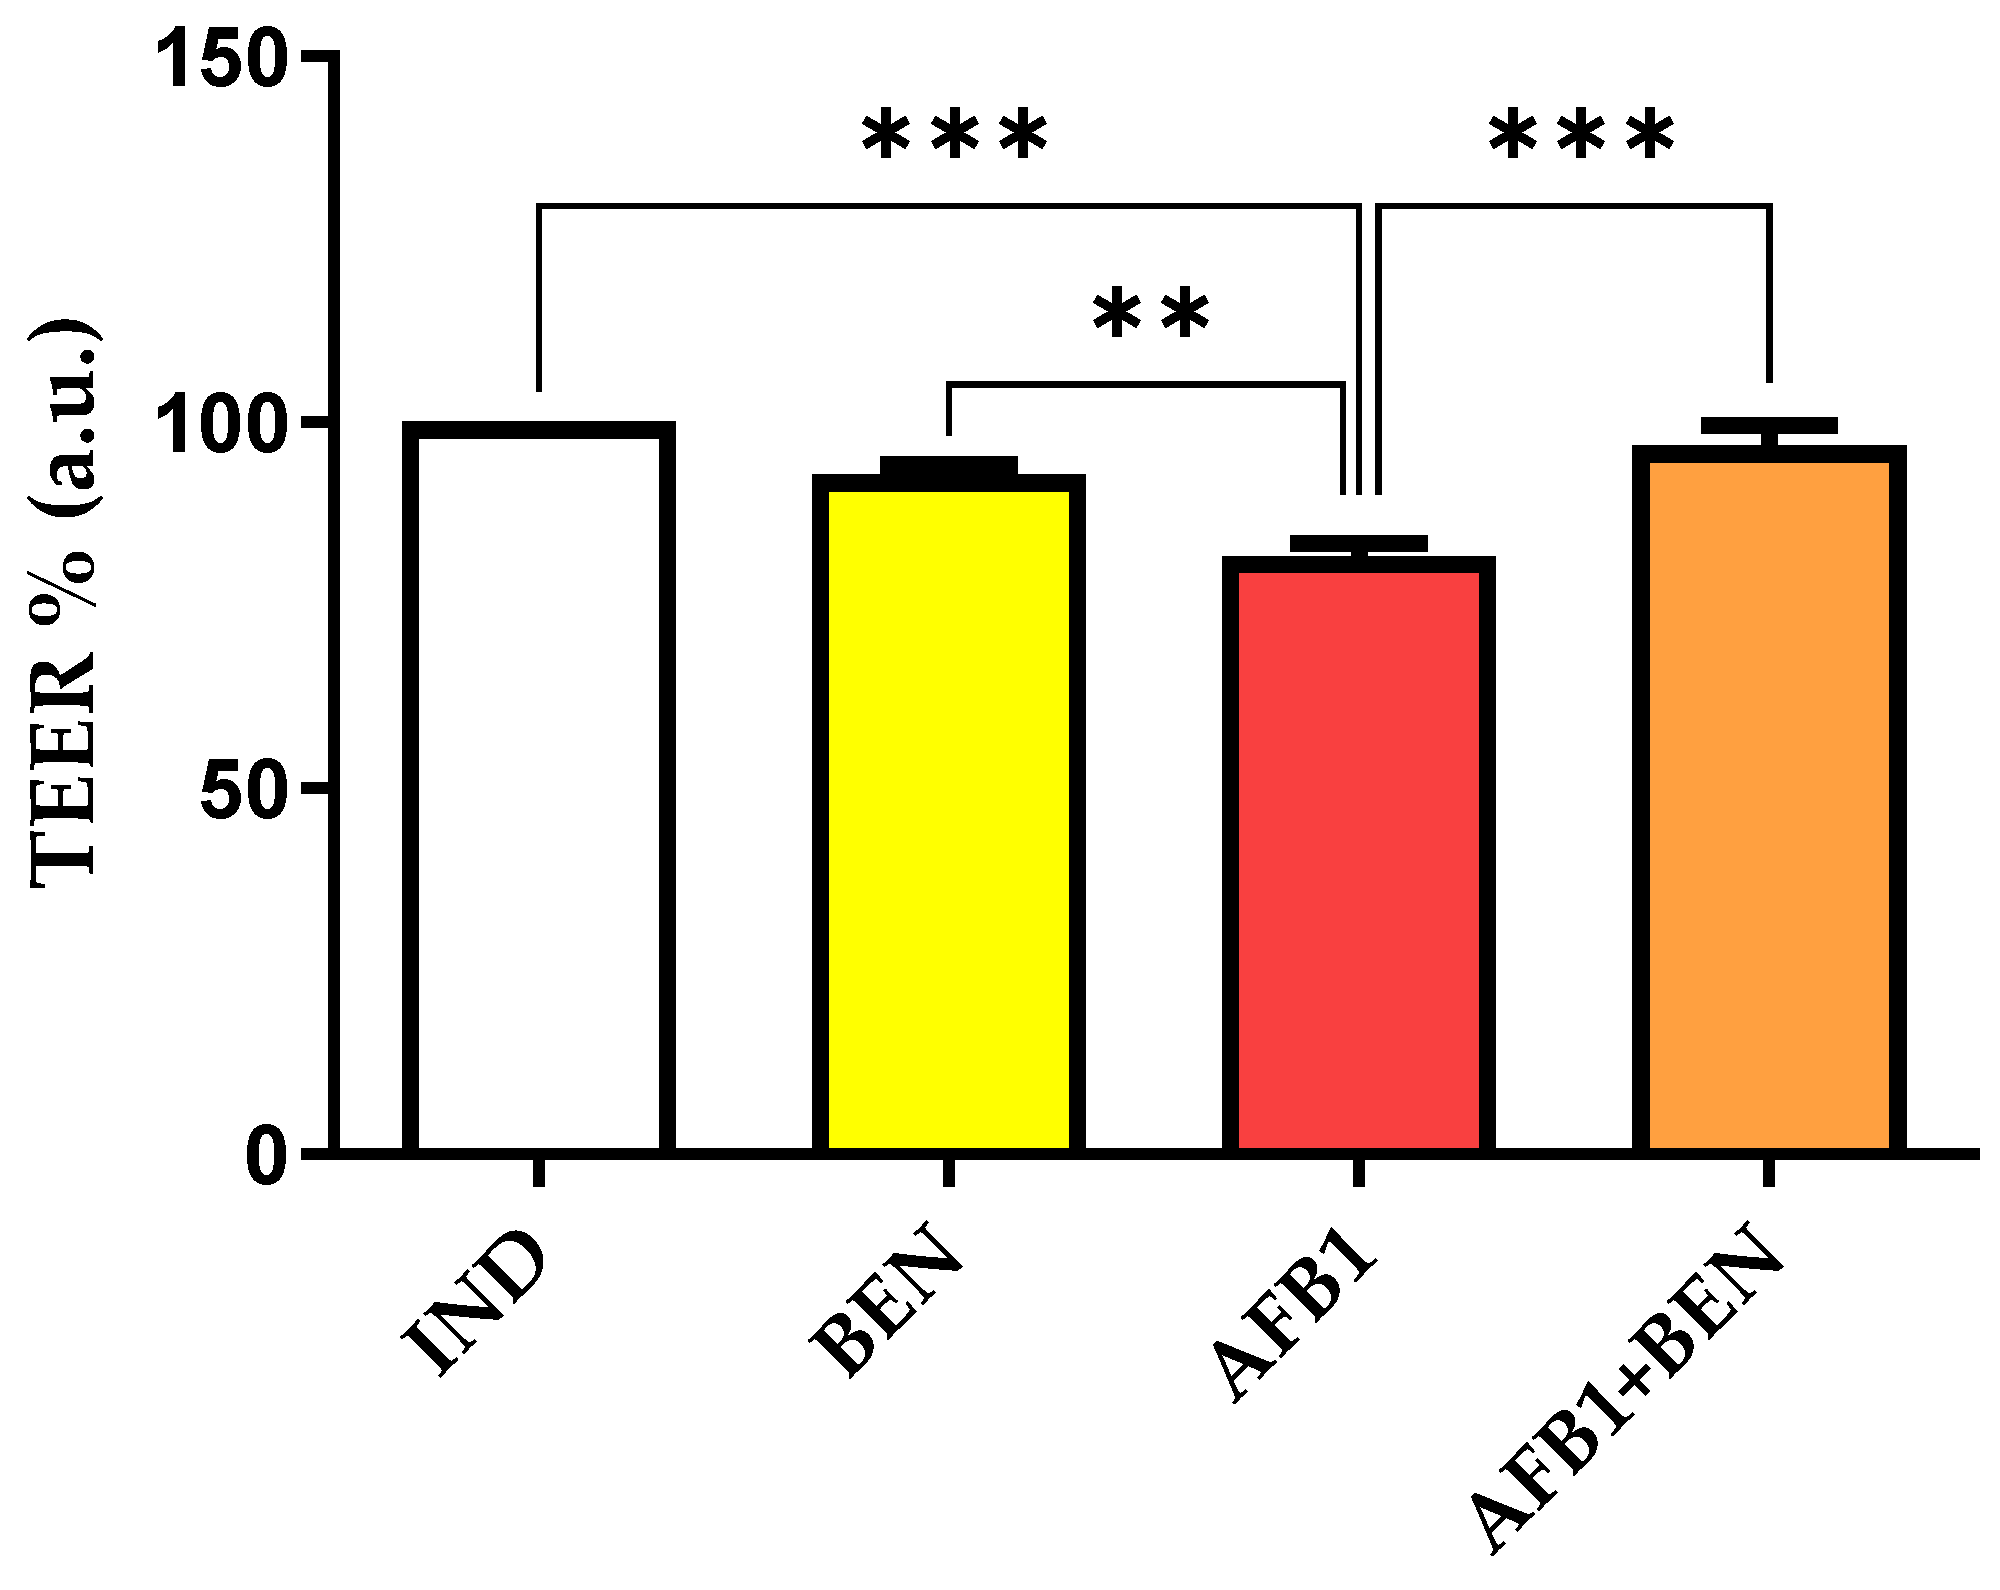
2.3. Evaluation of Caco-2 Monolayer Integrity Following the Exposure to BEN and AFB1, Either Alone or in Combination
2.4. LC-MS/MS Approaches to Assess the BEN Adsorbing Capacity and Its Effects on AFB1, AFM1, and AFL Transport
2.5. Transcriptomic Effects of BEN and AFB1, Alone or in Combination
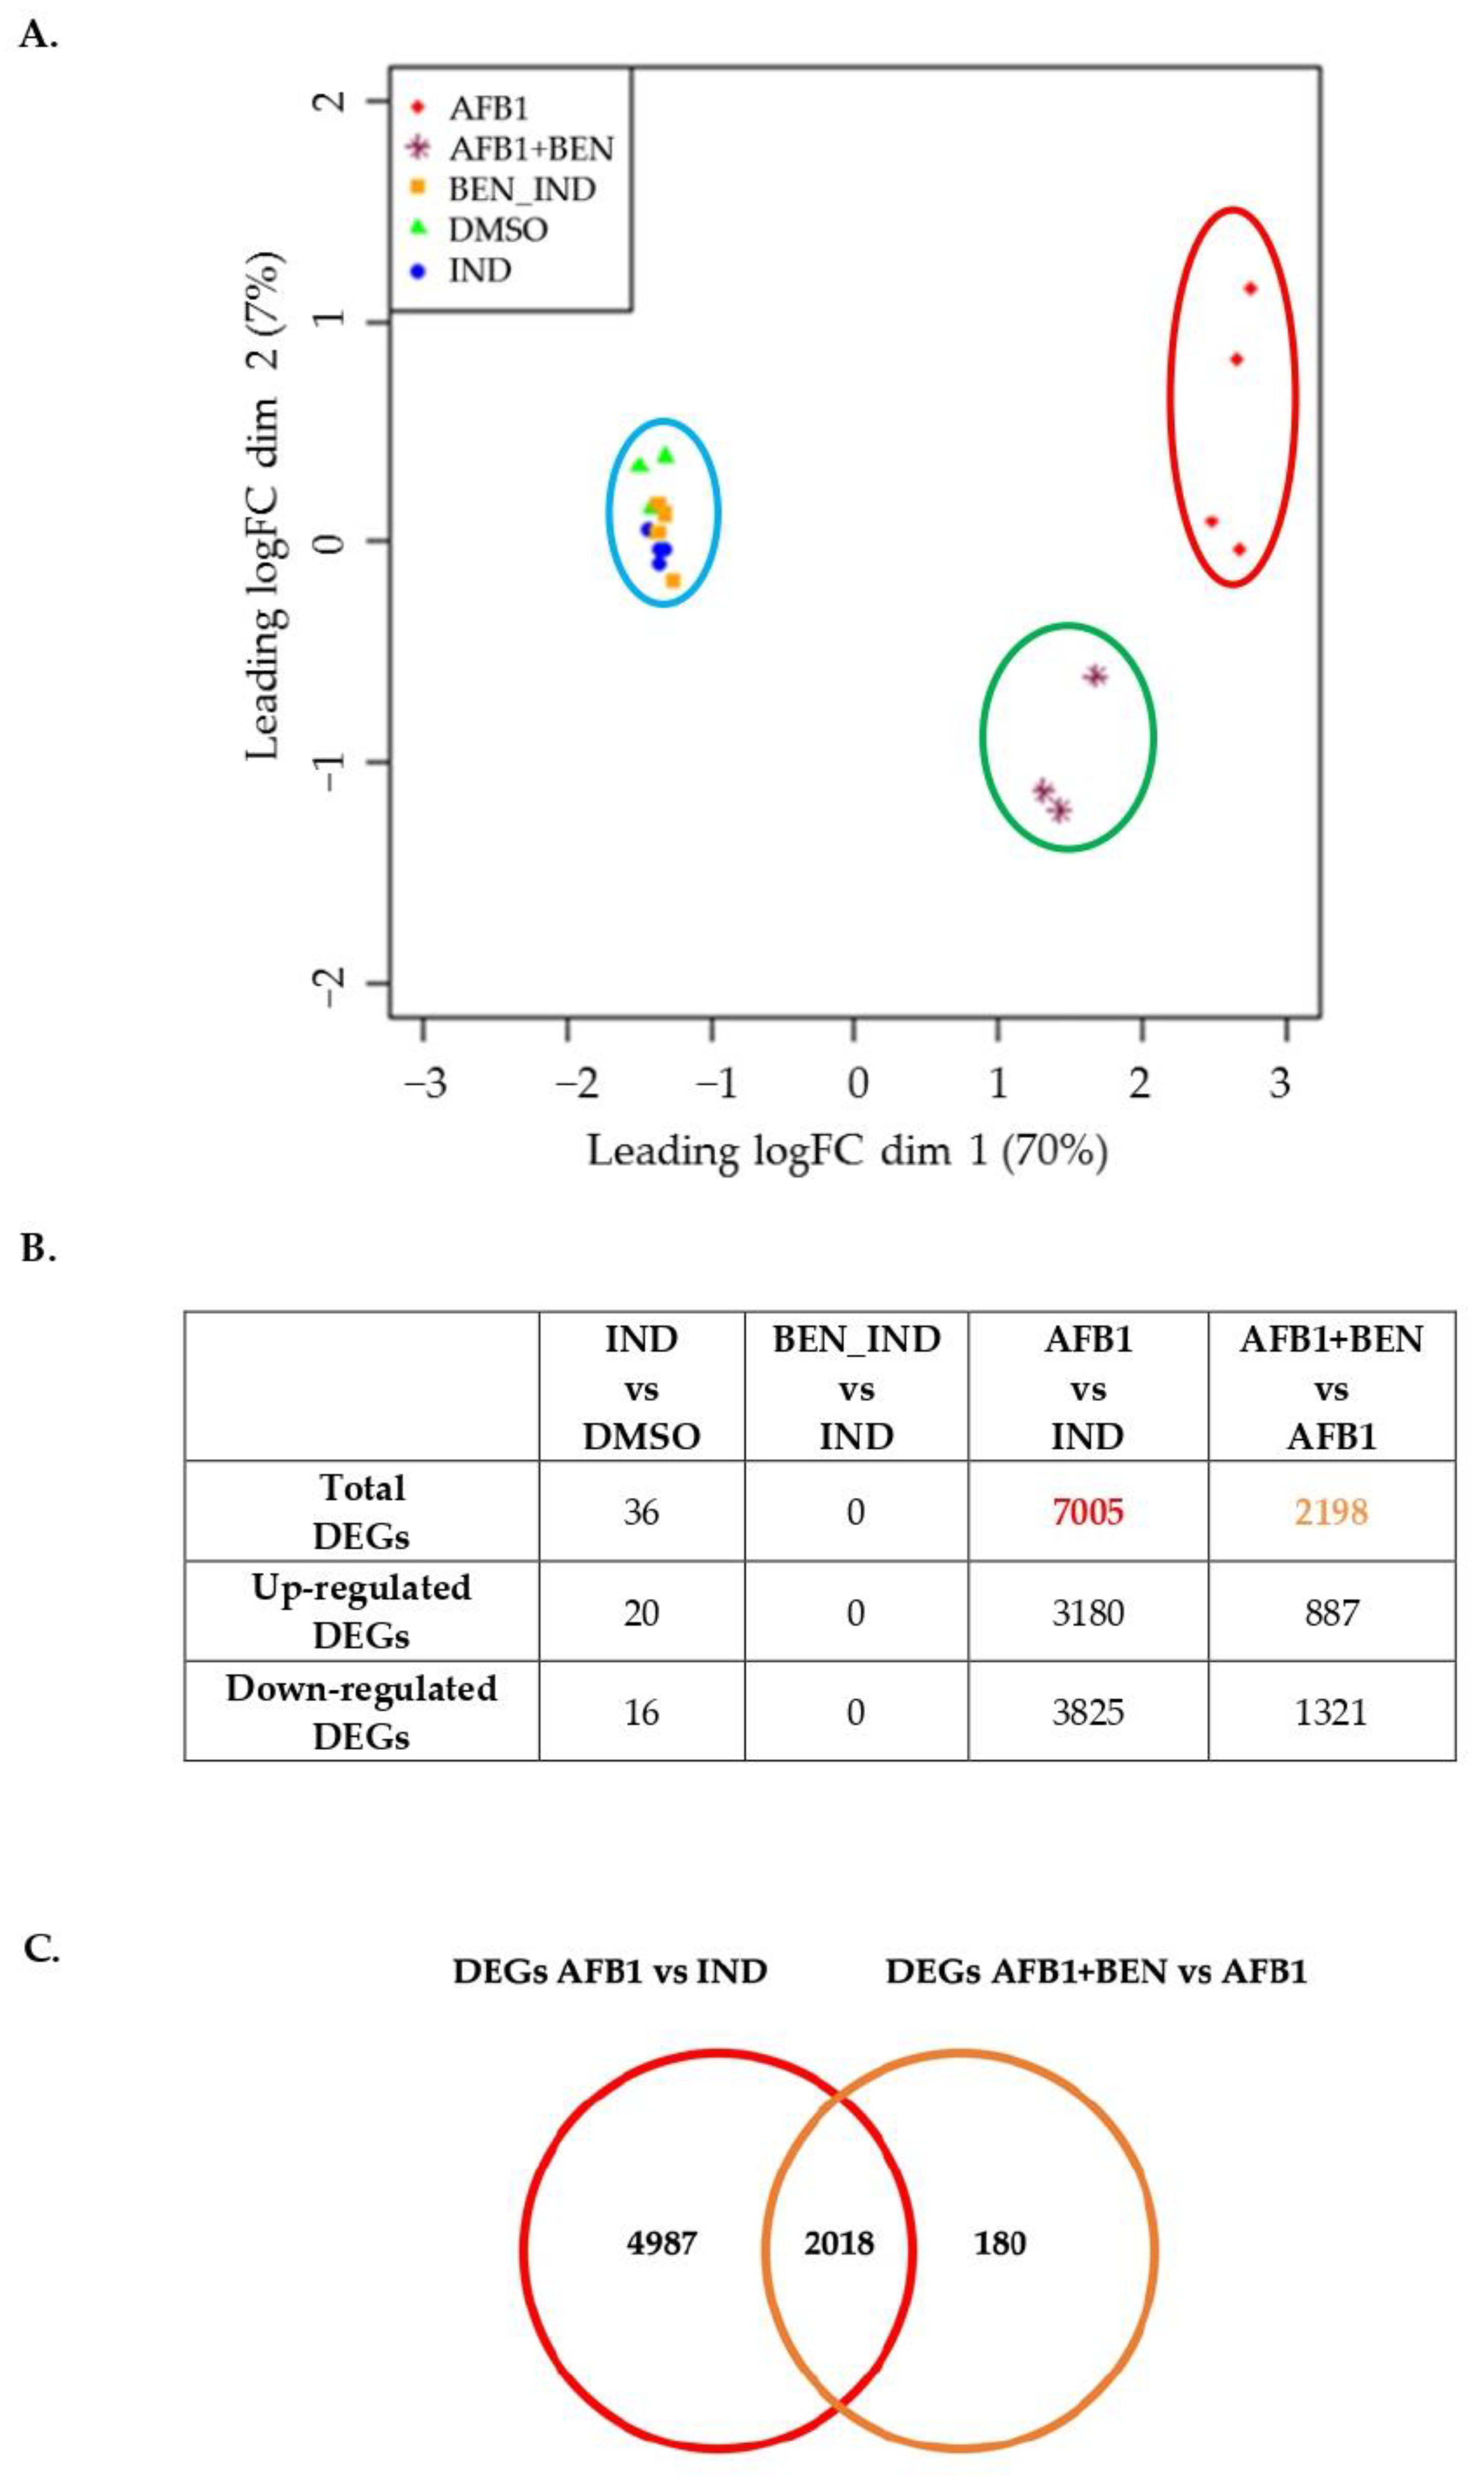
2.5.1. Whole-Transcriptome Differential Expression Analysis
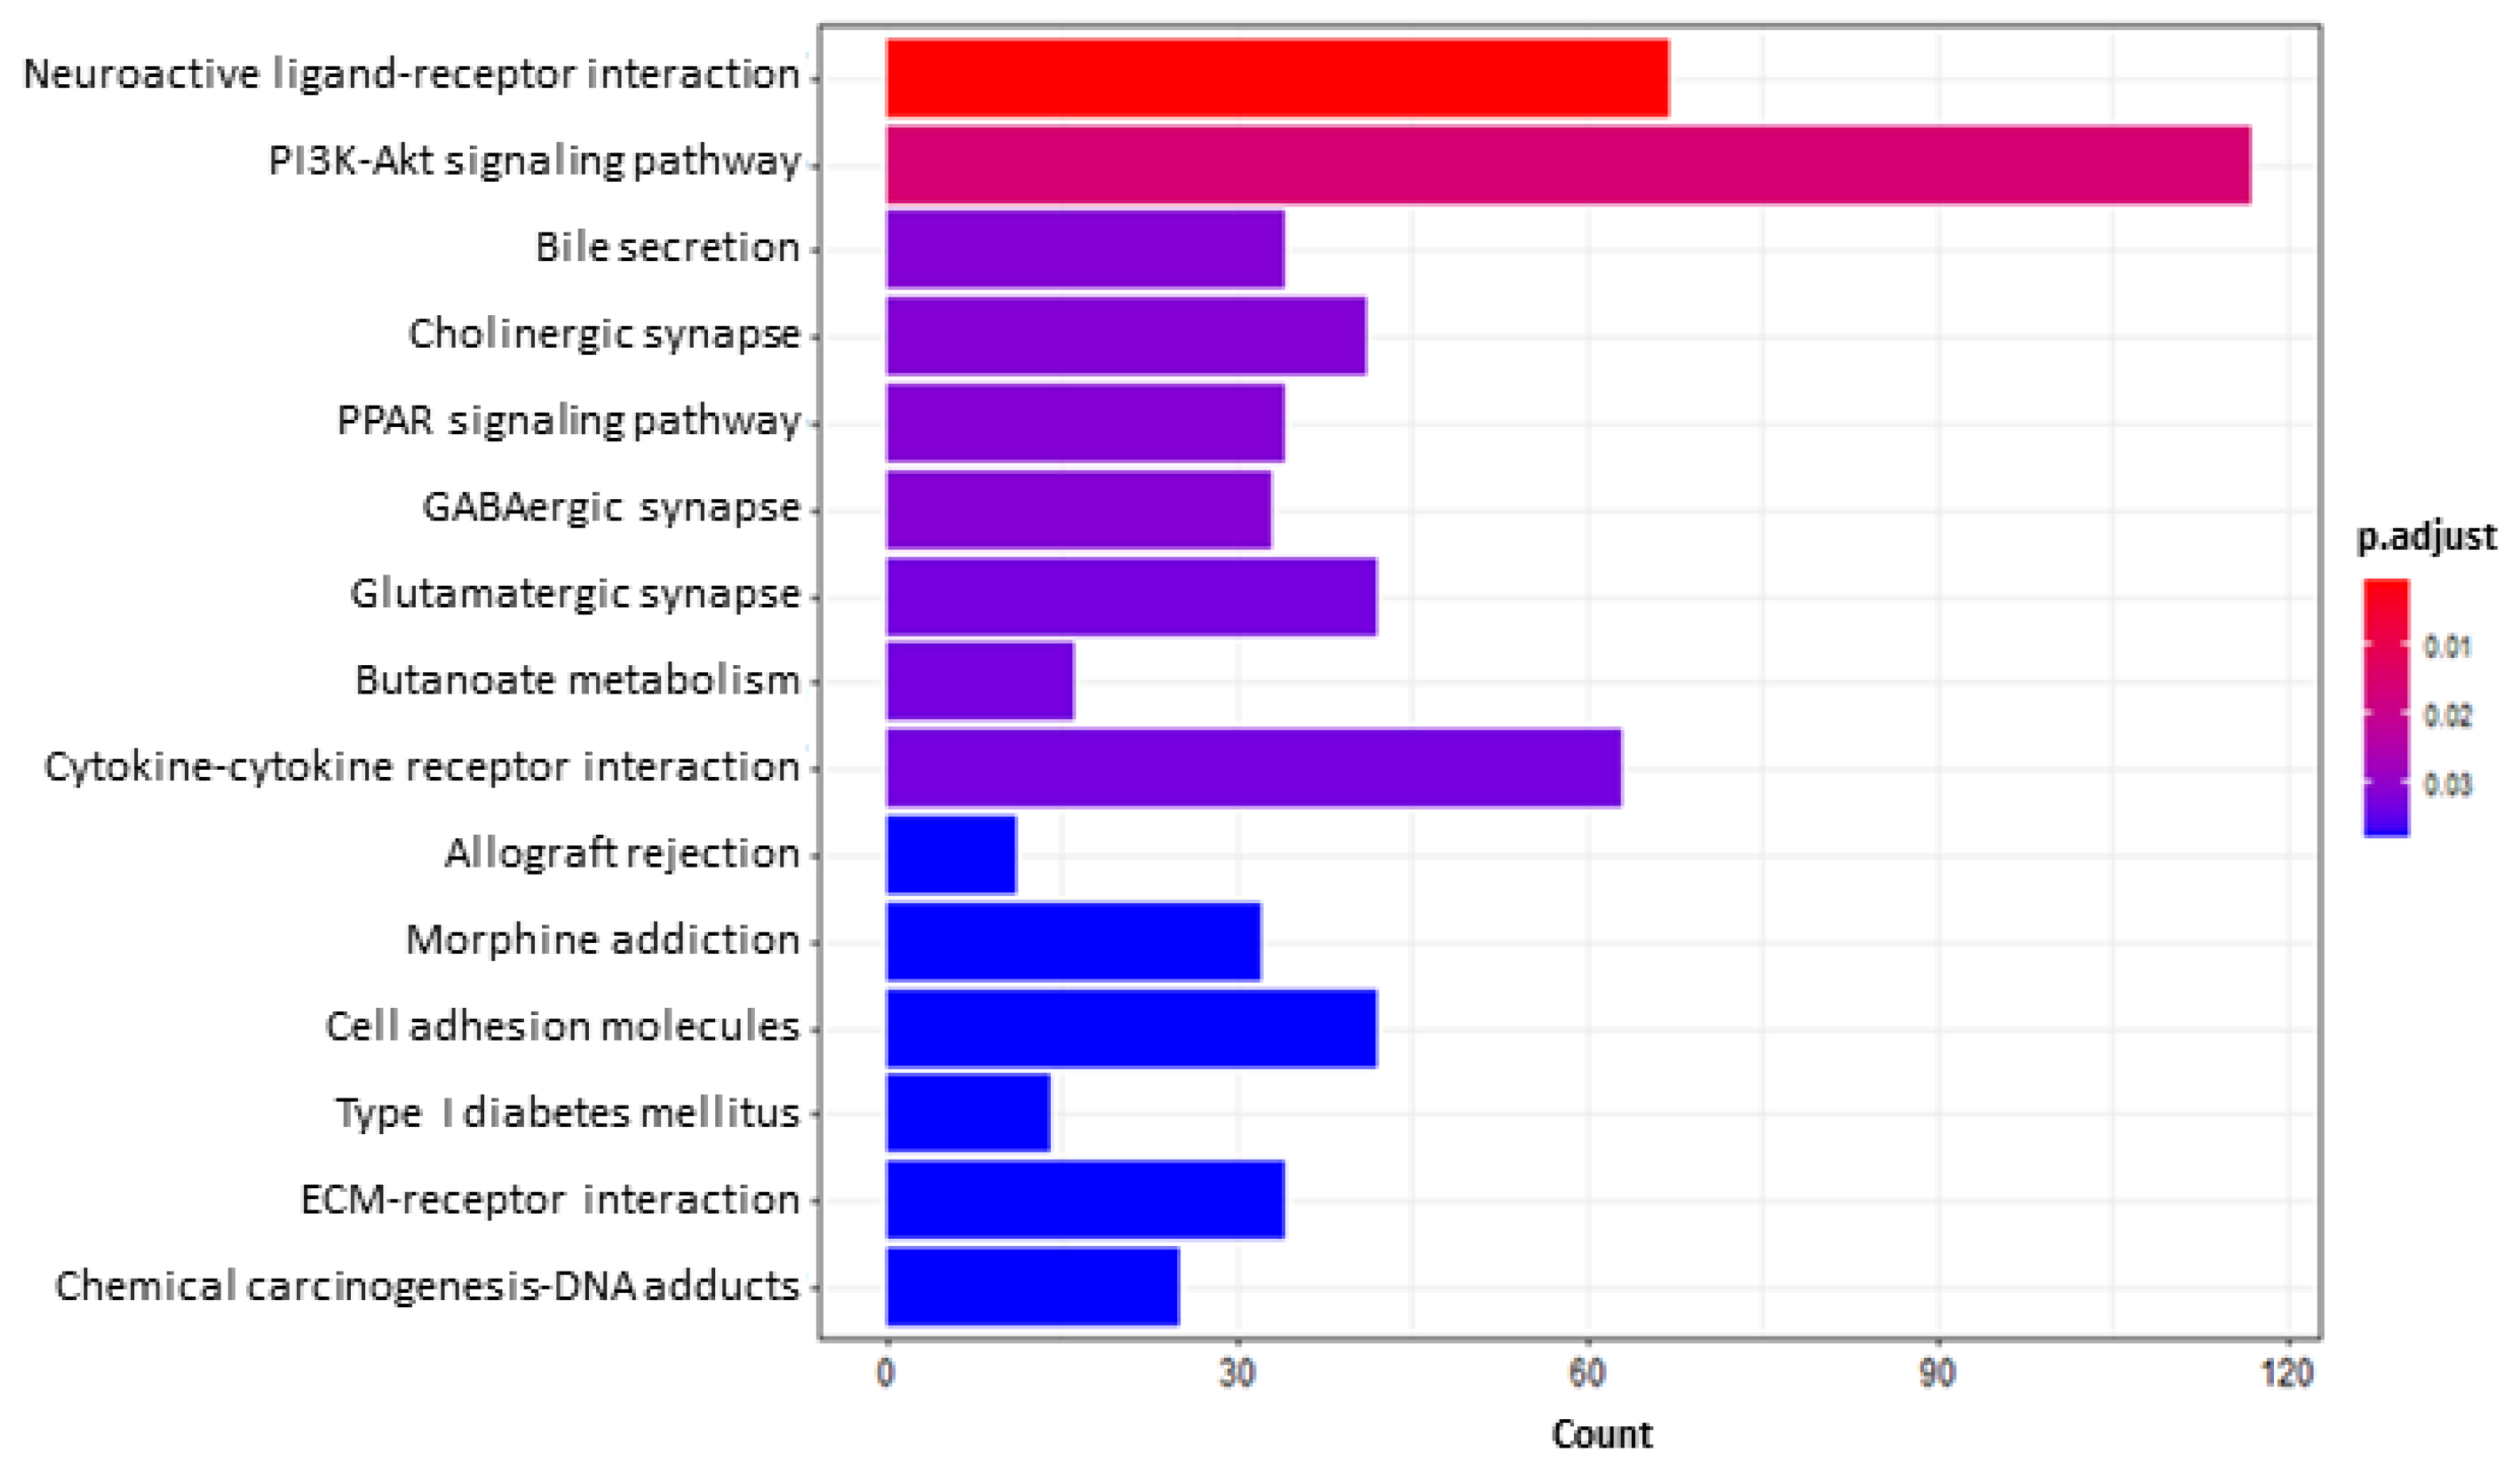
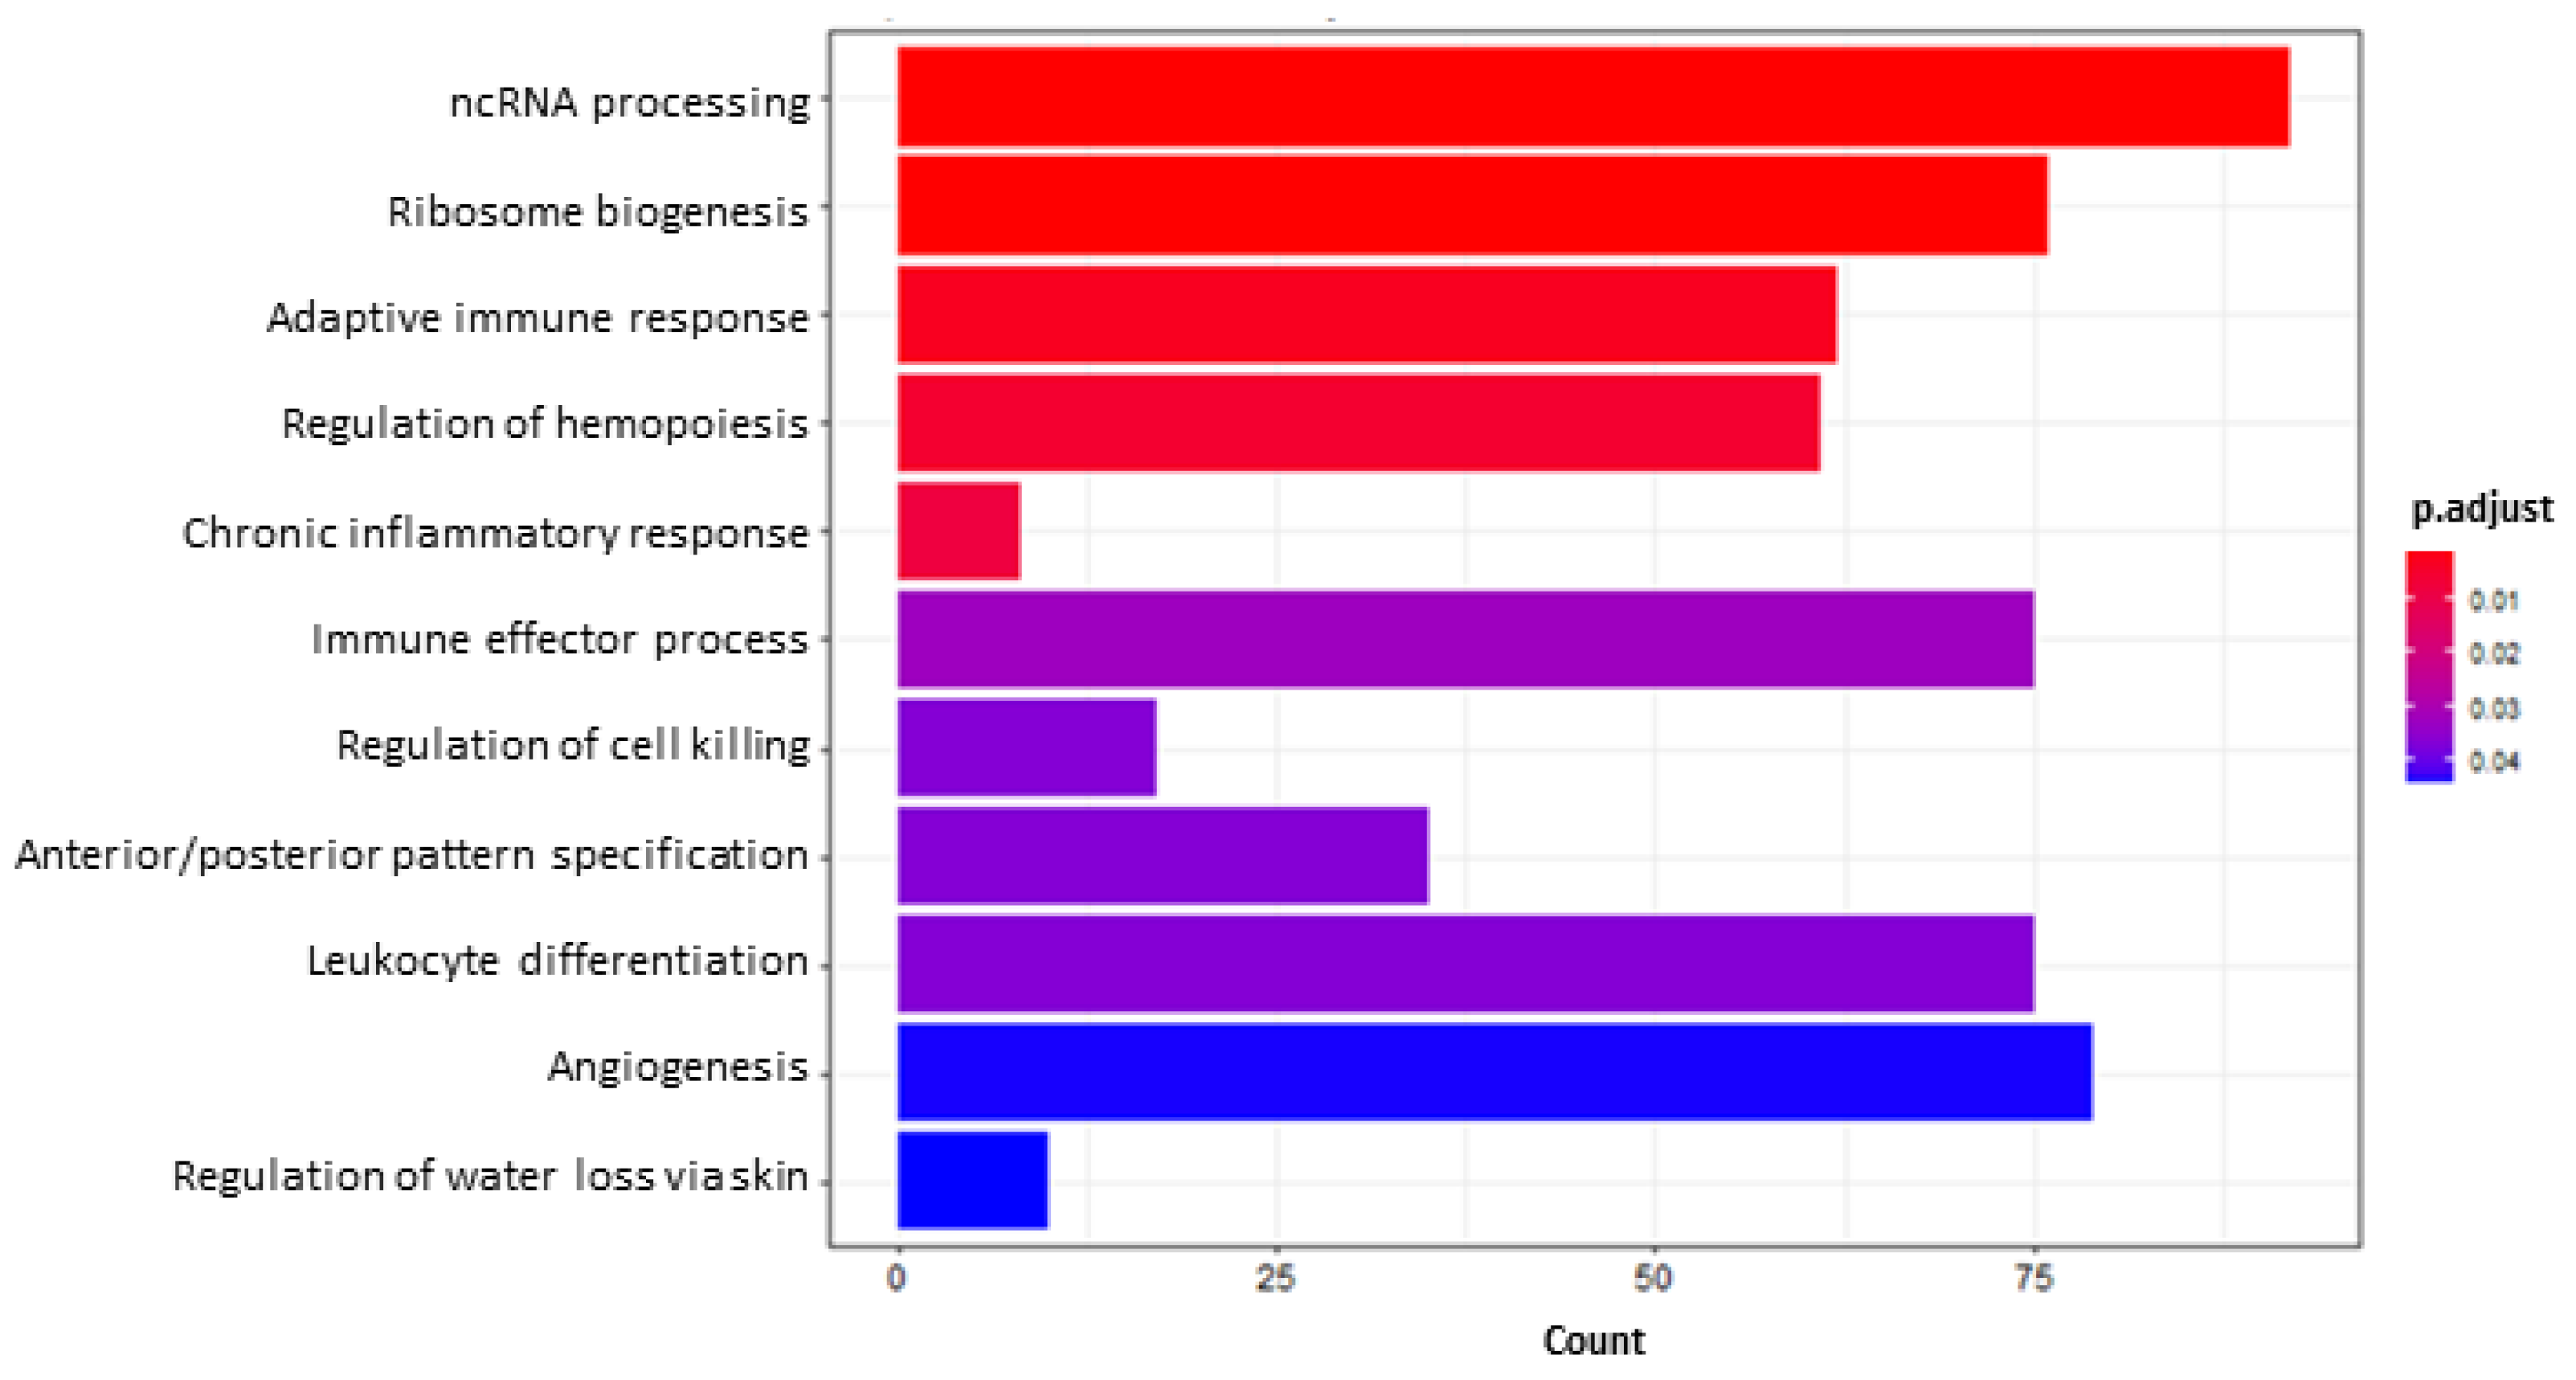
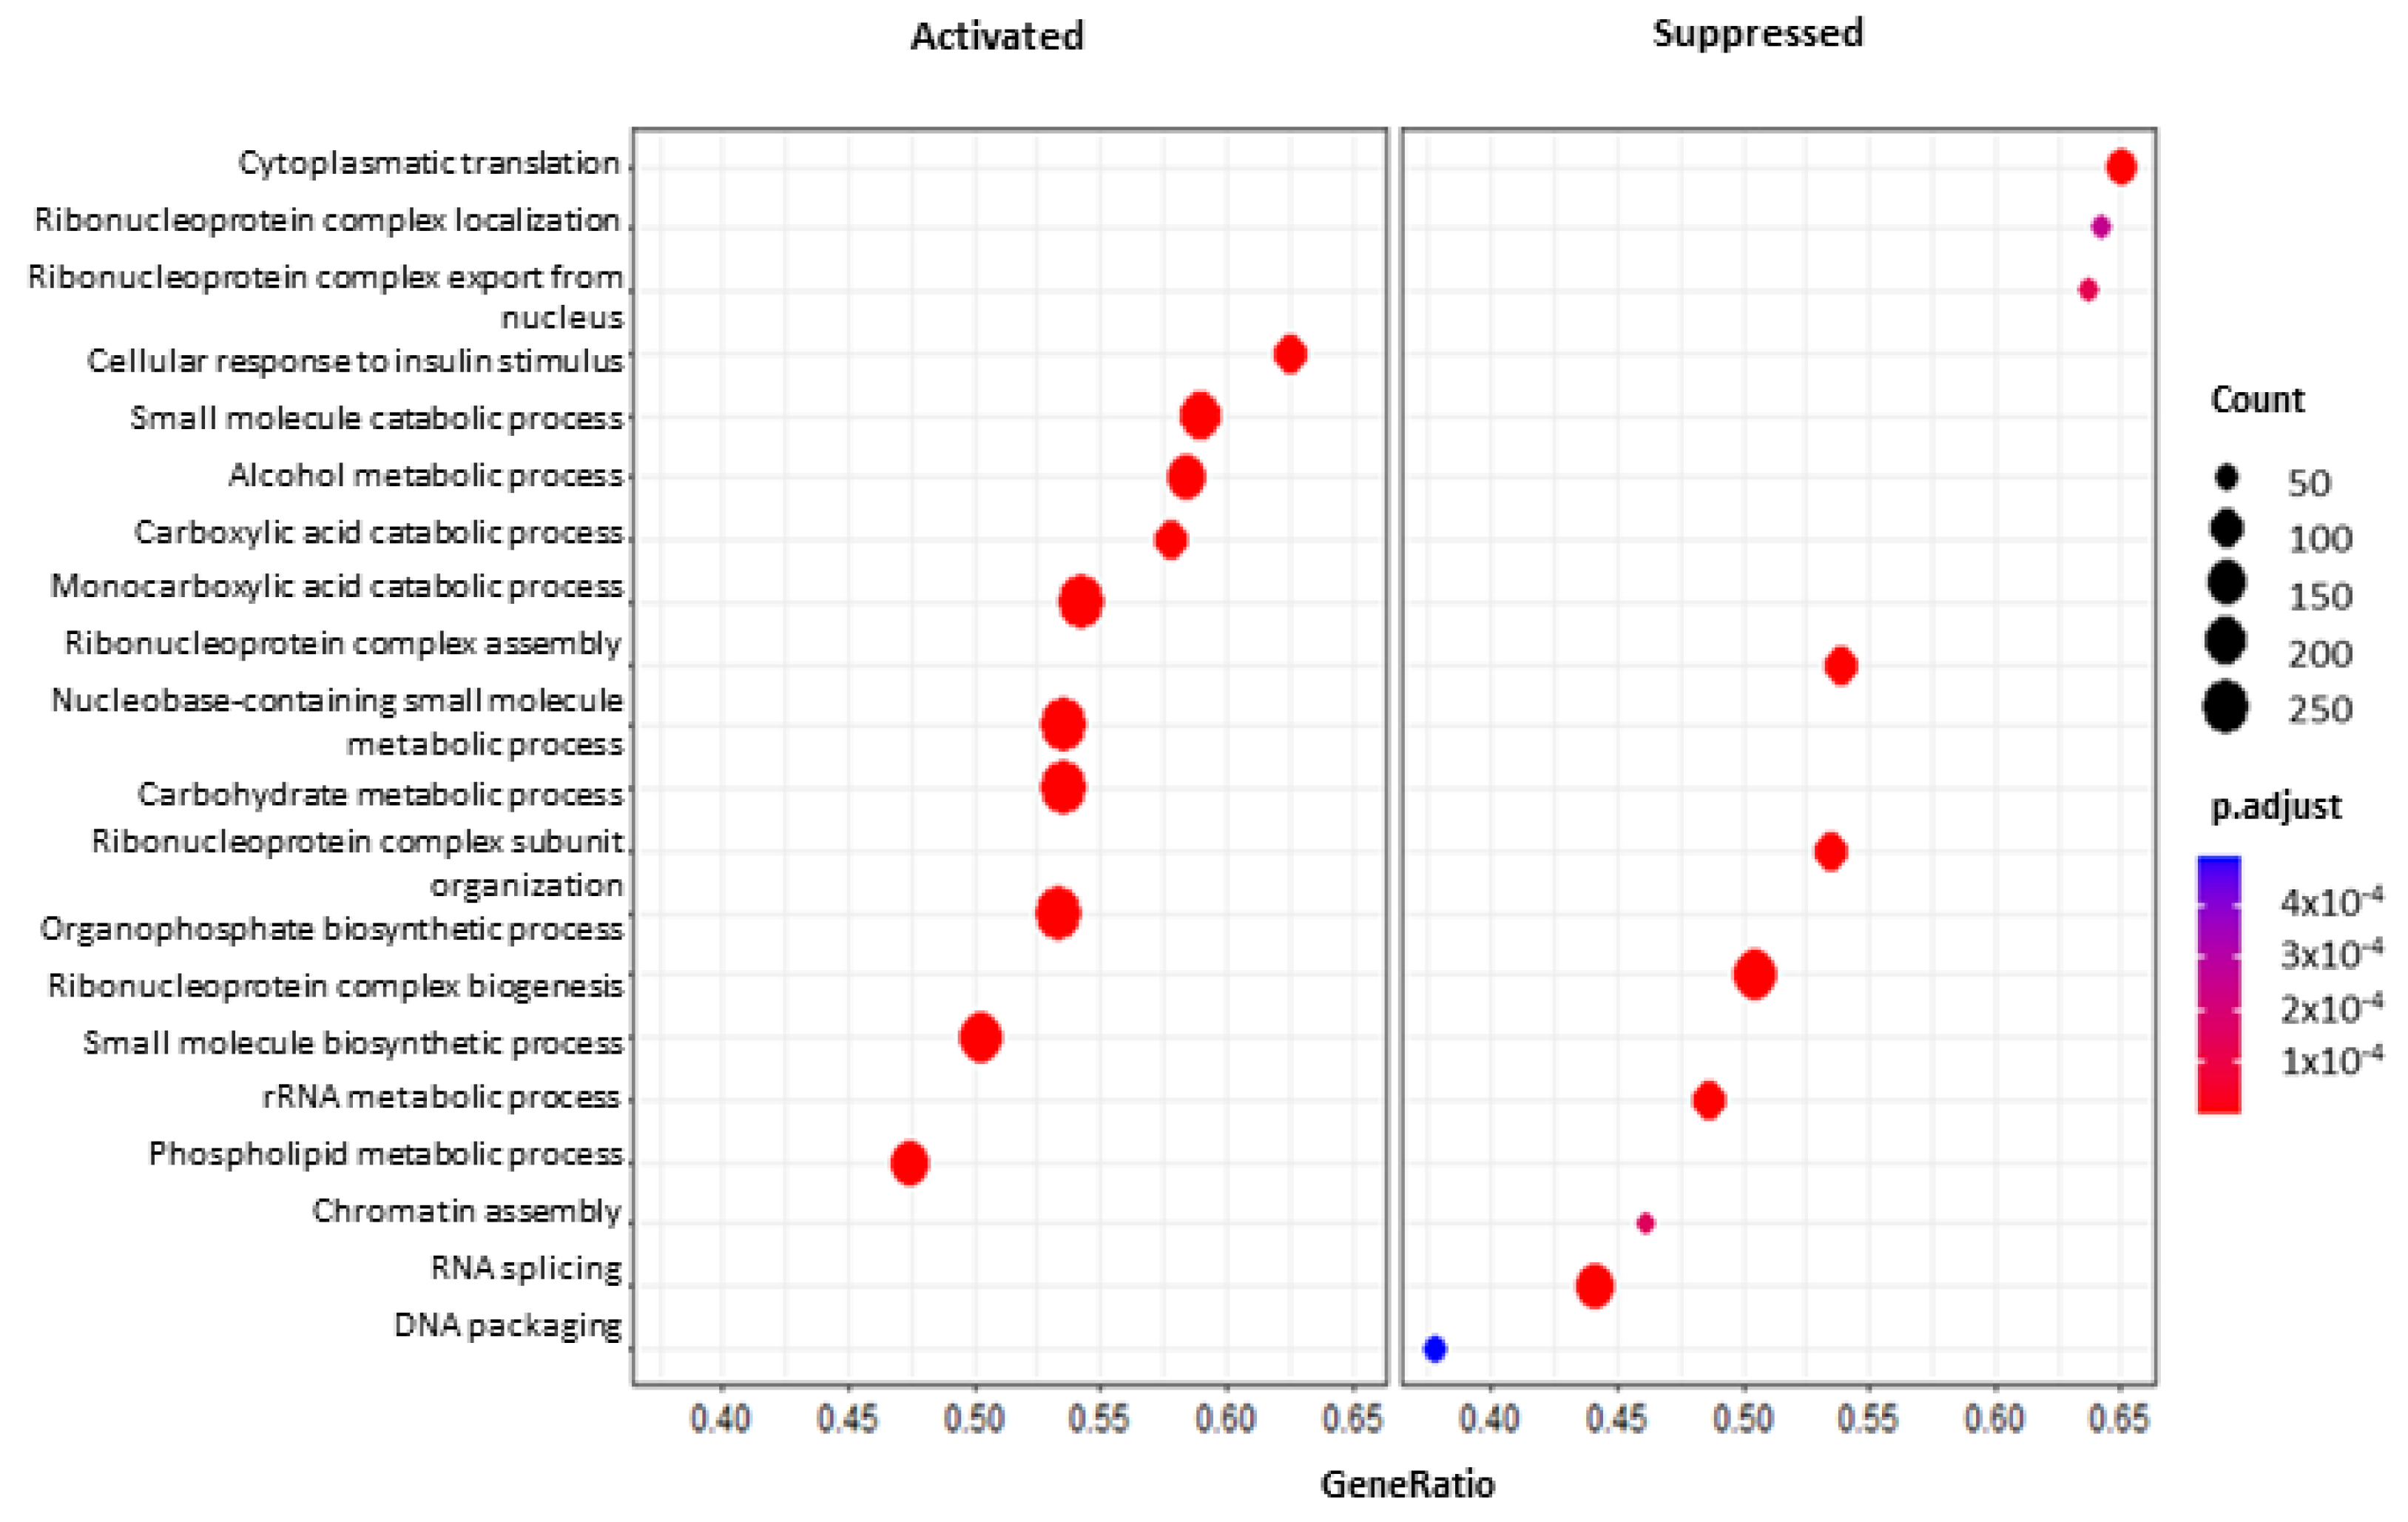
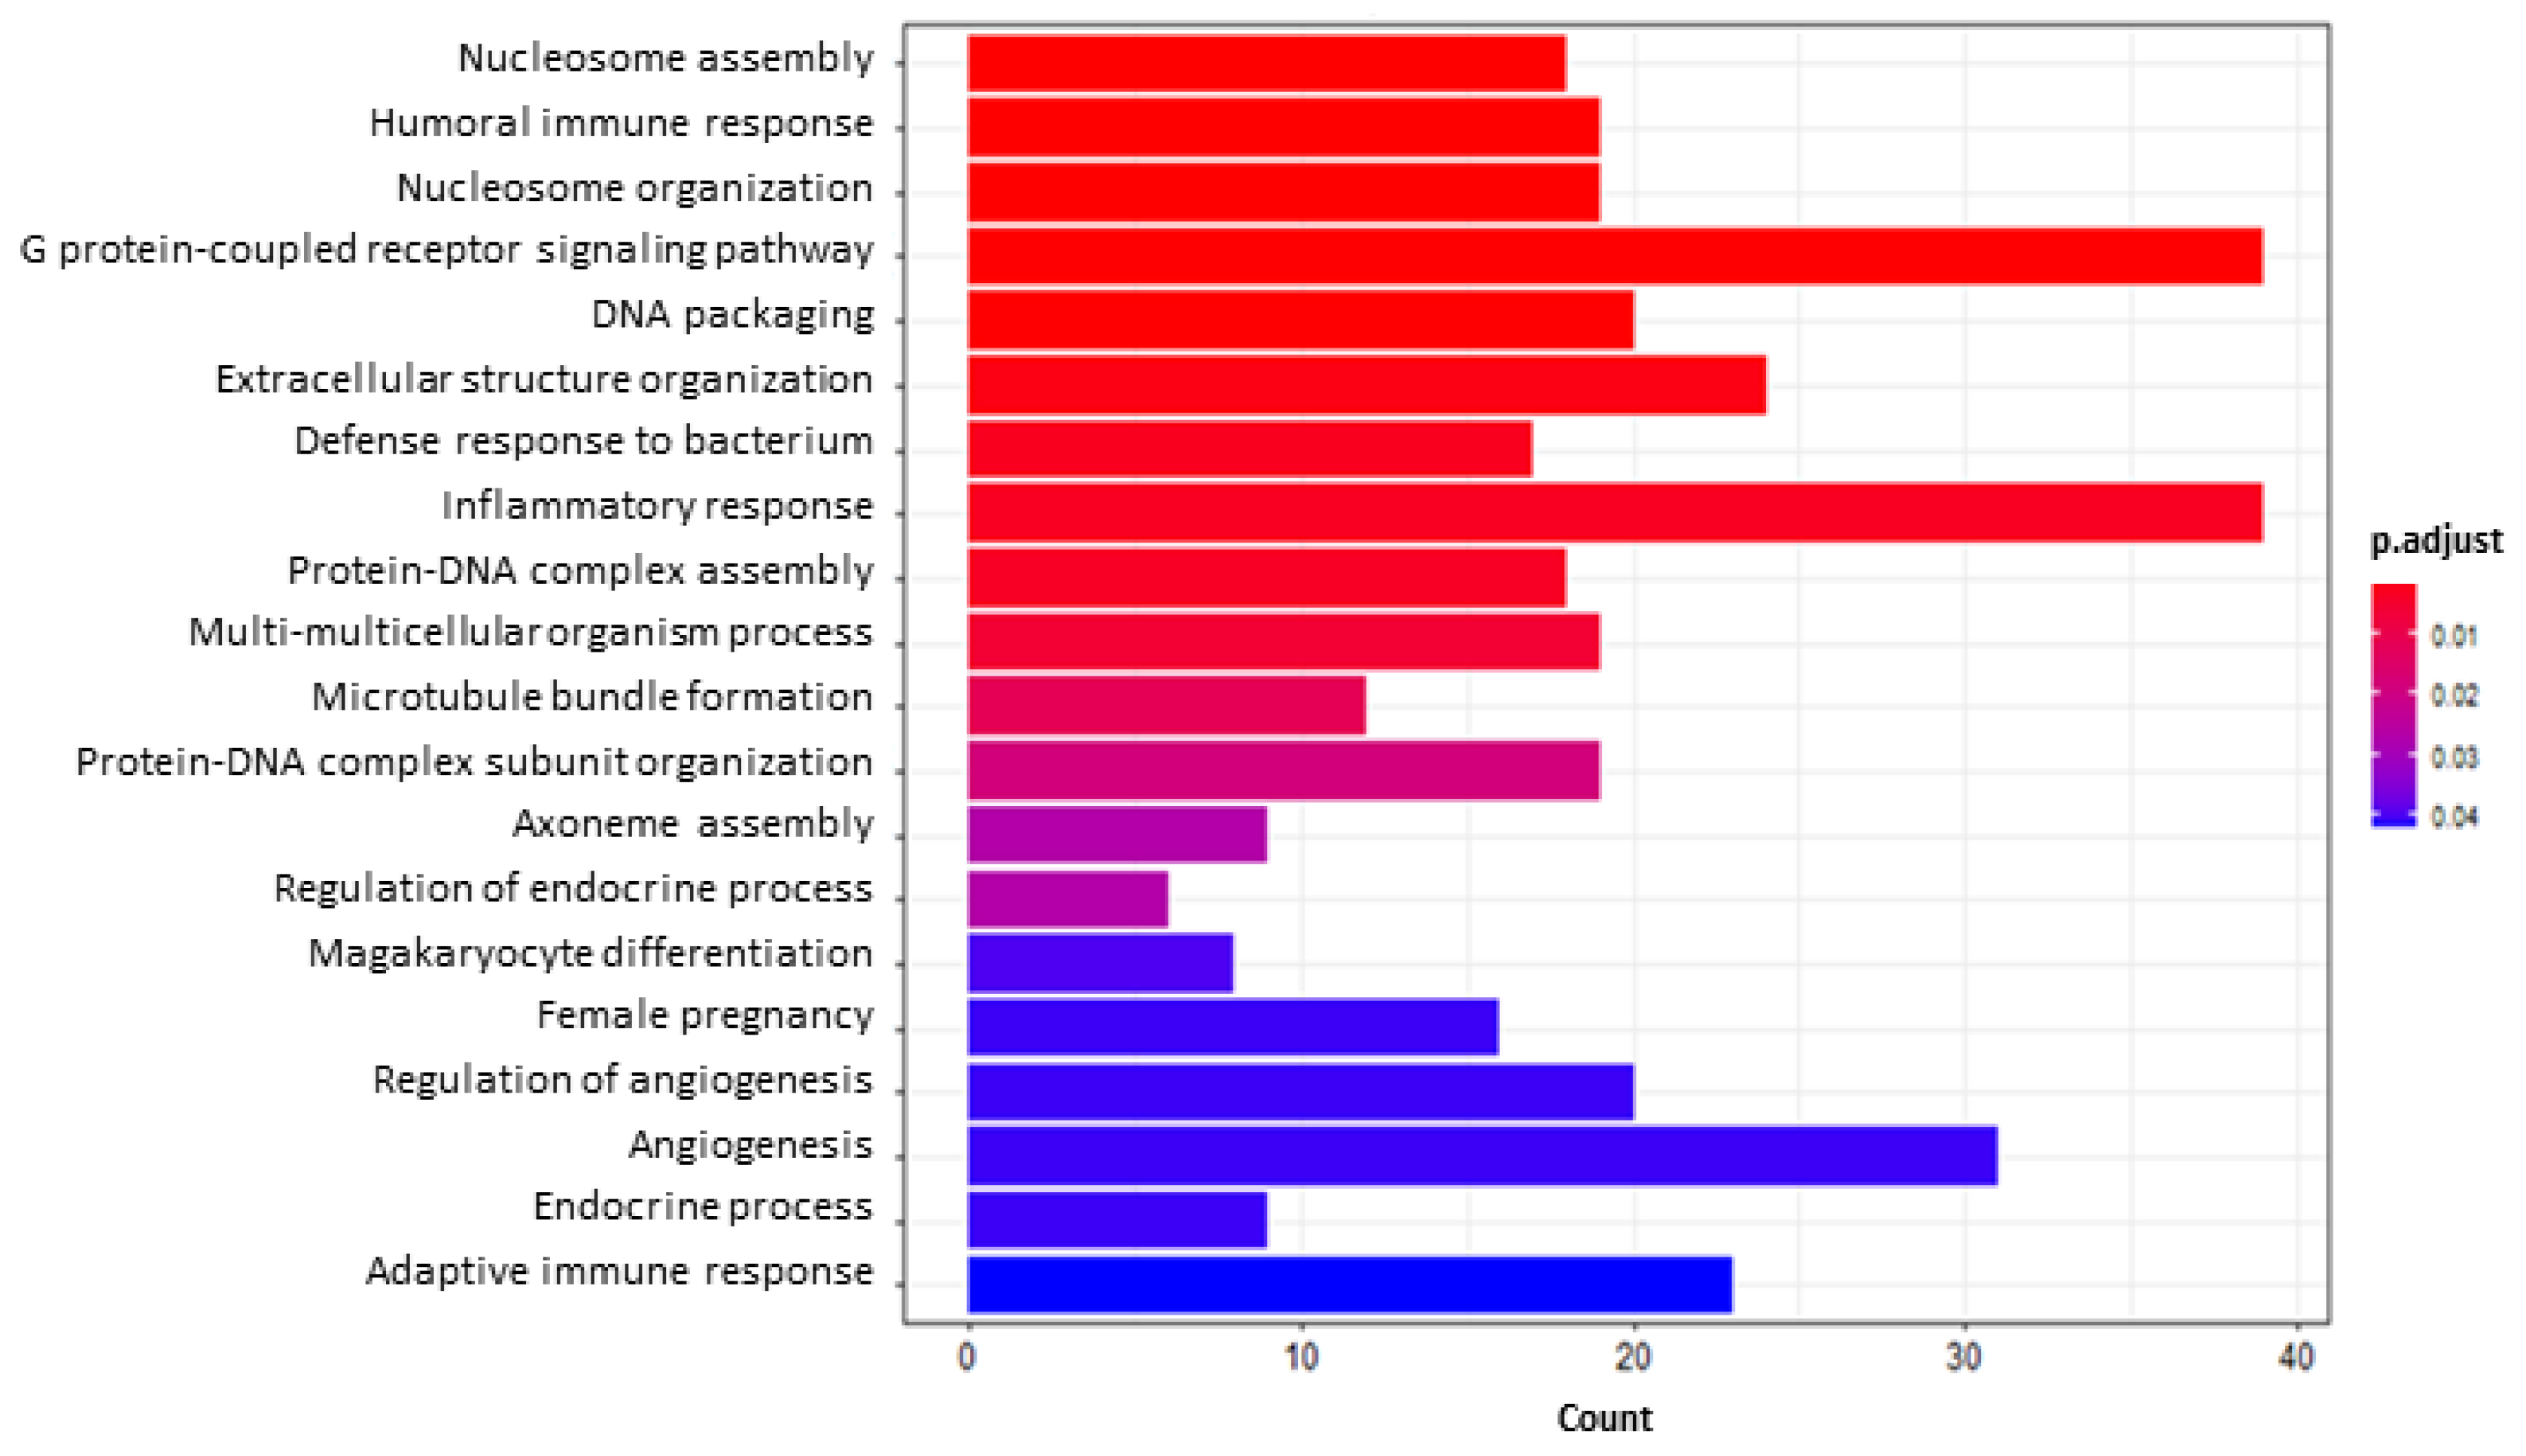
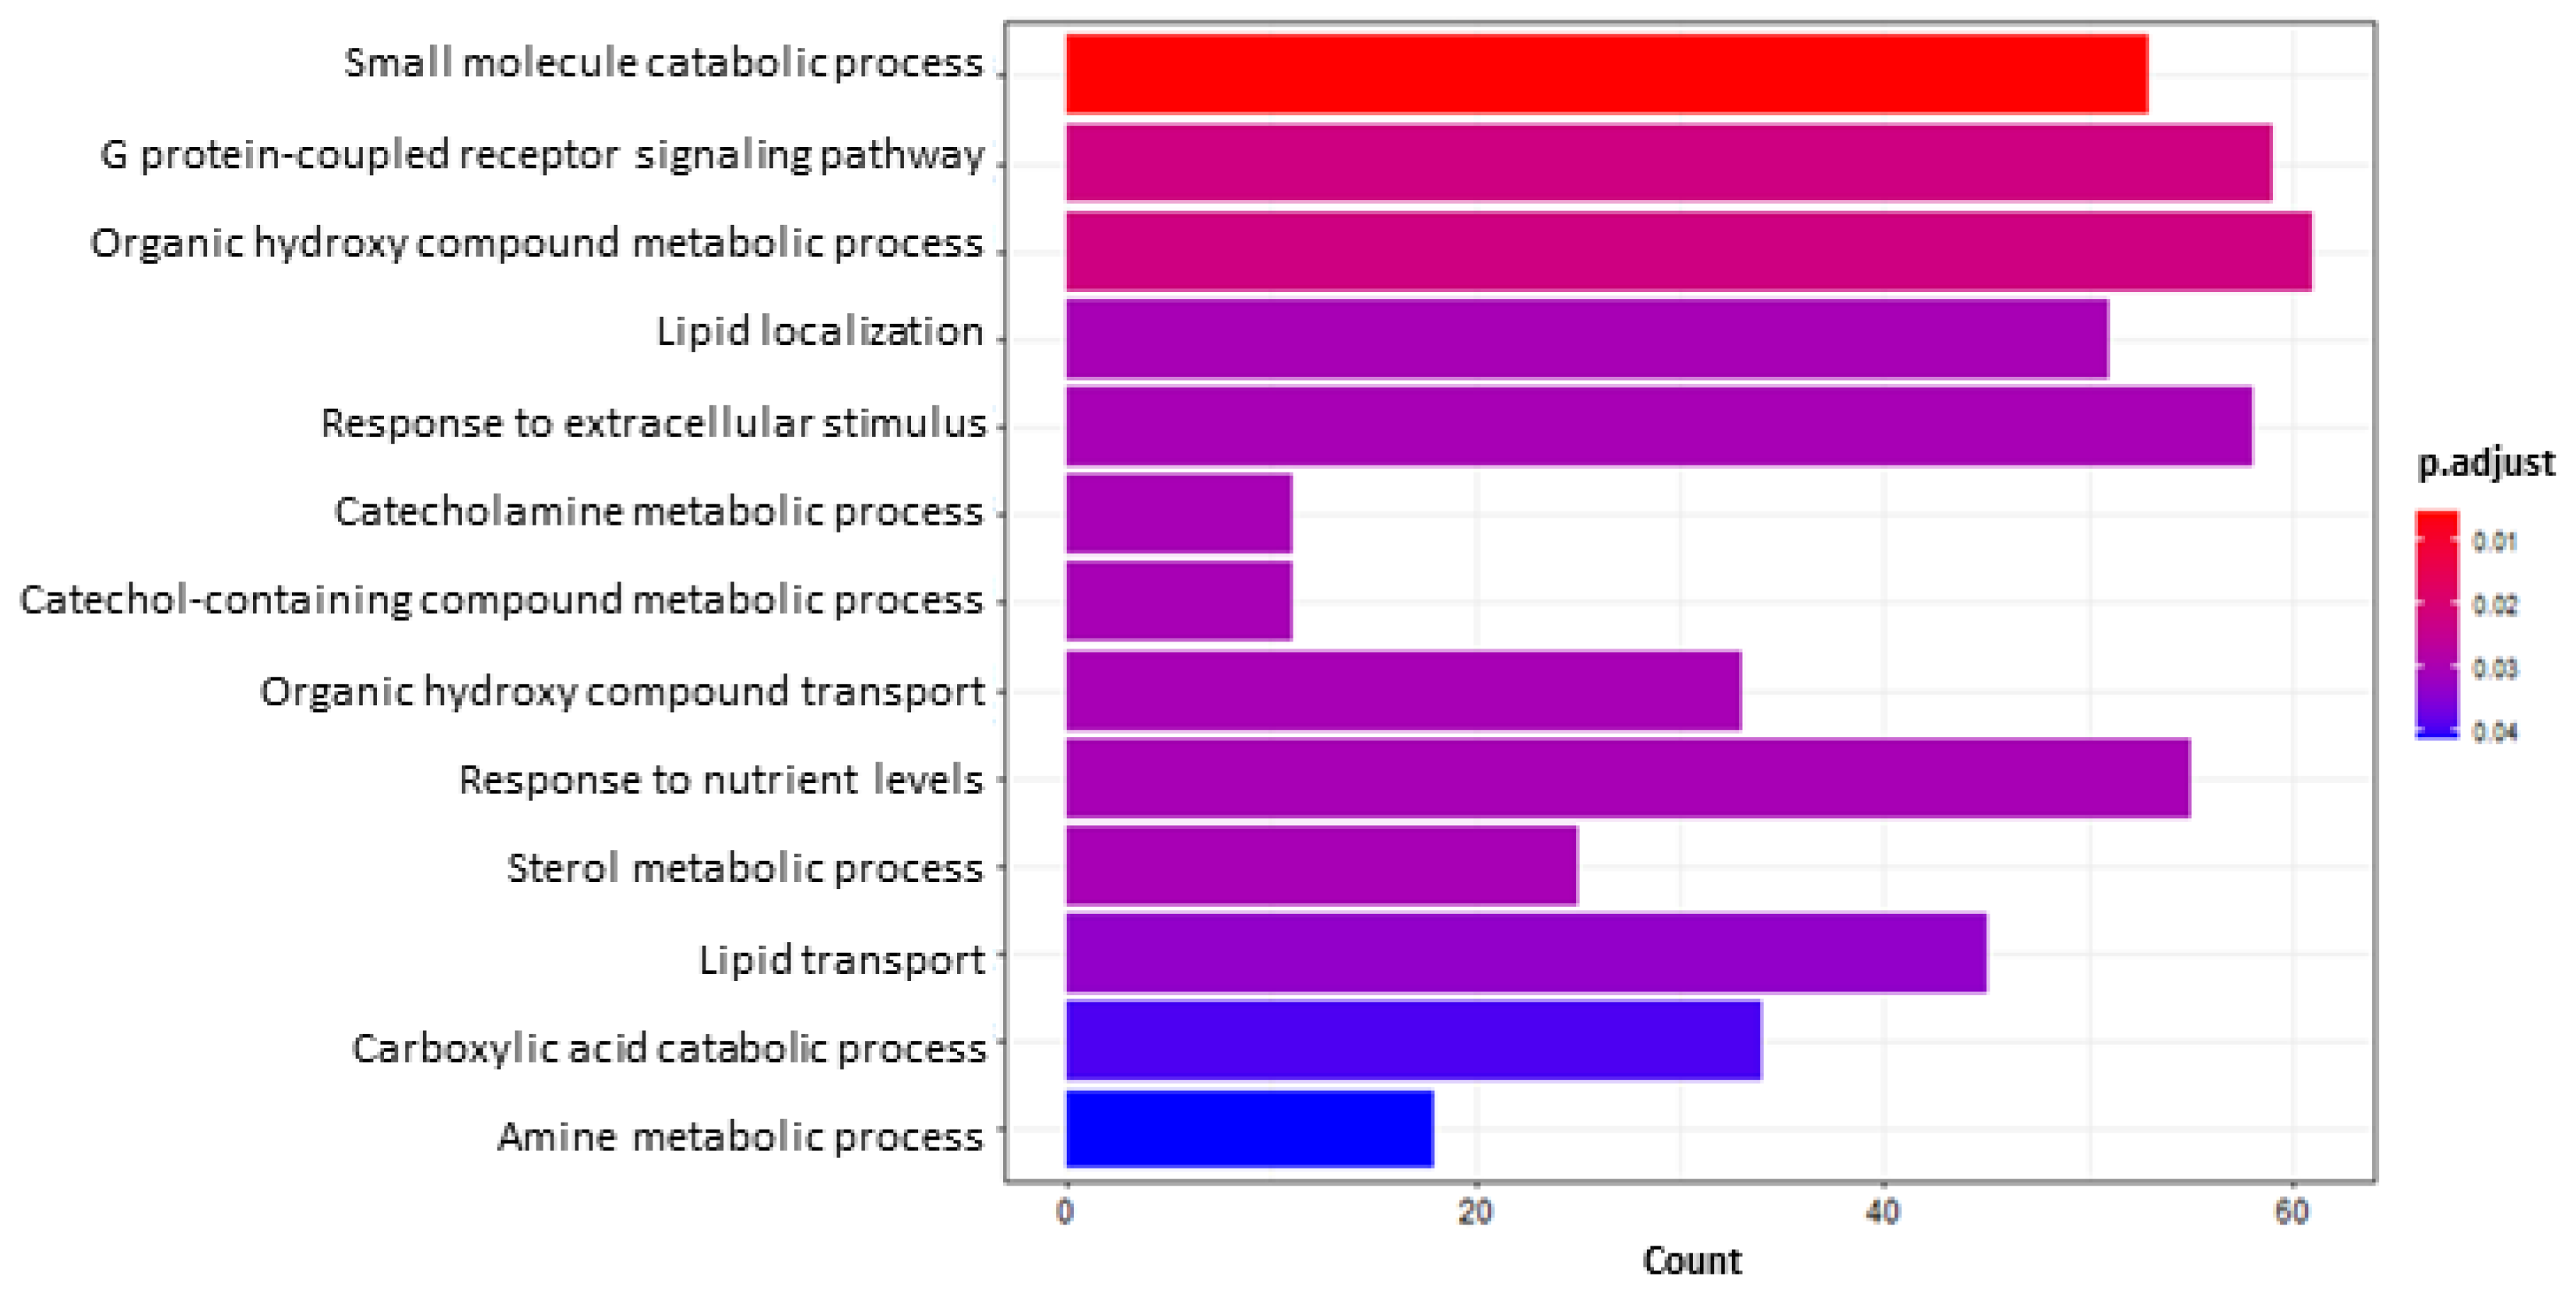
2.5.2. Functional Enrichment and Gene Set Enrichment Analyses (GSEA)
3. Discussion
3.1. 12-O-Tetradecanoylphorbol 13-Acetate and NaB-Mediated Induction of CYP3A4
3.2. Analytical Investigations (LC-MS/MS)
3.3. Cytotoxicity, Permeability and Trans-Epithelial Electric Resistance Evaluation
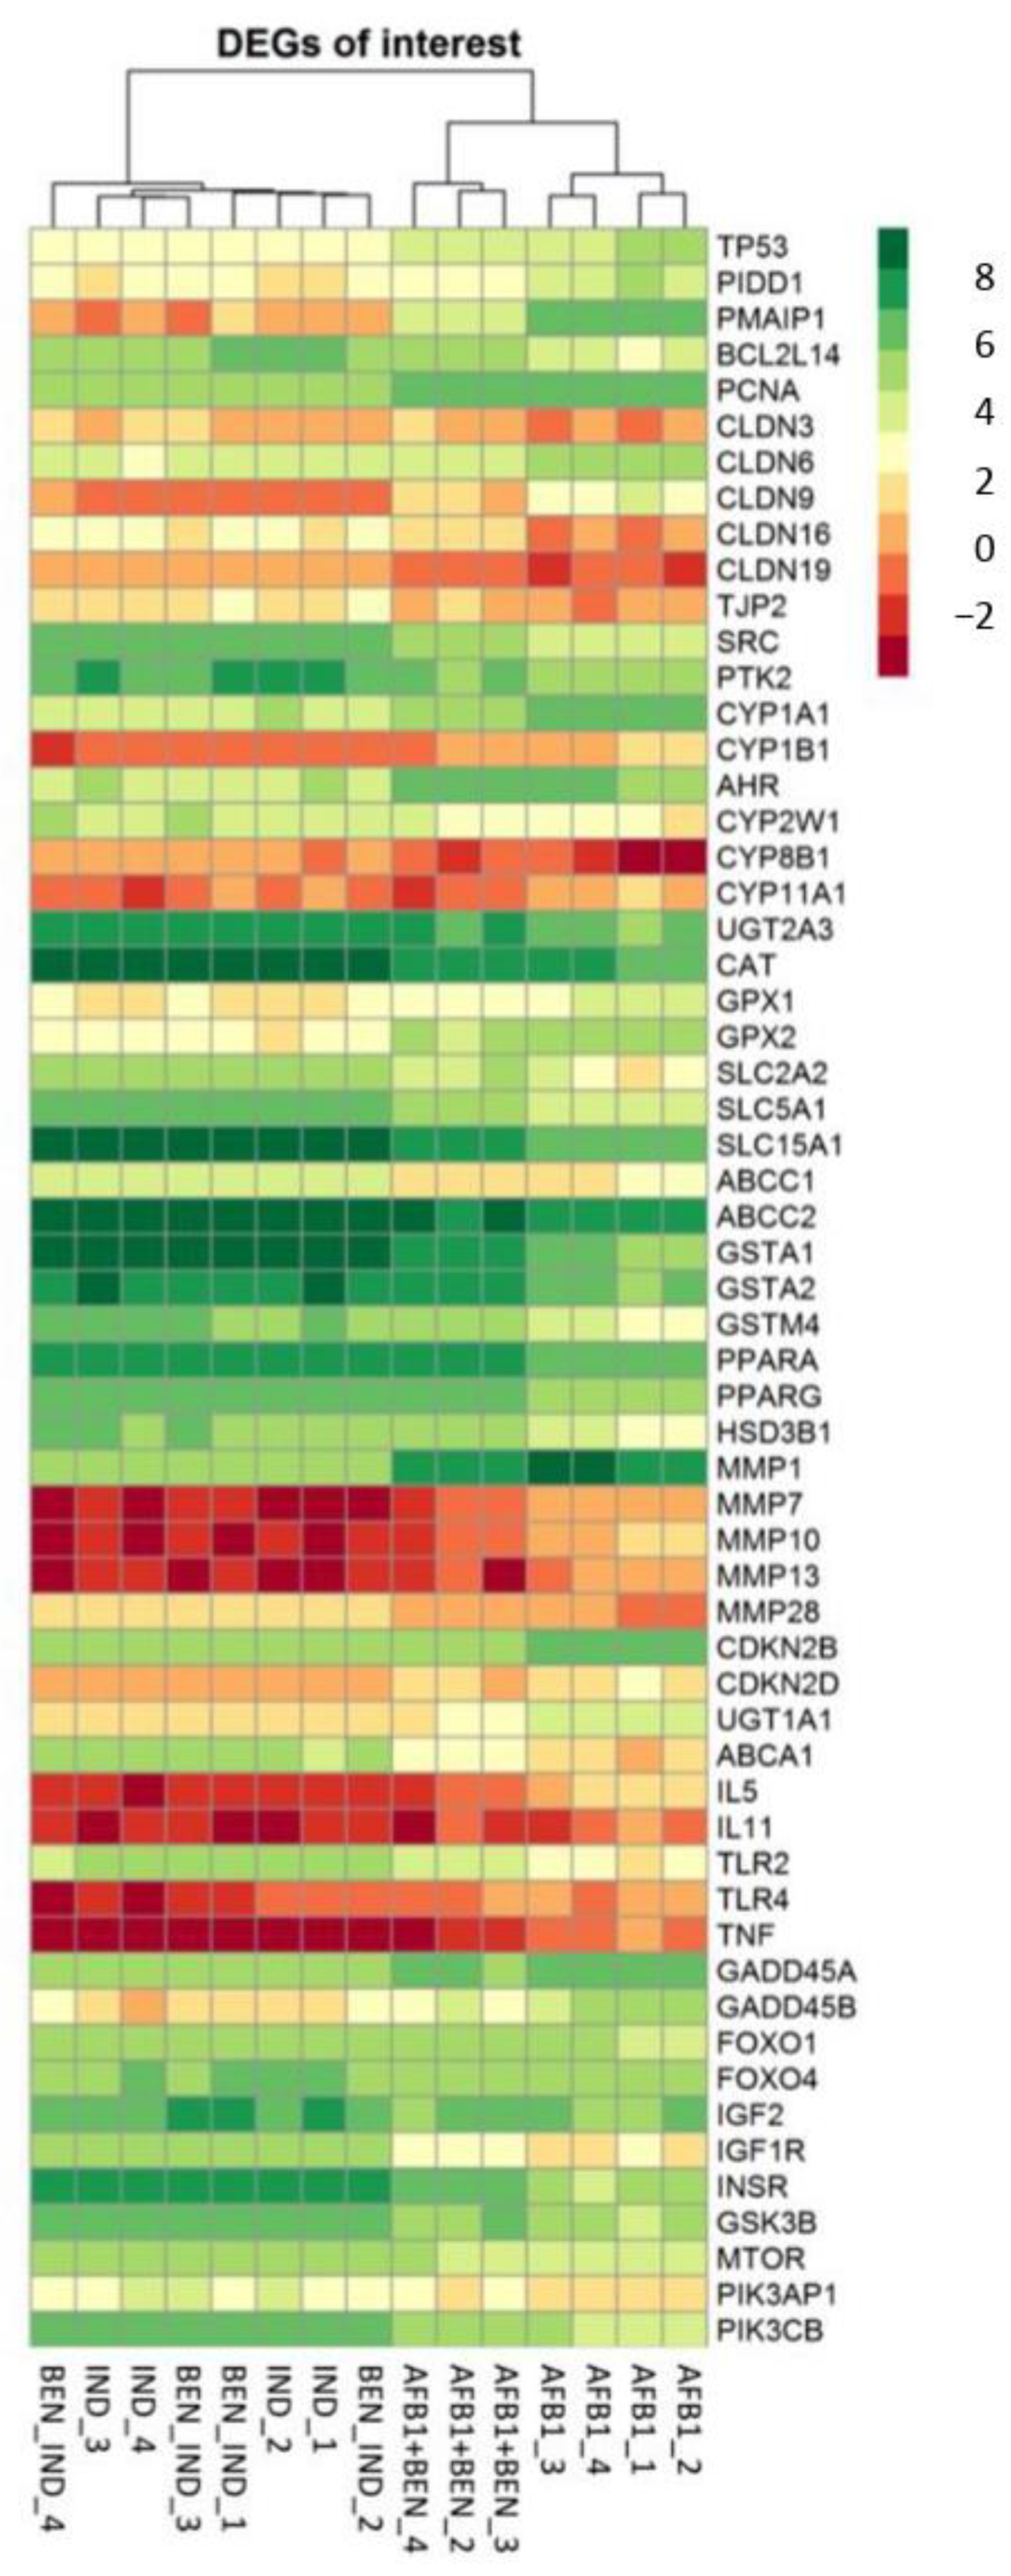
3.4. Whole-Transcriptomic (RNA-seq) Investigations
4. Conclusions
5. Materials and Methods
5.1. Reagents and Chemicals
5.2. Cell Line
5.3. 12-O-Tetradecanoylphorbol 13-Acetate and NaB-Mediated Induction of CYP3A4
5.3.1. Quantitative Real-Time PCR
5.3.2. Cytotoxicity Evaluation
5.4. Cytotoxicity of BEN and AFB1, Alone or in Combination
5.5. Analytical Investigations (LC-MS/MS)
5.6. Permeability and Trans-Epithelial Electric Resistance Assays
5.7. Cells Incubation for Gene Expression Analysis
5.8. Whole-Transcriptomic (RNA-seq) Investigations
5.8.1. Whole Transcriptome Differential Expression Analysis
5.8.2. Functional Enrichment Analysis and Gene Set Enrichment Analysis
5.9. Statistical Analyses
Supplementary Materials
Author Contributions
Funding
Institutional Review Board Statement
Informed Consent Statement
Data Availability Statement
Conflicts of Interest
References
- Mahato, D.K.; Lee, K.E.; Kamle, M.; Devi, S.; Dewangan, K.N.; Kumar, P.; Kang, S.G. Aflatoxins in Food and Feed: An Overview on Prevalence, Detection and Control Strategies. Front. Microbiol. 2019, 10, 2266. [Google Scholar] [CrossRef] [PubMed]
- Wang, L.; Huang, Q.; Wu, J.; Wu, W.; Jiang, J.; Yan, H.; Huang, J.; Sun, Y.; Deng, Y. The metabolism and biotransformation of AFB1: Key enzymes and pathways. Biochem. Pharmacol. 2022, 199, 115005. [Google Scholar] [CrossRef] [PubMed]
- Min, L.; Fink-Gremmels, J.; Li, D.; Tong, X.; Tang, J.; Nan, X.; Yu, Z.; Chen, W.; Wang, G. An Overview of Aflatoxin B1 Biotransformation and Aflatoxin M1 Secretion in Lactating Dairy Cows. Anim. Nutr. 2021, 7, 42–48. [Google Scholar] [CrossRef] [PubMed]
- Frazzoli, C.; Gherardi, P.; Saxena, N.; Belluzzi, G.; Mantovani, A. The Hotspot for (Global) One Health in Primary Food Production: Aflatoxin M1 in Dairy Products. Front. Public Health 2017, 4, 294. [Google Scholar] [CrossRef] [Green Version]
- Maleki, F.; Abdi, S.; Davodian, E.; Haghani, K.; Bakhtiyari, S. Exposure of Infants to Aflatoxin M1 from Mother’s Breast Milk in Ilam, Western Iran. Osong Public Health Res. Perspect. 2015, 6, 283–287. [Google Scholar] [CrossRef] [PubMed] [Green Version]
- Theumer, M.G.; Henneb, Y.; Khoury, L.; Snini, S.P.; Tadrist, S.; Canlet, C.; Puel, O.; Oswald, I.P.; Audebert, M. Genotoxicity of Aflatoxins and Their Precursors in Human Cells. Toxicol. Lett. 2018, 287, 100–107. [Google Scholar] [CrossRef] [PubMed]
- Fouad, A.M.; Ruan, D.; El-Senousey, H.K.; Chen, W.; Jiang, S.; Zheng, C. Harmful Effects and Control Strategies of Aflatoxin B₁ Produced by Aspergillus flavus and Aspergillus parasiticus Strains on Poultry: Review. Toxins 2019, 11, 176. [Google Scholar] [CrossRef] [Green Version]
- Diaz, G.J.; Murcia, H.W. An Unusually High Production of Hepatic Aflatoxin B1-Dihydrodiol, the Possible Explanation for the High Susceptibility of Ducks to Aflatoxin B1. Sci. Rep. 2019, 9, 8010. [Google Scholar] [CrossRef]
- Benkerroum, N. Chronic and Acute Toxicities of Aflatoxins: Mechanisms of Action. Int. J. Environ. Res. Public Health 2020, 17, 423. [Google Scholar] [CrossRef] [Green Version]
- IARC Working Group on the Evaluation of Carcinogenic Risks to Humans. Aflatoxins. In Chemical Agents and Related Occupations. A Review of Human Carcinogens; IARC Monographs on the Evaluation of Carcinogenic Risks to Humans; International Agency for Research on Cancer (IARC): Lyon, France, 2012; Volume 100F, pp. 225–248. ISBN 978-9283213239. [Google Scholar]
- Deng, J.; Zhao, L.; Zhang, N.Y.; Karrow, N.A.; Krumm, C.S.; Qi, D.S.; Sun, L.H. Aflatoxin B1 Metabolism: Regulation by Phase I and II Metabolizing Enzymes and Chemoprotective Agents. Mutat. Res. Mutat. Res. 2018, 778, 79–89. [Google Scholar] [CrossRef]
- Shan, Y. The Toxic Effects of Aflatoxin B1: An Update. In Aflatoxin B1 Occurrence, Detection and Toxicological Effects; IntechOpen: London, UK, 2020; Volume 14, pp. 1–22. [Google Scholar]
- Mughal, M.J.; Peng, X.; Kamboh, A.A.; Zhou, Y.; Fang, J. Aflatoxin B1 Induced Systemic Toxicity in Poultry and Rescue Effects of Selenium and Zinc. Biol. Trace Elem. Res. 2017, 178, 292–300. [Google Scholar] [CrossRef] [PubMed]
- Watson, S.; Gong, Y.Y.; Routledge, M. Interventions Targeting Child Undernutrition in Developing Countries May Be Undermined by Dietary Exposure to Aflatoxin. Crit. Rev. Food Sci. Nutr. 2017, 57, 1963–1975. [Google Scholar] [CrossRef] [PubMed]
- Mupunga, I.; Mngqawa, P.; Katerere, D. Peanuts, Aflatoxins and Undernutrition in Children in Sub-Saharan Africa. Nutrients 2017, 9, 1287. [Google Scholar] [CrossRef] [PubMed] [Green Version]
- Gao, Y.; Meng, L.; Liu, H.; Wang, J.; Zheng, N. The Compromised Intestinal Barrier Induced by Mycotoxins. Toxins 2020, 12, 619. [Google Scholar] [CrossRef]
- Eskola, M.; Kos, G.; Elliott, C.T.; Hajšlová, J.; Mayar, S.; Krska, R. Worldwide Contamination of Food-Crops with Mycotoxins: Validity of the Widely Cited ‘FAO Estimate’ of 25%. Crit. Rev. Food Sci. Nutr. 2020, 60, 2773–2789. [Google Scholar] [CrossRef]
- Jiang, Y.; Ogunade, I.M.; Vyas, D.; Adesogan, A.T. Aflatoxin in Dairy Cows: Toxicity, Occurrence in Feedstuffs and Milk and Dietary Mitigation Strategies. Toxins 2021, 13, 283. [Google Scholar] [CrossRef]
- Sipos, P.; Peles, F.; Brassó, D.L.; Béri, B.; Pusztahelyi, T.; Pócsi, I.; Győri, Z. Physical and Chemical Methods for Reduction in Aflatoxin Content of Feed and Food. Toxins 2021, 13, 204. [Google Scholar] [CrossRef]
- Jaynes, W.; Zartman, R.; Hudnall, W. Aflatoxin B1 Adsorption by Clays from Water and Corn Meal. Appl. Clay Sci. 2007, 36, 197–205. [Google Scholar] [CrossRef]
- Nones, J.; Solhaug, A.; Eriksen, G.S.; Macuvele, D.L.P.; Poli, A.; Soares, C.; Trentin, A.G.; Riella, H.G.; Nones, J. Bentonite Modified with Zinc Enhances Aflatoxin B1 Adsorption and Increase Survival of Fibroblasts (3T3) and Epithelial Colorectal Adenocarcinoma Cells (Caco-2). J. Hazard. Mater. 2017, 337, 80–89. [Google Scholar] [CrossRef]
- Shannon, T.A.; Ledoux, D.R.; Rottinghaus, G.E.; Shaw, D.P.; Daković, A.; Marković, M. The Efficacy of Raw and Concentrated Bentonite Clay in Reducing the Toxic Effects of Aflatoxin in Broiler Chicks. Poult. Sci. 2017, 96, 1651–1658. [Google Scholar] [CrossRef]
- Kissell, L.; Davidson, S.; Hopkins, B.A.; Smith, G.W.; Whitlow, L.W. Effect of Experimental Feed Additives on Aflatoxin in Milk of Dairy Cows Fed Aflatoxin-Contaminated Diets. J. Anim. Physiol. Anim. Nutr. 2013, 97, 694–700. [Google Scholar] [CrossRef] [PubMed]
- EFSA Panel on Additives and Products or Substances Used in Animal Feed (FEEDAP); Rychen, G.; Aquilina, G.; Azimonti, G.; Bampidis, V.; de Bastos, M.L.; Bories, G.; Chesson, A.; Cocconcelli, P.S.; Flachowsky, G.; et al. Safety and Efficacy of Bentonite as a Feed Additive for All Animal Species. EFSA J. 2017, 15, 5096. [Google Scholar] [CrossRef] [Green Version]
- EFSA Panel on Additives and Products or Substances Used in Animal Feed (FEEDAP). Scientific Opinion on the Safety and Efficacy of Bentonite as a Technological Feed Additive for All Species. EFSA J. 2012, 10, 2787. [Google Scholar] [CrossRef]
- Elliott, C.T.; Connolly, L.; Kolawole, O. Potential Adverse Effects on Animal Health and Performance Caused by the Addition of Mineral Adsorbents to Feeds to Reduce Mycotoxin Exposure. Mycotoxin Res. 2020, 36, 115–126. [Google Scholar] [CrossRef] [Green Version]
- Damato, A.; Vanzani, P.; Giannuzzi, D.; Giaretta, E.; Novelli, E.; Vianello, F.; Tagliapietra, F.; Zennaro, L. Bentonite Does Not Affect In Vitro Ruminal Gross Fermentations but Could Modify Ruminal Metabolome and Mineral Content. A Proof of Concept. Res. Vet. Sci. 2022, 144, 78–81. [Google Scholar] [CrossRef]
- Da Violante, G.; Zerrouk, N.; Richard, I.; Frendo, J.L.; Zhiri, A.; Li-Khuan, R.; Tricottet, V.; Provot, G.; Chaumeil, J.C.; Arnaud, P. Short Term Caco-2/TC7 Cell Culture: Comparison between of Conventional 21-d and a Commercially Available 3-d System. Biol. Pharm. Bull. 2004, 27, 1986–1992. [Google Scholar] [CrossRef] [Green Version]
- Hubatsch, I.; Ragnarsson, E.G.E.; Artursson, P. Determination of Drug Permeability and Prediction of Drug Absorption in Caco-2 Monolayers. Nat. Protoc. 2007, 2, 2111–2119. [Google Scholar] [CrossRef]
- Hidalgo, I.J.; Raub, T.J.; Borchardt, R.T. Characterization of the Human Colon Carcinoma Cell Line (Caco-2) as a Model System for Intestinal Epithelial Permeability. Gastroenterology 1989, 96, 736–749. [Google Scholar] [CrossRef]
- Lea, T. Caco-2 cell line. In The Impact of Food Bioactives on Health; Springer International Publishing: Cham, Switzerland, 2015; pp. 103–111. ISBN 978-3-319-15791-7. [Google Scholar]
- Lea, T. Epithelial cell models; General introduction. In The Impact of Food Bioactives on Health; Springer International Publishing: Cham, Switzerland, 2015; pp. 95–102. ISBN 9783319161044. [Google Scholar]
- Sambuy, Y.; De Angelis, I.; Ranaldi, G.; Scarino, M.L.; Stammati, A.; Zucco, F. The Caco-2 Cell Line as a Model of the Intestinal Barrier: Influence of Cell and Culture-Related Factors on Caco-2 Cell Functional Characteristics. Cell Biol. Toxicol. 2005, 21, 1–26. [Google Scholar] [CrossRef]
- Le Ferrec, E.; Chesne, C.; Artusson, P.; Brayden, D.; Fabre, G.; Gires, P.; Guillou, F.; Rousset, M.; Rubas, W.; Scarino, M.L. In Vitro Models of the Intestinal Barrier. The Report and Recommendations of ECVAM Workshop 46. European Centre for the Validation of Alternative Methods. Altern. Lab. Anim. 2001, 29, 649–668. [Google Scholar] [CrossRef]
- Miazzo, R.; Peralta, M.F.; Magnoli, C.; Salvano, M.; Ferrero, S.; Chiacchiera, S.M.; Carvalho, E.C.Q.; Rosa, C.A.R.; Dalcero, A. Efficacy of Sodium Bentonite as a Detoxifier of Broiler Feed Contaminated with Aflatoxin and Fumonisin. Poult. Sci. 2005, 84, 1–8. [Google Scholar] [CrossRef] [PubMed]
- Weaver, A.; See, M.; Hansen, J.; Kim, Y.; De Souza, A.; Middleton, T.; Kim, S. The Use of Feed Additives to Reduce the Effects of Aflatoxin and Deoxynivalenol on Pig Growth, Organ Health and Immune Status during Chronic Exposure. Toxins 2013, 5, 1261–1281. [Google Scholar] [CrossRef] [PubMed] [Green Version]
- Wang, J.P.; Chi, F.; Kim, I.H. Effects of Montmorillonite Clay on Growth Performance, Nutrient Digestibility, Vulva Size, Faecal Microflora, and Oxidative Stress in Weaning Gilts Challenged with Zearalenone. Anim. Feed Sci. Technol. 2012, 178, 158–166. [Google Scholar] [CrossRef]
- Jiang, Y.; Ogunade, I.M.; Kim, D.H.; Li, X.; Pech-Cervantes, A.A.; Arriola, K.G.; Oliveira, A.S.; Driver, J.P.; Ferraretto, L.F.; Staples, C.R.; et al. Effect of Adding Clay with or without a Saccharomyces Cerevisiae Fermentation Product on the Health and Performance of Lactating Dairy Cows Challenged with Dietary Aflatoxin B1. J. Dairy Sci. 2018, 101, 3008–3020. [Google Scholar] [CrossRef]
- Avantaggiato, G.; Havenaar, R.; Visconti, A. Assessment of the Multi-Mycotoxin-Binding Efficacy of a Carbon/Aluminosilicate-Based Product in an in Vitro Gastrointestinal Model. J. Agric. Food Chem. 2007, 55, 4810–4819. [Google Scholar] [CrossRef]
- Nones, J.; Nones, J.; Riella, H.G.; Kuhnen, N.C.; Trentin, A. Bentonite Protects Neural Crest Stem Cells from Death Caused by Aflatoxin B1. Appl. Clay Sci. 2015, 104, 119–127. [Google Scholar] [CrossRef]
- Van Breemen, R.B.; Li, Y. Caco-2 Cell Permeability Assays to Measure Drug Absorption. Expert Opin. Drug Metab. Toxicol. 2005, 1, 175–185. [Google Scholar] [CrossRef]
- Sun, H.; Chow, E.C.; Liu, S.; Du, Y.; Pang, K.S. The Caco-2 Cell Monolayer: Usefulness and Limitations. Expert Opin. Drug Metab. Toxicol. 2008, 4, 395–411. [Google Scholar] [CrossRef]
- De Angelis, I.; Turco, L. Caco-2 Cells as a Model for Intestinal Absorption. Curr. Protoc. Toxicol. 2011, 47, 20.6.1–20.6.15. [Google Scholar] [CrossRef]
- Romero, A.; Ares, I.; Ramos, E.; Castellano, V.; Martínez, M.; Martínez-Larrañaga, M.R.; Anadón, A.; Martínez, M.A. Mycotoxins Modify the Barrier Function of Caco-2 Cells through Differential Gene Expression of Specific Claudin Isoforms: Protective Effect of Illite Mineral Clay. Toxicology 2016, 353–354, 21–33. [Google Scholar] [CrossRef]
- Maisanaba, S.; Gutiérrez-Praena, D.; Pichardo, S.; Moreno, F.J.; Jordá, M.; Cameán, A.M.; Aucejo, S.; Jos, Á. Toxic Effects of a Modified Montmorillonite Clay on the Human Intestinal Cell Line Caco-2. J. Appl. Toxicol. 2014, 34, 714–725. [Google Scholar] [CrossRef] [PubMed]
- Küblbeck, J.; Hakkarainen, J.J.; Petsalo, A.; Vellonen, K.-S.; Tolonen, A.; Reponen, P.; Forsberg, M.M.; Honkakoski, P. Genetically Modified Caco-2 Cells with Improved Cytochrome P450 Metabolic Capacity. J. Pharm. Sci. 2016, 105, 941–949. [Google Scholar] [CrossRef] [Green Version]
- Crespi, C.L.; Penman, B.W.; Hu, M. Development of Caco-2 Cells Expressing High Levels of cDNA-Derived Cytochrome P4503A4. Pharm. Res. 1996, 13, 1635–1641. [Google Scholar] [CrossRef] [PubMed]
- Wienkers, L.C.; Heath, T.G. Predicting in Vivo Drug Interactions from in Vitro Drug Discovery Data. Nat. Rev. Drug Discov. 2005, 4, 825–833. [Google Scholar] [CrossRef] [PubMed]
- Kohl, C. The importance of gut wall metabolism in determining drug bioavailability. In Drug Bioavailability: Estimation of Solubility, Permeability, Absorption and Bioavailability; Wiley: Hoboken, NJ, USA, 2008; Volume 40, pp. 333–357. [Google Scholar]
- Rushing, B.R.; Selim, M.I. Aflatoxin B1: A Review on Metabolism, Toxicity, Occurrence in Food, Occupational Exposure, and Detoxification Methods. Food Chem. Toxicol. 2019, 124, 81–100. [Google Scholar] [CrossRef]
- Dohnal, V.; Wu, Q.; Kuča, K. Metabolism of Aflatoxins: Key Enzymes and Interindividual as Well as Interspecies Differences. Arch. Toxicol. 2014, 88, 1635–1644. [Google Scholar] [CrossRef]
- Cummins, C.L.; Mangravite, L.M.; Benet, L.Z. Characterizing the Expression of CYP3A4 and Efflux Transporters (P-gp, MRP1, and MRP2) in CYP3A4-Transfected Caco-2 Cells after Induction with Sodium Butyrate and the Phorbol Ester 12-O-Tetradecanoylphorbol-13-Acetate. Pharm. Res. 2001, 18, 1102–1109. [Google Scholar] [CrossRef]
- Engman, H.A.; Lennernäs, H.; Taipalensuu, J.; Otter, C.; Leidvik, B.; Artursson, P. CYP3A4, CYP3A5, and MDR1 in Human Small and Large Intestinal Cell Lines Suitable for Drug Transport Studies. J. Pharm. Sci. 2001, 90, 1736–1751. [Google Scholar] [CrossRef]
- Schmiedlin-Ren, P.; Thummel, K.E.; Fisher, J.M.; Paine, M.F.; Lown, K.S.; Watkins, P.B. Expression of Enzymatically Active CYP3A4 by Caco-2 Cells Grown on Extracellular Matrix-Coated Permeable Supports in the Presence of 1α,25-Dihydroxyvitamin D3. Mol. Pharmacol. 1997, 51, 741–754. [Google Scholar] [CrossRef] [Green Version]
- Kong, C.; Shin, S.Y.; Kim, B.G. Evaluation of Mycotoxin Sequestering Agents for Aflatoxin and Deoxynivalenol: An in Vitro Approach. Springerplus 2014, 3, 346. [Google Scholar] [CrossRef] [Green Version]
- Diaz, D.E.; Hagler, W.M.; Hopkins, B.A.; Whitlow, L.W. Aflatoxin Binders I: In Vitro Binding Assay for Aflatoxin B1 by Several Potential Sequestering Agents. Mycopathologia 2002, 156, 223–226. [Google Scholar] [CrossRef] [PubMed]
- Salhab, A.S.; Edwards, G.S. Comparative in Vitro Metabolism of Aflatoxicol by Liver Preparations from Animals and Humans. Cancer Res. 1977, 37, 1016–1021. [Google Scholar] [PubMed]
- Murcia, H.W.; Diaz, G.J. In Vitro Hepatic Aflatoxicol Production Is Related to a Higher Resistance to Aflatoxin B1 in Poultry. Sci. Rep. 2020, 10, 5508. [Google Scholar] [CrossRef] [PubMed] [Green Version]
- Maisanaba, S.; Hercog, K.; Filipic, M.; Jos, Á.; Zegura, B. Genotoxic Potential of Montmorillonite Clay Mineral and Alteration in the Expression of Genes Involved in Toxicity Mechanisms in the Human Hepatoma Cell Line HepG2. J. Hazard. Mater. 2016, 304, 425–433. [Google Scholar] [CrossRef]
- Zhang, M.; Li, X.; Lu, Y.; Fang, X.; Chen, Q.; Xing, M.; He, J. Studying the Genotoxic Effects Induced by Two Kinds of Bentonite Particles on Human B Lymphoblast Cells in Vitro. Mutat. Res. Toxicol. Environ. Mutagen. 2011, 720, 62–66. [Google Scholar] [CrossRef]
- Geh, S.; Yücel, R.; Duffin, R.; Albrecht, C.; Borm, P.J.A.; Armbruster, L.; Raulf-Heimsoth, M.; Brüning, T.; Hoffmann, E.; Rettenmeier, A.W.; et al. Cellular Uptake and Cytotoxic Potential of Respirable Bentonite Particles with Different Quartz Contents and Chemical Modifications in Human Lung Fibroblasts. Arch. Toxicol. 2006, 80, 98–106. [Google Scholar] [CrossRef]
- Maisanaba, S.; Pichardo, S.; Puerto, M.; Gutiérrez-Praena, D.; Cameán, A.M.; Jos, A. Toxicological Evaluation of Clay Minerals and Derived Nanocomposites: A Review. Environ. Res. 2015, 138, 233–254. [Google Scholar] [CrossRef]
- Lordan, S.; Kennedy, J.E.; Higginbotham, C.L. Cytotoxic Effects Induced by Unmodified and Organically Modified Nanoclays in the Human Hepatic HepG2 Cell Line. J. Appl. Toxicol. 2011, 31, 27–35. [Google Scholar] [CrossRef]
- Kolosova, A.; Stroka, J. Substances for Reduction of the Contamination of Feed by Mycotoxins: A Review. World Mycotoxin J. 2011, 4, 225–256. [Google Scholar] [CrossRef]
- Akbari, P.; Braber, S.; Varasteh, S.; Alizadeh, A.; Garssen, J.; Fink-Gremmels, J. The Intestinal Barrier as an Emerging Target in the Toxicological Assessment of Mycotoxins. Arch. Toxicol. 2017, 91, 1007–1029. [Google Scholar] [CrossRef] [Green Version]
- Kozieł, M.J.; Ziaja, M.; Piastowska-Ciesielska, A.W. Intestinal Barrier, Claudins and Mycotoxins. Toxins 2021, 13, 758. [Google Scholar] [CrossRef] [PubMed]
- Garcia-Hernandez, V.; Quiros, M.; Nusrat, A. Intestinal Epithelial Claudins: Expression and Regulation in Homeostasis and Inflammation. Ann. N. Y. Acad. Sci. 2017, 1397, 66–79. [Google Scholar] [CrossRef]
- Gao, Y.; Bao, X.; Meng, L.; Liu, H.; Wang, J.; Zheng, N. Aflatoxin B1 and Aflatoxin M1 Induce Compromised Intestinal Integrity through Clathrin-Mediated Endocytosis. Toxins 2021, 13, 184. [Google Scholar] [CrossRef] [PubMed]
- Barany, A.; Oliva, M.; Gregório, S.F.; Martínez-Rodríguez, G.; Mancera, J.M.; Fuentes, J. Dysregulation of Intestinal Physiology by Aflatoxicosis in the Gilthead Seabream (Sparus aurata). Front. Physiol. 2021, 12, 741192. [Google Scholar] [CrossRef] [PubMed]
- Lai, Y.; Sun, M.; He, Y.; Lei, J.; Han, Y.; Wu, Y.; Bai, D.; Guo, Y.; Zhang, B. Mycotoxins Binder Supplementation Alleviates Aflatoxin B1 Toxic Effects on the Immune Response and Intestinal Barrier Function in Broilers. Poult. Sci. 2022, 101, 101683. [Google Scholar] [CrossRef] [PubMed]
- Bolós, V.; Gasent, J.M.; López-Tarruella, S.; Grande, E. The Dual Kinase Complex FAK-Src as a Promising Therapeutic Target in Cancer. Onco Targets Ther. 2010, 3, 83–97. [Google Scholar] [CrossRef] [PubMed] [Green Version]
- Lehman, C.E.; Spencer, A.; Hall, S.; Shaw, J.J.P.; Wulfkuhle, J.; Petricoin, E.F.; Bekiranov, S.; Jameson, M.J.; Gioeli, D. IGF1R and Src Inhibition Induce Synergistic Cytotoxicity in HNSCC through Inhibition of FAK. Sci. Rep. 2021, 11, 10826. [Google Scholar] [CrossRef]
- Tran, V.N.; Viktorová, J.; Ruml, T. Mycotoxins: Biotransformation and Bioavailability Assessment Using Caco-2 Cell Monolayer. Toxins 2020, 12, 628. [Google Scholar] [CrossRef]
- Arenas-Huertero, F.; Zaragoza-Ojeda, M.; Sánchez-Alarcón, J.; Milić, M.; Šegvić Klarić, M.; Montiel-González, J.M.; Valencia-Quintana, R. Involvement of Ahr Pathway in Toxicity of Aflatoxins and Other Mycotoxins. Front. Microbiol. 2019, 10, 2347. [Google Scholar] [CrossRef] [Green Version]
- Guo, J.; Johansson, I.; Mkrtchian, S.; Ingelman-Sundberg, M. The CYP2W1 Enzyme: Regulation, Properties and Activation of Prodrugs. Drug Metab. Rev. 2016, 48, 369–378. [Google Scholar] [CrossRef]
- Dhers, L.; Ducassou, L.; Boucher, J.-L.; Mansuy, D. Cytochrome P450 2U1, a Very Peculiar Member of the Human P450s Family. Cell. Mol. Life Sci. 2017, 74, 1859–1869. [Google Scholar] [CrossRef] [PubMed]
- Kumarakulasingham, M.; Rooney, P.H.; Dundas, S.R.; Telfer, C.; Melvin, W.T.; Curran, S.; Murray, G.I. Cytochrome P450 Profile of Colorectal Cancer: Identification of Markers of Prognosis. Clin. Cancer Res. 2005, 11, 3758–3765. [Google Scholar] [CrossRef] [PubMed] [Green Version]
- Sun, L.; Dai, J.; Xu, J.; Yang, J.; Zhang, D. Comparative Cytotoxic Effects and Possible Mechanisms of Deoxynivalenol, Zearalenone and T-2 Toxin Exposure to Porcine Leydig Cells In Vitro. Toxins 2022, 14, 113. [Google Scholar] [CrossRef] [PubMed]
- Lorbek, G.; Lewinska, M.; Rozman, D. Cytochrome P450s in the Synthesis of Cholesterol and Bile Acids—From Mouse Models to Human Diseases. FEBS J. 2012, 279, 1516–1533. [Google Scholar] [CrossRef]
- Hanioka, N.; Nonaka, Y.; Saito, K.; Negishi, T.; Okamoto, K.; Kataoka, H.; Narimatsu, S. Effect of Aflatoxin B1 on UDP-Glucuronosyltransferase MRNA Expression in HepG2 Cells. Chemosphere 2012, 89, 526–529. [Google Scholar] [CrossRef]
- Ghadiri, S.; Spalenza, V.; Dellafiora, L.; Badino, P.; Barbarossa, A.; Dall’Asta, C.; Nebbia, C.; Girolami, F. Modulation of Aflatoxin B1 Cytotoxicity and Aflatoxin M1 Synthesis by Natural Antioxidants in a Bovine Mammary Epithelial Cell Line. Toxicol. Vitr. 2019, 57, 174–183. [Google Scholar] [CrossRef]
- Kozieł, M.J.; Kowalska, K.; Piastowska-Ciesielska, A.W. Nrf2: A Main Responsive Element in Cells to Mycotoxin-Induced Toxicity. Arch. Toxicol. 2021, 95, 1521–1533. [Google Scholar] [CrossRef]
- Pauletto, M.; Giantin, M.; Tolosi, R.; Bassan, I.; Barbarossa, A.; Zaghini, A.; Dacasto, M. Discovering the Protective Effects of Resveratrol on Aflatoxin B1-Induced Toxicity: A Whole Transcriptomic Study in a Bovine Hepatocyte Cell Line. Antioxidants 2021, 10, 1225. [Google Scholar] [CrossRef]
- Pauletto, M.; Giantin, M.; Tolosi, R.; Bassan, I.; Barbarossa, A.; Zaghini, A.; Dacasto, M. Curcumin Mitigates AFB1-Induced Hepatic Toxicity by Triggering Cattle Antioxidant and Anti-Inflammatory Pathways: A Whole Transcriptomic In Vitro Study. Antioxidants 2020, 9, 1059. [Google Scholar] [CrossRef]
- Ighodaro, O.M.; Akinloye, O.A. First Line Defence Antioxidants-Superoxide Dismutase (SOD), Catalase (CAT) and Glutathione Peroxidase (GPX): Their Fundamental Role in the Entire Antioxidant Defence Grid. Alex. J. Med. 2018, 54, 287–293. [Google Scholar] [CrossRef] [Green Version]
- Brigelius-Flohé, R.; Flohé, L. Regulatory Phenomena in the Glutathione Peroxidase Superfamily. Antioxid. Redox Signal. 2020, 33, 498–516. [Google Scholar] [CrossRef] [PubMed]
- Gugliandolo, E.; Peritore, A.F.; D’Amico, R.; Licata, P.; Crupi, R. Evaluation of Neuroprotective Effects of Quercetin against Aflatoxin B1-Intoxicated Mice. Animals 2020, 10, 898. [Google Scholar] [CrossRef] [PubMed]
- Cheng, P.; Ishfaq, M.; Yu, H.; Yang, Y.; Li, S.; Li, X.; Fazlani, S.A.; Guo, W.; Zhang, X. Curcumin Ameliorates Duodenal Toxicity of AFB1 in Chicken through Inducing P-Glycoprotein and Downregulating Cytochrome P450 Enzymes. Poult. Sci. 2020, 99, 7035–7045. [Google Scholar] [CrossRef]
- Marin, D.E.; Bulgaru, C.V.; Anghel, C.A.; Pistol, G.C.; Dore, M.I.; Palade, M.L.; Taranu, I. Grape Seed Waste Counteracts Aflatoxin B1 Toxicity in Piglet Mesenteric Lymph Nodes. Toxins 2020, 12, 800. [Google Scholar] [CrossRef]
- Aszalos, A. Role of ATP-Binding Cassette (ABC) Transporters in Interactions Between Natural Products and Drugs. Curr. Drug Metab. 2008, 9, 1010–1018. [Google Scholar] [CrossRef] [PubMed]
- Sobral, M.M.C.; Faria, M.A.; Cunha, S.C.; Miladinovic, B.; Ferreira, I.M. Transport of Mycotoxins across Human Gastric NCI–N87 and Intestinal Caco-2 Cell Models. Food Chem. Toxicol. 2019, 131, 110595. [Google Scholar] [CrossRef] [PubMed]
- Tuntiteerawit, P.; Jarukamjorn, K.; Porasuphatana, S. The Effect of Green Tea Catechins on Breast Cancer Resistance Protein Activity and Intestinal Efflux of Aflatoxin B1 via Breast Cancer Resistance Protein in Caco-2 Cells. Toxicol. Res. 2020, 36, 293–300. [Google Scholar] [CrossRef]
- Huuskonen, P.; Myllynen, P.; Storvik, M.; Pasanen, M. The Effects of Aflatoxin B1 on Transporters and Steroid Metabolizing Enzymes in JEG-3 Cells. Toxicol. Lett. 2013, 218, 200–206. [Google Scholar] [CrossRef]
- Manzini, L.; Halwachs, S.; Girolami, F.; Badino, P.; Honscha, W.; Nebbia, C. Interaction of Mammary Bovine ABCG2 with AFB1 and Its Metabolites and Regulation by PCB 126 in a MDCKII in Vitro Model. J. Vet. Pharmacol. Ther. 2017, 40, 591–598. [Google Scholar] [CrossRef]
- Dietrich, B.; Neuenschwander, S.; Bucher, B.; Wenk, C. Fusarium Mycotoxin-Contaminated Wheat Containing Deoxynivalenol Alters the Gene Expression in the Liver and the Jejunum of Broilers. Animal 2012, 6, 278–291. [Google Scholar] [CrossRef] [Green Version]
- Veiga-Matos, J.; Remião, F.; Motales, A. Pharmacokinetics and Toxicokinetics Roles of Membrane Transporters at Kidney Level. J. Pharm. Pharm. Sci. 2020, 23, 333–356. [Google Scholar] [CrossRef] [PubMed]
- Röder, P.V.; Geillinger, K.E.; Zietek, T.S.; Thorens, B.; Koepsell, H.; Daniel, H. The Role of SGLT1 and GLUT2 in Intestinal Glucose Transport and Sensing. PLoS ONE 2014, 9, e89977. [Google Scholar] [CrossRef] [PubMed]
- Jochems, P.G.M.; Garssen, J.; Van Keulen, A.M.; Masereeuw, R.; Jeurink, P.V. Evaluating Human Intestinal Cell Lines for Studying Dietary Protein Absorption. Nutrients 2018, 10, 322. [Google Scholar] [CrossRef] [PubMed] [Green Version]
- Chen, L.; Zhao, Z.-W.; Zeng, P.-H.; Zhou, Y.-J.; Yin, W.-J. Molecular Mechanisms for ABCA1-Mediated Cholesterol Efflux. Cell Cycle 2022, 21, 1121–1139. [Google Scholar] [CrossRef]
- Ubagai, T.; Kikuchi, T.; Fukusato, T.; Ono, Y. Aflatoxin B1 Modulates the Insulin-like Growth Factor-2 Dependent Signaling Axis. Toxicol. Vitr. 2010, 24, 783–789. [Google Scholar] [CrossRef] [PubMed]
- Akash, M.S.H.; ul Haq, M.E.; Qader, A.; Rehman, K. Biochemical Investigation of Human Exposure to Aflatoxin M1 and Its Association with Risk Factors of Diabetes Mellitus. Environ. Sci. Pollut. Res. 2021, 28, 62907–62918. [Google Scholar] [CrossRef]
- Lee, S.; Dong, H.H. FoxO Integration of Insulin Signaling with Glucose and Lipid Metabolism. J. Endocrinol. 2017, 233, R67–R79. [Google Scholar] [CrossRef] [Green Version]
- Laplante, M.; Sabatini, D.M. Regulation of MTORC1 and Its Impact on Gene Expression at a Glance. J. Cell Sci. 2013, 126, 1713–1719. [Google Scholar] [CrossRef] [Green Version]
- Xie, K.; He, X.; Hu, G.; Zhang, H.; Chen, Y.; Hou, D.-X.; Song, Z. The Preventive Effect and Mechanisms of Adsorbent Supplementation in Low Concentration Aflatoxin B1 Contaminated Diet on Subclinical Symptom and Histological Lesions of Broilers. Poult. Sci. 2022, 101, 101634. [Google Scholar] [CrossRef]
- Pierron, A.; Alassane-Kpembi, I.; Oswald, I.P. Impact of Two Mycotoxins Deoxynivalenol and Fumonisin on Pig Intestinal Health. Porc. Health Manag. 2016, 2, 21. [Google Scholar] [CrossRef]
- Mehrzad, J.; Malvandi, A.M.; Alipour, M.; Hosseinkhani, S. Environmentally Relevant Level of Aflatoxin B 1 Elicits Toxic Pro-Inflammatory Response in Murine CNS-Derived Cells. Toxicol. Lett. 2017, 279, 96–106. [Google Scholar] [CrossRef] [PubMed]
- Jebali, R.; Abbès, S.; Ben Salah-Abbès, J.; Ben Younes, R.; Haous, Z.; Oueslati, R. Ability of Lactobacillus Plantarum MON03 to Mitigate Aflatoxins (B1 and M1) Immunotoxicities in Mice. J. Immunotoxicol. 2015, 12, 290–299. [Google Scholar] [CrossRef] [PubMed] [Green Version]
- Engin, A.B.; Engin, A. DNA Damage Checkpoint Response to Aflatoxin B1. Environ. Toxicol. Pharmacol. 2019, 65, 90–96. [Google Scholar] [CrossRef] [PubMed]
- Hussain, S.P.; Schwank, J.; Staib, F.; Wang, X.W.; Harris, C.C. TP53 Mutations and Hepatocellular Carcinoma: Insights into the Etiology and Pathogenesis of Liver Cancer. Oncogene 2007, 26, 2166–2176. [Google Scholar] [CrossRef] [Green Version]
- Yin, H.; Jiang, M.; Peng, X.; Cui, H.; Zhou, Y.; He, M.; Zuo, Z.; Ouyang, P.; Fan, J.; Fang, J. The Molecular Mechanism of G2/M Cell Cycle Arrest Induced by AFB1 in the Jejunum. Oncotarget 2016, 7, 35592–35606. [Google Scholar] [CrossRef] [Green Version]
- Huang, B.; Chen, Q.; Wang, L.; Gao, X.; Zhu, W.; Mu, P.; Deng, Y. Aflatoxin B1 Induces Neurotoxicity through Reactive Oxygen Species Generation, DNA Damage, Apoptosis, and S-Phase Cell Cycle Arrest. Int. J. Mol. Sci. 2020, 21, 6517. [Google Scholar] [CrossRef]
- Bao, X.Y.; Li, S.L.; Gao, Y.N.; Wang, J.Q.; Zheng, N. Transcriptome Analysis Revealed That Aflatoxin M1 Could Cause Cell Cycle Arrest in Differentiated Caco-2 Cells. Toxicol. Vitr. 2019, 59, 35–43. [Google Scholar] [CrossRef]
- Mansilla, S.F.; De La Vega, M.B.; Calzetta, N.L.; Siri, S.O.; Gottifredi, V. CDK-Independent and PCNA-Dependent Functions of P21 in DNA Replication. Genes 2020, 11, 593. [Google Scholar] [CrossRef]
- Cánepa, E.T.; Scassa, M.E.; Ceruti, J.M.; Marazita, M.C.; Carcagno, A.L.; Sirkin, P.F.; Ogara, M.F. INK4 Proteins, a Family of Mammalian CDK Inhibitors with Novel Biological Functions. IUBMB Life 2007, 59, 419–426. [Google Scholar] [CrossRef]
- Woznicki, J.A.; Flood, P.; Bustamante-Garrido, M.; Stamou, P.; Moloney, G.; Fanning, A.; Zulquernain, S.A.; McCarthy, J.; Shanahan, F.; Melgar, S.; et al. Human BCL-G Regulates Secretion of Inflammatory Chemokines but Is Dispensable for Induction of Apoptosis by IFN-γ and TNF-α in Intestinal Epithelial Cells. Cell Death Dis. 2020, 11, 68. [Google Scholar] [CrossRef] [Green Version]
- Giam, M.; Okamoto, T.; Mintern, J.D.; Strasser, A.; Bouillet, P. Bcl-2 Family Member Bcl-G Is Not a Proapoptotic Protein. Cell Death Dis. 2012, 3, e404. [Google Scholar] [CrossRef] [PubMed]
- Wang, W.J.; Xu, Z.L.; Yu, C.; Xu, X.H. Effects of Aflatoxin B1 on Mitochondrial Respiration, ROS Generation and Apoptosis in Broiler Cardiomyocytes. Anim. Sci. J. 2017, 88, 1561–1568. [Google Scholar] [CrossRef] [PubMed]
- Liu, Y.; Wang, W. Aflatoxin B1 Impairs Mitochondrial Functions, Activates ROS Generation, Induces Apoptosis and Involves Nrf2 Signal Pathway in Primary Broiler Hepatocytes. Anim. Sci. J. 2016, 87, 1490–1500. [Google Scholar] [CrossRef] [PubMed]
- Liebermann, D.A.; Hoffman, B. Gadd45 in Stress Signaling. J. Mol. Signal. 2008, 3, 15. [Google Scholar] [CrossRef] [Green Version]
- Sheikh, M.S.; Hollander, M.C.; Fornace, A.J. Role of Gadd45 in Apoptosis. Biochem. Pharmacol. 2000, 59, 43–45. [Google Scholar] [CrossRef]
- Cabral-Pacheco, G.A.; Garza-Veloz, I.; Castruita-De la Rosa, C.; Ramirez-Acuña, J.M.; Perez-Romero, B.A.; Guerrero-Rodriguez, J.F.; Martinez-Avila, N.; Martinez-Fierro, M.L. The Roles of Matrix Metalloproteinases and Their Inhibitors in Human Diseases. Int. J. Mol. Sci. 2020, 21, 9739. [Google Scholar] [CrossRef]
- Pauletto, M.; Tolosi, R.; Giantin, M.; Guerra, G.; Barbarossa, A.; Zaghini, A.; Dacasto, M. Insights into Aflatoxin B1 Toxicity in Cattle: An in Vitro Whole-Transcriptomic Approach. Toxins 2020, 12, 429. [Google Scholar] [CrossRef]
- Livak, K.J.; Schmittgen, T.D. Analysis of Relative Gene Expression Data Using Real-Time Quantitative PCR and the 2−ΔΔCT Method. Methods 2001, 25, 402–408. [Google Scholar] [CrossRef]
- Zorzan, E.; Da Ros, S.; Musetti, C.; Shahidian, L.Z.; Ramos Coelho, N.F.; Bonsembiante, F.; Létard, S.; Gelain, M.E.; Palumbo, M.; Dubreuil, P.; et al. Screening of Candidate G-Quadruplex Ligands for the Human c-KIT Promotorial Region and Their Effects in Multiple in-Vitro Models. Oncotarget 2016, 7, 21658–21675. [Google Scholar] [CrossRef] [Green Version]
- Maisanaba, S.; Guzmán-Guillén, R.; Puerto, M.; Gutiérrez-Praena, D.; Ortuño, N.; Jos, Á. In Vitro Toxicity Evaluation of New Silane-Modified Clays and the Migration Extract from a Derived Polymer-Clay Nanocomposite Intended to Food Packaging Applications. J. Hazard. Mater. 2018, 341, 313–320. [Google Scholar] [CrossRef]
- Hiebl, V.; Schachner, D.; Ladurner, A.; Heiss, E.H.; Stangl, H.; Dirsch, V.M. Caco-2 Cells for Measuring Intestinal Cholesterol Transport—Possibilities and Limitations. Biol. Proced. Online 2020, 22, 7. [Google Scholar] [CrossRef] [PubMed] [Green Version]
- Srinivasan, B.; Kolli, A.R.; Esch, M.B.; Abaci, H.E.; Shuler, M.L.; Hickman, J.J. TEER Measurement Techniques for in Vitro Barrier Model Systems. SLAS Technol. 2015, 20, 107–126. [Google Scholar] [CrossRef] [PubMed] [Green Version]
- Konsoula, R.; Barile, F.A. Correlation of in Vitro Cytotoxicity with Paracellular Permeability in Caco-2 Cells. Toxicol. Vitr. 2005, 19, 675–684. [Google Scholar] [CrossRef] [PubMed]
- Andrews, S.; Krueger, F.; Seconds-Pichon, A.; Biggins, F.; Wingett, S. FastQC. A Quality Control Tool for High Throughput Sequence Data; Babraham Bioinformatics, Babraham Institute: Cambridge, UK, 2015. [Google Scholar]
- Bolger, A.M.; Lohse, M.; Usadel, B. Trimmomatic: A Flexible Trimmer for Illumina Sequence Data. Bioinformatics 2014, 30, 2114–2120. [Google Scholar] [CrossRef] [PubMed] [Green Version]
- Kopylova, E.; Noé, L.; Touzet, H. SortMeRNA: Fast and Accurate Filtering of Ribosomal RNAs in Metatranscriptomic Data. Bioinformatics 2012, 28, 3211–3217. [Google Scholar] [CrossRef] [PubMed]
- Dobin, A.; Gingeras, T.R. Mapping RNA-seq Reads with STAR. Curr. Protoc. Bioinform. 2015, 51, 586–597. [Google Scholar] [CrossRef] [Green Version]
- R Core Team. R: A Language and Environment for Statistical Computing; R Core Team: Vienna, Austria, 2021. [Google Scholar]
- Robinson, M.D.; McCarthy, D.J.; Smyth, G.K. EdgeR: A Bioconductor Package for Differential Expression Analysis of Digital Gene Expression Data. Bioinformatics 2010, 26, 139–140. [Google Scholar] [CrossRef] [Green Version]
- Wu, T.; Hu, E.; Xu, S.; Chen, M.; Guo, P.; Dai, Z.; Feng, T.; Zhou, L.; Tang, W.; Zhan, L.; et al. ClusterProfiler 4.0: A Universal Enrichment Tool for Interpreting Omics Data. Innovation 2021, 2, 100141. [Google Scholar] [CrossRef]


Publisher’s Note: MDPI stays neutral with regard to jurisdictional claims in published maps and institutional affiliations. |
© 2022 by the authors. Licensee MDPI, Basel, Switzerland. This article is an open access article distributed under the terms and conditions of the Creative Commons Attribution (CC BY) license (https://creativecommons.org/licenses/by/4.0/).
Share and Cite
Mucignat, G.; Bassan, I.; Giantin, M.; Pauletto, M.; Bardhi, A.; Iori, S.; Lopparelli, R.M.; Barbarossa, A.; Zaghini, A.; Novelli, E.; et al. Does Bentonite Cause Cytotoxic and Whole-Transcriptomic Adverse Effects in Enterocytes When Used to Reduce Aflatoxin B1 Exposure? Toxins 2022, 14, 435. https://0-doi-org.brum.beds.ac.uk/10.3390/toxins14070435
Mucignat G, Bassan I, Giantin M, Pauletto M, Bardhi A, Iori S, Lopparelli RM, Barbarossa A, Zaghini A, Novelli E, et al. Does Bentonite Cause Cytotoxic and Whole-Transcriptomic Adverse Effects in Enterocytes When Used to Reduce Aflatoxin B1 Exposure? Toxins. 2022; 14(7):435. https://0-doi-org.brum.beds.ac.uk/10.3390/toxins14070435
Chicago/Turabian StyleMucignat, Greta, Irene Bassan, Mery Giantin, Marianna Pauletto, Anisa Bardhi, Silvia Iori, Rosa Maria Lopparelli, Andrea Barbarossa, Anna Zaghini, Enrico Novelli, and et al. 2022. "Does Bentonite Cause Cytotoxic and Whole-Transcriptomic Adverse Effects in Enterocytes When Used to Reduce Aflatoxin B1 Exposure?" Toxins 14, no. 7: 435. https://0-doi-org.brum.beds.ac.uk/10.3390/toxins14070435