Article

Metabolic Changes in Early-Stage Non–Small Cell Lung Cancer Patients after Surgical Resection

1
Research Institute in Oncology and Hematology, CancerCare Manitoba, Winnipeg, MB R3E 0V9, Canada
2
Department of Radiology, Section of Radiation Oncology, Rady Faculty of Health Sciences, University of Manitoba, Winnipeg, MB R3T 2N2, Canada
3
Department of Community Health Sciences, Rady Faculty of Health Sciences, University of Manitoba, Winnipeg, MB R3E 0W3, Canada
4
Department of Surgery, Rady Faculty of Health Sciences, University of Manitoba, Winnipeg, MB R3A 1R9, Canada
5
CancerCare Manitoba, Winnipeg, MB R3E 0V9, Canada
6
St. Boniface Hospital Albrechtsen Research Centre, Winnipeg, MB R2H 2A6, Canada
7
Department of Pathology, Rady Faculty of Health Sciences, University of Manitoba, Winnipeg, MB R3E 3P5, Canada
8
Department of Food and Human Nutritional Sciences, University of Manitoba, Winnipeg, MB R3T 2N2, Canada
*
Authors to whom correspondence should be addressed.
Submission received: 4 May 2021 / Revised: 4 June 2021 / Accepted: 11 June 2021 / Published: 16 June 2021
(This article belongs to the Collection Cancer Biomarkers)

Abstract

:

Simple Summary

Considerable progress in the treatment of non–small cell lung cancer (NSCLC) has been made possible by large-scale technologies that scan the gene expression in tumor cells. While gene expression is informative, it is the changes to cellular metabolism that directly affect the initiation and the progression of the disease. Altered metabolic processes in cancer include how the tumor cells handle fat, proteins, and sugar, produce energy, divide (grow), or migrate. We have used nuclear magnetic resonance and mass spectrometry to survey and document the metabolic changes in blood and urine samples collected from NSCLC patients before and after their lung tumors were surgically removed. We found several molecular compounds that changed in abundance in the blood or urine after surgery, many of which are related to cancer cell metabolism. Further documentation of these changes in large patient populations will lead to non-invasive ways to screen, diagnose, or monitor disease progression in lung cancer patients.

Abstract

Metabolic alterations in malignant cells play a vital role in tumor initiation, proliferation, and metastasis. Biofluids from patients with non–small cell lung cancer (NSCLC) harbor metabolic biomarkers with potential clinical applications. In this study, we assessed the changes in the metabolic profile of patients with early-stage NSCLC using mass spectrometry and nuclear magnetic resonance spectroscopy before and after surgical resection. A single cohort of 35 patients provided a total of 29 and 32 pairs of urine and serum samples, respectively, pre-and post-surgery. We identified a profile of 48 metabolites that were significantly different pre- and post-surgery: 17 in urine and 31 in serum. A higher proportion of metabolites were upregulated than downregulated post-surgery (p < 0.01); however, the median fold change (FC) was higher for downregulated than upregulated metabolites (p < 0.05). Purines/pyrimidines and proteins had a larger dysregulation than other classes of metabolites (p < 0.05 for each class). Several of the dysregulated metabolites have been previously associated with cancer, including leucyl proline, asymmetric dimethylarginine, isopentenyladenine, fumaric acid (all downregulated post-surgery), as well as N6-methyladenosine and several deoxycholic acid moieties, which were upregulated post-surgery. This study establishes metabolomic analysis of biofluids as a path to non-invasive diagnostics, screening, and monitoring in NSCLC.

1. Introduction

There has been considerable progress in our understanding of lung cancer biology in the last two decades. Checkpoint inhibitors against the programmed death ligand-1 (PD-L1) as a primary treatment or in combination with chemotherapy have changed the landscape of non–small cell lung cancer (NSCLC) with significantly improved outcomes [1]. Several actionable driver mutations, namely epidermal growth factor receptor (EGFR), anaplastic lymphoma kinase (ALK), and c-ros oncogene 1kinase (ROS1), have been identified using next-generation sequencing techniques, resulting in specifically targeted drug therapy and improved outcomes in patients harboring these mutations [2,3,4]. While it is true that genomics, transcriptomics, and proteomics may predict the biological behavior of malignant cells, it is their metabolic alterations that play a direct and vital role in tumor initiation, proliferation, and metastasis. Some examples of metabolic alterations that are critical to the survival and proliferation of malignant cells include accelerated glycolysis, the formation of lactic acid, changes in the citric acid cycle, amino acid metabolism, and cell membrane synthesis [5,6,7,8,9]. Metabolomics research therefore offers a means to observe the current status of the cellular microenvironment. Recently, there has been movement to develop and incorporate metabolomics in NSCLC research to uncover the biomarkers for applications such as screening, pathogenesis, histopathological classification, and possible therapeutic interventions [8]. Biofluids from NSCLC patients (including serum, urine, exhaled breath condensate, and sputum) have been found to harbor specific metabolic biomarkers with potential applications in clinical practice [10,11,12,13,14,15,16].
To date, the clinical application of metabolomics in general is limited due to several factors, including a lack of adequately controlled studies (i.e., incomparable patient populations) and a lack of standardized procedures for metabolite extraction, processing, and analysis [17]. Here, we applied metabolomics to serum and urine samples from a single patient population collected before and after surgical resection. We have applied two complementary and commonly used platforms to identify metabolites of interest: nuclear magnetic resonance (NMR) and liquid chromatography quadrupole time-of-flight mass spectrometry (LC-QTOF-MS). NMR can detect multiple metabolites in a short time with minimal sample preparation; LC-QTOF-MS is much more sensitive than NMR and can detect metabolites of very low concentrations [18,19]. We therefore present a prospective observational study in patients with known or suspected early-stage NSCLC and compare their metabolic profiles, screened by these two methods, from serum and urine collected before and after surgery. We hypothesized that the surgical resection of a malignant tumor affects the overall metabolome and causes significant changes in the concentrations of metabolites found in commonly analyzed biofluids. The main objective of this study was therefore to examine the overall metabolomic changes in serum and urine samples collected from patients with early-stage NSCLC before and after the surgical removal of the malignancy. This study opens a path to the development of non-invasive diagnostics, screening, and/or monitoring methods in managing NSCLC.

2. Materials and Methods

2.1. Patient Enrollment and Biofluid Sample Collection

Protocols were approved by the Research Ethics Board of the University of Manitoba, Canada (H2017:247). Each patient consented to participate in the study prior to accrual. Consecutive patients were screened for eligibility at a thoracic surgery clinic in Winnipeg, Manitoba, Canada. Eligible participants were adult patients (>18 years) with biopsy-proven or suspected stage I or II NSCLC (based on a maximum standardized uptake value on positron emission tomography or an increasing pulmonary tumor size in serial CT chest scans), and medically operable. Imaging data for each eligible patient were reviewed by a thoracic surgeon and a radiation oncologist. Clinical, imaging, surgical, and pathology data for enrolled patients were extracted from hospital paper charts and the Varian Medical Oncology application at Cancer Care Manitoba (CCMB) by a designated research assistant and verified by the principal investigator. All pre- and post-surgery samples were collected and prepared by the same research assistant, according to standardized protocols. Serum and midstream urine samples (8–10 mL) were collected within 4 weeks pre-surgery and within 4 months post-surgery. All samples were immediately stored at −80 °C and transferred to the laboratory for batched analysis by NMR and LC-QTOF-MS.

2.2. Nuclear Magnetic Resonance (NMR)

2.2.1. Sample Preparation for NMR Analysis

The samples were thawed and prepared with the additives and parameters we have described previously [20]. The serum samples (300 μL) were mixed with a phosphate buffer (pH 7.4) containing 5 μM NaN3 at a ratio of 1:1 (v/v), followed by the addition of 20 μL of TSP (0.75%). The urine samples (400 μL) were mixed with 230 μL of a 0.2 M phosphate buffer (0.2% w/v NaN3) and 70 μL of Chenomx ISTD (IS-2, 5 mM DSS, 0.2% w/v NaN3). The samples were mixed by vortexing and centrifuged at 12,000× g at 4 °C for 5 min. A volume of 600 μL of each prepared sample was then transferred into a 5 mm NMR tube for analysis [20].

2.2.2. NMR Analysis

The NMR experiments were conducted on a Bruker Ascend 600 Spectrometer operating at 600.27 MHz for proton nuclei and 150.938 MHz for carbon nuclei. Each sample was subject to two separate scans at a probe temperature of 298 K. A few randomly selected samples were run using the heteronuclear single quantum coherence (HSQC) method for additional analysis with a 65.5 k time domain, a 90° pulse width of 10 μs, a spectral width of 16 ppm, and a relaxation delay of 5 s. A total of 32 scans, with two dummy scans producing an acquisition time of 4.75 min, were acquired. Water was suppressed (at 2819 Hz, time domain 32.7 k) in all 1D Nuclear Overhauser Effect Spectroscopy (NOESY) runs. A total of 64 scans and 4 dummy scans were generated during the 7 min 45 s acquisition time. The 2D NMR spectra were achieved with a 90° pulse width of 10 μs and a relaxation delay of 1.5 s. The time-domain values for 2D NMR spectra were 2048 and 400 for F1 (16 ppm) and F2 (210 ppm), respectively. An acquisition time of approximately 11 h was needed to obtain 32 scans and 16 dummy scans. All NMR spectra were processed by MestReNova version 12.0.0–20080 as previously reported [20].

2.3. Liquid Chromatography Quadrupole Time-of-Flight Mass Spectrometry (LC-QTOF-MS)

2.3.1. Sample Preparation for LC-QTOF-MS

The serum samples (100 μL) were spiked with 20 μL of Norvaline (0.03 mg/mL) as an internal standard and extracted with 200 μL of acetonitrile (ACN,). The urine samples (250 μL) were spiked with 10 μL of Norvaline (0.03 mg/mL) and extracted with 500 μL of ACN. The samples were then centrifuged at 12,000× g at 4 °C for 20 min. The supernatants of serum and urine were dried under a gentle stream of N2 and stored at −20 °C. The dried serum and urine samples were reconstituted with 100 μL of ddH2O:ACN (1:4) and 200 μL of ddH2O:ACN (4:1), respectively. Each sample was transferred into a glass insert in a gas chromatography (GC) vial for analysis [20].

2.3.2. LC-QTOF-MS Analysis

The urinary and serum metabolites were separated using a 1260 Infinity HPLC system and were detected by a 6538 UHD Accurate Q-TOF MS system (Agilent Technologies, Santa Clara, CA, USA). The ionization of the separated metabolites was performed using an electrospray ionization source operating in positive (ESI+) and negative (ESI–) modes. The separation of the urinary metabolites was achieved using a 2.1 mm × 100 mm, 1.8 μm Zorbax SB-Aq column (Agilent Technologies) held at 45 °C and the serum metabolites were separated using a 2.1 mm × 50 mm, 1.8 μm Zorbax Extended-C18 column (Agilent Technologies) which was held at 55 °C. Water (ddH2O) and ACN with 0.1% formic acid were used as mobile phases using previously reported gradients [20]. The statistical analysis was carried out using Agilent MassHunter Acquisition software (B.07) and Mass Profiler Professional (MPP, 12.6.) as previously reported [20].

2.4. Statistical Analysis and Metabolite Identification

The fold change (FC) was calculated for each metabolite identified by dividing the larger of the pre- and post-surgery samples by the smaller value.
For the metabolites identified by NMR, the FCs between the identified classes of metabolites were compared using the Wilcoxon signed rank or the Kruskal–Wallis tests for the comparison of two or more classes, respectively. The chi-square and Fisher exact tests were used to compare the frequencies of regulatory direction. Within individuals, the pre- and post-surgery levels of metabolites were compared using the Wilcoxon signed rank test.
For LC-QTOF-MS, the MPP software (12.6.1) was used for the FC analysis by paired t tests (p < 0.05; ≥2-fold changes) with an asymptotic p value and the Benjamini–Hochberg multiple correction method was used to identify statistically significant metabolites.
The compounds identified through LC-QTOF-MS were further confirmed by mass spectra, retention time, and confidence scores against the Metlin database with >79,000 metabolites including 39,000 lipids and 168,000 peptides [20,21,22]. All the identified metabolites of significance were then re-classified based on the Human Metabolome Data Base (HMDB) [23].

3. Results

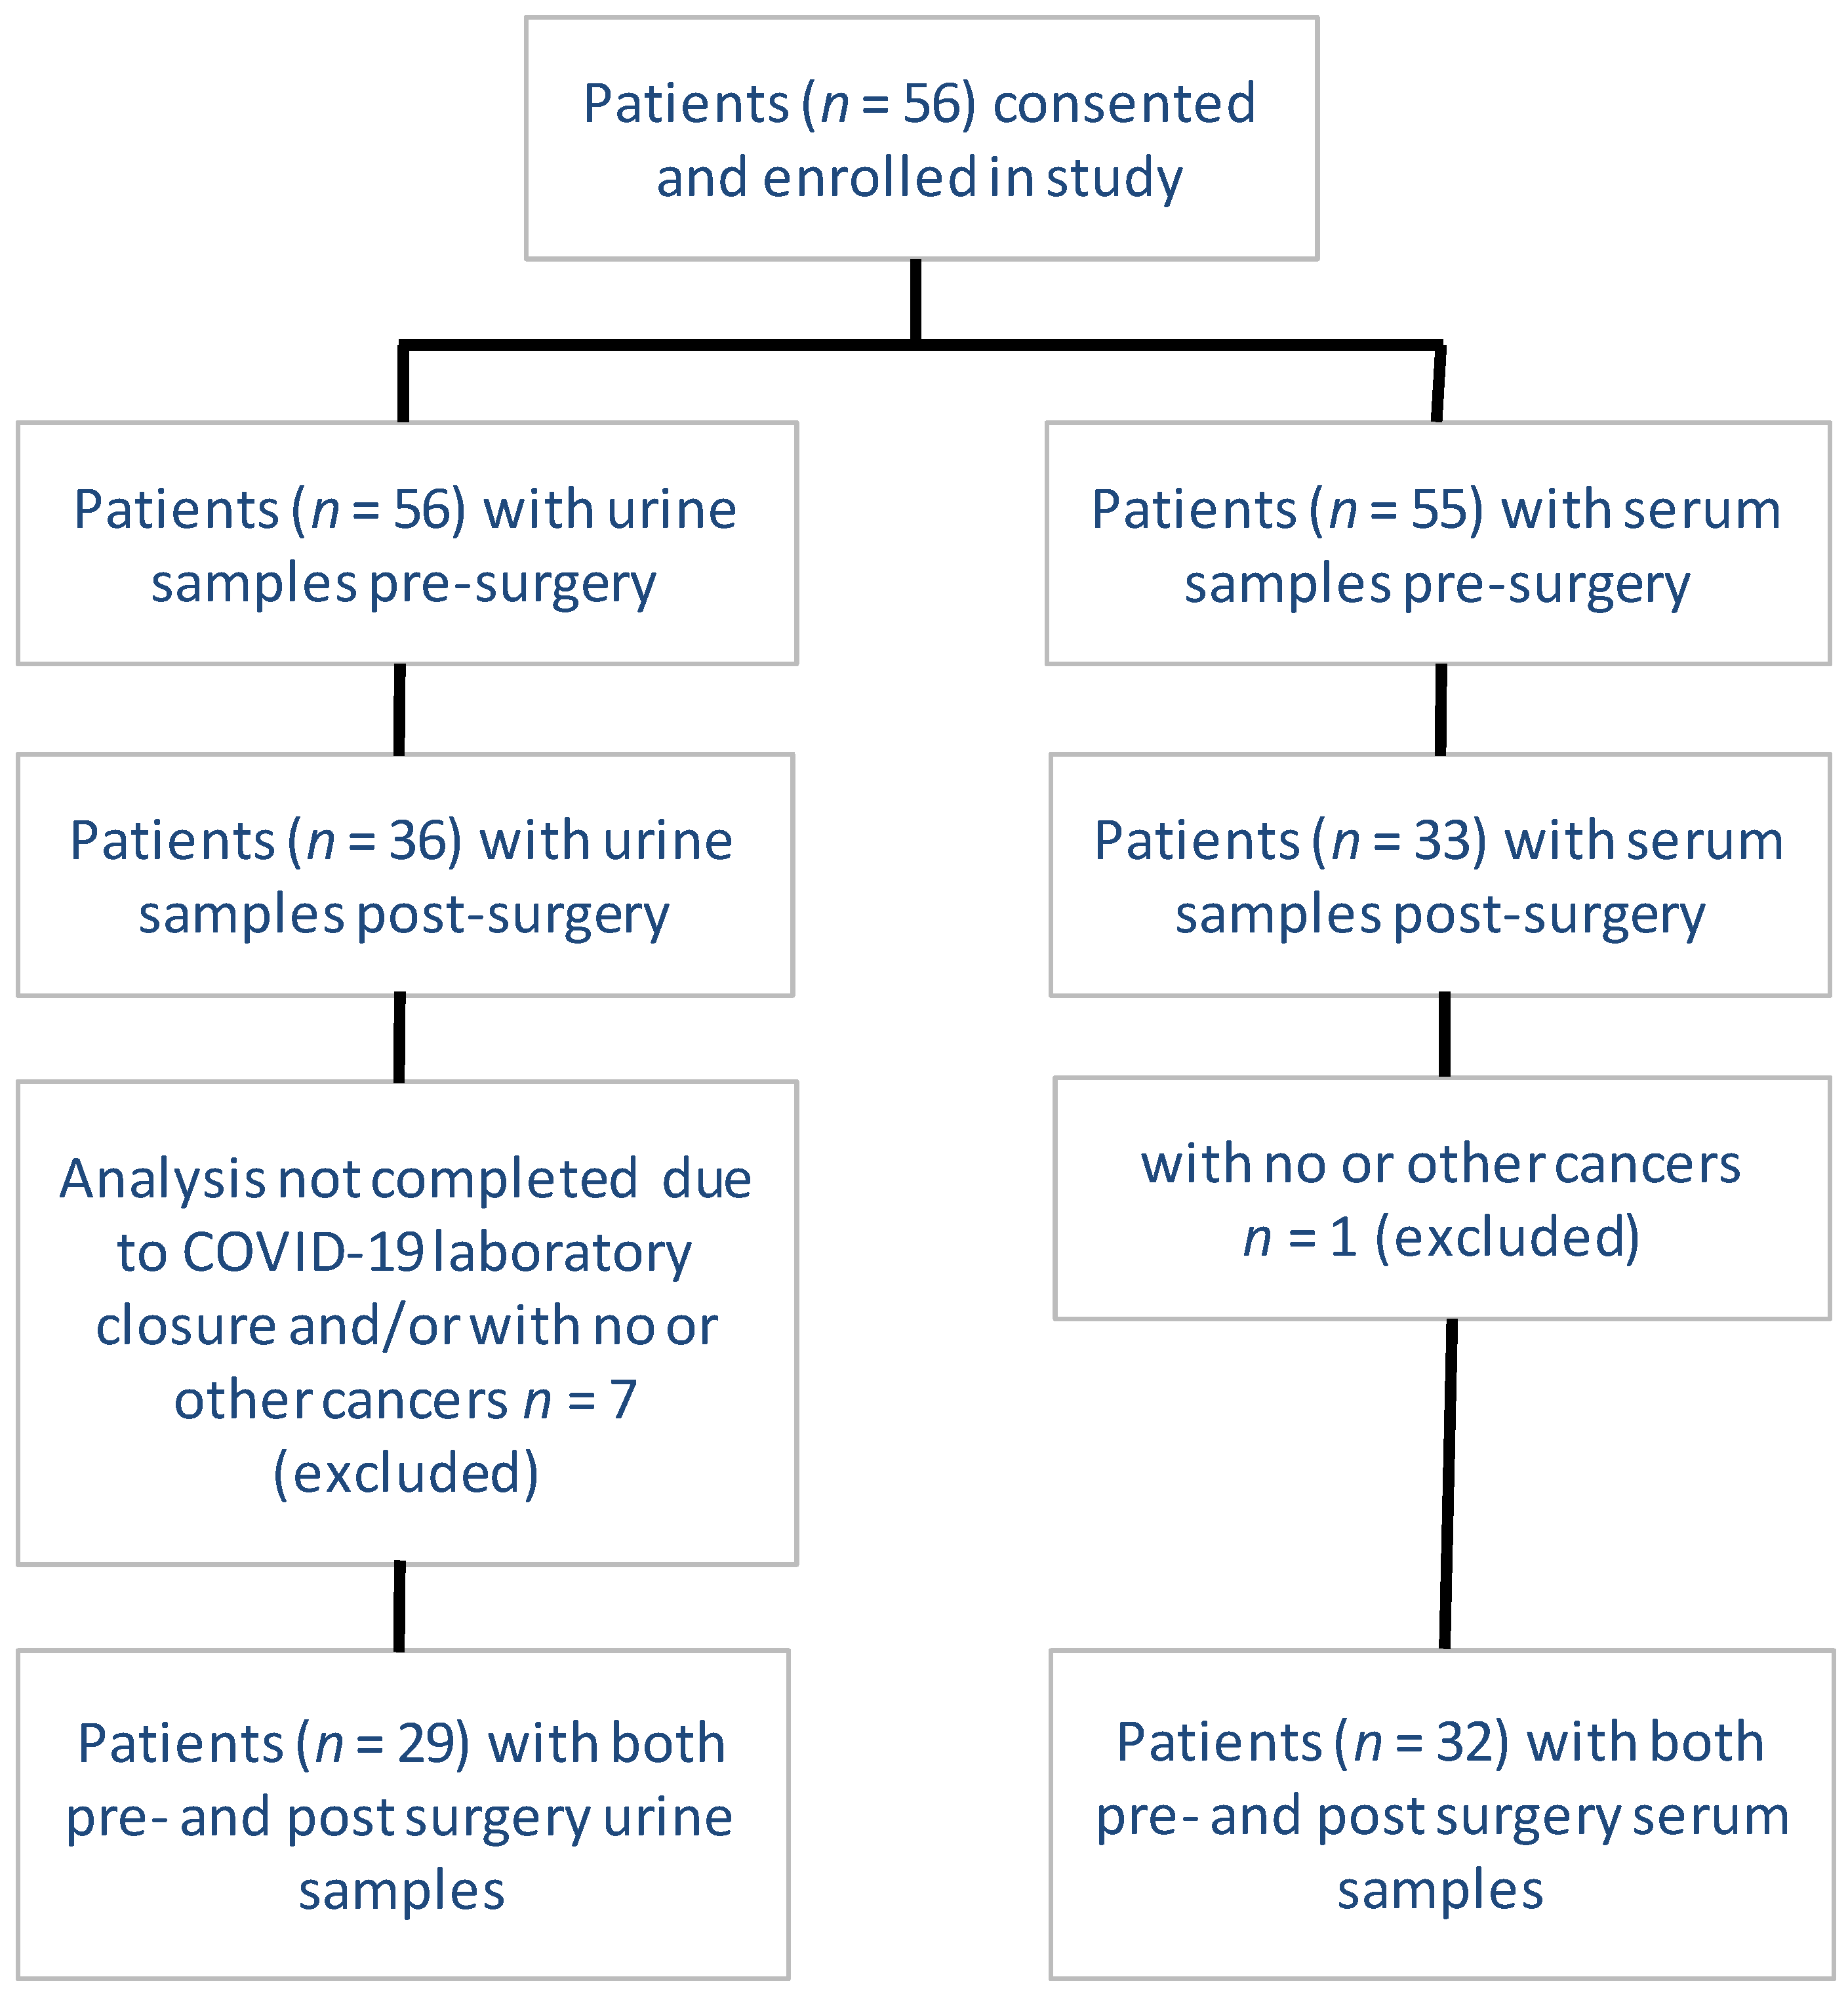
3.1. Patient Enrollment, Inclusion, and Exclusion

Between March 2018 and November 2019, 56 patients were enrolled in the study. Inclusion and exclusion criteria as well as details of the sample collection are presented in Figure 1. In total, 35 patients were eligible for analysis. From these individuals, NMR and QTOF analyses were completed on the urine samples from 29 patients and on the serum samples from 32 patients, collected both pre- and post-surgery. The mean time for serum and urine collection was 5 and 7 days before surgery and 56 and 57 days after surgery, respectively. Post-surgery, all but two patients had their biofluid samples taken before commencing any systemic therapy. A total of 86% of the patients were smokers or previous smokers. Each patient had a gross surgical resection of the tumor either through lobectomy/pneumonectomy (60%) or wedge resection/segmentectomy (40%). All patients had a confirmed pathological diagnosis of NSCLC, 80% had adenocarcinoma, 88% had no pathologically involved nodes (N0), and 12% had incidental intrapulmonary, hilar, or mediastinal (N1-N2) disease. ALK and PDL1 status was available in 66% of the patients. All patients had ALK negative tumors and a PDL1 tumor proportion score (TPS) of >50% was present in 17% of the tumors. EGFR status was not available. Mean (±SD) tumor size from pre-surgical chest CT scans was 2.4 ± 1.6 cm. Mean (±SD) tumor size from surgical pathology was 2.7 ± 1.9 cm. The mean maximum PET_SUV was 8.2 ± 6.5. The data are summarized in Table 1.

3.2. Inclusion, Exclusion, and Classification of Identified Metabolites

A total of 105 metabolites registering statistically significant differences pre- vs. post-surgery were identified by either LC-QTOF or NMR: LC-QTOF registered 71 metabolites of significance in the serum samples and 28 in the urine samples, and NMR registered 12 metabolites of significance in the serum samples and 37 in the urine samples. Of the metabolites identified by NMR, only one in the serum samples and five in the urine samples were included for analysis as those were statistically significant (p < 0.05). Each metabolite was reviewed based on the chemical formula, mass and atomic number, presence/absence, and the description of the compound in both HMDB [23] and the National Center for Biotechnology Information (NCBI) database [24]. From this analysis, 57 metabolites identified by LC-QTOF were judged to be either of exogenous origin or related to external substances (prescription drugs, food, or food additives) and were excluded from the analysis.
We therefore identified 48 metabolites of significance in the serum and urine samples and classified these based on their chemical composition and/or metabolic pathway per HMDB. Five classes of metabolites were identified: lipids and derivatives, proteins and derivatives, carboxylic acid and derivatives, carbohydrates, and purines/pyrimidines. The metabolites that did not fit into one of these classes were grouped as unclassified. A metabolite was labeled upregulated or downregulated if the levels increased or decreased after surgery, respectively, expressed as an absolute FC. Metabolites in each class with their respective atomic number/mass, polarity, FC, source biofluid (serum or urine) and the identifying platform (NMR/LC-QTOF) are presented in Table 2.

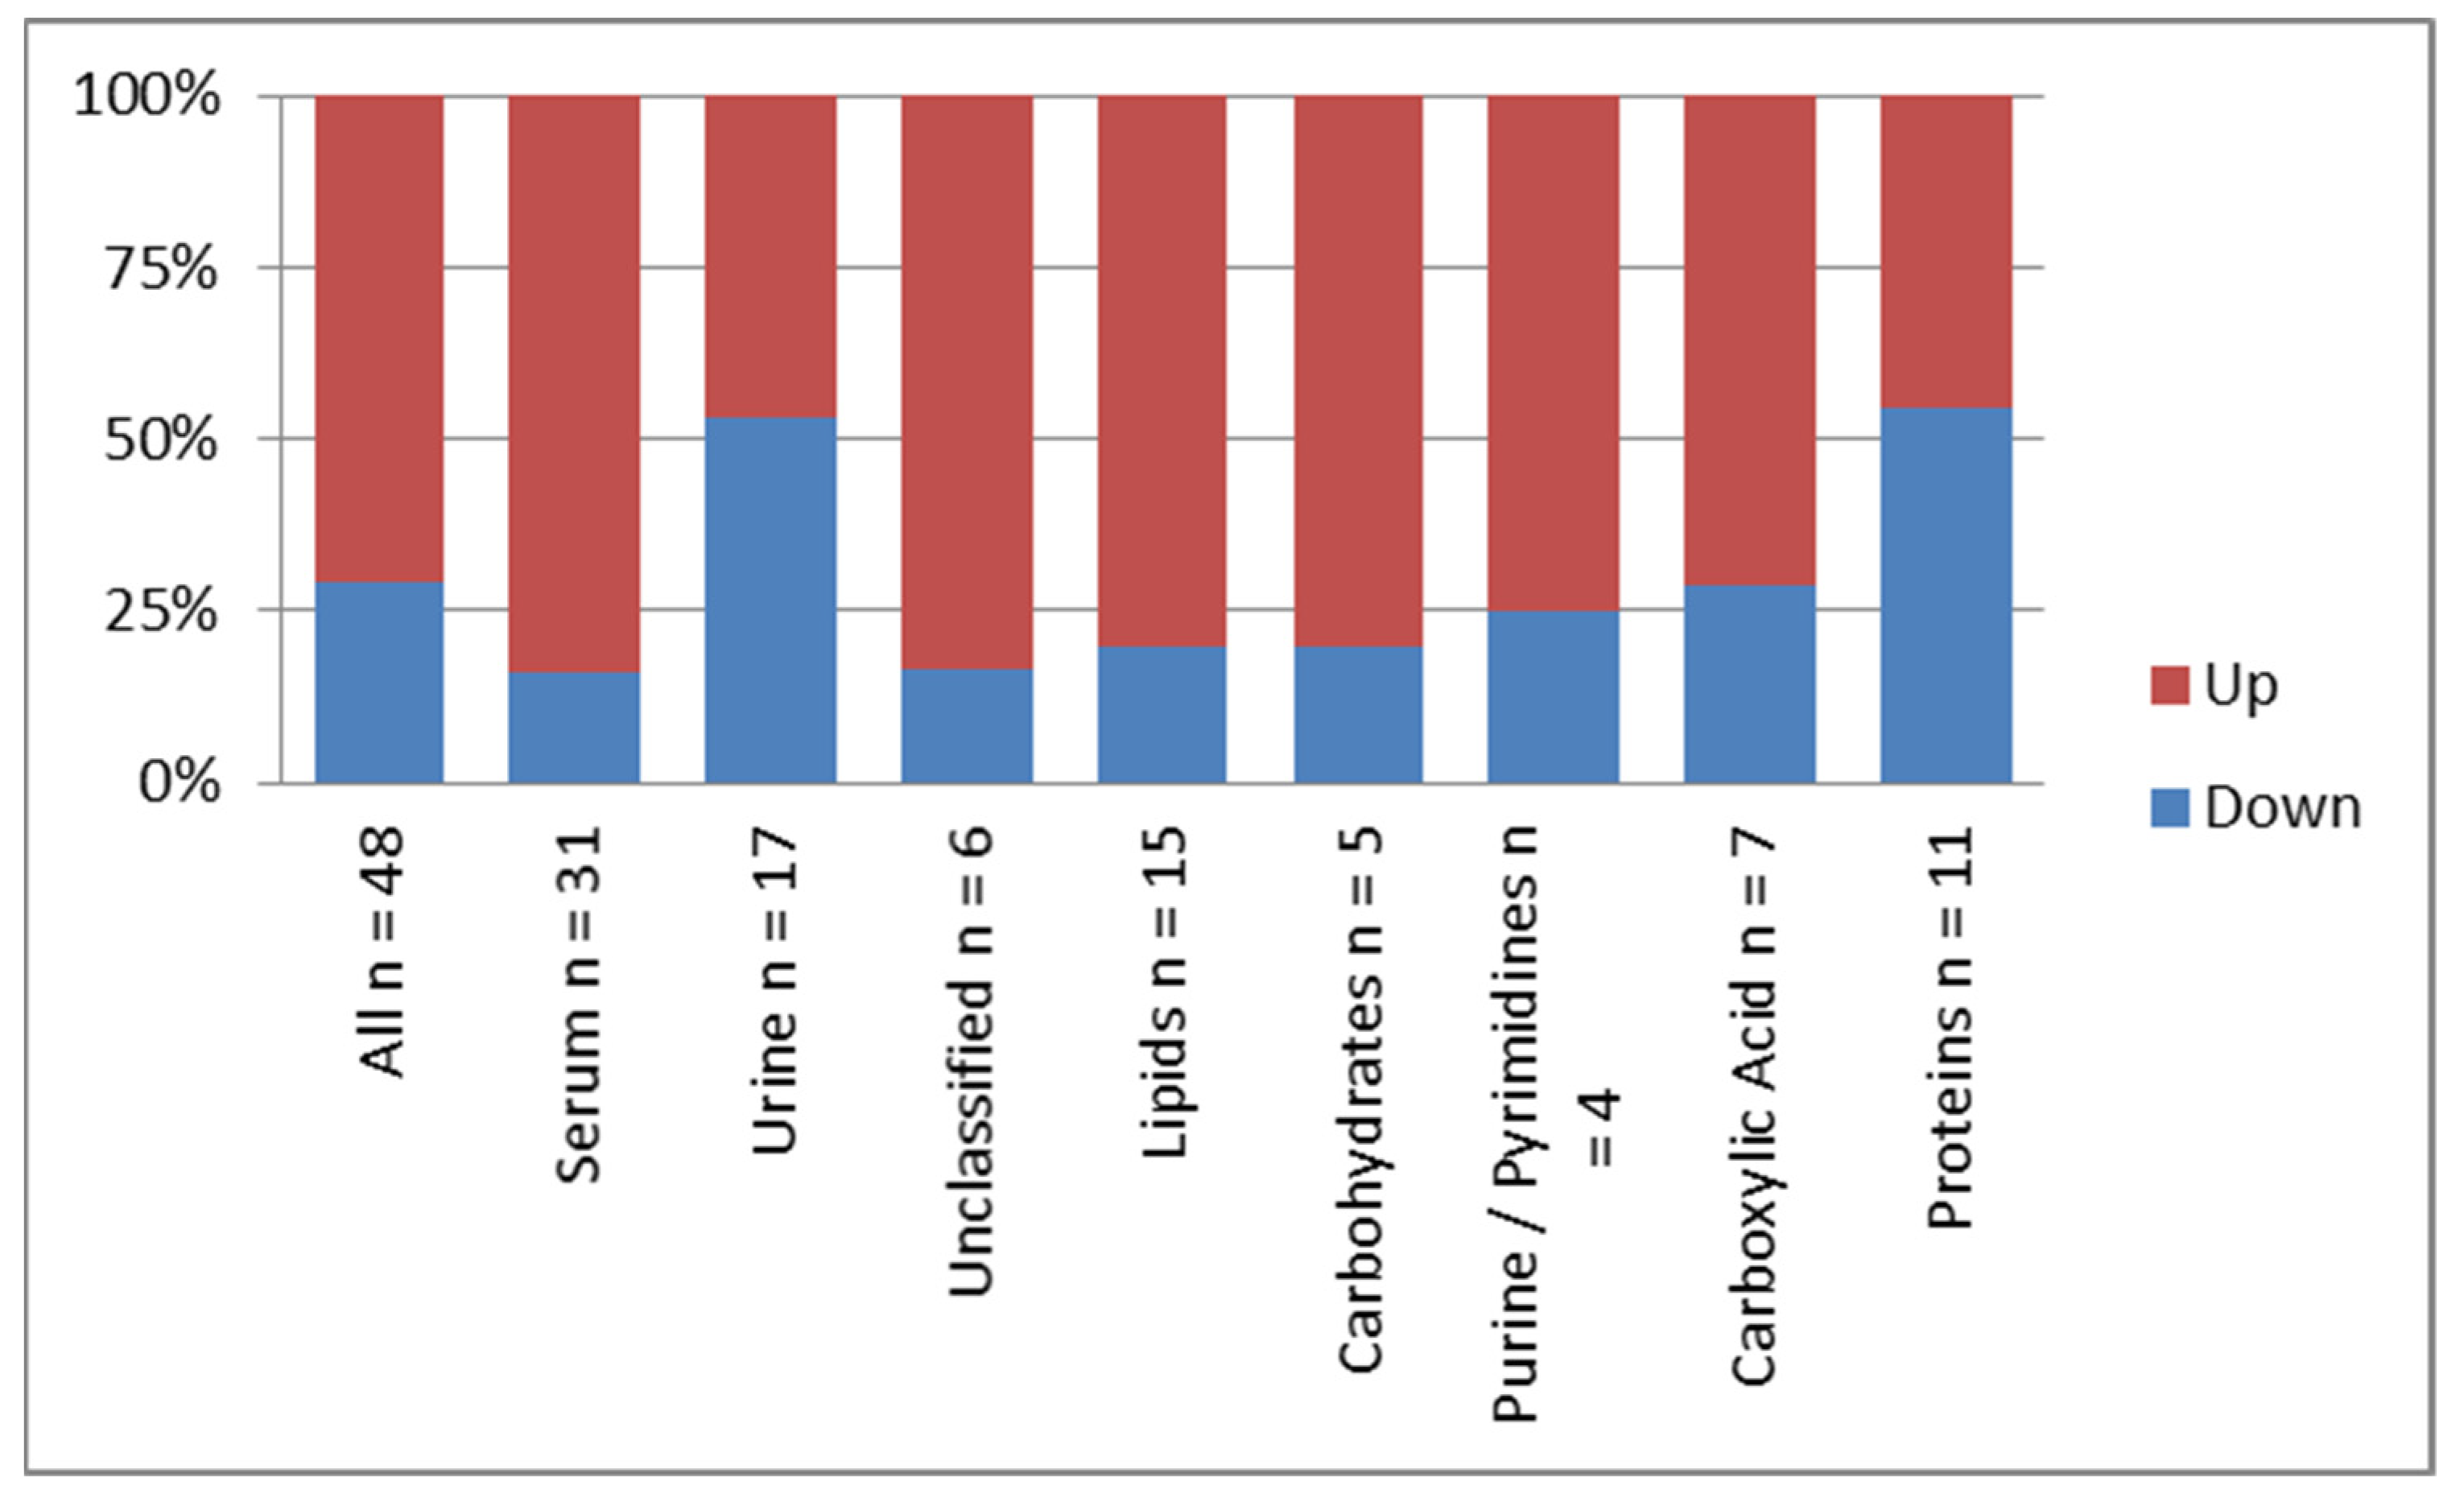
3.3. Pattern of Frequency and Distribution of the Identified Metabolites

The distribution and the frequency of the metabolites based on the biofluid, and class are presented in Table 3. There were 31 metabolites of significance in the serum samples and 17 in the urine samples that were not significantly different (p = 0.060). Lipids and their derivatives were the most frequently identified, followed by (in decreasing order of frequency) proteins and derivatives, carboxylic acid and derivatives, unclassified carbohydrates, and purines/pyrimidines.

3.4. Pattern of Dysregulation of the Identified Metabolites Post-Surgery

A higher proportion of metabolites were upregulated (n = 34) than were downregulated (n = 14) post-surgery (p = 0.0055). This ratio varied by biofluid: in serum, these proportions were 84% (26/31) upregulated and 16% (5/31) downregulated (p = 0.0002), and in urine, the proportions were similar at 46% (8/17) and 53% (9/17) up- and downregulated, respectively (p = 1). We found no significant differences in the proportion of the up- or downregulated metabolites based on chemical class (p = 0.48; see Figure 2).

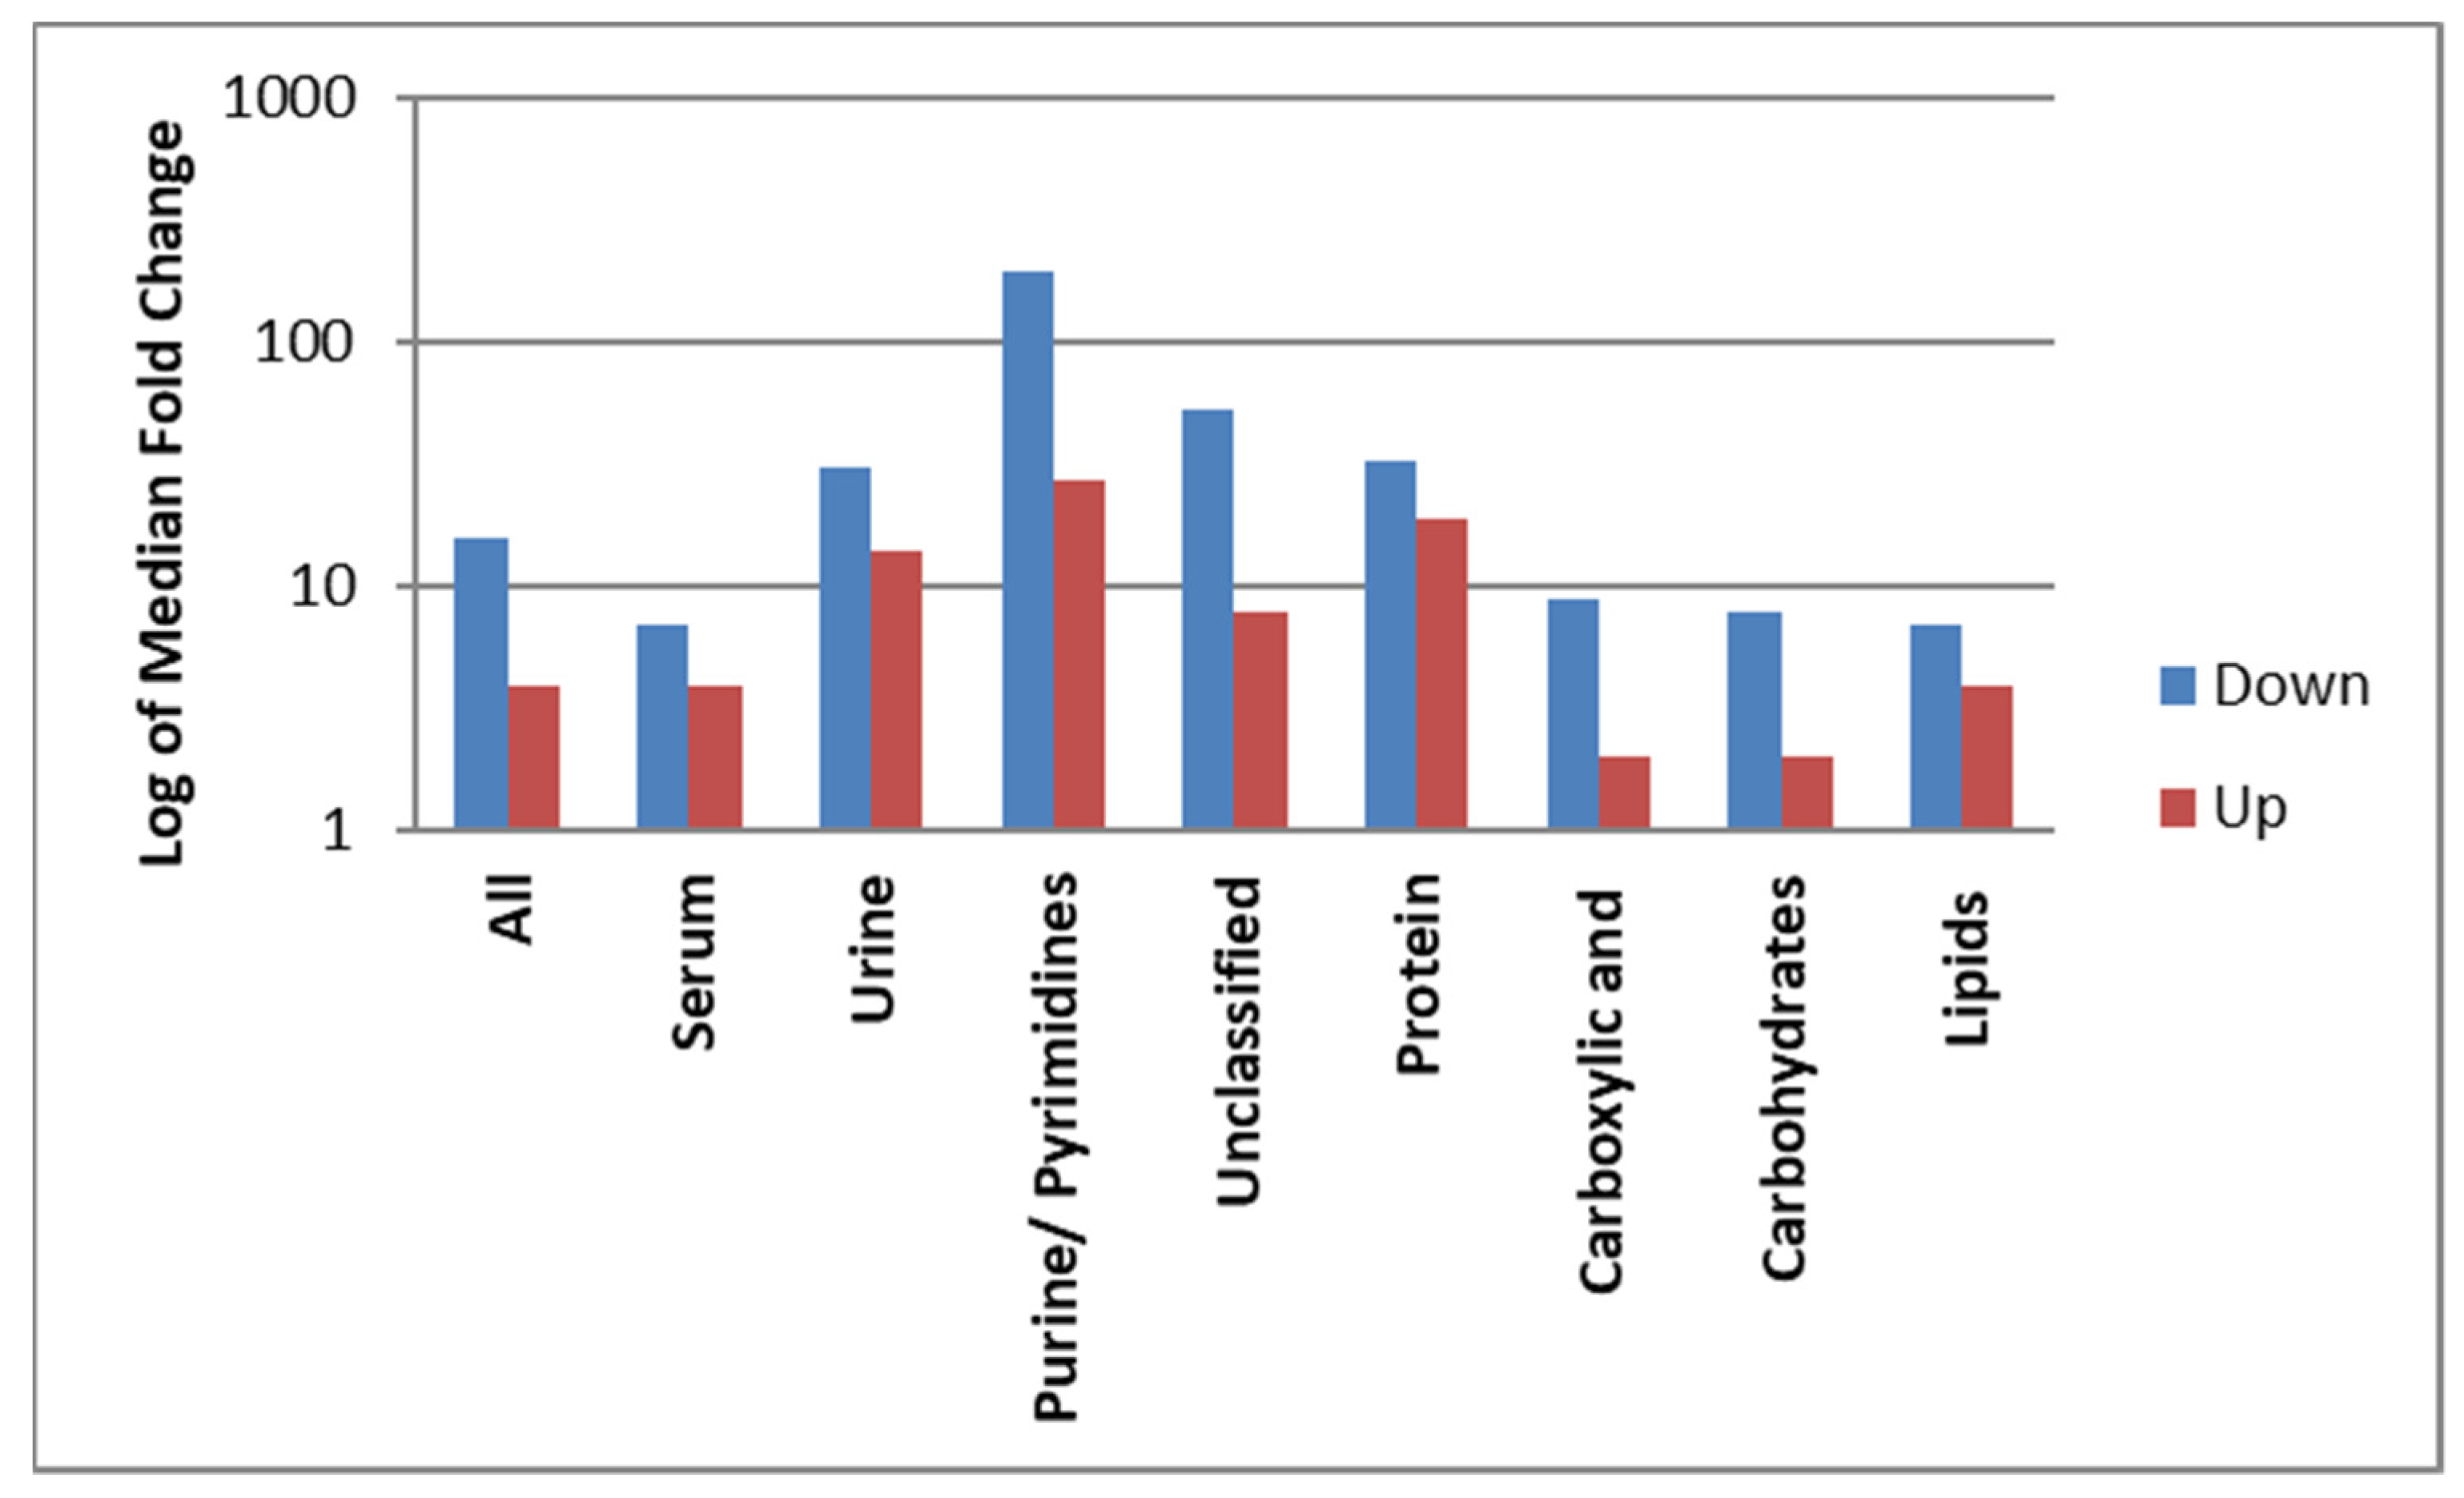
3.5. Magnitude of Dysregulation of the Identified Metabolites Post-Surgery

Median, minimum, and maximum changes in the levels of metabolites expressed as an absolute FC after surgery are presented in Table 4. The median FC was 4 and 16 for all up- and downregulated metabolites, respectively (p = 0.043). A similar pattern of dysregulation was observed when the data were grouped by biofluid but this was not significant: for the metabolites identified in the serum samples, the median FC (up- and downregulated) was 4 and 7, respectively (p = 0.69); for the metabolites identified in the urine samples, the median FC change was 14 and 31, respectively (p = 0.28). The maximum FC for upregulated metabolites in the serum and urine samples was 134 and 442, respectively. The maximum FC for downregulated metabolites in the serum and urine samples was 54 and 625, respectively. Purines/pyrimidines and proteins and derivatives had a larger dysregulation than those in the other classes of metabolites (p = 0.045 and p = 0.027, respectively). Purines/pyrimidines had the highest median FCs of 27 and 198, respectively, for up- and downregulated metabolites, followed by proteins and derivatives with median FCs of 19 and 33, respectively. The median FCs for lipids were 4 and 7 for up- and downregulated metabolites, respectively. Both carbohydrates and carboxylic acid and derivatives had a median FC of 2 for upregulated metabolites; for downregulated metabolites in these categories, the median FC was 8 for carbohydrates and 9 for carboxylic acid and derivatives. For the unclassified metabolites, the median FC was 8 and 54 for the upregulated and downregulated metabolites, respectively. These results are summarized in Figure 3.

3.6. Metabolites of Significance with >10 FC Dysregulation and Their Association with Pathogenesis of Cancer

There were 18 metabolites of significance dysregulated by >10-fold after surgery. Of these, seven were proteins and derivatives, three were purines, four were lipids, one was a carboxylic acid, one was an androgen, and two were unclassified (see Table 5). Six of these metabolites were directly associated with cancer pathogenesis based on the literature review. Leucyl proline, isopentenyladenine, fumaric acid, and asymmetric dime-thylarginine (ADMA) were identified in the urine samples and were downregulated by 625, 31, 17 and 16-fold, respectively, after surgery. N6-methyladenosine identified in the urine samples, and chenodeoxycholic/deoxycholic/glycoursodeoxycholic acid identified in the serum samples were upregulated with FCs of 27 and 28, respectively. Other metabolites of significance with FC > 100 included 3-methyl uric acid, N(alpha)-t-butoxycarbonyl-L-leucine, hypoglycin, and epinephrine without any previously direct association to cancer pathogenesis.

4. Discussion

4.1. Study Desgin and Metobolic Profile

We conducted an exploratory nontargeted metabolomics study for early-stage NSCLC patients eligible for a curative surgical resection. Two distinct aspects of our study design are (i) the patient population and (ii) the use of a radical treatment intervention to compare the metabolic profile of the same patient population, i.e., before and after the complete removal of a pulmonary cancerous lesion.
The metabolic profile obtained in this study represents a single patient population with small and localized tumors with no or minimum microscopic regional and no systemic metastasis. Surgical removal of the tumors provides a binary metabolic state in the same patient population, i.e., with and without a malignant tumor. Dysregulation of the metabolic profile was observed in the biofluids of these patients with intact pulmonary tumors, followed by a significant change in the profile after the surgical removal of the tumors. The proportion of the identified metabolites in the serum samples (65%) and the urine samples (35%) was not statistically different. However, the pattern of the dysregulation of the metabolites after surgery was distinct. A higher proportion of metabolites increased in concentration after surgery in the serum and urine samples, and in the serum samples only compared to the urine samples. In contrast, the proportion of urinary metabolites that were increased or decreased after surgery was similar. The allocated chemical class of metabolite did not influence the proportion of metabolites following a particular trajectory of dysregulation after surgery (Figure 2). The magnitude of the downregulation of the metabolites after surgery was higher in both the serum and urine samples, although this was not statistically significant; the difference was larger in the urine samples. (Table 4 and Figure 3).

4.2. Lipids and Derivatives

Among the identified classes of metabolites, lipids were the most frequently identified and included fatty acids, bile acids, carnitines, phosphatidylglycerol, phosphatidylinositol, prostaglandins, and products of the mevalonate pathway. All lipid metabolites except one were identified in the serum samples. Most lipid metabolites (80%) were upregulated after surgery with a moderate change in their profile (median FC = 4). Isopentenyladenine, the only lipid identified in the urine samples linked to the mevalonate pathway, was downregulated (median FC = 31). Based on our review of the literature, the most common lipid metabolic alterations linked to carcinogenesis are in fatty acid metabolism, arachidonic acid metabolism, cholesterol metabolism, and peroxisome proliferator-activated receptors (PPAR) signaling [25]. PPAR plays a significant role in chronic inflammatory conditions leading to cancer development [26]. The uptake, activation, and synthesis of fatty acids by tumors is facilitated through enzymes such as acetyl coenzyme A, and fatty acid synthase (FASN) [27,28]. The upregulation of FAS in early-stage lung cancer tumors has been associated with aggressive clinical behavior and a poor prognosis [29,30]. The key enzyme stearoyl coenzyme A desaturase 1 (SCD1), involved in the formation of palmitoleic and oleic acids has been implicated in adenocarcinomas of the lung in tumor initiation and invasion and is a potential target for therapeutic intervention [31]. Members of the adenosine triphosphate-binding cassette (ABC) family of proteins have been correlated with a poor response to platinum-based chemotherapy in NSLC [32]. ATP citrate lyase (ACLY), which is involved in fatty acid synthesis, has been associated with tumorigenesis and is a potential prognostic biomarker [28,33]. In the current study, 2-propylpent-3-enoic acid, a fatty acid, was upregulated in the serum samples by 50-fold post-surgery. We could not find any previous association of this metabolite to the pathogenesis of cancer. Isopentenyladenine, a product of the mevalonate pathway, decreased by 31-fold in the urine samples after surgery. The mevalonate pathway is frequently overactive in cancer cells [34] and regulates cholesterol synthesis and the formation of 3-hydroxy-3-methylgrutaryl coenzyme A (HMG-CoA). HMG-CoA is reduced to mevalonate by HMG-CoA reductase (HMGCR); HMGCR is a potential therapeutic target for cholesterol lowering drugs (such as statins) to treat cancer [34,35,36,37]. Chenodeoxycholic/deoxycholic/glycoursodeoxycholic acid, a bile acid, was upregulated by 28-fold in serum post-surgery. Bile acids have been implicated in the pathogenesis of several malignancies including colorectal, breast, hepatocellular, and renal cancers [38,39].

4.3. Proteins and Derivatives

Of the metabolites we identified, 23% were related to protein metabolism, with almost similar frequencies of up- and downregulation. However, as a class of metabolites, the overall magnitude of the alteration and the decrease in the metabolite levels after surgery was significant (Table 4, Figure 3). Cancer cells proliferate and survive by upregulating the synthesis of essential and nonessential amino acids, facilitated by specific transport systems, stromal cells, gene silencing, and redox homeostasis. Various cell signaling pathways are altered to generate nucleotides, reactive oxygen species (ROS), scavenging molecules, and oncometabolites to favor the proliferation of cancer cells [40,41,42]. We found that two metabolites identified in the urine samples, leucyl proline (Pro Leu) and ADMA, which have previously been associated with cancer pathogenesis, profoundly decreased after surgery (Table 5). Pro Leu, a dipeptide composed of L-leucine and L-proline, was downregulated by 625-fold in urine. Recent reviews have highlighted a clinically significant role for proline in cancer metabolism [43]. Through a series of reactions, proline metabolism is initiated by converting proline into pyrroline-5-carboxylate, facilitated by the enzyme proline dehydrogenase/proline oxidase (PRODH/POX). High levels of proline result in the upregulation of PRODH, which in turn results in the production of ROS. PRODH is induced by p53 and can be up- or downregulated depending upon the type of the cancer and cell environment [44]. ADMA, an amino acid, decreased by 16-fold in urine post-surgery. Higher levels of this metabolite have been found in lung cancer patients [45]. The dipeptide aspartyl glycine was downregulated by 50-fold in urine. Pre-clinical studies using cancer cell lines have indicated that glycine consumption and the mitochondrial glycine biosynthetic pathway are associated with cancer cell proliferation [46]. Glutamic acid n-butyl ester was upregulated in urine by 65-fold. Glutamic acid (glutamate) is a proteinogenic nonessential amino acid and a bioenergetic substrate for proliferating malignant cells. It is involved in tumor development as a growth factor and a signal mediator facilitated through metabotropic glutamate receptors and ionotropic glutamate receptors found in cancerous tumors [47].

4.4. Purines and Pyrimidines

Purines are the most commonly found metabolites in normal cells. They are the primary building blocks in DNA and RNA synthesis and provide the energy and cofactors needed for normal and essential cellular functions [48]. Altered purine metabolism in cancer cells is a component of proliferation, tumor immune response, invasiveness, and metastasis and has led to novel therapeutic interventions in the field of oncology such as the antipurine metabolite drugs 6-mercaptopurine, 6-thioguanine, and methotrexate [49]. In this study, the magnitude of the alteration of purines after surgery was significant (Table 4 and Figure 3). Noticeably, N6-methyladenosine was identified in urine, and was upregulated by 27-fold post-surgery. N6-methyladenosine is an endogenous methylated adenine produced by the degradation of transfer ribonucleic acid (tRNA) and found in urine [23]. This is the most commonly identified post-transcriptional modification of mRNA and is primarily a reversible process facilitated by the enzymes methyltransferase and demethylase. Recent research has revealed a critical role for N6-methyladenosine in the oncogene regulation and pathogenesis of several human cancers, including NSCLC [50,51,52,53]. Methyl uric acid, a xanthine and a purine derivative, was downregulated by 198-fold. Uric acid metabolism may have a potential role in carcinogenesis through its role both as an anti and pro oxidant [54]. In a small pilot study involving breast cancer patients, urinary methyl uric acid identified by LC-QTOF was reduced by 0.6-fold in urine compared to the patients with no cancer [55].

4.5. Carboxylic Acid Derivatives and Carbohydrates

There were seven metabolites identified as carboxylic acid or derivatives. Fumaric acid was found to be decreased by 17-fold after surgery and was detected in the urine samples. This is one of compounds of the Krebs cycle and a biproduct of succinic acid oxidation. It has been found to be significantly altered in the serum of lung cancer patients compared to healthy individuals [56,57].
The altered glucose metabolism in cancer cells has been known for the past 100 years and is based on the “Warburg effect”, which is related to the increased uptake and utilization of glucose with disproportionately increased lactate production by proliferating cancer cells in the presence of sufficient oxygen or hypoxic conditions [58]. In our study, all identified metabolites related to carbohydrates were upregulated with a relatively minimal change (median FC = 2), except beta-cortol, which was downregulated by 8-fold and found in the serum samples. Beta-cortol belongs to a group of cortisol metabolites that are O-glycosyl compounds, in which a sugar is bonded through one carbon to another group via a O-glycosidic bond [36]. An altered cortisol metabolism has been demonstrated in advanced cancers [59]. There is evidence that microcellular lung cancer produces ACTH (and hence increased cortisol levels), which could serve as potential biomarker for the early diagnosis of lung cancer [60].

4.6. Endocrine Factors

The androgens androstanediol and androstenedione were identified in the serum samples. While androstenedione was modestly elevated (FC = 8), androstanediol was downregulated by 54-fold. Androgens may have a role in the pathophysiology of lung cancer as androgen receptors have been found in lung cancer tumors. A retrospective study of NSCLC patients by Harlos et al. [61] indicated that androgen pathway manipulation was prognostic and associated with improved survival in lung cancer patients who received 5-alpha reductase inhibitors. Dopamine and epinephrine are catecholamines. Both were upregulated after surgery and identified in the serum samples. While dopamine only increased by 5-fold, epinephrine increased by 134-fold post-surgery. These compounds have opposite roles in tumor angiogenesis. Dopamine and epinephrine inhibit and promote tumor angiogenesis, respectively [62]. Tetrahydrobiopterin/sapropterin (BH4, THB) is a biopterin that was upregulated post-surgery by 8-fold. Biopterin may have a role in tumor progression [63]. N-desmethylaminopyrine, a phenyl pyrazole, increased by 10-fold in serum. We could not find any previously known association of this compound to carcinogenesis.
A summary of the metabolites of significance in this study and the associated metabolic pathways employed in carcinogenesis is presented in Table 6.

4.7. Strengths and Limitations of the Study

This study is limited by the small sample size and the large number of metabolites which were assessed. These two factors render this study underpowered for any meaningful multivariable analysis to determine the effect of clinical and pathological variables on the metabolic profile of this cohort. Nonetheless, this study is designed to address the effect of treatment intervention (i.e., surgical tumor extraction) on the patient’s metabolic profile. The pre- and post-exposure design set up each patient to serve as their own control, thus eliminating any bias introduced by comparisons between individuals. Furthermore, surgical resection in early-stage cancer patients achieves a more complete eradication of cancer compared to radiation and/or systemic (chemo) therapy. Surgery thus represents a unique intervention to compare two metabolic states in the same patient population, which may be considered “with” and “without” cancer.

5. Conclusions

We have conducted a prospective observational study in a single cohort of early-stage NSCLC patients to compare biofluid metabolomics before and after the surgical removal of pulmonary tumors. We detected a dysregulation of the primary metabolic pathways in urine and serum samples by both NMR and LC-QTOF-MS, evidenced by the changes in 31 and 17 metabolites in the serum and urine samples, respectively, obtained from 35 patients. There was no significant difference in the distribution of metabolites between the serum and urine samples, but the pattern of dysregulation was different. More metabolites were upregulated in the serum samples with a consistent pattern of dysregulation in the urinary metabolites after surgery. The chemical class of the metabolites did not influence the proportion of metabolites that were up- or downregulated. The magnitude of downregulation after surgery was higher than that of upregulation in both the serum and urine samples, and although not statistically significant, this difference was larger in the urine samples. Alteration in purines/pyrimidines and proteins and derivatives was larger than that of other classes of metabolites detected in our study, suggesting the importance of these as potential biomarkers for screening, diagnostics, or monitoring. Based on the magnitude of alteration and the previously known association to NSCLC and/or any other cancer, we identified six metabolites of significance: in both the serum and urine samples, leucyl proline, ADMA, isopentenyladenine, and fumaric acid were downregulated after surgery; N6-methyladenosine and deoxycholic acid moieties were upregulated. Four other metabolites with a significant dysregulation, FC > 100 after surgery, included 3-methyl uric acid, N(alpha)-t-butoxycarbonyl-L-leucine, hypoglycin, and epinephrine; there is no known direct association of these metabolites to cancer pathogenesis, and this is a new observation. Further studies with larger cohorts that include patients with advanced-stage lung cancer are warranted to expand on our findings and progress toward the clinical application of metabolomics in cancer diagnosis and treatment.

Author Contributions

Conceptualization, N.A., M.A., B.K.; methodology, N.A., B.K., M.A.; software, M.A.; validation, N.A. and M.A.; formal analysis, N.A., Z.N.; investigation, N.A., M.A., L.W., N.M.; resources, N.A., M.A., B.K., L.T., G.B., S.K.S., A.M., S.S.-I., G.Q.; data curation, N.A., Z.N.; original draft preparation, N.A.; manuscript review and editing, N.A., M.A., B.K., N.M., L.W.; supervision, N.A.; project administration, N.A., M.A., L.W.; funding acquisition, N.A. All authors have read and agreed to the published version of the manuscript.

Funding

This research was funded by the CancerCare Manitoba Foundation, grant number 761075015.

Institutional Review Board Statement

The study was conducted according to the guidelines of the Declaration of Helsinki and approved by the Institutional Review Board of the University of Manitoba, protocol code H2017:247, approved 31 July 2017.

Informed Consent Statement

Informed consent was obtained from all subjects involved in the study.

Data Availability Statement

Metabolite data from NMR and LC-QTOF-MS, not reported in Table 2 is available on: https://0-doi-org.brum.beds.ac.uk/10.6084/m9.figshare.14781396.v1.

Conflicts of Interest

The authors declare no conflict of interest. The funders had no role in the design of the study; in the collection, analyses, or interpretation of data; in the writing of the manuscript; or in the decision to publish the results.

References

  1. Schvartsman, G.; Ferrarotto, R.; Massarelli, E. Checkpoint inhibitors in lung cancer: Latest developments and clinical potential. Ther. Adv. Med. Oncol. 2016, 8, 460–473. [Google Scholar] [CrossRef] [PubMed] [Green Version]
  2. Barlesi, F.; Mazieres, J.; Merlio, J.-P.; Debieuvre, D.; Mosser, J.; Lena, H.; Ouafik, L.H.; Besse, B.; Rouquette, I.; Westeel, V. Routine molecular profiling of patients with advanced non-small-cell lung cancer: Results of a 1-year nationwide programme of the French Cooperative Thoracic Intergroup (IFCT). Lancet 2016, 387, 1415–1426. [Google Scholar] [CrossRef]
  3. Rosell, R.; Karachaliou, N. Large-scale screening for somatic mutations in lung cancer. Lancet 2016, 387, 1354–1356. [Google Scholar] [CrossRef]
  4. Kris, M.G.; Johnson, B.E.; Berry, L.D.; Kwiatkowski, D.J.; Iafrate, A.J.; Wistuba, I.I.; Varella-Garcia, M.; Franklin, W.A.; Aronson, S.L.; Su, P.-F. Using multiplexed assays of oncogenic drivers in lung cancers to select targeted drugs. JAMA J. Am. Med. Assoc. 2014, 311, 1998–2006. [Google Scholar] [CrossRef] [PubMed]
  5. Warburg, O. On the origin of cancer cells. Science 1956, 123, 309–314. [Google Scholar] [CrossRef] [PubMed]
  6. Vander Heiden, M.G.; Cantley, L.C.; Thompson, C.B. Understanding the Warburg effect: The metabolic requirements of cell proliferation. Science 2009, 324, 1029–1033. [Google Scholar] [CrossRef] [PubMed] [Green Version]
  7. Bamji-Stocke, S.; van Berkel, V.; Miller, D.M.; Frieboes, H.B. A review of metabolism-associated biomarkers in lung cancer diagnosis and treatment. Metabolomics 2018, 14, 81. [Google Scholar] [CrossRef]
  8. Yu, L.; Li, K.; Zhang, X. Next-generation metabolomics in lung cancer diagnosis, treatment and precision medicine: Mini review. Oncotarget 2017, 8, 115774–115786. [Google Scholar] [CrossRef] [PubMed] [Green Version]
  9. Seijo, L.M.; Peled, N.; Ajona, D.; Boeri, M.; Field, J.K.; Sozzi, G.; Pio, R.; Zulueta, J.J.; Spira, A.; Massion, P.P.; et al. Biomarkers in Lung Cancer Screening: Achievements, Promises, and Challenges. J. Thorac. Oncol. 2019, 14, 343–357. [Google Scholar] [CrossRef] [Green Version]
  10. Mathe, E.A.; Patterson, A.D.; Haznadar, M.; Manna, S.K.; Krausz, K.W.; Bowman, E.D.; Shields, P.G.; Idle, J.R.; Smith, P.B.; Anami, K.; et al. Noninvasive urinary metabolomic profiling identifies diagnostic and prognostic markers in lung cancer. Cancer Res. 2014, 74, 3259–3270. [Google Scholar] [CrossRef] [Green Version]
  11. Haznadar, M.; Cai, Q.; Krausz, K.W.; Bowman, E.D.; Margono, E.; Noro, R.; Thompson, M.D.; Mathe, E.A.; Munro, H.M.; Steinwandel, M.D.; et al. Urinary Metabolite Risk Biomarkers of Lung Cancer: A Prospective Cohort Study. Cancer Epidemiol. Prev. Biomark. 2016, 25, 978–986. [Google Scholar] [CrossRef] [PubMed] [Green Version]
  12. Ros-Mazurczyk, M.; Wojakowska, A.; Marczak, L.; Polanski, K.; Pietrowska, M.; Polanska, J.; Dziadziuszko, R.; Jassem, J.; Rzyman, W.; Widlak, P. Panel of serum metabolites discriminates cancer patients and healthy participants of lung cancer screening—A pilot study. Acta Biochim. Pol. 2017, 64, 513–518. [Google Scholar] [CrossRef]
  13. Fahrmann, J.F.; Grapov, D.; DeFelice, B.C.; Taylor, S.; Kim, K.; Kelly, K.; Wikoff, W.R.; Pass, H.; Rom, W.N.; Fiehn, O.; et al. Serum phosphatidylethanolamine levels distinguish benign from malignant solitary pulmonary nodules and represent a potential diagnostic biomarker for lung cancer. Cancer Biomark. 2016, 16, 609–617. [Google Scholar] [CrossRef] [Green Version]
  14. Cameron, S.J.; Lewis, K.E.; Beckmann, M.; Allison, G.G.; Ghosal, R.; Lewis, P.D.; Mur, L.A. The metabolomic detection of lung cancer biomarkers in sputum. Lung Cancer 2016, 94, 88–95. [Google Scholar] [CrossRef] [PubMed] [Green Version]
  15. Peralbo-Molina, A.; Calderon-Santiago, M.; Priego-Capote, F.; Jurado-Gamez, B.; Luque de Castro, M.D. Identification of metabolomics panels for potential lung cancer screening by analysis of exhaled breath condensate. J. Breath Res. 2016, 10, 026002. [Google Scholar] [CrossRef]
  16. Ahmed, N.; Bezabeh, T.; Ijare, O.B.; Myers, R.; Alomran, R.; Aliani, M.; Nugent, Z.; Banerji, S.; Kim, J.; Qing, G. Metabolic Signatures of Lung Cancer in Sputum and Exhaled Breath Condensate Detected by 1H Magnetic Resonance Spectroscopy: A Feasibility Study. Magn. Reson. Insights 2016, 9, 29. [Google Scholar] [CrossRef] [Green Version]
  17. Tang, Y.; Li, Z.; Lazar, L.; Fang, Z.; Tang, C.; Zhao, J. Metabolomics workflow for lung cancer: Discovery of biomarkers. Clin. Chim. Acta 2019, 495, 436–445. [Google Scholar] [CrossRef] [PubMed]
  18. Tee, S.-S.; Keshari, K.R. Novel approaches to imaging tumor metabolism. Cancer J. 2015, 21, 165. [Google Scholar] [CrossRef] [Green Version]
  19. García-Figueiras, R.; Baleato-González, S.; Padhani, A.R.; Oleaga, L.; Vilanova, J.C.; Luna, A.; Gómez, J.C.C. Proton magnetic resonance spectroscopy in oncology: The fingerprints of cancer? Diagn. Interv. Radiol. 2016, 22, 75. [Google Scholar] [CrossRef]
  20. Ahmed, N.; Kidane, B.; Wang, L.; Qing, G.; Tan, L.; Buduhan, G.; Srinathan, S.; Aliani, M. Non-invasive exploration of metabolic profile of lung cancer with Magnetic Resonance Spectroscopy and Mass Spectrometry. Contemp. Clin. Trials Commun. 2019, 16, 100445. [Google Scholar] [CrossRef] [PubMed]
  21. Xi, B.; Gu, H.; Baniasadi, H.; Raftery, D. Statistical analysis and modeling of mass spectrometry-based metabolomics data. In Mass Spectrometry in Metabolomics; Springer: New York, NY, USA, 2014; pp. 333–353. [Google Scholar]
  22. Smith, C.A.; O’Maille, G.; Want, E.J.; Qin, C.; Trauger, S.A.; Brandon, T.R.; Custodio, D.E.; Abagyan, R.; Siuzdak, G. METLIN: A metabolite mass spectral database. Ther. Drug Monit. 2005, 27, 747–751. [Google Scholar] [CrossRef]
  23. Wishart, D.S.; Feunang, Y.D.; Marcu, A.; Guo, A.C.; Liang, K.; Vázquez-Fresno, R.; Sajed, T.; Johnson, D.; Li, C.; Karu, N. HMDB 4.0: The human metabolome database for 2018. Nucleic Acids Res. 2018, 46, D608–D617. [Google Scholar] [CrossRef]
  24. Sayers, E.W.; Barrett, T.; Benson, D.A.; Bolton, E.; Bryant, S.H.; Canese, K.; Chetvernin, V.; Church, D.M.; DiCuccio, M.; Federhen, S. Database resources of the national center for biotechnology information. Nucleic Acids Res. 2010, 39, D38–D51. [Google Scholar] [CrossRef] [Green Version]
  25. Hao, Y.; Li, D.; Xu, Y.; Ouyang, J.; Wang, Y.; Zhang, Y.; Li, B.; Xie, L.; Qin, G. Investigation of lipid metabolism dysregulation and the effects on immune microenvironments in pan-cancer using multiple omics data. BMC Bioinform. 2019, 20, 29–39. [Google Scholar] [CrossRef] [Green Version]
  26. Liu, Y.; Colby, J.K.; Zuo, X.; Jaoude, J.; Wei, D.; Shureiqi, I. The role of PPAR-δ in metabolism, inflammation, and cancer: Many characters of a critical transcription factor. Int. J. Mol. Sci. 2018, 19, 3339. [Google Scholar] [CrossRef] [Green Version]
  27. Röhrig, F.; Schulze, A. The multifaceted roles of fatty acid synthesis in cancer. Nat. Rev. Cancer 2016, 16, 732. [Google Scholar] [CrossRef] [PubMed]
  28. Salvador, M.M.; de Cedrón, M.G.; Rubio, J.M.; Martínez, S.F.; Martínez, R.S.; Casado, E.; de Molina, A.R.; Sereno, M. Lipid metabolism and lung cancer. Crit. Rev. Oncol. Hematol. 2017, 112, 31–40. [Google Scholar] [CrossRef] [PubMed]
  29. Visca, P.; Sebastiani, V.; Botti, C.; Diodoro, M.G.; Lasagni, R.P.; Romagnoli, F.; Brenna, A.; De Joannon, B.C.; Donnorso, R.P.; Lombardi, G. Fatty acid synthase (FAS) is a marker of increased risk of recurrence in lung carcinoma. Anticancer Res. 2004, 24, 4169–4174. [Google Scholar] [PubMed]
  30. Wang, Y.; Zhang, X.; Tan, W.; Fu, J.; Zhang, W. Significance of fatty acid synthase expression in non-small cell lung cancer. Zhonghua Zhong Liu Za Zhi Chin. J. Oncol. 2002, 24, 271–273. [Google Scholar]
  31. Huang, J.; Fan, X.-X.; He, J.; Pan, H.; Li, R.-Z.; Huang, L.; Jiang, Z.; Yao, X.-J.; Liu, L.; Leung, E.L.-H. SCD1 is associated with tumor promotion, late stage and poor survival in lung adenocarcinoma. Oncotarget 2016, 7, 39970. [Google Scholar] [CrossRef] [Green Version]
  32. Yoh, K.; Ishii, G.; Yokose, T.; Minegishi, Y.; Tsuta, K.; Goto, K.; Nishiwaki, Y.; Kodama, T.; Suga, M.; Ochiai, A. Breast cancer resistance protein impacts clinical outcome in platinum-based chemotherapy for advanced non-small cell lung cancer. Clin. Cancer Res. 2004, 10, 1691–1697. [Google Scholar] [CrossRef] [Green Version]
  33. Butler, L.; Perone, Y.; Dehairs, J.; Lupien, L.E.; de Laat, V.; Talebi, A.; Loda, M.; Kinlaw, W.B.; Swinnen, J.V. Lipids and cancer: Emerging roles in pathogenesis, diagnosis and therapeutic intervention. Adv. Drug Deliv. Rev. 2020. [Google Scholar] [CrossRef]
  34. Thurnher, M.; Gruenbacher, G.; Nussbaumer, O. Regulation of mevalonate metabolism in cancer and immune cells. Biochim. Biophys. Acta BBA Mol. Cell Biol. Lipids 2013, 1831, 1009–1015. [Google Scholar] [CrossRef]
  35. Fiala, O.; Pesek, M.; Finek, J.; Minarik, M.; Benesova, L.; Bortlicek, Z.; Topolcan, O. Statins augment efficacy of EGFR-TKIs in patients with advanced-stage non-small cell lung cancer harbouring KRAS mutation. Tumor Biol. 2015, 36, 5801–5805. [Google Scholar] [CrossRef] [PubMed]
  36. Göbel, A.; Rauner, M.; Hofbauer, L.C.; Rachner, T.D. Cholesterol and beyond-the role of the mevalonate pathway in cancer biology. Biochim. Biophys. Acta BBA Rev. Cancer 2020, 1873, 188351. [Google Scholar] [CrossRef] [PubMed]
  37. Hassanabad, A.F.; Mina, F. Targeting the Mevalonate Pathway for Treating Lung Cancer. Am. J. Clin. Oncol. 2020, 43, 69–70. [Google Scholar] [CrossRef] [PubMed]
  38. Debruyne, P.R.; Bruyneel, E.A.; Li, X.; Zimber, A.; Gespach, C.; Mareel, M.M. The role of bile acids in carcinogenesis. Mutat. Res. Fundam. Mol. Mech. Mutagenesis 2001, 480, 359–369. [Google Scholar] [CrossRef]
  39. Di Ciaula, A.; Wang, D.Q.-H.; Molina-Molina, E.; Baccetto, R.L.; Calamita, G.; Palmieri, V.O.; Portincasa, P. Bile acids and cancer: Direct and environmental-dependent effects. Ann. Hepatol. 2017, 16, S87–S105. [Google Scholar] [CrossRef]
  40. Muhammad, N.; Lee, H.M.; Kim, J. Oncology therapeutics targeting the metabolism of amino acids. Cells 2020, 9, 1904. [Google Scholar] [CrossRef]
  41. Vettore, L.; Westbrook, R.L.; Tennant, D.A. New aspects of amino acid metabolism in cancer. Br. J. Cancer 2020, 122, 150–156. [Google Scholar] [CrossRef]
  42. Lieu, E.L.; Nguyen, T.; Rhyne, S.; Kim, J. Amino acids in cancer. Exp. Mol. Med. 2020, 52, 15–30. [Google Scholar] [CrossRef]
  43. Phang, J.M. Proline metabolism in cell regulation and cancer biology: Recent advances and hypotheses. Antioxid. Redox Signal. 2019, 30, 635–649. [Google Scholar] [CrossRef] [Green Version]
  44. D’aniello, C.; Patriarca, E.J.; Phang, J.M.; Minchiotti, G. Proline metabolism in tumor growth and metastatic progression. Front. Oncol. 2020, 10, 776. [Google Scholar] [CrossRef]
  45. Bayraktutan, Z.; Kiziltunc, A.; Bakan, E.; Alp, H.H. Determination of Endothelial Nitric Oxide Synthase Gene Polymorphism and Plasma Asymmetric Dimethyl Arginine Concentrations in Patients with Lung Cancer. Eurasian J. Med. 2020, 52, 185. [Google Scholar] [CrossRef] [PubMed]
  46. Jain, M.; Nilsson, R.; Sharma, S.; Madhusudhan, N.; Kitami, T.; Souza, A.L.; Kafri, R.; Kirschner, M.W.; Clish, C.B.; Mootha, V.K. Metabolite profiling identifies a key role for glycine in rapid cancer cell proliferation. Science 2012, 336, 1040–1044. [Google Scholar] [CrossRef] [PubMed] [Green Version]
  47. Stepulak, A.; Rola, R.; Polberg, K.; Ikonomidou, C. Glutamate and its receptors in cancer. J. Neural Transm. 2014, 121, 933–944. [Google Scholar] [CrossRef] [PubMed] [Green Version]
  48. Pedley, A.M.; Benkovic, S.J. A new view into the regulation of purine metabolism: The purinosome. Trends Biochem. Sci. 2017, 42, 141–154. [Google Scholar] [CrossRef] [Green Version]
  49. Yin, J.; Ren, W.; Huang, X.; Deng, J.; Li, T.; Yin, Y. Potential mechanisms connecting purine metabolism and cancer therapy. Front. Immunol. 2018, 9, 1697. [Google Scholar] [CrossRef] [PubMed] [Green Version]
  50. Deng, X.; Su, R.; Feng, X.; Wei, M.; Chen, J. Role of N6-methyladenosine modification in cancer. Curr. Opin. Genet. Dev. 2018, 48, 1–7. [Google Scholar] [CrossRef]
  51. He, L.; Li, H.; Wu, A.; Peng, Y.; Shu, G.; Yin, G. Functions of N6-methyladenosine and its role in cancer. Mol. Cancer 2019, 18, 1–15. [Google Scholar] [CrossRef] [Green Version]
  52. Zhu, Z.; Qian, Q.; Zhao, X.; Ma, L.; Chen, P. N6-methyladenosine ALKBH5 promotes non-small cell lung cancer progress by regulating TIMP3 stability. Gene 2020, 731, 144348. [Google Scholar] [CrossRef]
  53. Xu, R.; Pang, G.; Zhao, Q.; Yang, L.; Chen, S.; Jiang, L.; Shen, Y.; Shao, W. The momentous role of N6-methyladenosine in lung cancer. J. Cell. Physiol. 2020, 236, 3244–3256. [Google Scholar] [CrossRef]
  54. Yiu, A.; Van Hemelrijck, M.; Garmo, H.; Holmberg, L.; Malmström, H.; Lambe, M.; Hammar, N.; Walldius, G.; Jungner, I.; Wulaningsih, W. Circulating uric acid levels and subsequent development of cancer in 493,281 individuals: Findings from the AMORIS Study. Oncotarget 2017, 8, 42332. [Google Scholar] [CrossRef] [Green Version]
  55. Park, J.; Shin, Y.; Kim, T.H.; Kim, D.-H.; Lee, A. Urinary Metabolites as Biomarkers for Diagnosis of Breast Cancer: A Preliminary Study. J. Breast Dis. 2019, 7, 44–51. [Google Scholar] [CrossRef]
  56. Zhang, L.; Zheng, J.; Ahmed, R.; Huang, G.; Reid, J.; Mandal, R.; Maksymuik, A.; Sitar, D.S.; Tappia, P.S.; Ramjiawan, B. A high-performing plasma metabolite panel for early-stage lung cancer detection. Cancers 2020, 12, 622. [Google Scholar] [CrossRef] [Green Version]
  57. Hori, S.; Nishiumi, S.; Kobayashi, K.; Shinohara, M.; Hatakeyama, Y.; Kotani, Y.; Hatano, N.; Maniwa, Y.; Nishio, W.; Bamba, T. A metabolomic approach to lung cancer. Lung Cancer 2011, 74, 284–292. [Google Scholar] [CrossRef]
  58. Bose, S.; Le, A. Glucose metabolism in cancer. Heterog. Cancer Metab. 2018, 1063, 3–12. [Google Scholar]
  59. Werk, E.E., Jr.; MacGee, J.; Sholiton, L.J. Altered cortisol metabolism in advanced cancer and other terminal illnesses: Excretion of 6-hydroxycortisol. Metabolism 1964, 13, 1425–1438. [Google Scholar] [CrossRef]
  60. Milosevic, I. Immunofluorometrical Exploring of FSH Levels in the Serum of Patients with Histologically Verified Macrocellular Lung Cancer. Clin. Immunol. 2007, S50–S51. [Google Scholar] [CrossRef]
  61. Harlos, C.; Musto, G.; Lambert, P.; Ahmed, R.; Pitz, M.W. Androgen pathway manipulation and survival in patients with lung cancer. Horm. Cancer 2015, 6, 120–127. [Google Scholar] [CrossRef] [PubMed]
  62. Chakroborty, D.; Sarkar, C.; Basu, B.; Dasgupta, P.S.; Basu, S. Catecholamines regulate tumor angiogenesis. Cancer Res. 2009, 69, 3727–3730. [Google Scholar] [CrossRef] [PubMed] [Green Version]
  63. Rabender, C.; Alam, A.; Waters, M.; Mikkelsen, R. Biopterin metabolism drives tumor progression. Cancer Res. 2015, 75. [Google Scholar] [CrossRef]
Figure 1. Patient enrollment and biofluid collection.
Cancers 13 03012 g001
Figure 2. Pattern of regulation of identified metabolites based on biofluid and class of metabolites.
Cancers 13 03012 g002
Figure 3. Magnitude of dysregulation. The magnitude of the downregulation of the metabolites after surgery was higher in both the serum and urine samples (p = 0.043); although this was not statistically significant, the difference was larger in the urine samples (p = 0.28) than the serum samples only (p = 0.69). The alteration in purines/pyrimidines (p = 0.045) and protein and derivatives (p = 0.027) was larger than those in the other classes of metabolites.
Cancers 13 03012 g003
Table 1. Clinical characteristics of the patient cohort.
CharacteristicsTotal (n = 35)Urine (n = 29)Serum (n = 32)
Age Mean (SD) in years64.7 (7.4) (n = 34)63.8 (7.0) (n = 28)64.6 (7.5) (n = 31)
Females63% (22)62% (18)62% (20)
Males37% (13)38% (11)38% (12)
Smoker34% (10)36% (10)35% (9)
Ex-Smoker52% (15)50% (14)50% (13)
Never Smoked 14% (4)14% (4)15% (4)
Diabetes17% (6)10% (3)19% (6)
COPD49% (17)48% (14)50% (16)
Previous cancers29% (10)31% (9)28% (9)
On steroids oral/inhalers0%0%0%
Squamous cell carcinoma14% (5)14% (4)16% (5)
Adenocarcinoma80% (28)79% (23)81% (26)
Other6% (2)7% (2)3% (1)
Right Upper Lobe 29% (10)31% (9)25% (8)
Right Lower Lobe20% (7)17% (5)22% (7)
Left Upper Lobe31% (11)34% (10)31% (10)
Left Lower Lobe19% (7)17% (5)22% (7)
PET before surgery86% (30)86% (25)84% (27)
Type of surgery:
Wedge Resection/Segmentectomy40% (14)38% (11)41% (13)
Lobectomy51% (18)55% (16)50% (16)
Pneumonectomy3% (1)3% (1)3% (1)
Wedge and Lobectomy6% (2)3% (1)6% (2)
Pathological Stage (n = 34) n = 28n = 31
T1-T2, N0 M079% (27)75% (21)77% (24)
T3-T4, N0 M09% (3)11% (3)10% (3)
T1-T4, N1-2 M012% (4)14% (4)13% (4)
Mean Tumor size based on CT scan before surgical resection Mean (SD) in cm2.4 (1.6) (n = 35)2.5 (1.7) (n = 29)2.5 (1.7) (n = 32)
Mean Tumor size base on surgical pathology Mean (SD) in cm2.7 (1.9) (n = 34)2.8 (2.0) (n = 28)2.8 (1.9) (n = 31)
Mean Maximum PET_SUV Mean (SD) 8.2 (6.5) (n = 30)8.2 (6.9) (n = 25)8.1 (6.7) (n = 27)
PDL1: <1% (10/23)43%47% (9/19)45% (10/22)
PDL1: 1–49% (9/23)39%42% (8/19)41% (9/22)
PDL1: >50% (4/23)17%11% (2/19)14% (3/22)
ALK: Negative (n = 23)100%100% (n = 20)100% (n = 22)
Notes: TNM Staging per AJCC, TNM 6th edition. COPD, chronic obstructive airway disease; SD, standard deviation.
Table 2. Classification of altered metabolites of significance.
CompoundFormulam/zPolarityFCp Value RegClassBiofluidPlatform
Lipids and Derivatives
2-Propylpent-3-enoic acidC8H14O2160.1328+50<0.0001upFatty AcidSerumQTOF
13,14-Dihydro PGE1/Prostaglandin F1aC20H36O5713.493+50.047upProstaglandins SerumQTOF
2-HexenoylcarnitineC13H23NO4258.1654+160.013upAcyl CarnitinesSerumQTOF
2-OctenoylcarnitineC15H27NO4286.2013+30.026upAcyl CarnitinesSerumQTOF
Chenodeoxycholic/
Deoxycholic acid glycine conjugate/
Glycoursodeoxycholic acid
C26H43NO5450.3208+280.0005upBile AcidSerumQTOF
Cholic acidC24H40O5426.3246 ^+40.026downBile AcidSerumQTOF
cis-5-TetradecenoylcarnitineC21H39NO4370.2948+40.033upAcyl CarnitinesSerumQTOF
DecanoylcarnitineC17H33NO43,162,481+20.0001upAcyl CarnitinesSerumQTOF
DodecanoylcarnitineC19H38NO4344.2792+60.0009upAcyl CarnitinesSerumQTOF
IsopentenyladenineC16H23N5O5204.1242+310.0001downMevalonate PathwayUrineQTOF
L-CarnitineC7H15NO3162.1124+3<0.0001upCarnitines (Lipid Metabolism)SerumQTOF
L-OctanoylcarnitineC15H29NO4288.2166+20.0008upacyl carnitinesSerumQTOF
LysoPC(P-18:1)C26H52NO7P522.3552+30.026upFatty AcidSerumQTOF
PG(18:1/18:2)C42H77O10P773.536+60.0087upphosphatidyl glycerols SerumQTOF
PI(16:0/18:1)C43H81O13P854.5691 ^+70.0002downphosphatidy linositolsSerumQTOF
Proteins and Derivatives
4-Guanidinobutanoic acidC5H11N3O2163.1156 ^+40.029upamino acid (Gamma) SerumQTOF
Aspartyl glycine C8H13N3O6248.0938+500.0006downdipeptideUrineQTOF
Asymmetric dimethylarginine (ADMA)C8H18N4O2203.1505+160.044downamino acid UrineQTOF
HypoglycinC7H11NO2142.0875+442<0.0001upamino acid UrineQTOF
IsodesmosineC24H40N5O8527.296+190.043upamino acid SerumQTOF
L-Glutamic acid n-butyl
ester
C9H17NO4204.1233+650.0009upamino acid UrineQTOF
L-Isoleucyl-L-prolineC11H20N2O3229.152+20.0005updipeptideSerumQTOF
N(alpha)-t-Butoxycarbonyl-L-leucineC11H21NO4232.1547+161<0.0001downamino acid UrineQTOF
Pro LeuC11H20N2O3229.1548+625<0.0001downdipeptideUrineQTOF
SerineC3H7NO3 10.030downamino acid SerumNMR
Carbohydrates
MyoinositolC6H12O6203.0524 *20.0002upCarbohydrateSerumQTOF
GlyceraldehydeC3H6O3203.0524 *20.0001upCarbohydrateSerumQTOF
GlucoseC6H12O6 20.0499upCarbohydrateUrineNMR
LactateC3H5O3203.0524 *20.013upGlycolysis ProductUrineNMR
Beta-Cortol 80.013downCarbohydrateSerumQTOF
Purine/Pyrimidines
1-MethyladenineC6H7N5321.1307 *+59<0.0001upPurineUrineQTOF
3-Methyluric acidC6H6N4O3183.0515+198<0.0001downPurine UrineQTOF
5-Acetylamino-6-formylamino-3-methyluracilC8H10N4O4249.0608 *+30.029upHydroxypyrimidineSerumQTOF
N6-MethyladenosineC11H15N5O4282.1199+270.0085uppurine nucleosideUrineQTOF
Carboxylic acid and Derivatives
cis-AconitateC6H6O6 10.035upcarboxylic acidUrineNMR
MalonateC3H3O4 20.014upcarboxylic acidUrineNMR
4-Hydroxycyclohexylcarboxylic acidC7H12O3162.1126 ^+3<0.0001upcarboxylic acidSerumQTOF
Fumaric acidC4H4O4139.0026+170.011downcarboxylic acidUrineQTOF
Guanidinosuccinic acidC5H9N3O4176.0654+30.023upcarboxylic acid (aspartic acid)SerumQTOF
Proline betaineC7H14NO2144.1014+20.024upcarboxylic acid (proline derivative)SerumQTOF
SuccinateC4H6O4 20.046downcarboxylic acid UrineNMR
Unclassified
AndrostanediolC19H32O2623.4382 $+54<0.0001downAndrogensSerumQTOF
DopamineC8H11NO2154.0823+5<0.0001upcatecholamine SerumQTOF
EpinephrineC9H13NO3184.0944+134<0.0001upcatecholamine SerumQTOF
AndrostenedioneC19H26O2287.2041+80.023upAndrogens SerumQTOF
Tetrahydrobiopterin/Sapropterin (BH4, THB)C9H15N5O3500.2767 ǂ+80.0031upBiopterinSerumQTOF
N-DesmethylaminopyrineC12H15N3O218.1378+100.0003upphenylpyrazolesSerumQTOF
Notes: * Na adduct; ^ NH4+ adduct; $ [2M + K]+; ǂ [2M + NH4]+.
Table 3. Categorization of the metabolites based on biofluid and their chemical class.
Source or Class of MetabolitesFrequency n (%)
All 48 (100)
Serum31 (65)
Urine17 (35)
Lipids and Derivatives15 (31)
Protein and Derivatives11(23)
Carboxylic Acid and Derivatives7 (15)
Unclassified6 (13)
Carbohydrates5 (10)
Purine/Pyrimidines4 (8)
Table 4. Fold change (FC) in metabolites post-surgery based on biofluid and chemical class.
Class of MetabolitesUpregulatedDownregulatedp Value
NMed
FC
Min
FC
Max
FC
nMed
FC
Min
FC
Max
FC
All3441442141616250.043
Biofluid
Serum2642134571540.69
Urine814144293126250.28
Class
Lipids and derivatives12425037431
Proteins and derivatives51924426331625
Carbohydrates422218
Purine/Pyrimidines3273591198
Carboxylic acid and derivatives521329217
Unclassified585134154
Notes: Upregulated indicates that the metabolite level increased post-surgery. Downregulated indicates that the metabolite level decreased post-surgery. n, number of metabolites; Max, maximum; Med, median; Min, minimum.
Table 5. Metabolites of significance (FC > 10).
ClassBiofluidMetaboliteRegulationFold ChangePreviously Known Association to Cancer Pathogenesis
Protein and DerivativesUrinePro Leudown625Yes
Purine/PyrimidinesUrine3-Methyluric aciddown198Yes
Protein and Derivatives UrineN(alpha)-t-Butoxycarbonyl-L-leucinedown161No
AndrogensSerumAndrostanedioldown54Yes
Protein and Derivatives UrineAspartyl glycinedown50Yes
Lipid and DerivativesUrineIsopentenyladeninedown31Yes
Carboxylic Acid and Derivatives UrineFumaric aciddown17Yes
Protein and DerivativesUrineAsymmetric dimethylarginine (ADMA)down16Yes
Protein and DerivativesUrineHypoglycinup442No
UnclassifiedSerumEpinephrineup134Yes
Protein and DerivativesUrineL-Glutamic acid n-butyl esterup65Yes
Purine/PyrimidinesUrine1-Methyladenineup59No
Lipid and DerivativesSerum2-Propylpent-3-enoic acidup50No
Lipid and DerivativeSerumChenodeoxycholic/Deoxycholic/
Glycoursodeoxycholic acid
up28Yes
Purine/PyrimidinesUrineN6-Methyladenosineup27Yes
Protein and DerivativeSerumIsodesmosineup19No
Lipid and DerivativeSerum2-Hexenoylcarnitineup16Possible
UnclassifiedSerumN-Desmethylaminopyrineup10.3No
Notes: Based on the magnitude of alteration of the metabolites (>10 fold) after surgery and previously known association to NSCLC and or any other cancer, six metabolites of significance have been identified marked in bold.
Table 6. Metabolites of significance and the associated metabolic pathways.
MetaboliteRegulationMetabolic Pathway
Pro LeudownProline metabolism facilitated by PRODH/POX
3-Methyluric aciddownPurine Metabolism
AndrostanedioldownAndrogen pathway through AR in NSCLC
Aspartyl glycinedownMitochondrial glycine biosynthetic pathway
IsopentenyladeninedownMevalonate pathway
Fumaric aciddownKrebs cycle
Asymmetric dimethylarginine (ADMA)downOverexpression of protein arginine methyl transferase
EpinephrineupAngiogenesis
2-Propylpent-3-enoic acidupFatty acid metabolism
L-Glutamic acid n-butyl esterupGrowth factor, metabotropic/ionotropic glutamate receptors
Chenodeoxycholic/Deoxycholic/
Glycoursodeoxycholic acid
upOver expressed FXR
N6-MethyladenosineupDegradation of tRNA
Notes: AR, androgen receptors; FXR, farnesoid X receptor; NSCLC, non–small cell lung cancer; PRODH/POX, proline dehydrogenase/proline oxidase; tRNA, transfer ribonucleic acid.
Publisher’s Note: MDPI stays neutral with regard to jurisdictional claims in published maps and institutional affiliations.

