
ERAS, a Member of the Ras Superfamily, Acts as an Oncoprotein in the Mammary Gland

 , , and
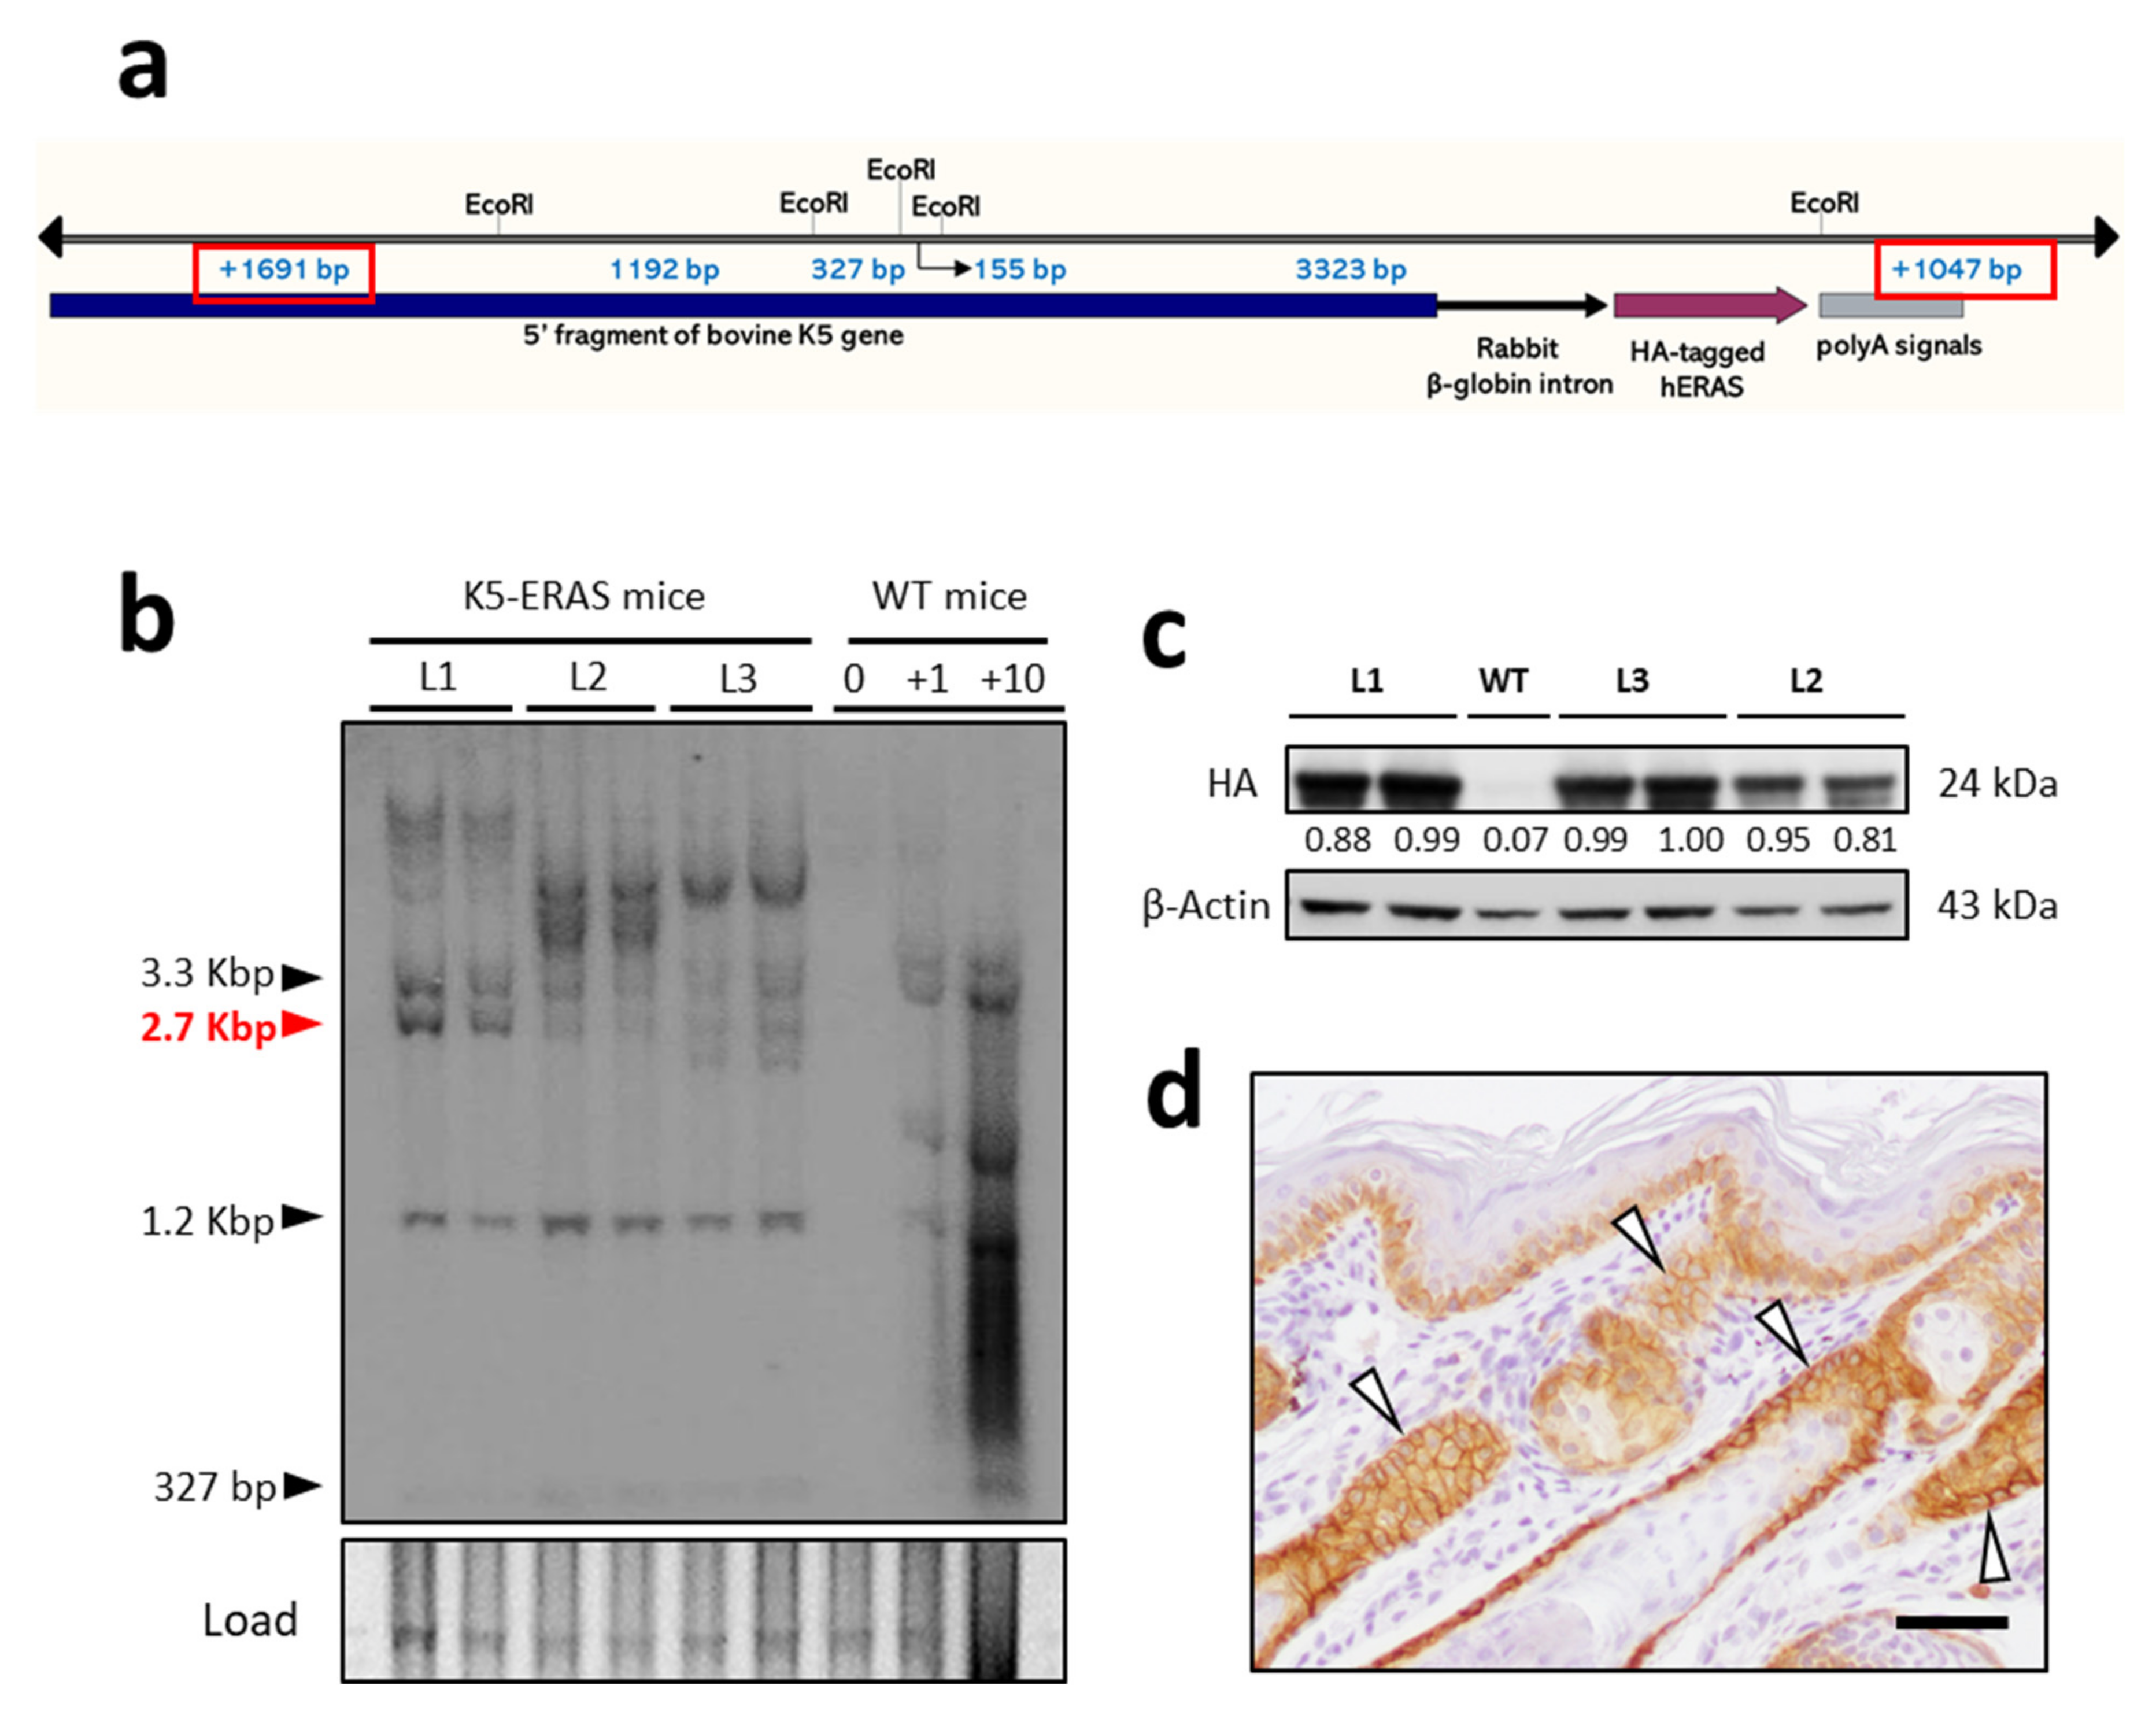
Abstract
:Simple Summary
Abstract
1. Introduction
2. Materials and Methods
2.1. Mice, Genotyping and Southern Blot
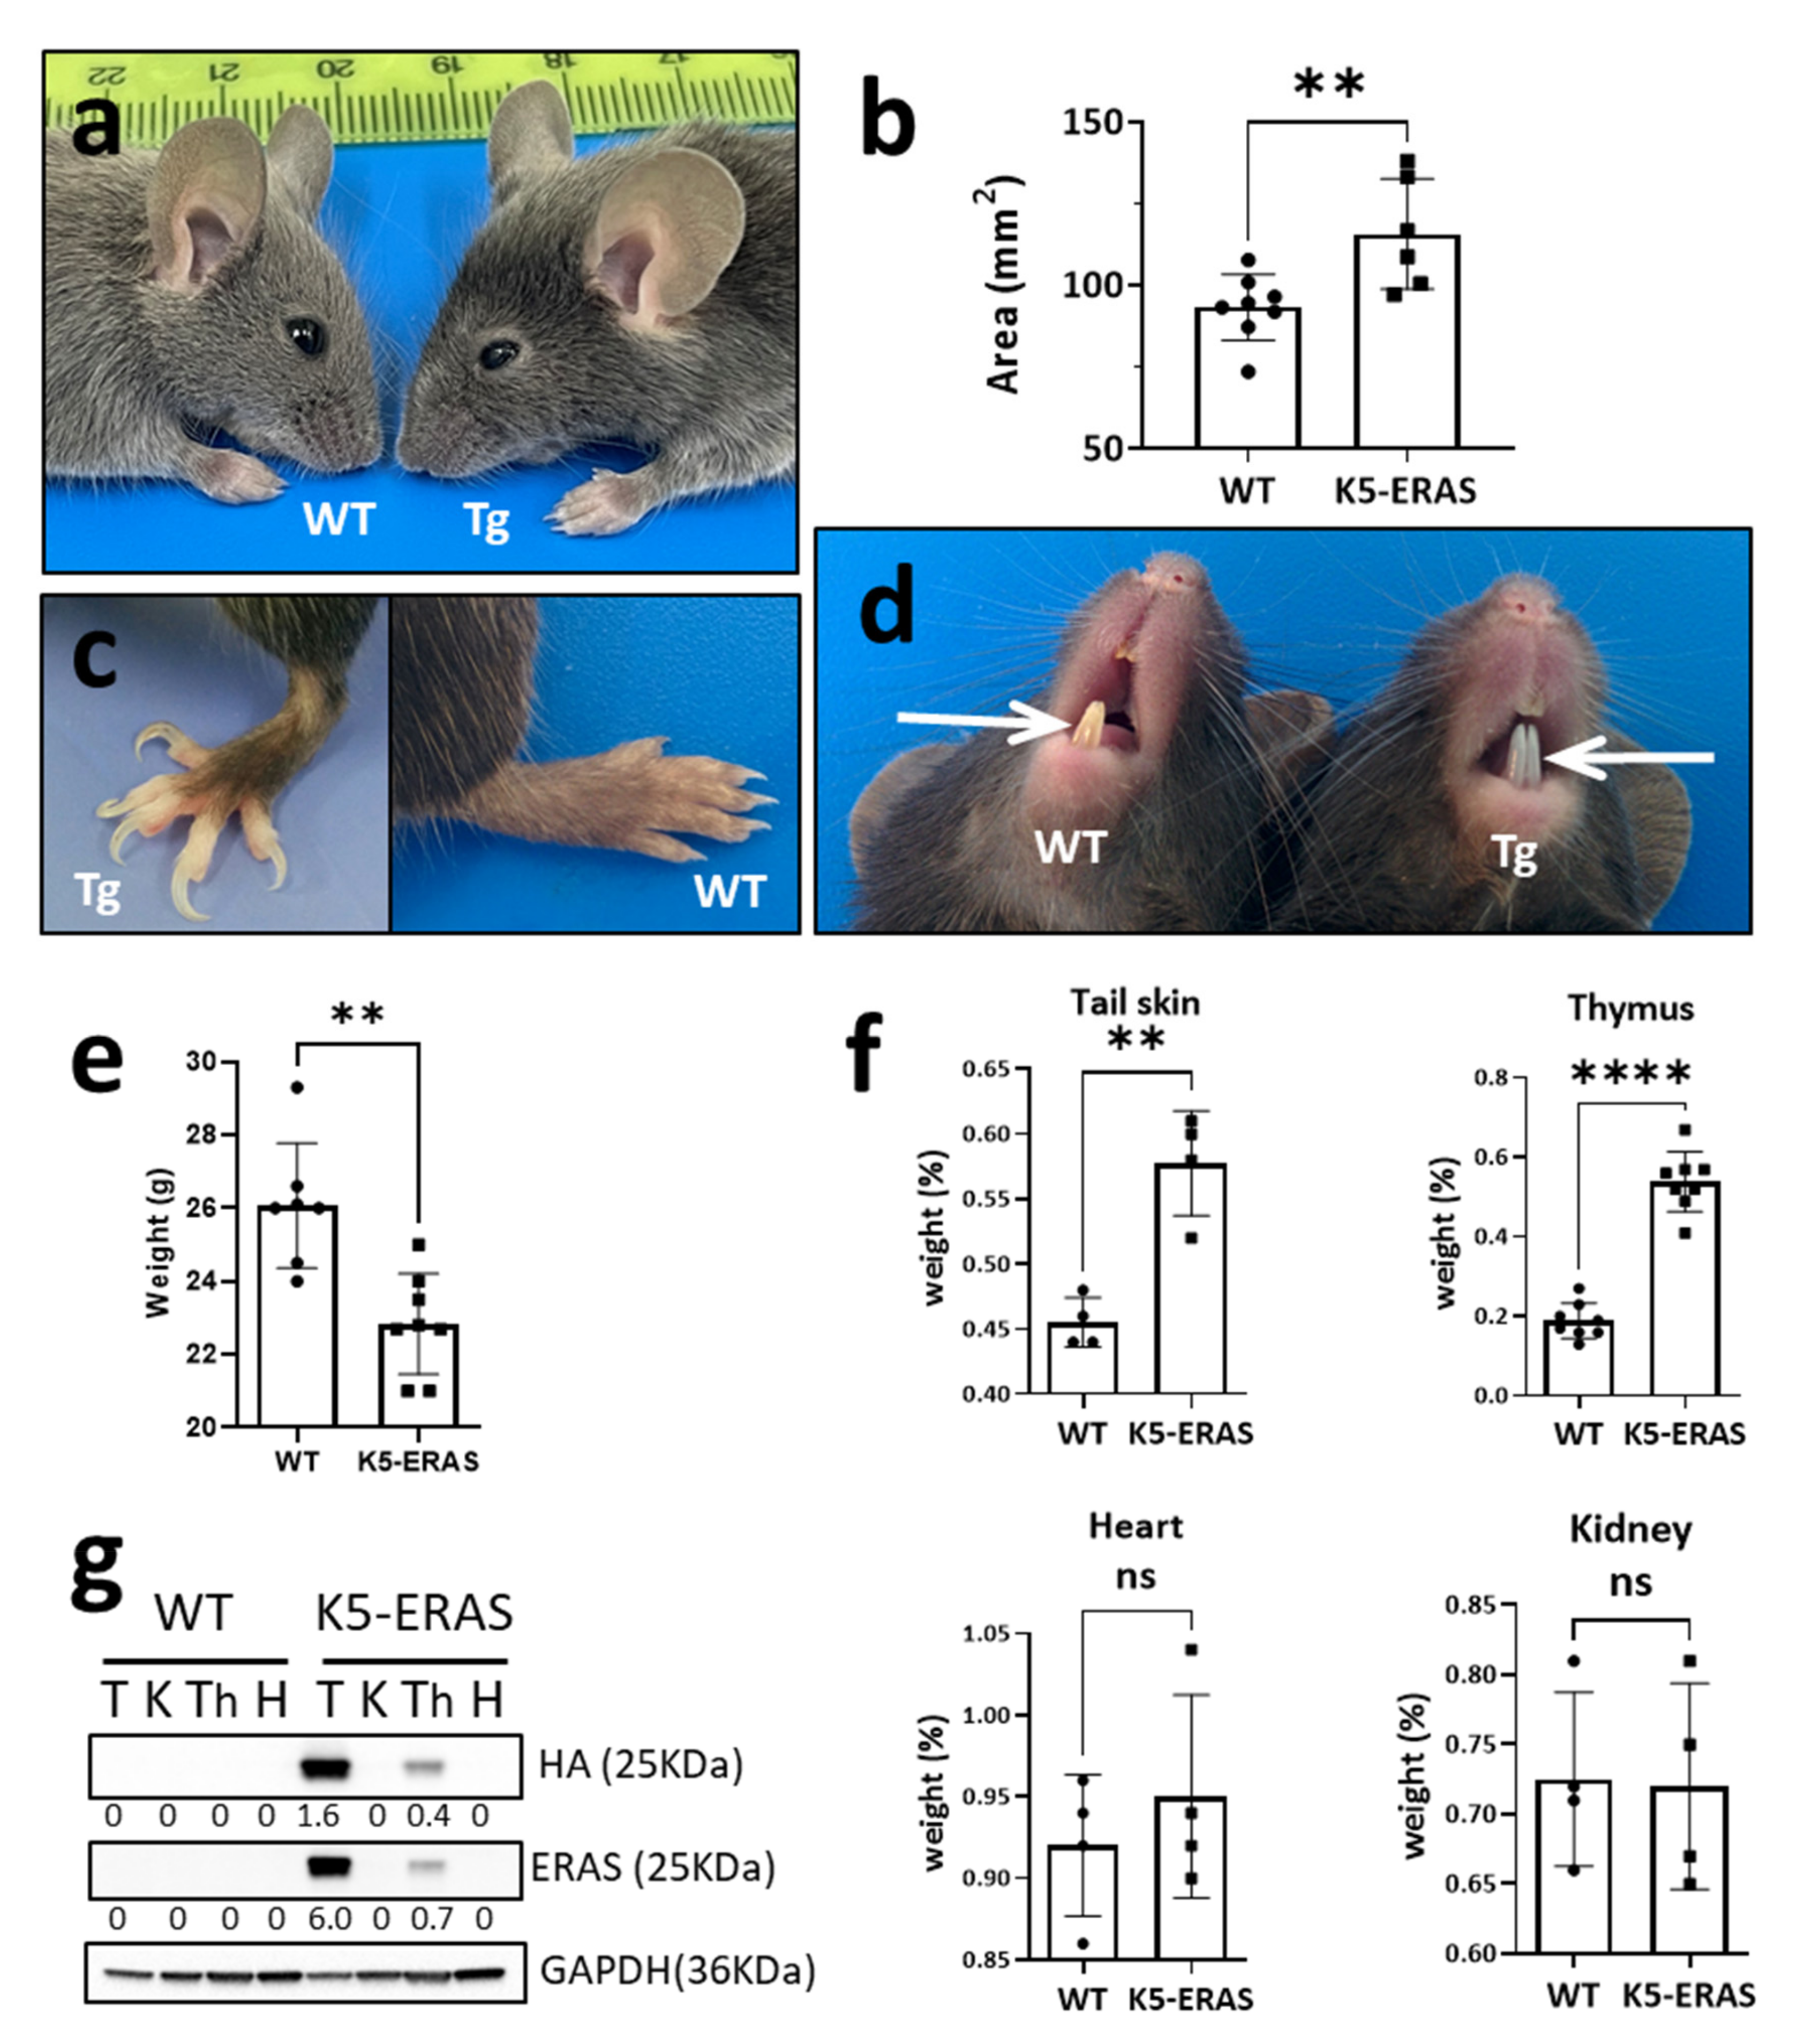
2.2. Ear Surface Measurement and Organ Weighing
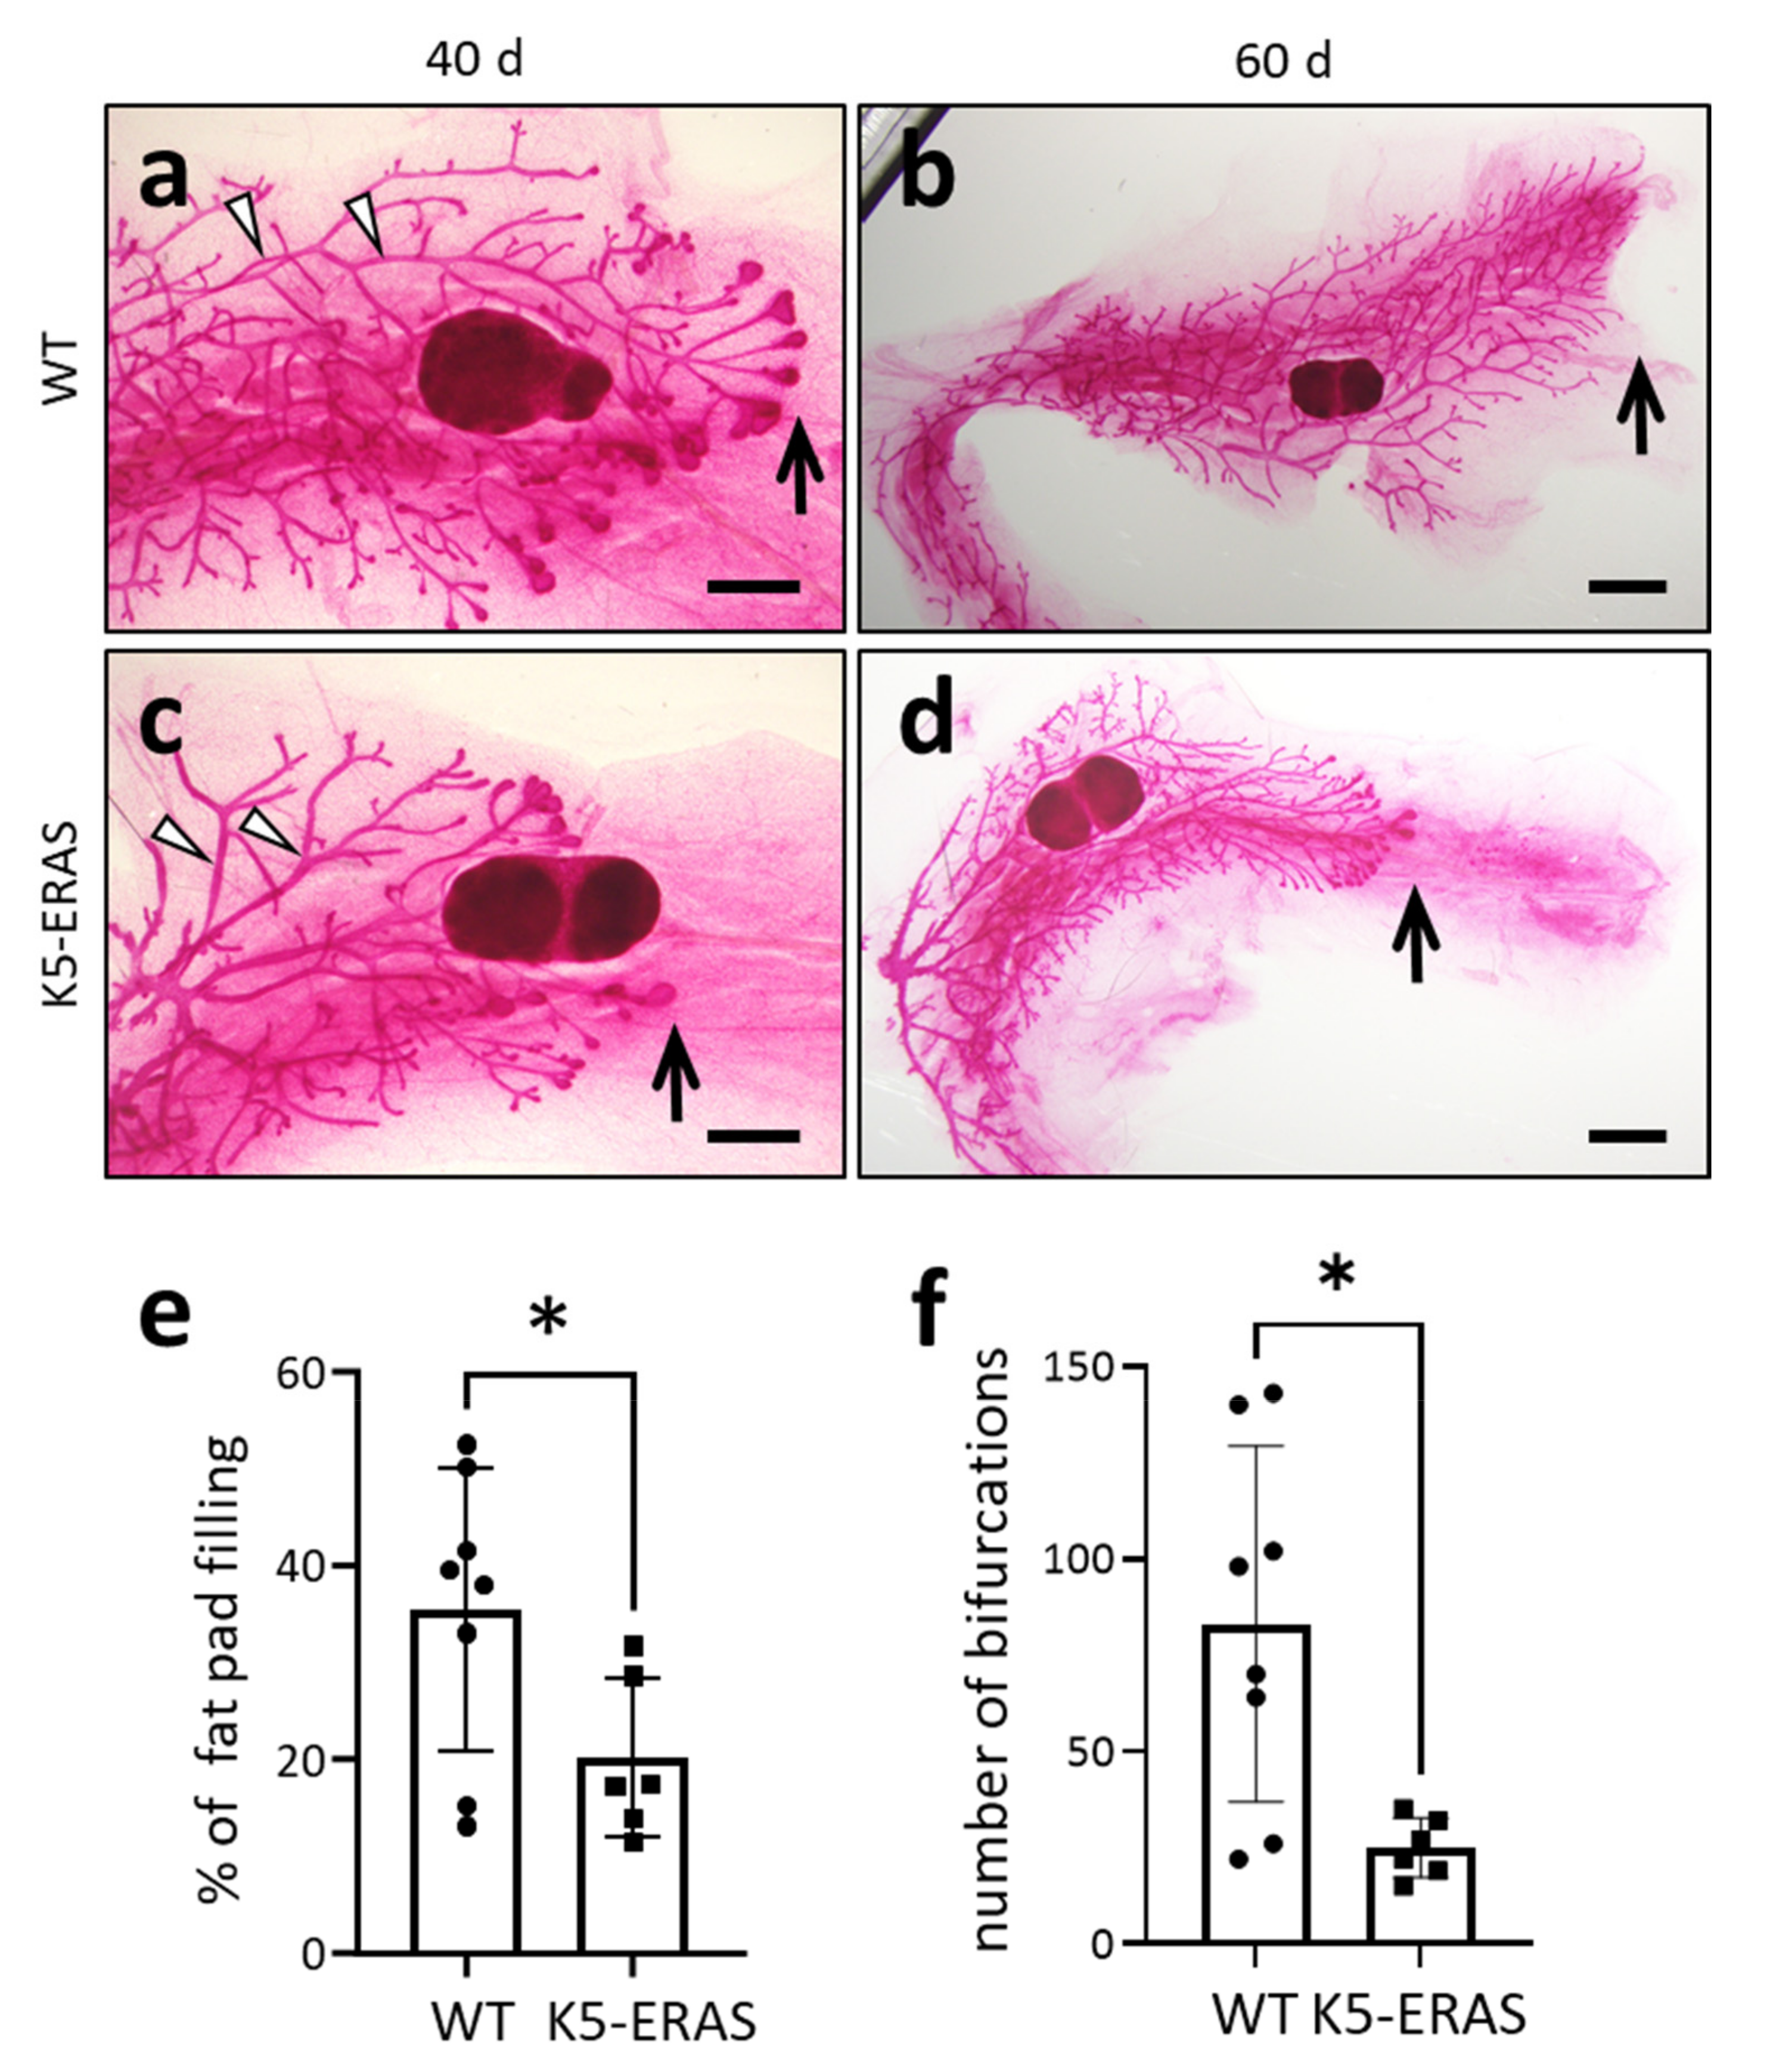
2.3. Whole Mount (Carmine Alum) Staining of Mammary Glands
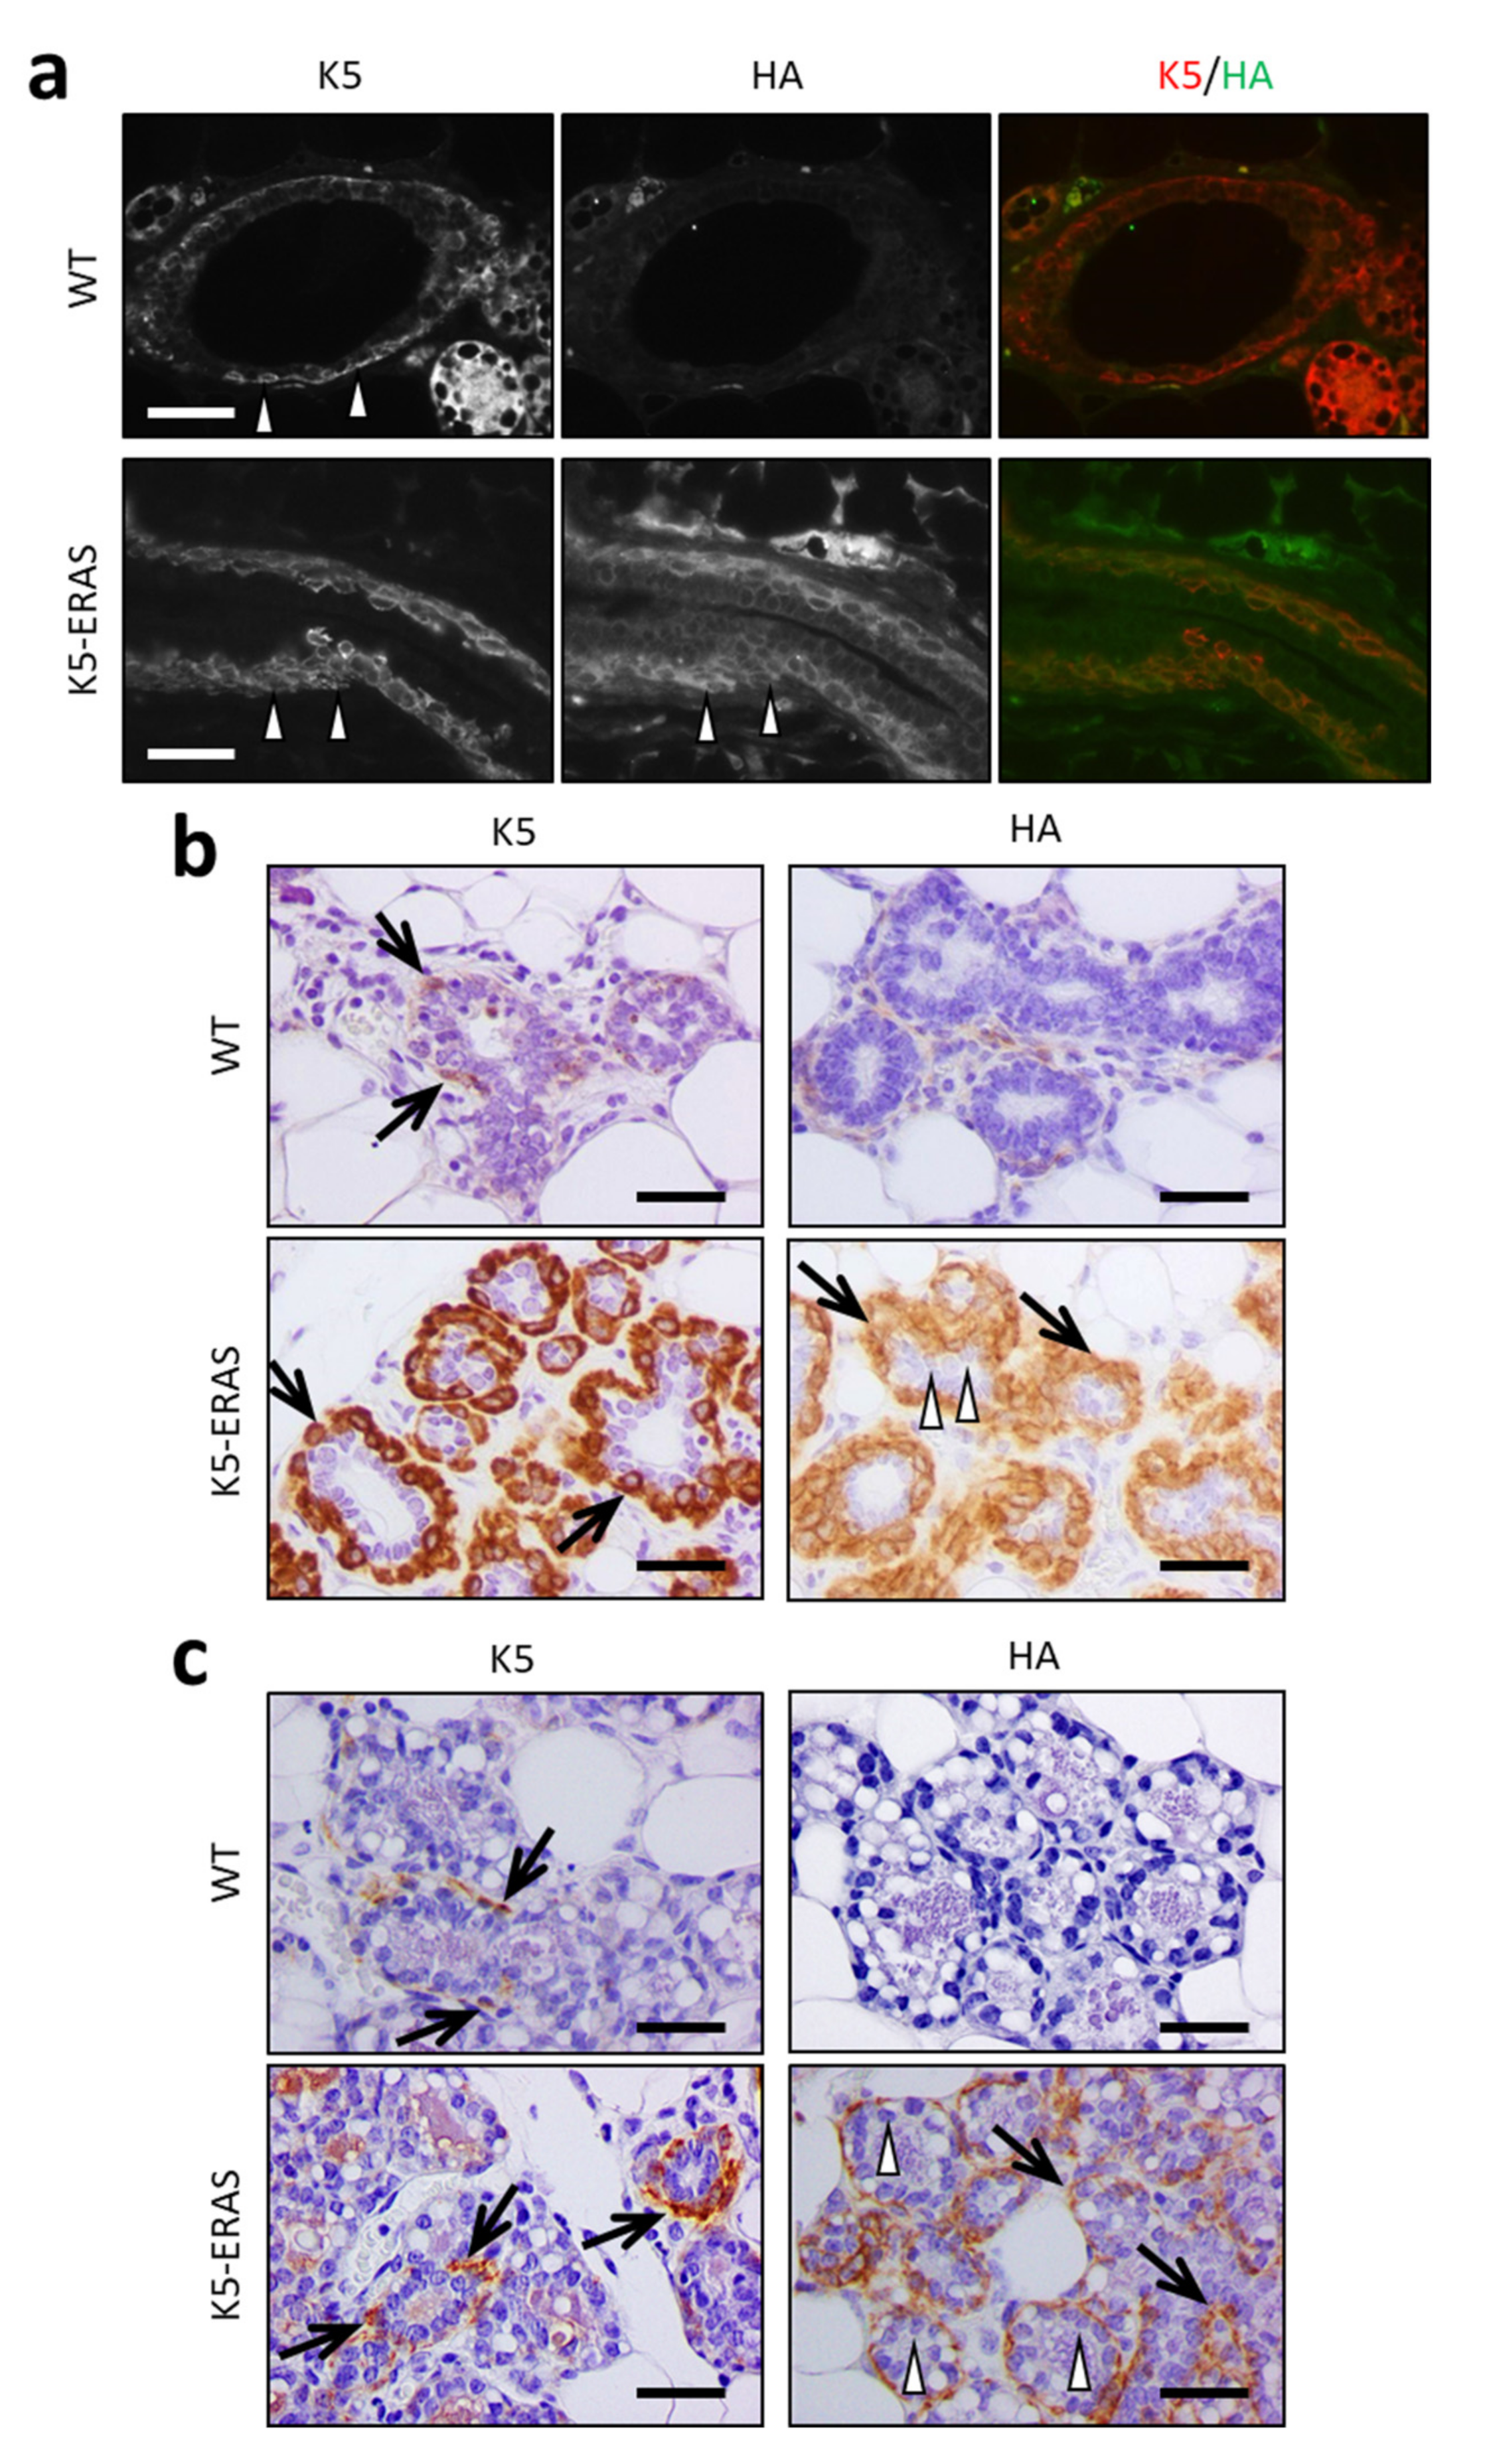
2.4. Histology and Immunohistochemistry
2.5. Western Blot Analysis
2.6. RNA Isolation and Quantitative RT-qPCR
2.7. Flow Cytometry Studies of Mammary Glands
3. Results
3.1. ERAS Expression in K5-Positive Cells Causes Gross Phenotypic Alterations
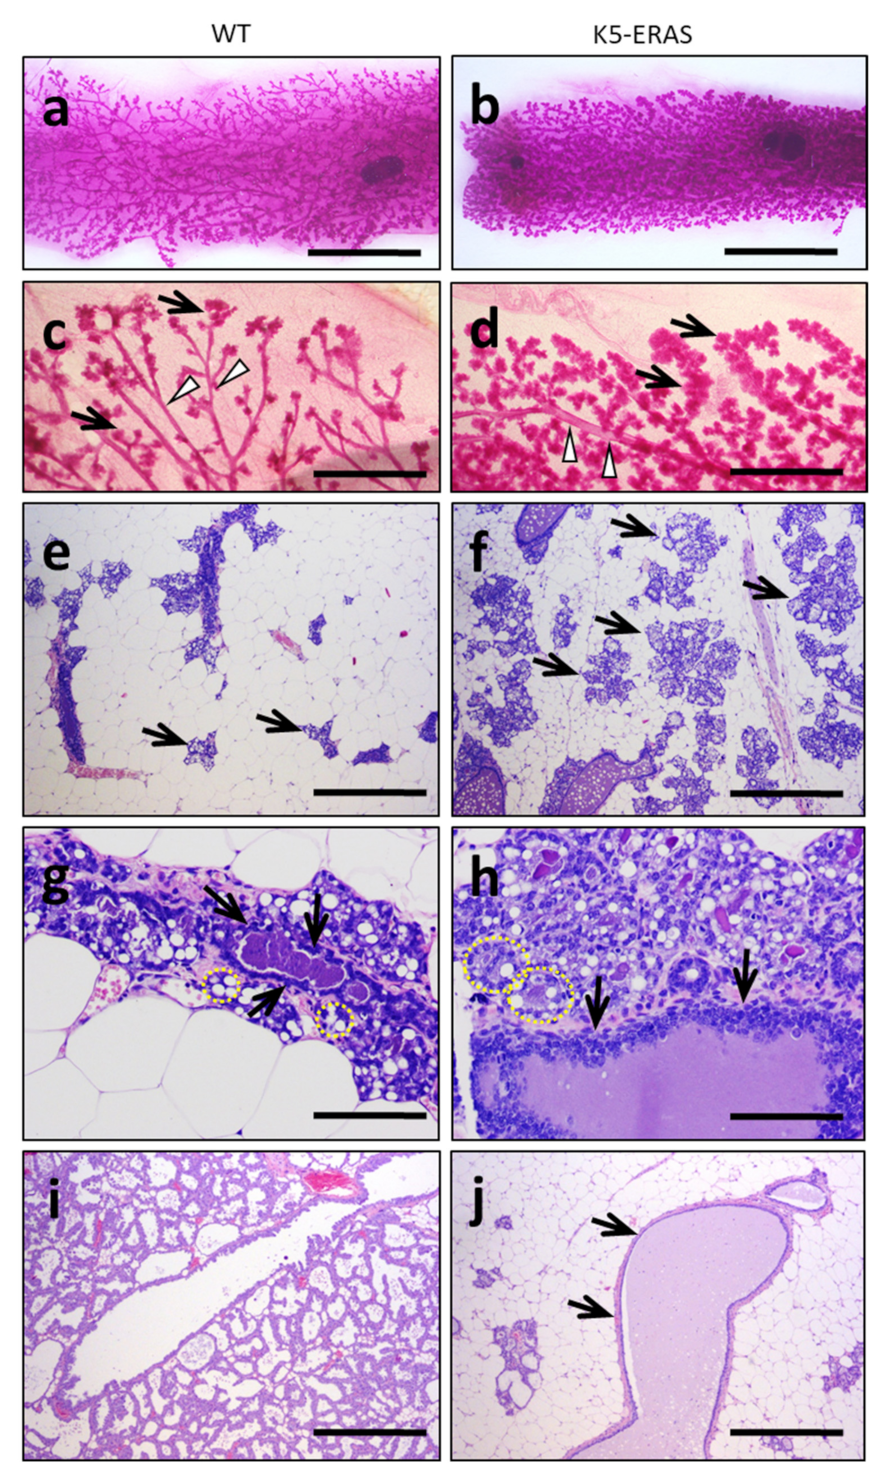
3.2. Expression of K5-ERAS Transgene in Myoepithelial Cells of Mammary Glands Alters Their Development and Function
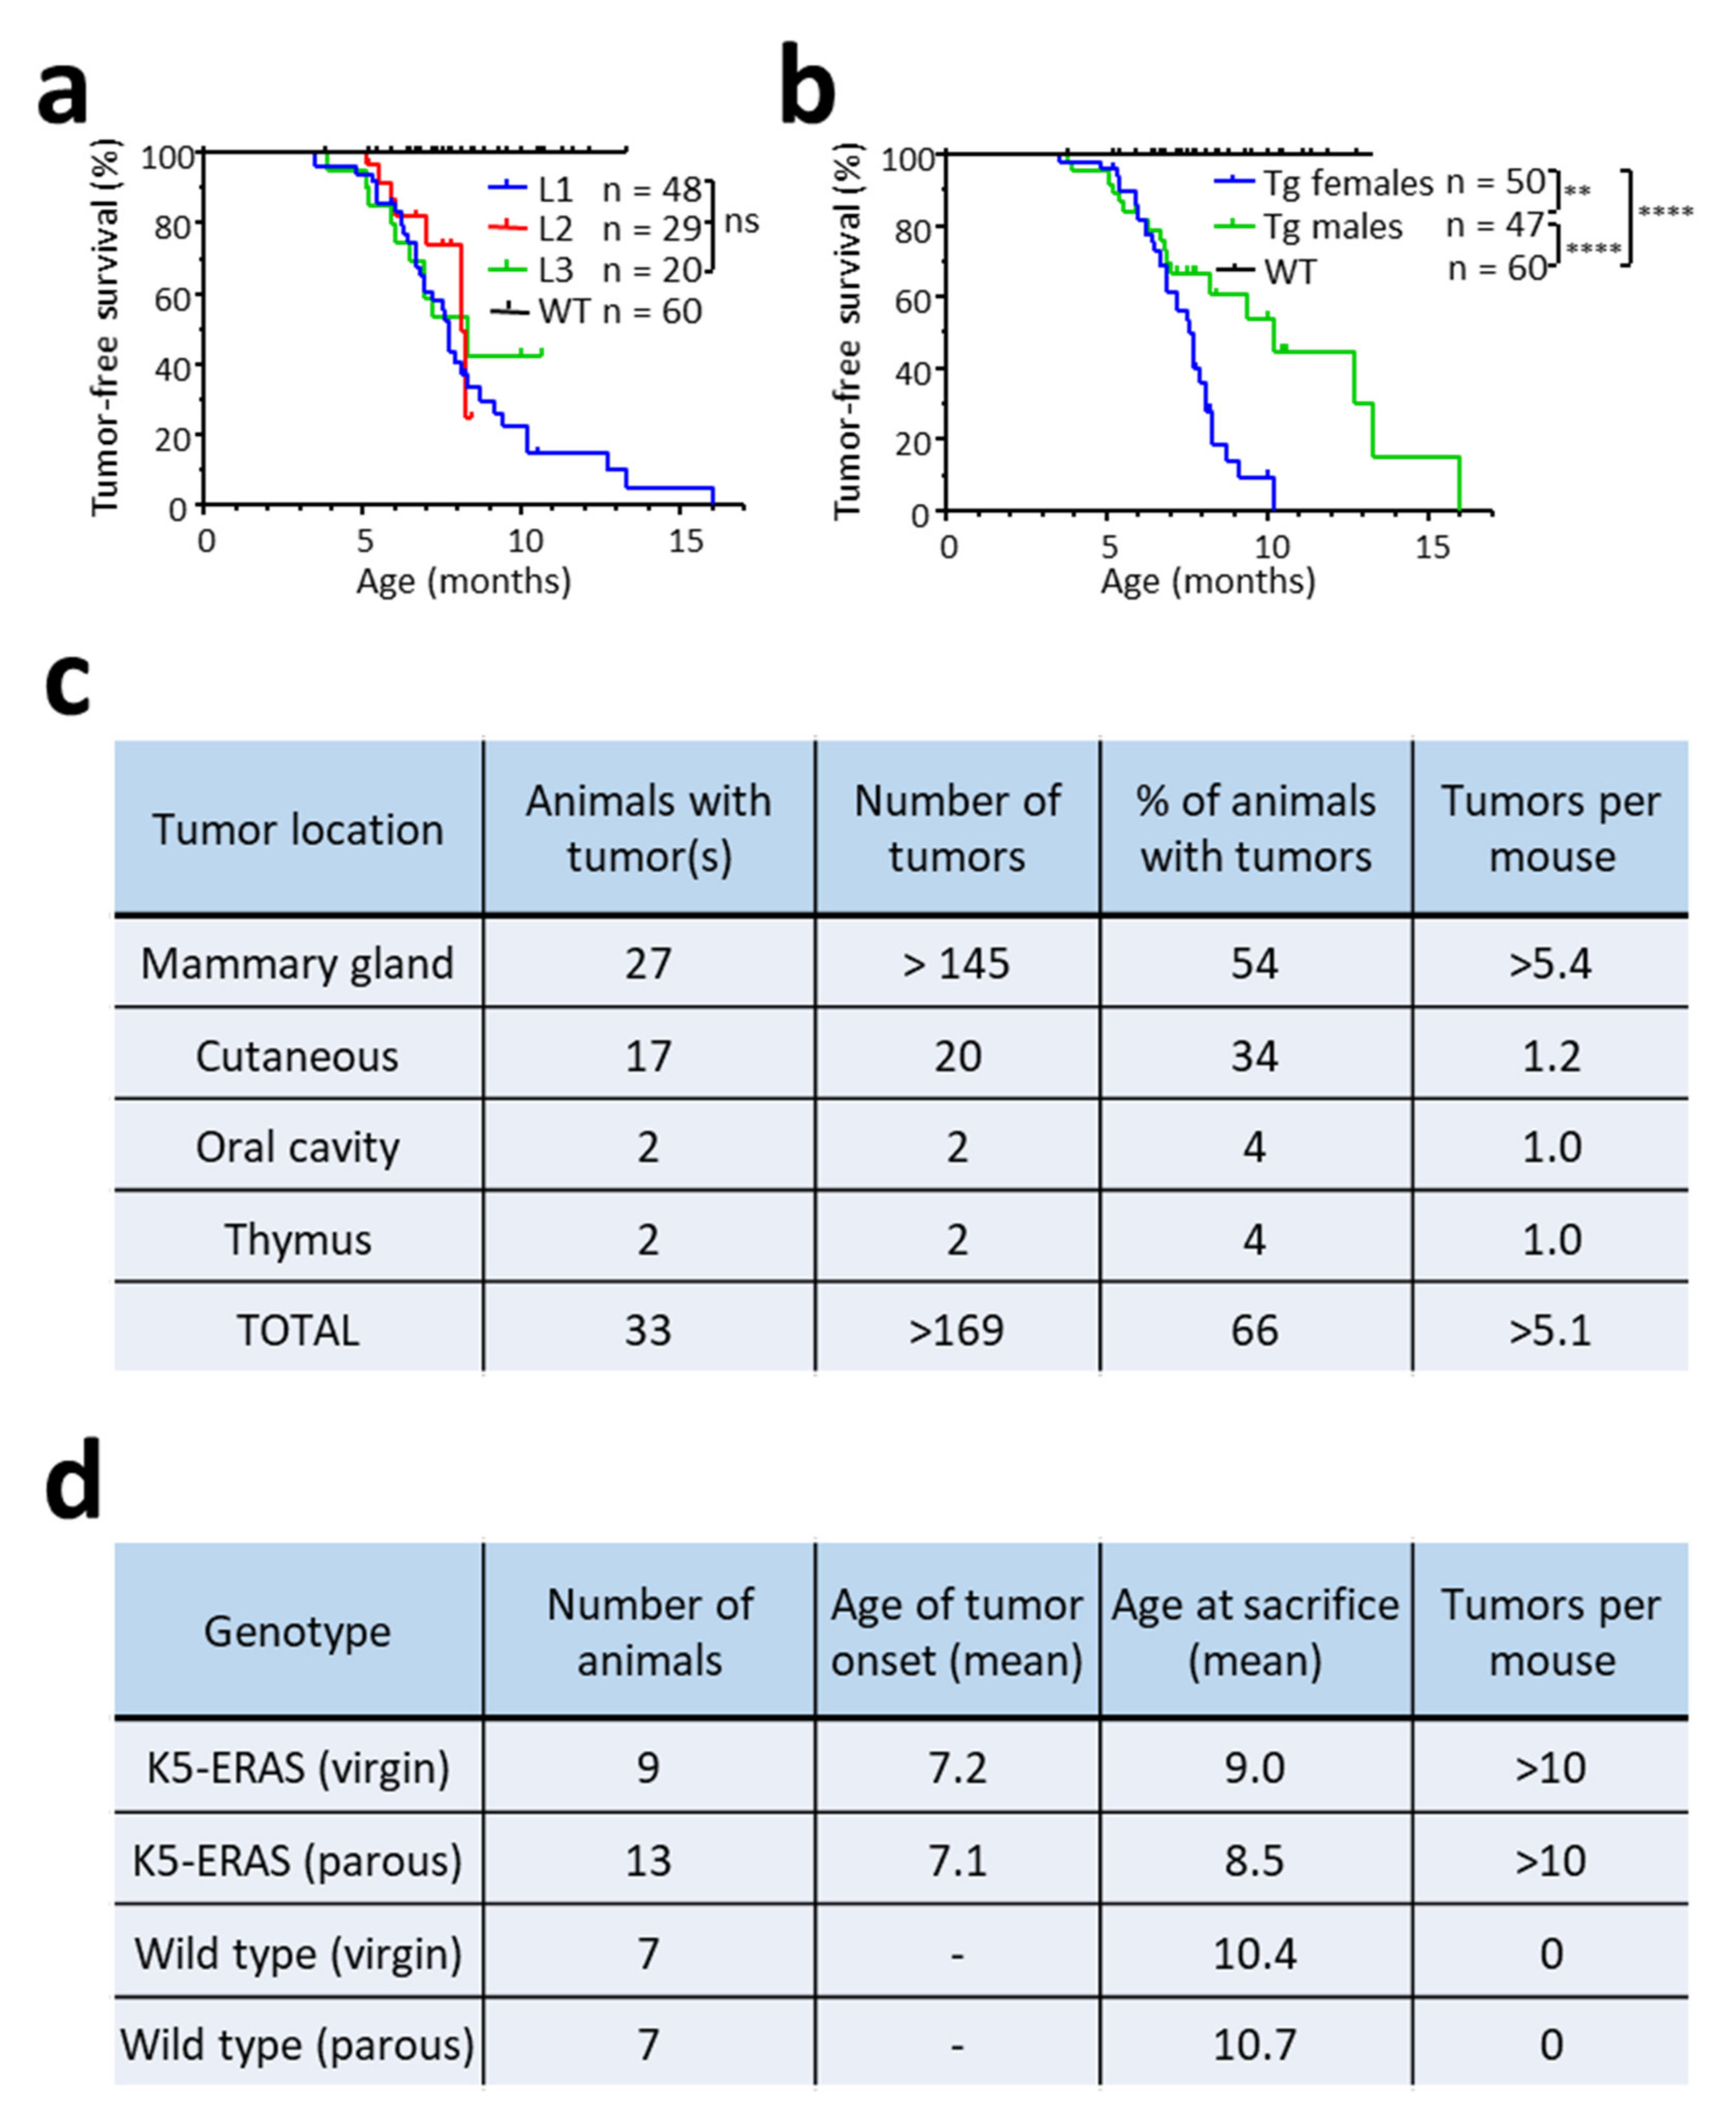
3.3. ERAS Expression Causes Spontaneous Tumor Development
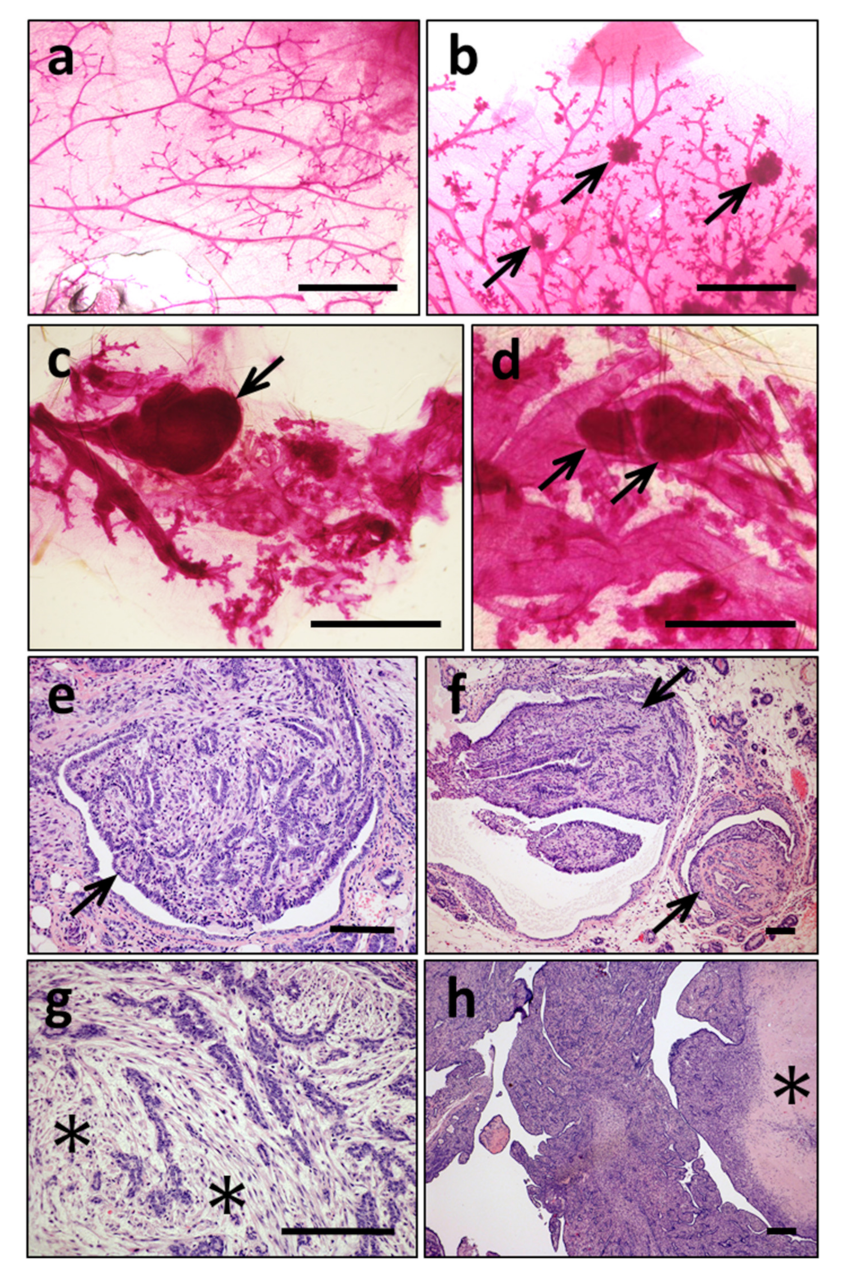
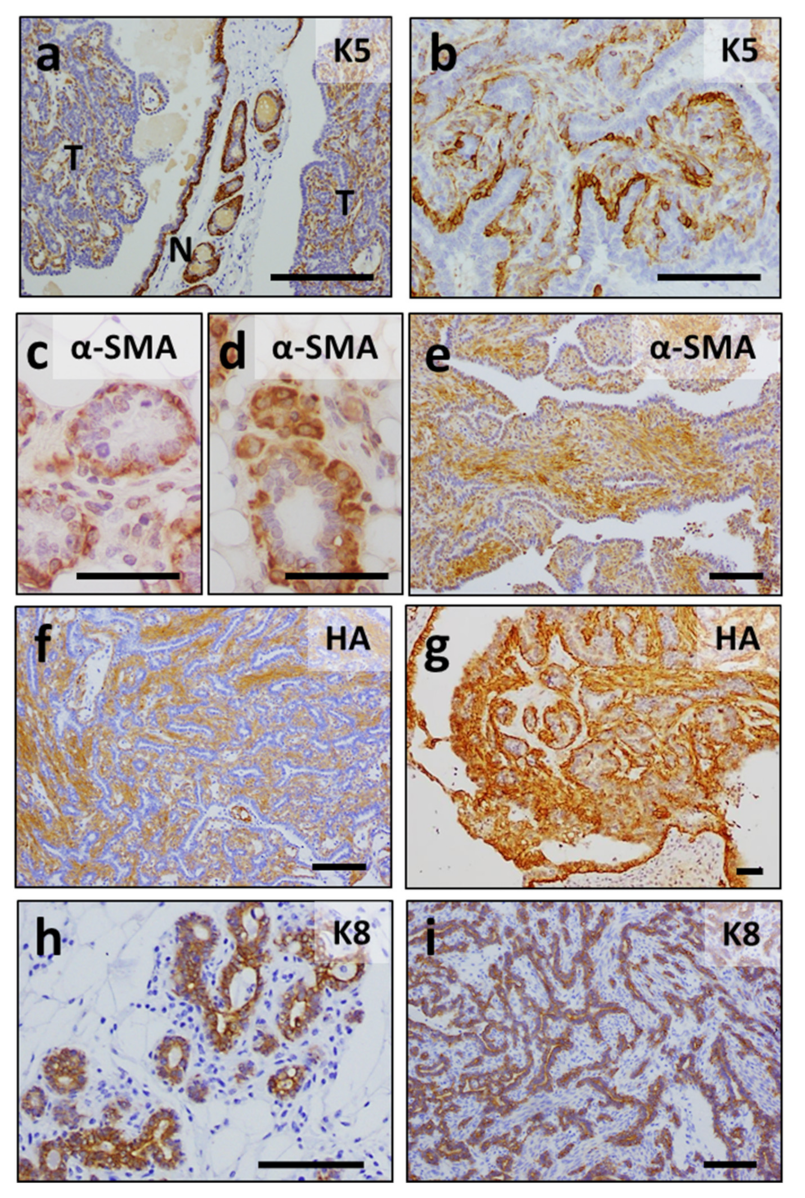
3.4. Mammary Tumors in K5-ERAS Mice Are Multicentric and of Myoepithelial Origin, Similar to Human Adenomyoepitheliomas
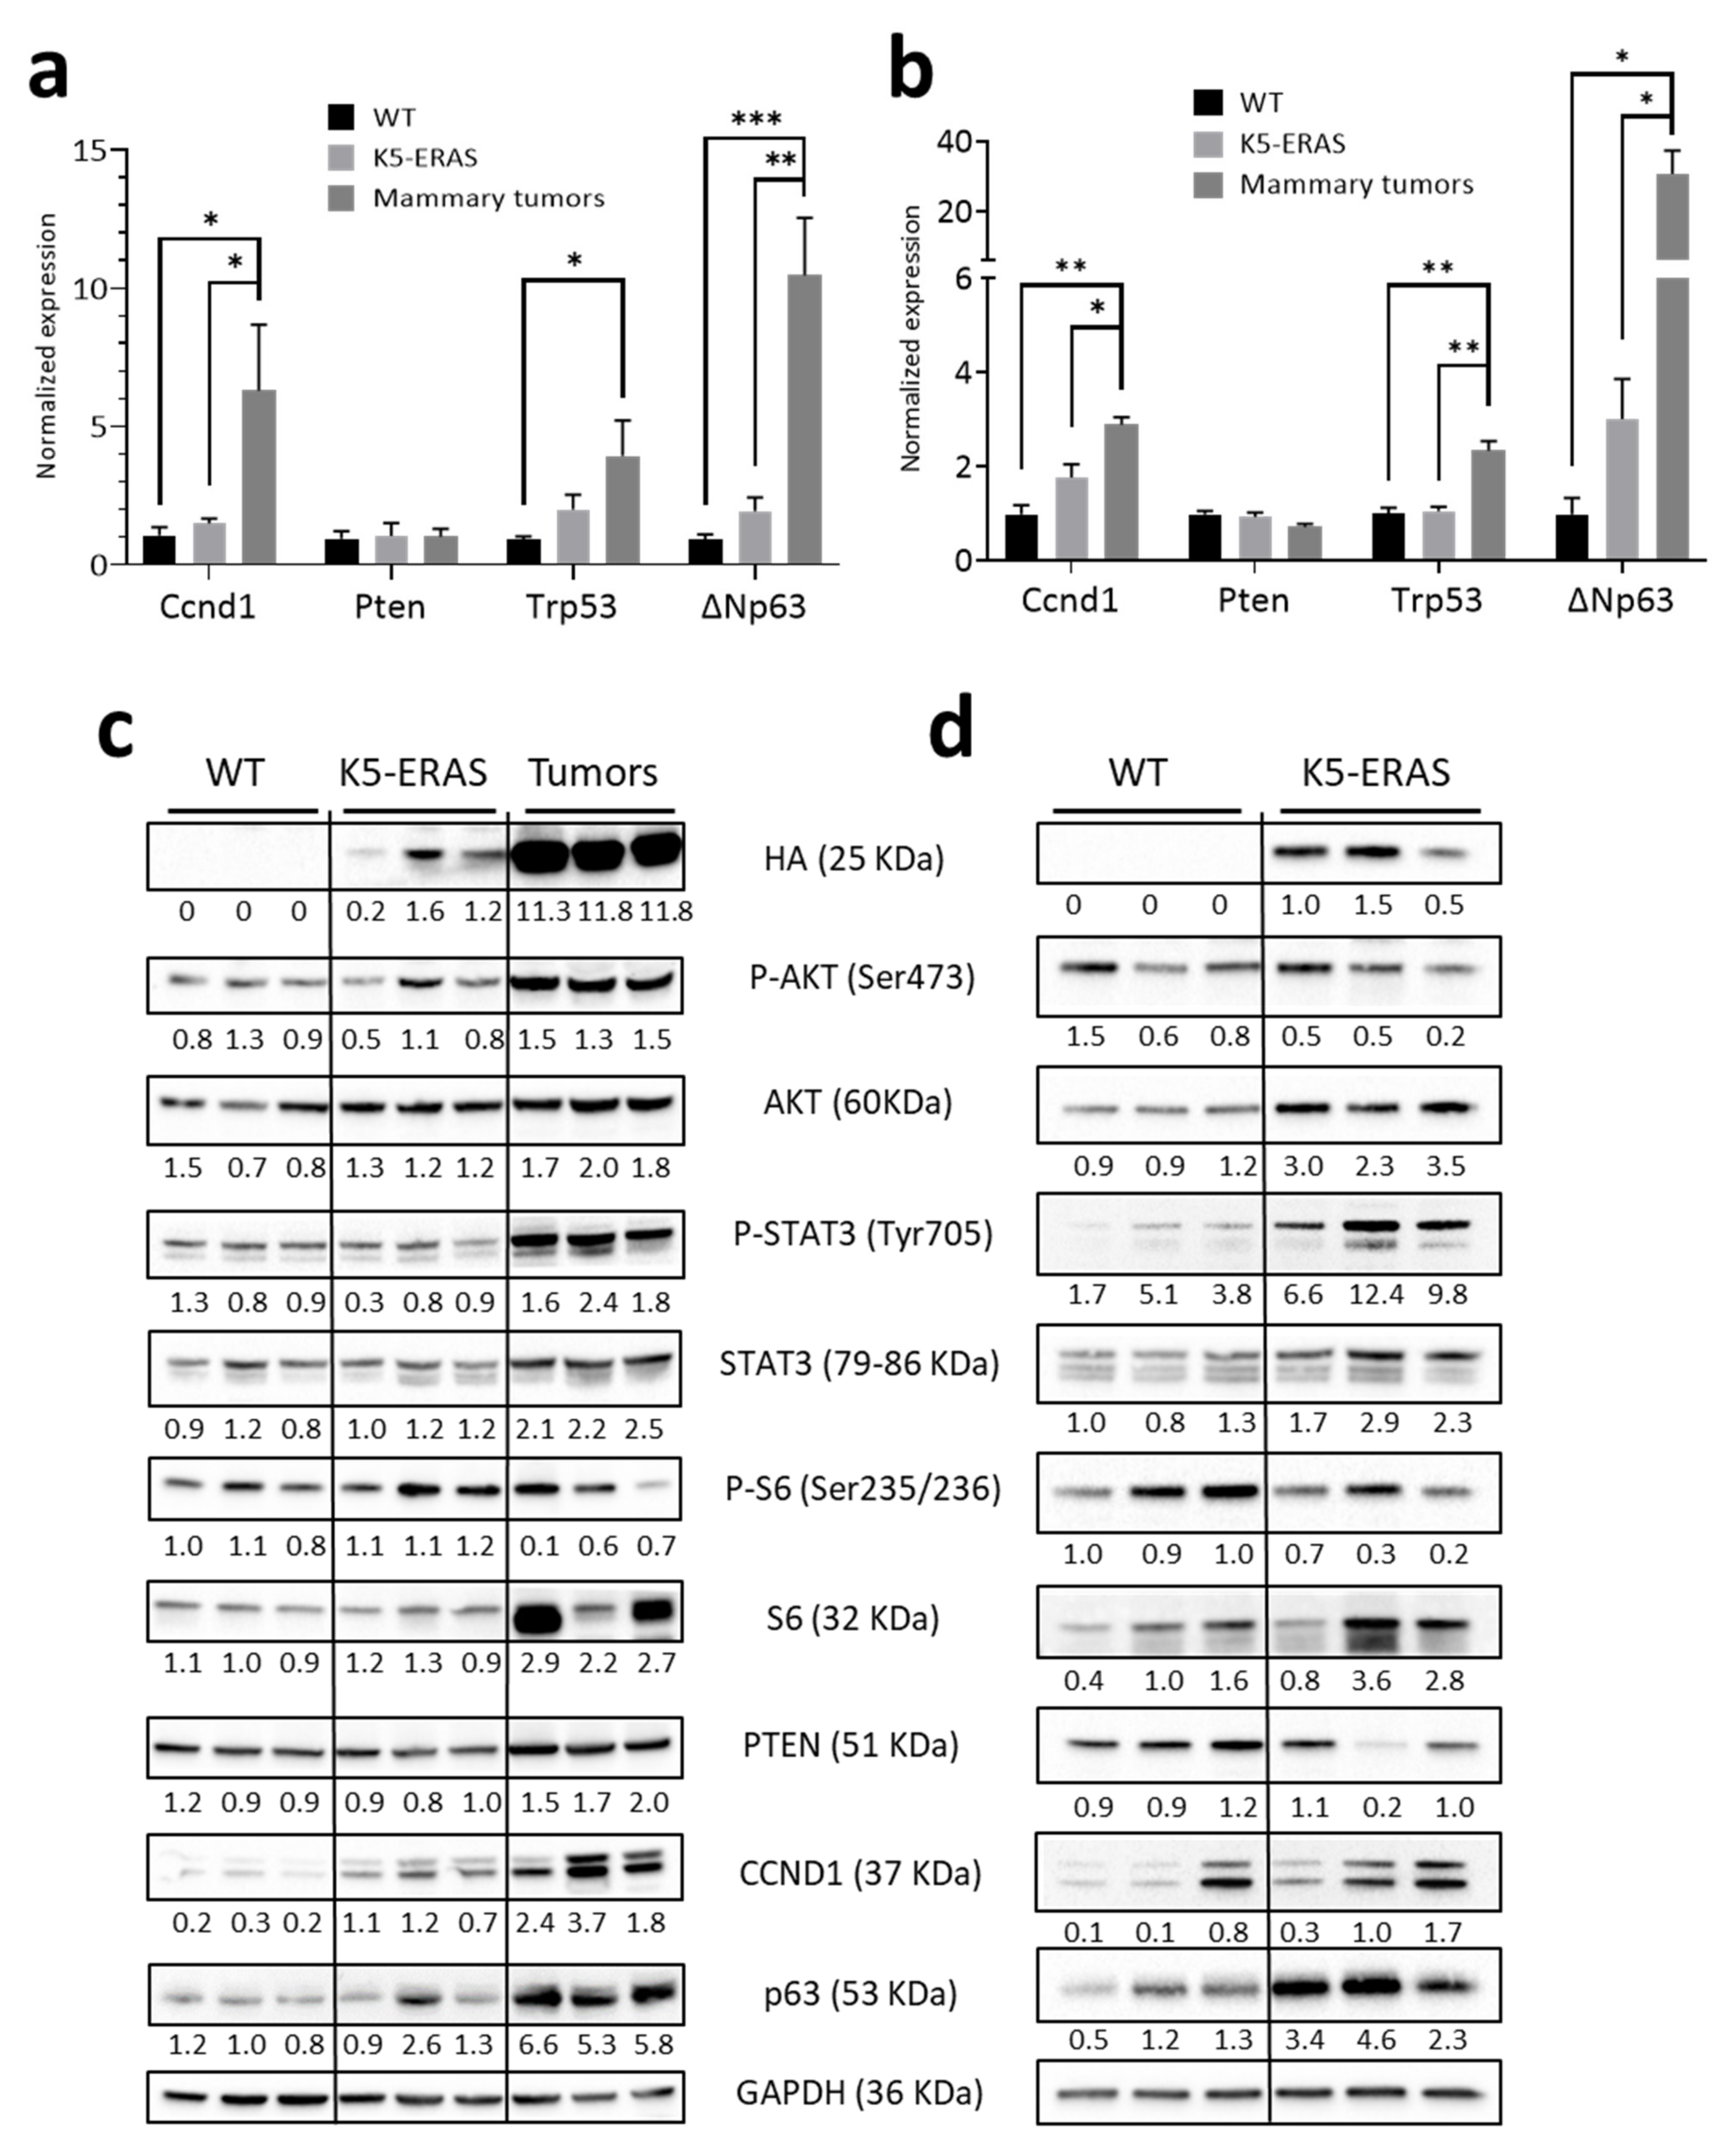
3.5. K5-ERAS Mammary Glands and Tumors Showed Increased Activity of Proliferative Pathways
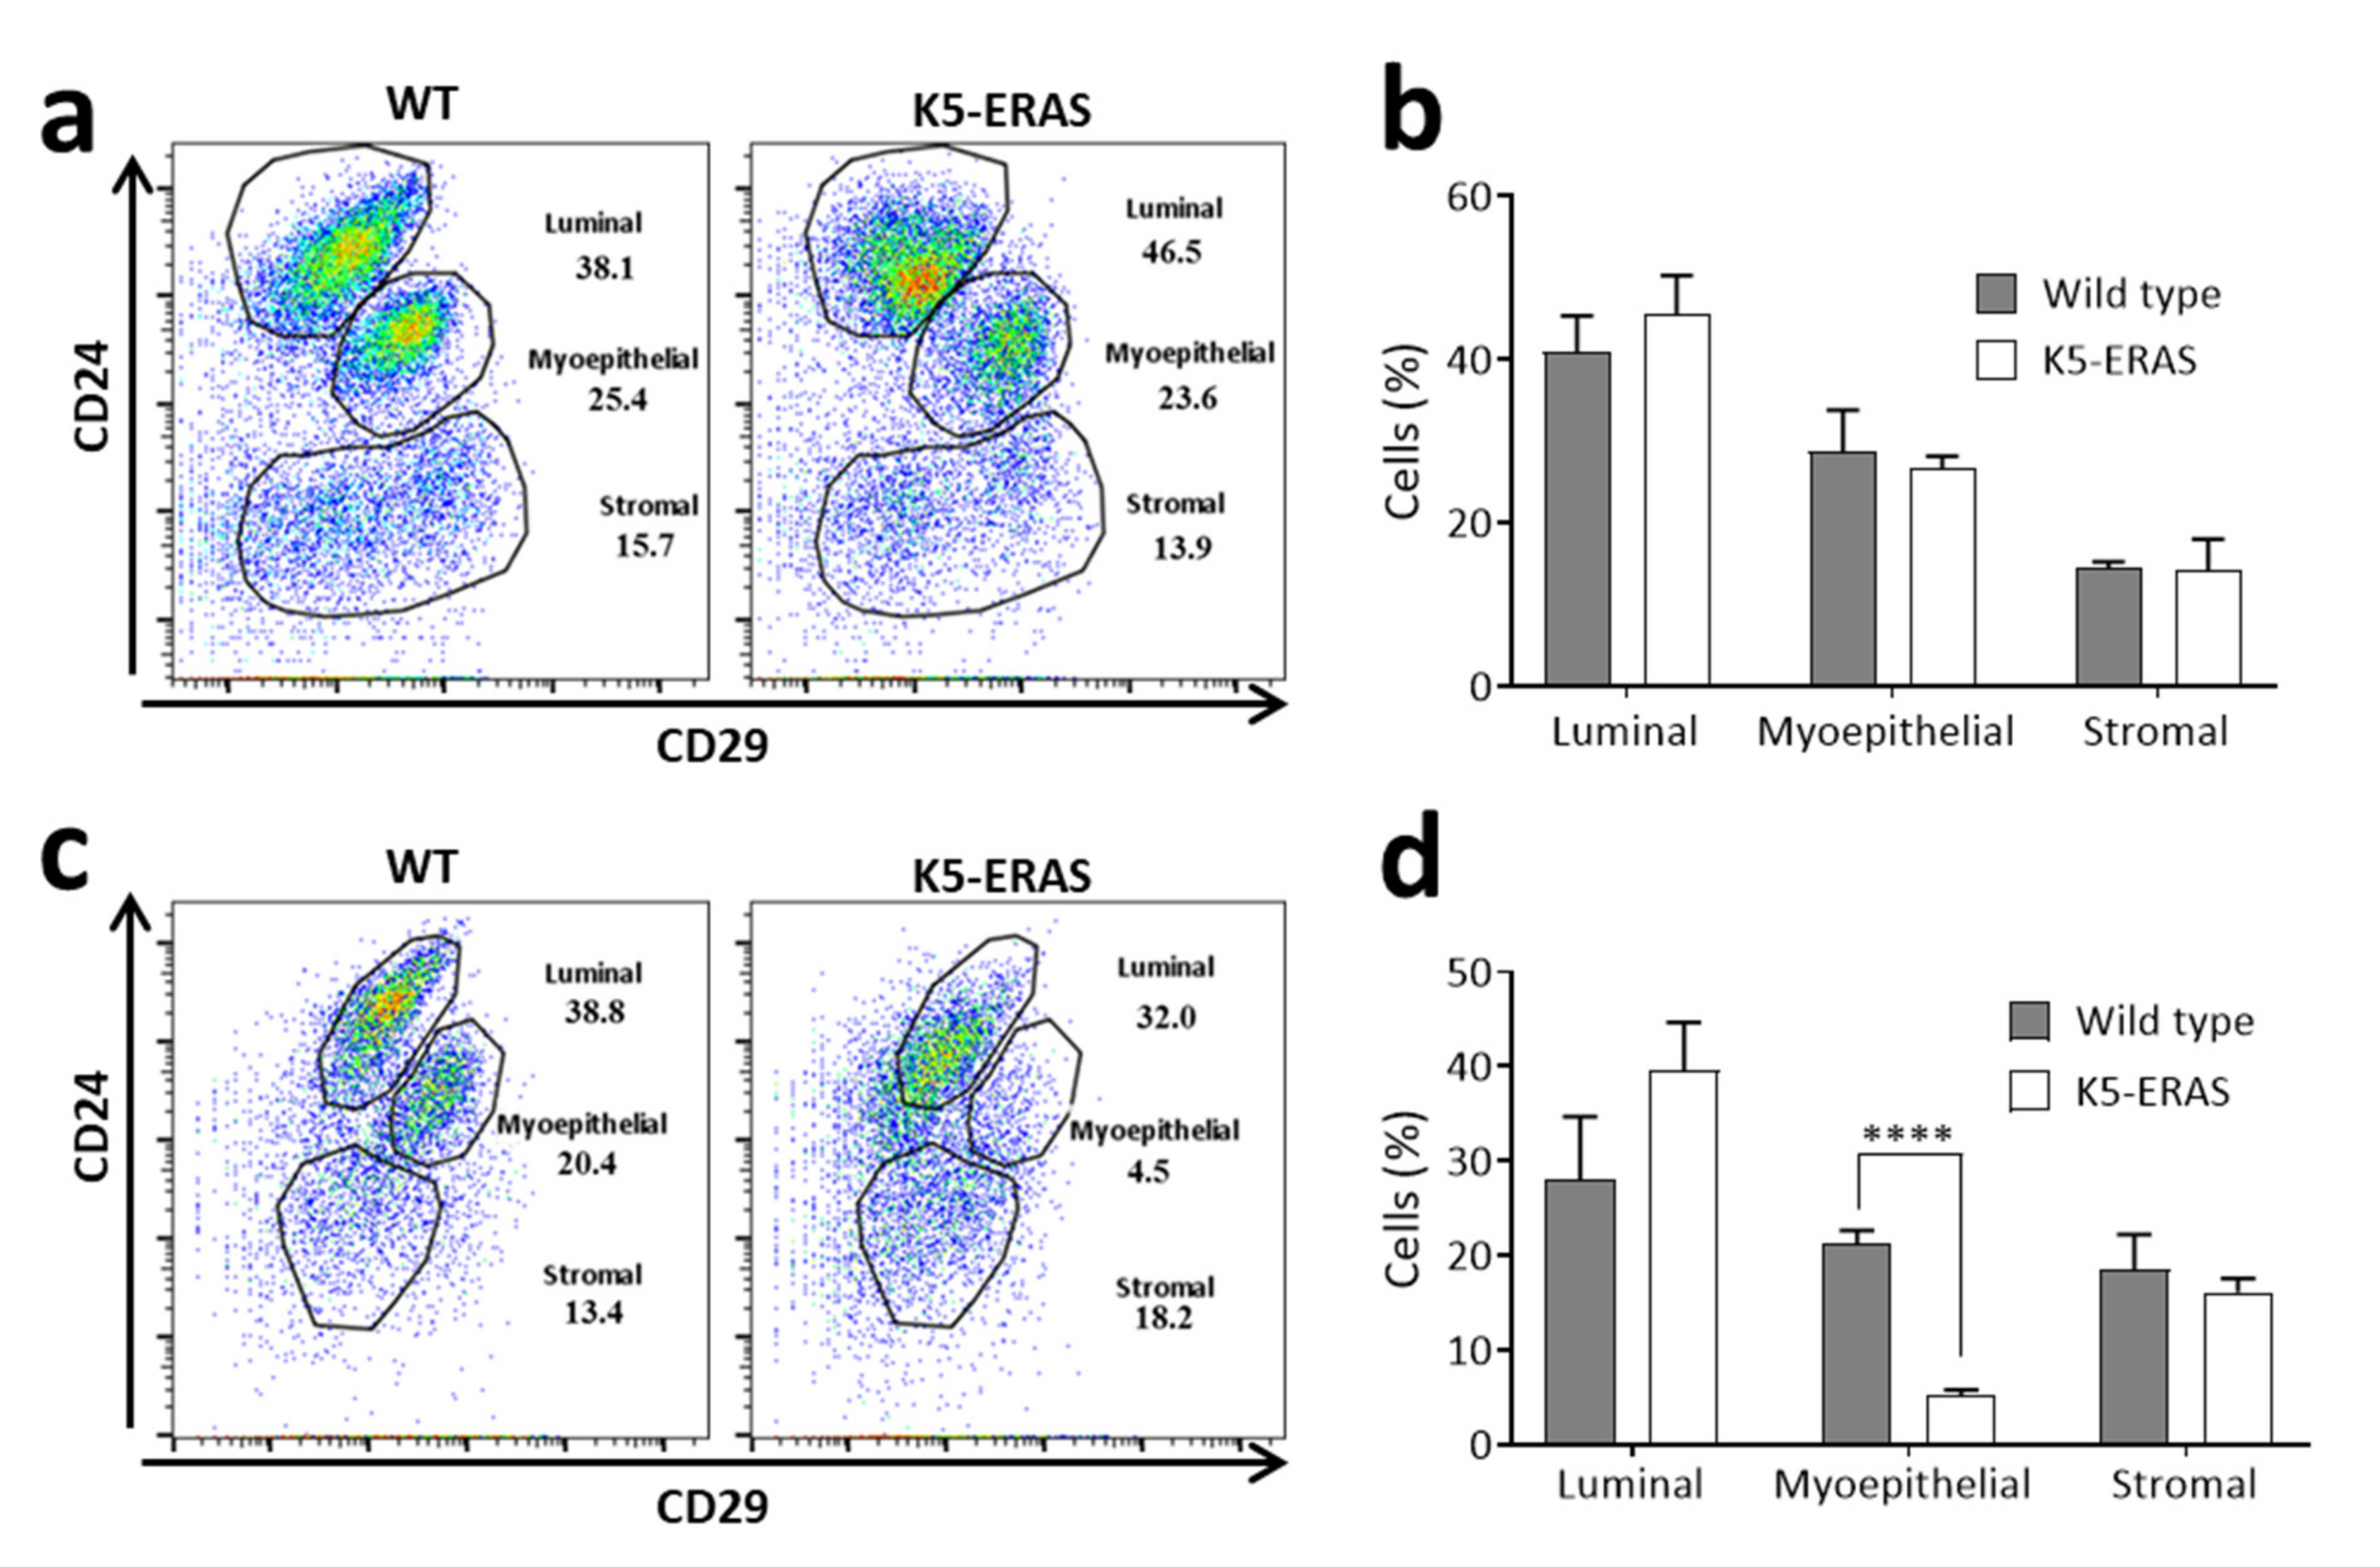
3.6. Mammary Cells from Aged K5-ERAS Female Mice Show a Decreased Expression of the Adhesion Molecule CD29
4. Discussion
5. Conclusions
Supplementary Materials
Author Contributions
Funding
Institutional Review Board Statement
Informed Consent Statement
Data Availability Statement
Acknowledgments
Conflicts of Interest
Abbreviations
References
- Bos, J.L.; Rehmann, H.; Wittinghofer, A. GEFs and GAPs: Critical Elements in the Control of Small G Proteins. Cell 2007, 129, 865–877. [Google Scholar] [CrossRef] [PubMed] [Green Version]
- Sanchez-Vega, F.; Mina, M.; Armenia, J.; Chatila, W.K.; Luna, A.; La, K.C.; Dimitriadoy, S.; Liu, D.L.; Kantheti, H.S.; Saghafinia, S.; et al. Oncogenic Signaling Pathways in The Cancer Genome Atlas. Cell 2018, 173, 321–337. [Google Scholar] [CrossRef] [Green Version]
- Prior, I.A.; Hood, F.E.; Hartley, J.L. The Frequency of Ras Mutations in Cancer. Cancer Res. 2020, 80, 2969–2974. [Google Scholar] [CrossRef] [Green Version]
- Cox, A.D.; Der, C.J. Ras history: The saga continues. Small GTPases 2010, 1, 2–27. [Google Scholar] [CrossRef] [Green Version]
- Takahashi, K.; Mitsui, K.; Yamanaka, S. Role of ERas in promoting tumour-like properties in mouse embryonic stem cells. Nat. Cell Biol. 2003, 423, 541–545. [Google Scholar] [CrossRef] [PubMed]
- Zhao, Z.-A.; Yu, Y.; Ma, H.-X.; Wang, X.-X.; Lu, X.; Zhai, Y.; Zhang, X.; Wang, H.; Li, L. The roles of ERAS during cell lineage specification of mouse early embryonic development. Open Biol. 2015, 5, 150092. [Google Scholar] [CrossRef] [Green Version]
- Yashiro, M.; Yasuda, K.; Nishii, T.; Kaizaki, R.; Sawada, T.; Ohira, M.; Hirakawa, K. Epigenetic regulation of the embryonic oncogene ERas in gastric cancer cells. Int. J. Oncol. 2009, 35, 997–1003. [Google Scholar] [CrossRef] [Green Version]
- Yasuda, K.; Yashiro, M.; Sawada, T.; Ohira, M.; Hirakawa, K. ERas oncogene expression and epigenetic regulation by histone acetylation in human cancer cells. Anticancer Res. 2008, 27, 4071–4075. [Google Scholar]
- Tanaka, Y.; Ikeda, T.; Kishi, Y.; Masuda, S.; Shibata, H.; Takeuchi, K.; Komura, M.; Iwanaka, T.; Muramatsu, S.; Kondo, Y.; et al. ERas is Expressed in Primate Embryonic Stem Cells but not Related to Tumorigenesis. Cell Transplant. 2009, 18, 381–389. [Google Scholar] [CrossRef]
- Kameda, T.; Thomson, J.A. HumanERasGene Has an Upstream Premature Polyadenylation Signal That Results in a Truncated, Noncoding Transcript. Stem Cells 2005, 23, 1535–1540. [Google Scholar] [CrossRef] [PubMed]
- Liu, Y.; Wang, Z.; Li, H.; Wu, Z.; Wei, F.; Wang, H. Role of the ERas gene in gastric cancer cells. Oncol. Rep. 2013, 30, 50–56. [Google Scholar] [CrossRef] [Green Version]
- Suárez-Cabrera, C.; de la Peña, B.; González, L.L.; Page, A.; Martínez-Fernández, M.; Casanova, M.L.; Paramio, J.M.; Rojo-Sebastian, A.; Moreno-Bueno, G.; Maroto, A.; et al. The Ras-related gene ERAS is involved in human and murine breast cancer. Sci. Rep. 2018, 8, 13038. [Google Scholar] [CrossRef] [PubMed]
- Yu, Y.; Liang, D.; Tian, Q.; Chen, X.; Jiang, B.; Chou, B.K.; Hu, P.; Cheng, L.; Gao, P.; Li, J.; et al. Stimulation of somatic cell reprogramming by ERas-Akt-FoxO1 signaling axis. Stem Cells 2014, 32, 349–363. [Google Scholar] [CrossRef]
- Liu, Y.; Qin, P.; Wu, R.; Du, L.; Li, F. ERas regulates cell proliferation and epithelial-mesenchymal transition by affecting Erk/Akt signaling pathway in pancreatic cancer. Hum. Cell. 2020, 33, 1186–1196. [Google Scholar] [CrossRef]
- Mumert, M.; Dubuc, A.; Wu, X.; Northcott, P.A.; Chin, S.S.; Pedone, C.A.; Taylor, M.; Fults, D.W. Functional Genomics Identifies Drivers of Medulloblastoma Dissemination. Cancer Res. 2012, 72, 4944–4953. [Google Scholar] [CrossRef] [Green Version]
- Kaizaki, R.; Yashiro, M.; Shinto, O.; Yasuda, K.; Matsuzaki, T.; Sawada, T.; Hirakawa, K. Expression of ERas oncogene in gastric carcinoma. Anticancer Res. 2009, 29, 2189–2193. [Google Scholar]
- Kubota, E.; Kataoka, H.; Aoyama, M.; Mizoshita, T.; Mori, Y.; Shimura, T.; Tanaka, M.; Sasaki, M.; Takahashi, S.; Asai, K.; et al. Role of ES Cell-Expressed Ras (ERas) in Tumorigenicity of Gastric Cancer. Am. J. Pathol. 2010, 177, 955–963. [Google Scholar] [CrossRef] [PubMed]
- Zhang, F.; Tang, J.M.; Wang, L.; Shen, J.Y.; Zheng, L.; Wu, P.P.; Zhang, M.; Yan, Z.W. Detection of β-catenin, gastrokine-2 and embryonic stem cell expressed ras in gastric cancers. Int. J. Clin. Exp. Pathol. 2010, 3, 782–791. [Google Scholar] [PubMed]
- Ramirez, A.; Vidal, M.; Bravo, A.; Larcher, F.; Jorcano, J.L. A 5′-upstream region of a bovine keratin 6 gene confers tissue-specific expression and hyperproliferation-related induction in transgenic mice. Proc. Natl. Acad. Sci. USA 1995, 92, 4783–4787. [Google Scholar] [CrossRef] [PubMed] [Green Version]
- Hogan, B.; Beddington, R.C.F.; Lacy, E. Manipulating the Mouse Embryo: A laboratory Manual, 2nd ed.; Cold Spring Harbor Laboratory Press: New York, NY, USA, 1994; p. 497. [Google Scholar]
- Page, A.; Cascallana, J.L.; Casanova, M.L.; Navarro, M.; Alameda, J.P.; Pérez, P.; Bravo, A.; Ramirez, A. IKKbeta overexpression leads to pathologic lesions in stratified epithelia and exocrine glands and to tumoral transformation of oral epithelia. Mol. Cancer Res. 2011, 9, 1329–1338. [Google Scholar] [CrossRef] [PubMed] [Green Version]
- Livak, K.J.; Schmittgen, T.D. Analysis of relative gene expression data using real-time quantitative PCR and the 2(-Delta Delta C(T)) Method. Methods 2001, 25, 402–408. [Google Scholar] [CrossRef] [PubMed]
- Shackleton, M.; Vaillant, F.; Simpson, K.; Stingl, J.; Smyth, G.; Asselin-Labat, M.-L.; Wu, L.; Lindeman, G.; Visvader, J.E. Generation of a functional mammary gland from a single stem cell. Nat. Cell Biol. 2006, 439, 84–88. [Google Scholar] [CrossRef] [PubMed]
- Inman, J.L.; Robertson, C.; Mott, J.D.; Bissell, M.J. Mammary gland development: Cell fate specification, stem cells and the microenvironment. Development 2015, 142, 1028–1042. [Google Scholar] [CrossRef] [Green Version]
- Page, A.; Navarro, M.; Garín, M.; Pérez, P.; Casanova, M.L.; Moreno, R.; Jorcano, J.L.; Cascallana, J.L.; Bravo, A.; Ramirez, A. IKKbeta leads to an inflammatory skin disease resembling interface dermatitis. J. Investig. Dermatol. 2010, 130, 1598–1610. [Google Scholar] [CrossRef] [PubMed] [Green Version]
- Petrozza, V.; Pasciuti, G.; Pacchiarotti, A.; Tomao, F.; Zoratto, F.; Rossi, L.; Fontana, A.; Censi, F.; Sardella, B.; Di Cristofano, C.; et al. Breast adenomyoepithelioma: A case report with malignant proliferation of epithelial and myoepithelial elements. World J. Surg. Oncol. 2013, 11, 285. [Google Scholar] [CrossRef] [Green Version]
- Qureshi, A.; Kayani, N.; Gulzar, R. Malignant adenomyoepithelioma of the breast: A case report with review of literature. BMJ Case Rep. 2009, 2009, bcr0120091442. [Google Scholar] [CrossRef] [Green Version]
- Yoon, J.Y.; Chitale, D. Adenomyoepithelioma of the Breast: A Brief Diagnostic Review. Arch. Pathol. Lab. Med. 2013, 137, 725–729. [Google Scholar] [CrossRef] [Green Version]
- Szabo, G.K.; Vandenberg, L.N. The male mammary gland: A novel target of endocrine disrupting chemicals. Reproduction 2021, 162, F79–F89. [Google Scholar] [CrossRef]
- Barbareschi, M.; Pecciarini, L.; Cangi, M.G.; Macrì, E.; Rizzo, A.; Viale, G.; Doglioni, C. p63, a p53 Homologue, Is a Selective Nuclear Marker of Myoepithelial Cells of the Human Breast. Am. J. Surg. Pathol. 2001, 25, 1054–1060. [Google Scholar] [CrossRef]
- Perna, D.; Karreth, F.A.; Rust, A.; Perez-Mancera, P.A.; Rashid, M.; Iorio, F.; Alifrangis, C.; Arends, M.J.; Bosenberg, M.W.; Bollag, G.; et al. BRAF inhibitor resistance mediated by the AKT pathway in an oncogenic BRAF mouse melanoma model. Proc. Natl. Acad. Sci. USA 2015, 112, E536–E545. [Google Scholar] [CrossRef] [Green Version]
- Suárez-Cabrera, C.; Quintana, R.M.; Bravo, A.; Casanova, M.L.; Page, A.; Alameda, J.P.; Paramio, J.M.; Maroto, A.; Salamanca, J.; Depyu, A.J.; et al. A Transposon-based Analysis Reveals RASA1 Is Involved in Triple-Negative Breast Cancer. Cancer Res. 2017, 77, 1357–1368. [Google Scholar] [CrossRef] [PubMed] [Green Version]
- Ikink, G.J.; Boer, M.; Bakker, E.R.M.; Vendel-Zwaagstra, A.; Klijn, C.; Hoeve, J.T.; Jonkers, J.; Wessels, L.F.; Hilkens, J. Insertional mutagenesis in a HER2-positive breast cancer model reveals ERAS as a driver of cancer and therapy resistance. Oncogene 2018, 37, 1594–1609. [Google Scholar] [CrossRef] [Green Version]
- Klijn, C.; Koudijs, M.J.; Kool, J.; Hoeve, J.T.; Boer, M.; De Moes, J.; Akhtar, W.; Van Miltenburg, M.; Vendel-Zwaagstra, A.; Reinders, M.J.T.; et al. Analysis of Tumor Heterogeneity and Cancer Gene Networks Using Deep Sequencing of MMTV-Induced Mouse Mammary Tumors. PLoS ONE 2013, 8, e62113. [Google Scholar] [CrossRef] [PubMed] [Green Version]
- Theodorou, V.; Kimm, M.A.; Boer, M.; Wessels, L.; Theelen, W.; Jonkers, J.; Hilkens, J. MMTV insertional mutagenesis identifies genes, gene families and pathways involved in mammary cancer. Nat. Genet. 2007, 39, 759–769. [Google Scholar] [CrossRef] [PubMed]
- Kloosterman, W.P.; Braak, R.R.C.V.D.; Pieterse, M.; Van Roosmalen, M.J.; Sieuwerts, A.M.; Stangl, C.; Brunekreef, R.; Lalmahomed, Z.S.; Ooft, S.; Van Galen, A.; et al. A Systematic Analysis of Oncogenic Gene Fusions in Primary Colon Cancer. Cancer Res. 2017, 77, 3814–3822. [Google Scholar] [CrossRef] [PubMed] [Green Version]
- Kasai, S.; Mimura, J.; Ozaki, T.; Itoh, K. Emerging Regulatory Role of Nrf2 in Iron, Heme, and Hemoglobin Metabolism in Physiology and Disease. Front. Veter. Sci. 2018, 5, 242. [Google Scholar] [CrossRef] [Green Version]
- Yanagawa, T.; Itoh, K.; Uwayama, J.; Shibata, Y.; Yamaguchi, A.; Sano, T.; Ishii, T.; Yoshida, H.; Yamamoto, M. Nrf2 deficiency causes tooth decolourization due to iron transport disorder in enamel organ. Genes Cells 2004, 9, 641–651. [Google Scholar] [CrossRef] [PubMed] [Green Version]
- Blackburn, J.; Kawasaki, K.; Porntaveetus, T.; Kawasaki, M.; Otsuka-Tanaka, Y.; Miake, Y.; Ota, M.S.; Watanabe, M.; Hishinuma, M.; Nomoto, T.; et al. Excess NF-kappa B Induces Ectopic Odontogenesis in Embryonic Incisor Epithelium. J. Dent. Res. 2015, 94, 121–128. [Google Scholar] [CrossRef]
- Page, A.; Bravo, A.; Suarez-Cabrera, C.; Sanchez-Baltasar, R.; Oteo, M.; Morcillo, M.A.; Casanova, M.L.; Segovia, J.C.; Navarro, M.; Ramirez, A. IKKbeta overexpression together with a lack of tumour suppressor genes causes ameloblastic odontomas in mice. Int. J. Oral. Sci. 2020, 12, 1. [Google Scholar] [CrossRef] [Green Version]
- Yamada, A.; Kawasaki, M.; Miake, Y.; Yamada, Y.; Blackburn, J.; Kawasaki, K.; Trakanant, S.; Nagai, T.; Nihara, J.; Kudo, T.; et al. Overactivation of the NF-kappaB pathway impairs molar enamel formation. Oral Dis. 2020, 26, 1513–1522. [Google Scholar] [CrossRef]
- Manor, J.; Lalani, S.R. Overgrowth Syndromes-Evaluation, Diagnosis, and Management. Front. Pediatr. 2020, 8, 574857. [Google Scholar] [CrossRef] [PubMed]
- Yehia, L.; Keel, E.; Eng, C. The Clinical Spectrum of PTEN Mutations. Annu. Rev. Med. 2020, 71, 103–116. [Google Scholar] [CrossRef] [Green Version]
- Riller, Q.; Rieux-Laucat, F. RASopathies: From germline mutations to somatic and multigenic diseases. Biomed. J. 2021, 44, 422–432. [Google Scholar] [CrossRef]
- Kang, M.; Lee, Y.-S. The impact of RASopathy-associated mutations on CNS development in mice and humans. Mol. Brain 2019, 12, 1–17. [Google Scholar] [CrossRef] [Green Version]
- Ramirez, A.; Bravo, A.; Jorcano, J.L.; Vidal, M. Sequences 5′ of the bovine keratin 5 gene direct tissue- and cell-type-specific expression of a lacZ gene in the adult and during development. Differerentiation 1994, 58, 53–64. [Google Scholar] [CrossRef] [PubMed]
- Gonzalez-Suarez, E.; Samper, E.; Ramirez, A.; Flores, J.M.; Martín-Caballero, J.; Jorcano, J.L.; Blasco, M.A. Increased epidermal tumors and increased skin wound healing in transgenic mice overexpressing the catalytic subunit of telomerase, mTERT, in basal keratinocytes. EMBO J. 2001, 20, 2619–2630. [Google Scholar] [CrossRef] [Green Version]
- Kiguchi, K.; Bol, D.; Carbajal, S.; Beltran, L.; Moats, S.; Chan, K.; Jorcano, J.; DiGiovanni, J. Constitutive expression of erbB2 in epidermis of transgenic mice results in epidermal hyperproliferation and spon-taneous skin tumor development. Oncogene 2000, 19, 4243–4254. [Google Scholar] [CrossRef] [PubMed] [Green Version]
- Robles, A.; Larcher, F.; Whalin, R.B.; Murillas, R.; Richie, E.; Gimenez-Conti, I.B.; Jorcano, J.L.; Conti, C.J. Expression of cyclin D1 in epithelial tissues of transgenic mice results in epidermal hyperproliferation and severe thymic hyperplasia. Proc. Natl. Acad. Sci. USA 1996, 93, 7634–7638. [Google Scholar] [CrossRef] [Green Version]
- Segrelles, C.; Lu, J.; Hammann, B.; Santos, M.; Moral, M.; Cascallana, J.L.; Lara, M.F.; Rho, O.; Carbajal, S.; Traag, J.; et al. Deregulated Activity of Akt in Epithelial Basal Cells Induces Spontaneous Tumors and Heightened Sensitivity to Skin Carcinogenesis. Cancer Res. 2007, 67, 10879–10888. [Google Scholar] [CrossRef] [Green Version]


Publisher’s Note: MDPI stays neutral with regard to jurisdictional claims in published maps and institutional affiliations. |
© 2021 by the authors. Licensee MDPI, Basel, Switzerland. This article is an open access article distributed under the terms and conditions of the Creative Commons Attribution (CC BY) license (https://creativecommons.org/licenses/by/4.0/).
Share and Cite
Suarez-Cabrera, C.; Ojeda-Perez, I.; Sanchez-Baltasar, R.; Page, A.; Bravo, A.; Navarro, M.; Ramirez, A. ERAS, a Member of the Ras Superfamily, Acts as an Oncoprotein in the Mammary Gland. Cancers 2021, 13, 5588. https://0-doi-org.brum.beds.ac.uk/10.3390/cancers13215588
Suarez-Cabrera C, Ojeda-Perez I, Sanchez-Baltasar R, Page A, Bravo A, Navarro M, Ramirez A. ERAS, a Member of the Ras Superfamily, Acts as an Oncoprotein in the Mammary Gland. Cancers. 2021; 13(21):5588. https://0-doi-org.brum.beds.ac.uk/10.3390/cancers13215588
Chicago/Turabian StyleSuarez-Cabrera, Cristian, Isabel Ojeda-Perez, Raquel Sanchez-Baltasar, Angustias Page, Ana Bravo, Manuel Navarro, and Angel Ramirez. 2021. "ERAS, a Member of the Ras Superfamily, Acts as an Oncoprotein in the Mammary Gland" Cancers 13, no. 21: 5588. https://0-doi-org.brum.beds.ac.uk/10.3390/cancers13215588