
MAPK Inhibition Requires Active RAC1 Signaling to Effectively Improve Iodide Uptake by Thyroid Follicular Cells

 , ,
, ,  , and
, and 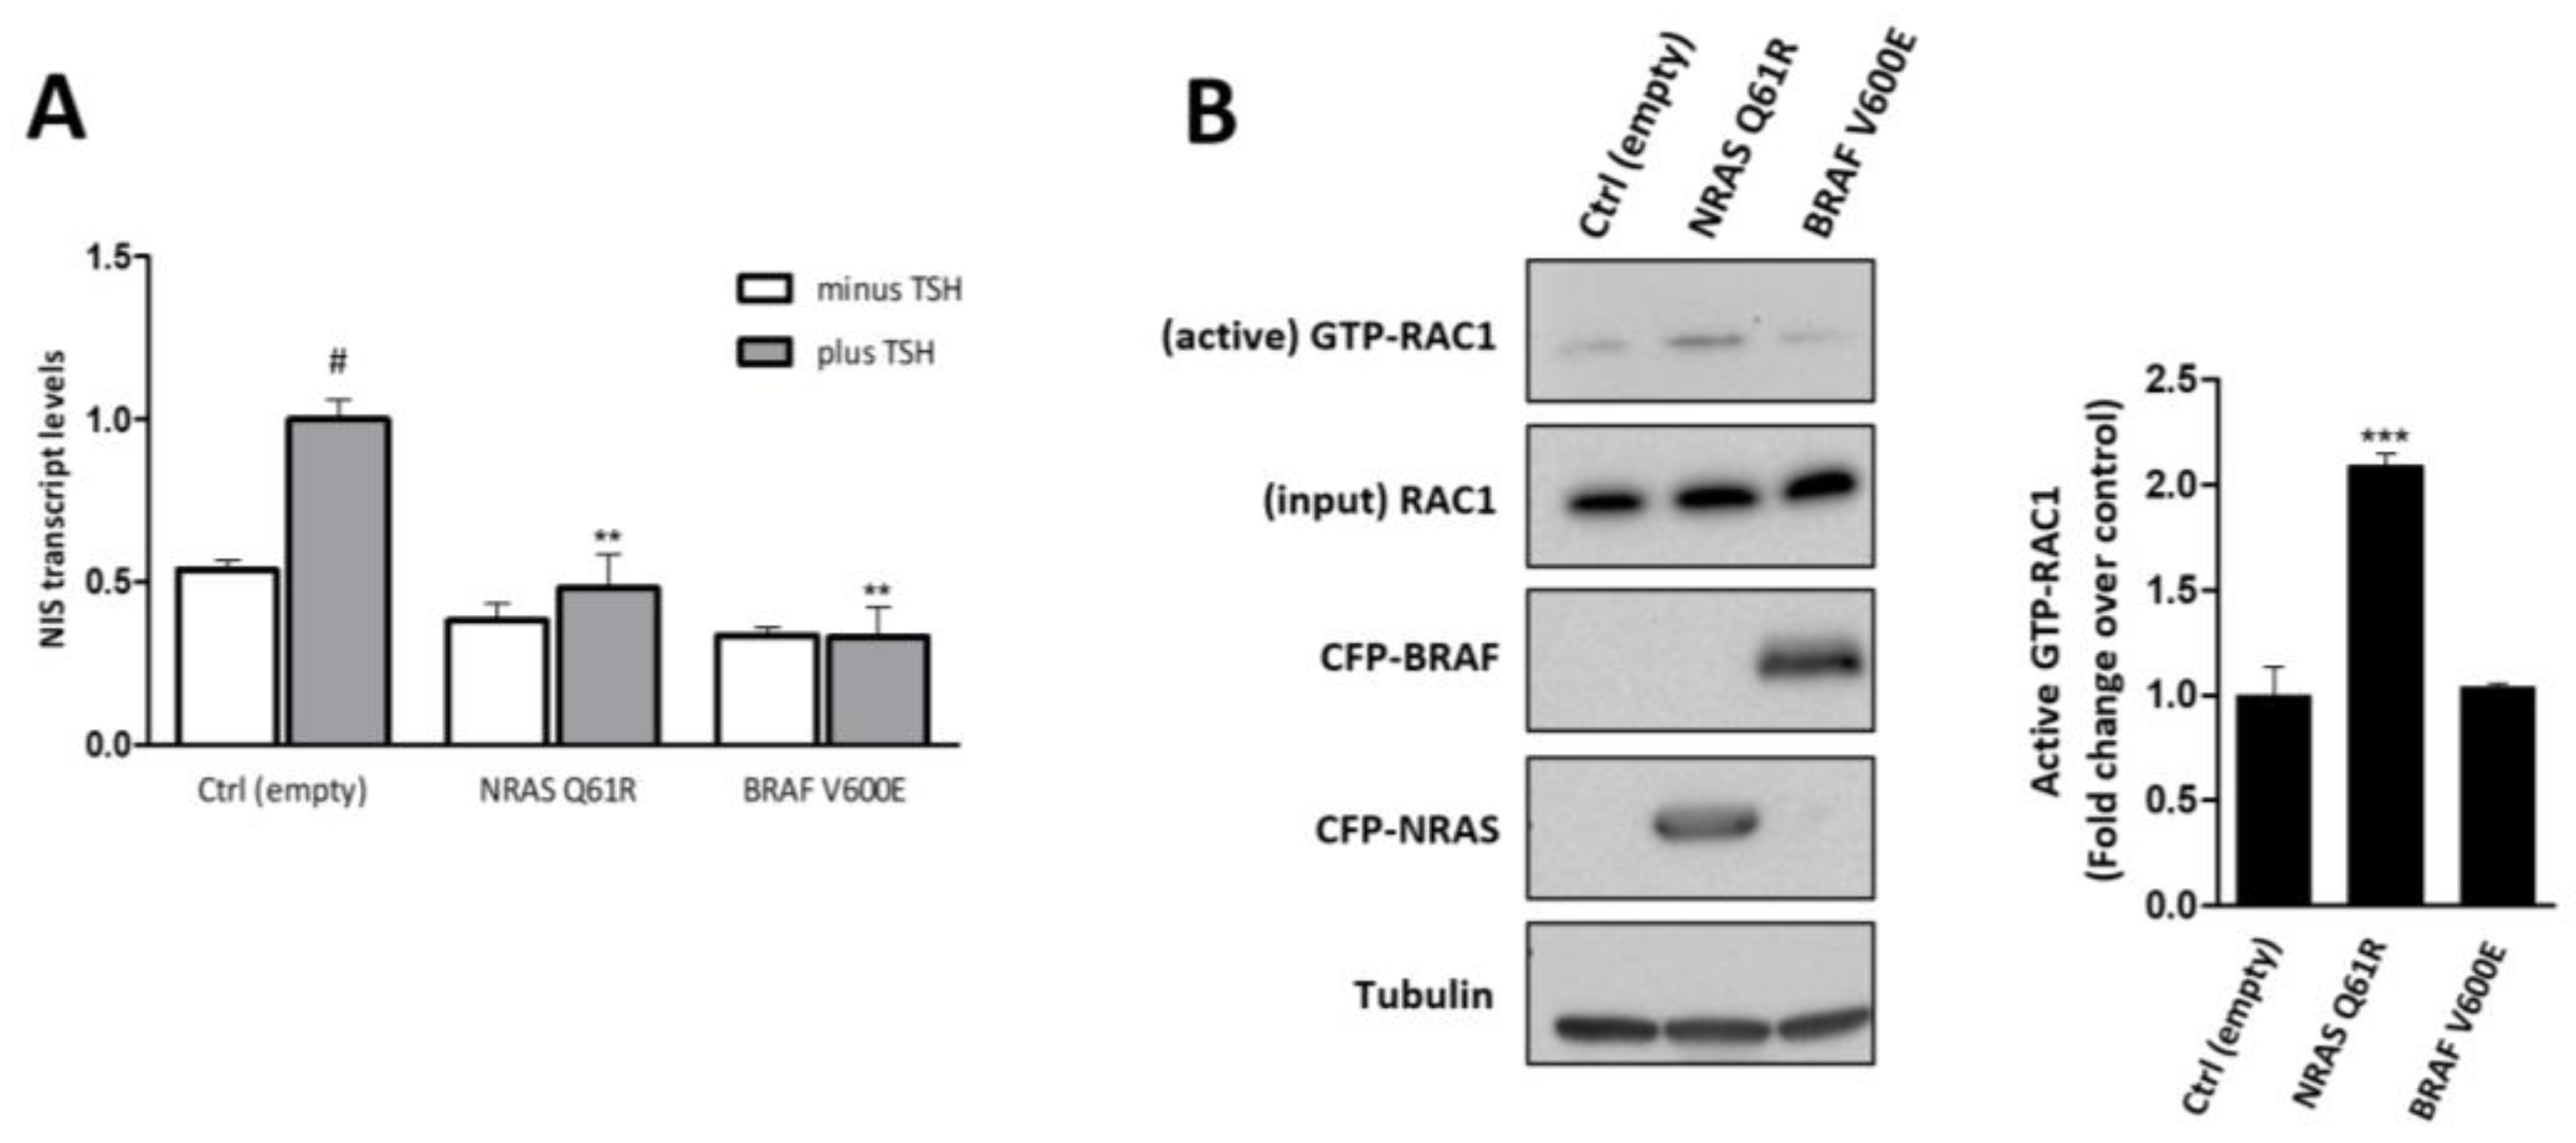
Abstract
:Simple Summary
Abstract
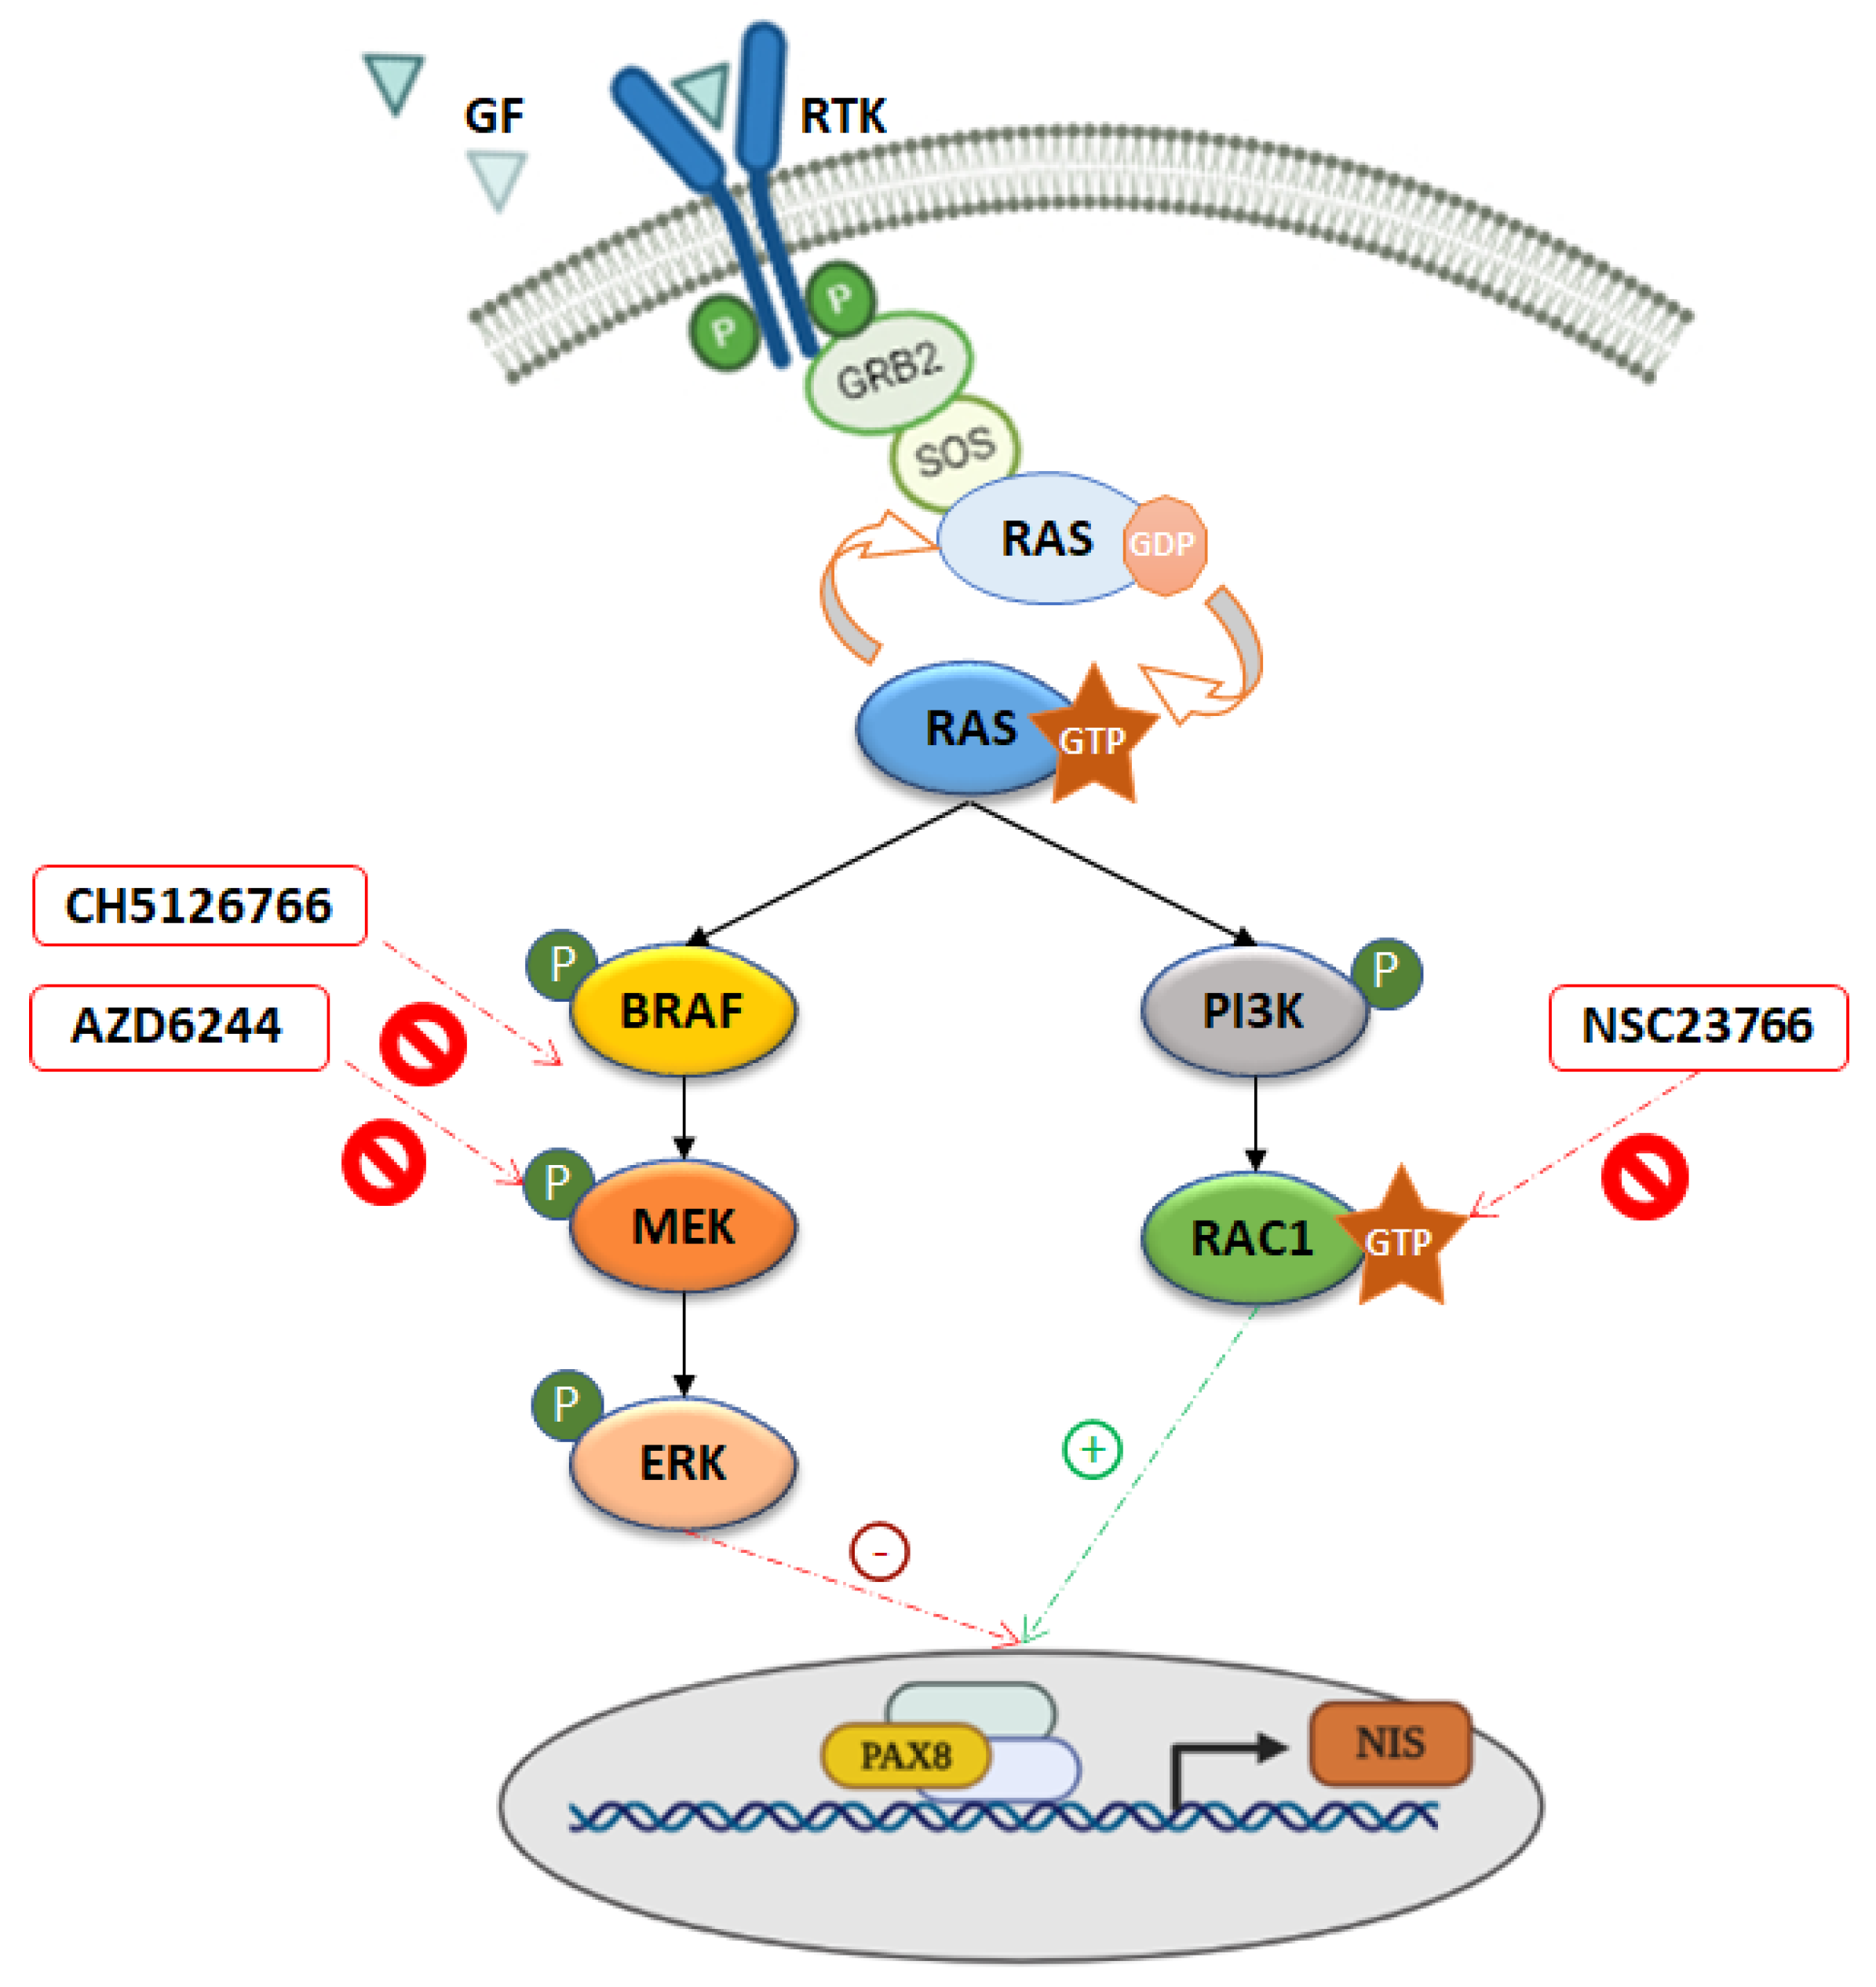
1. Introduction
2. Materials and Methods
2.1. Cell Lines and Culture Conditions
2.2. Plasmids and Transfections
2.3. Lentiviral Production and Cell Transductions
2.4. RNA Extraction and RT-qPCR
2.5. CRIB Pull-Down Assays for RAC1 Activation Status
2.6. Cell Surface Protein Biotinylation Assay
2.7. Western Blot
2.8. HS-YFP–Based Iodide Influx Assay
2.9. Statistical Analysis
3. Results
3.1. Both NRAS Q61R and BRAF V600E Decrease NIS Expression, but Only NRAS Q61R Promotes RAC1 Activation
3.2. MEK Inhibition Reverts the Negative Effect of NRAS Q61R on NIS Transcript Levels but Not That of BRAF V600E
3.3. Inhibition of RAC1 Signaling Hampers the Rescue of NIS Expression Mediated by MEK Inhibitors in NRAS Q61R Cells
3.4. RAC1 Activity Potentiates the Positive Impact on NIS Expression Induced by MEK Inhibition in the Context of Malignant Thyroid with BRAF V600E Genetic Background
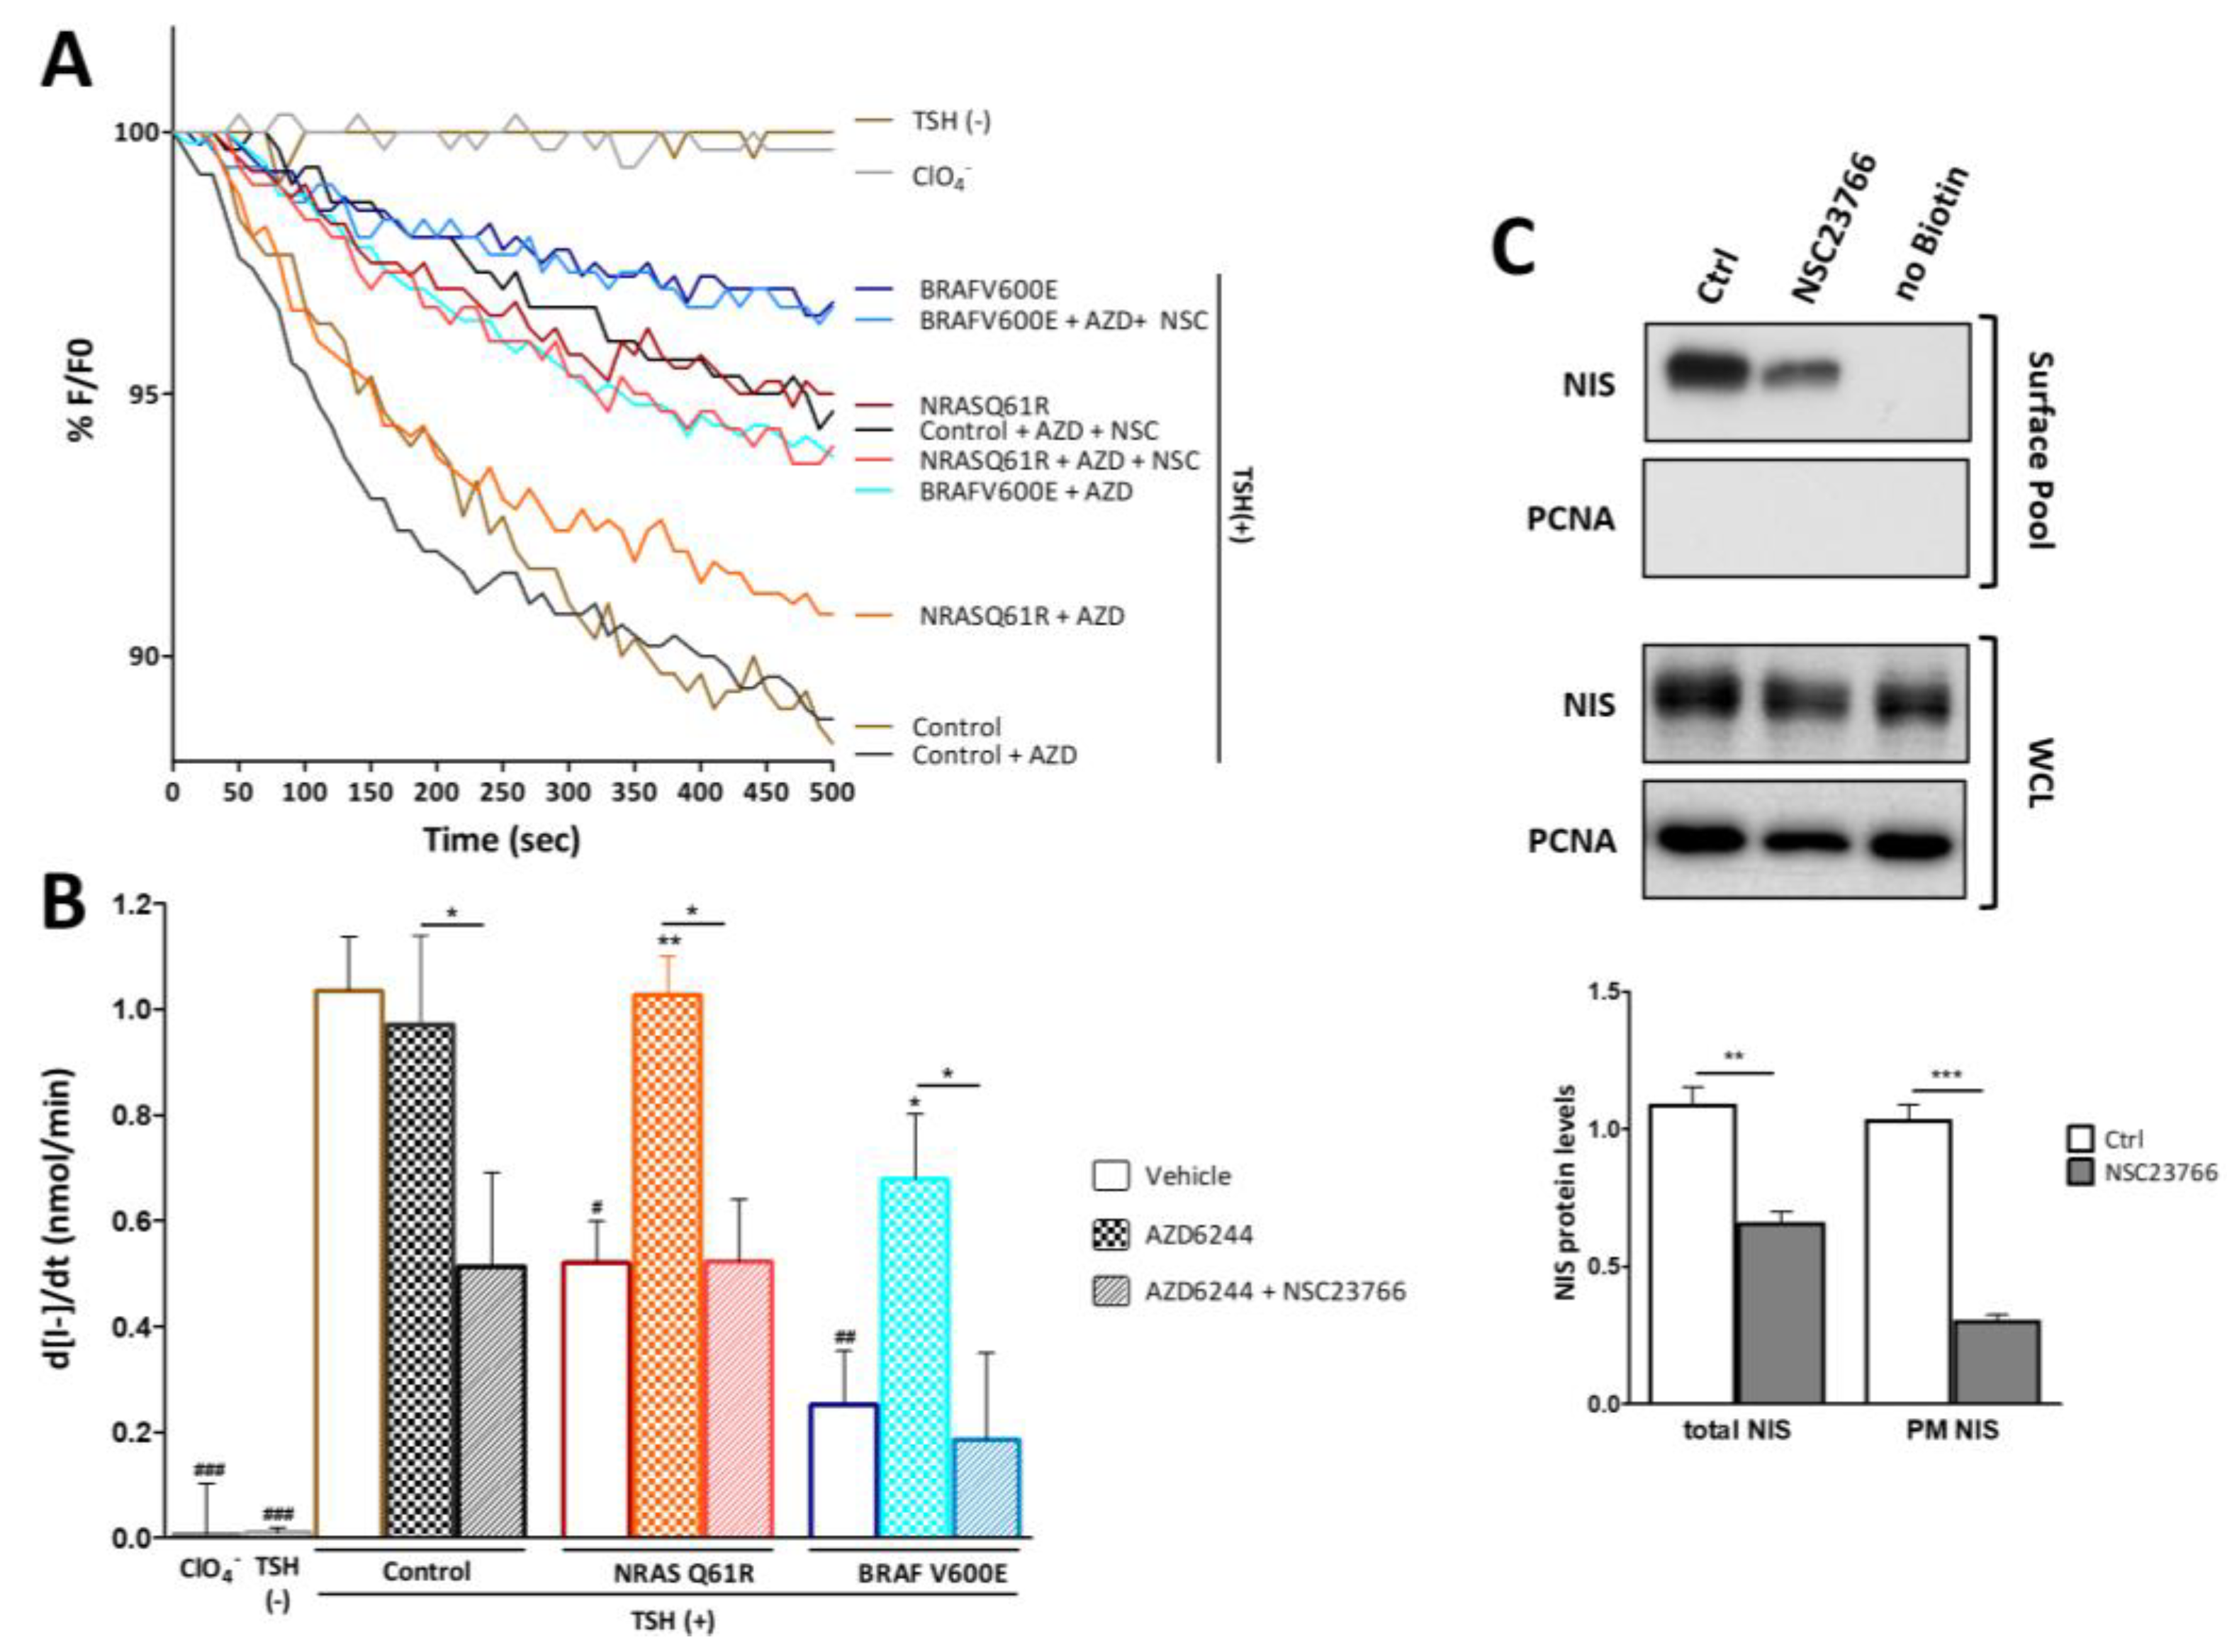
3.5. RAC1 Activity Modulates the Effect of MEK Signaling on Iodide Uptake
3.6. RAC1 Signaling Modulates the Impact of MEK Activation on NIS Post-Translational Events
4. Discussion
5. Conclusions
Supplementary Materials
Author Contributions
Funding
Institutional Review Board Statement
Informed Consent Statement
Data Availability Statement
Acknowledgments
Conflicts of Interest
References
- Ravera, S.; Reyna-Neyra, A.; Ferrandino, G.; Amzel, L.M.; Carrasco, N. The Sodium/Iodide Symporter (NIS): Molecular Physiology and Preclinical and Clinical Applications. Annu. Rev. Physiol. 2017, 79, 261–289. [Google Scholar] [CrossRef] [Green Version]
- Cooper, D.S.; Doherty, G.M.; Haugen, B.R.; Kloos, R.T.; Lee, S.L.; Mandel, S.J.; Mazzaferri, E.L.; McIver, B.; Sherman, S.I.; Tuttle, R.M. Management Guidelines for Patients with Thyroid Nodules and Differentiated Thyroid Cancer. Thyroid 2006, 16, 109–142. [Google Scholar] [CrossRef] [PubMed] [Green Version]
- Kogai, T.; Brent, G.A. The Sodium Iodide Symporter (NIS): Regulation and Approaches to Targeting for Cancer Therapeutics. Pharmacol. Ther. 2012, 135, 355–370. [Google Scholar] [CrossRef] [PubMed] [Green Version]
- Taki, K.; Kogai, T.; Kanamoto, Y.; Hershman, J.M.; Brent, G.A. A Thyroid-Specific Far-Upstream Enhancer in the Human Sodium/Iodide Symporter Gene Requires Pax-8 Binding and Cyclic Adenosine 3′,5′-Monophosphate Response Element-like Sequence Binding Proteins for Full Activity and Is Differentially Regulated in Normal and Thyroid Cancer Cells. Mol. Endocrinol. 2002, 16, 2266–2282. [Google Scholar] [CrossRef] [Green Version]
- D’Agostino, M.; Sponziello, M.; Puppin, C.; Celano, M.; Maggisano, V.; Baldan, F.; Biffoni, M.; Bulotta, S.; Durante, C.; Filetti, S.; et al. Different Expression of TSH Receptor and NIS Genes in Thyroid Cancer: Role of Epigenetics. J. Mol. Endocrinol. 2014, 52, 121–131. [Google Scholar] [CrossRef] [Green Version]
- Lakshmanan, A.; Scarberry, D.; Shen, D.H.; Jhiang, S.M. Modulation of Sodium Iodide Symporter in Thyroid Cancer. Horm Cancer 2014, 5, 363–373. [Google Scholar] [CrossRef] [Green Version]
- Bhaijee, F.; Nikiforov, Y.E. Molecular Analysis of Thyroid Tumors. Endocr. Pathol. 2011, 22, 126–133. [Google Scholar] [CrossRef] [PubMed]
- Romitti, M.; Ceolin, L.; Siqueira, D.R.; Ferreira, C.V.; Wajner, S.M.; Maia, A.L. Signaling Pathways in Follicular Cell-Derived Thyroid Carcinomas (Review). Int. J. Oncol. 2013, 42, 19–28. [Google Scholar] [CrossRef] [Green Version]
- Hou, P.; Bojdani, E.; Xing, M. Induction of Thyroid Gene Expression and Radioiodine Uptake in Thyroid Cancer Cells by Targeting Major Signaling Pathways. J. Clin. Endocrinol. Metab. 2010, 95, 820–828. [Google Scholar] [CrossRef] [Green Version]
- Nikiforov, Y.E.; Nikiforova, M.N. Molecular Genetics and Diagnosis of Thyroid Cancer. Nat. Rev. Endocrinol. 2011, 7, 569–580. [Google Scholar] [CrossRef]
- Kimura, E.T.; Nikiforova, M.N.; Zhu, Z.; Knauf, J.A.; Nikiforov, Y.E.; Fagin, J.A. High Prevalence of BRAF Mutations in Thyroid Cancer: Genetic Evidence for Constitutive Activation of the RET/PTC-RAS-BRAF Signaling Pathway in Papillary Thyroid Carcinoma. Cancer Res. 2003, 63, 1454–1457. [Google Scholar] [PubMed]
- Davies, H.; Bignell, G.R.; Cox, C.; Stephens, P.; Edkins, S.; Clegg, S.; Teague, J.; Woffendin, H.; Garnett, M.J.; Bottomley, W.; et al. Mutations of the BRAF Gene in Human Cancer. Nature 2002, 417, 949–954. [Google Scholar] [CrossRef] [PubMed]
- Xing, M.; Alzahrani, A.S.; Carson, K.A.; Viola, D.; Elisei, R.; Bendlova, B.; Yip, L.; Mian, C.; Vianello, F.; Tuttle, R.M.; et al. Association Between BRAF V600E Mutation and Mortality in Patients With Papillary Thyroid Cancer. JAMA 2013, 309, 1493–1501. [Google Scholar] [CrossRef] [PubMed] [Green Version]
- Bastos, A.U.; Oler, G.; Nozima, B.H.N.; Moysés, R.A.; Cerutti, J.M. BRAF V600E and Decreased NIS and TPO Expression Are Associated with Aggressiveness of a Subgroup of Papillary Thyroid Microcarcinoma. Eur. J. Endocrinol. 2015, 173, 525–540. [Google Scholar] [CrossRef] [Green Version]
- Tavares, C.; Coelho, M.J.; Eloy, C.; Melo, M.; da Rocha, A.G.; Pestana, A.; Batista, R.; Ferreira, L.B.; Rios, E.; Selmi-Ruby, S.; et al. NIS Expression in Thyroid Tumors, Relation with Prognosis Clinicopathological and Molecular Features. Endocr. Connect. 2018, 7, 78–90. [Google Scholar] [CrossRef]
- Riesco-Eizaguirre, G.; Gutiérrez-Martínez, P.; García-Cabezas, M.A.; Nistal, M.; Santisteban, P. The Oncogene BRAFV600E Is Associated with a High Risk of Recurrence and Less Differentiated Papillary Thyroid Carcinoma Due to the Impairment of Na+/I− Targeting to the Membrane. Endocr.-Relat. Cancer 2006, 13, 257–269. [Google Scholar] [CrossRef] [PubMed]
- Durante, C.; Puxeddu, E.; Ferretti, E.; Morisi, R.; Moretti, S.; Bruno, R.; Barbi, F.; Avenia, N.; Scipioni, A.; Verrienti, A.; et al. BRAF Mutations in Papillary Thyroid Carcinomas Inhibit Genes Involved in Iodine Metabolism. J. Clin. Endocrinol. Metab. 2007, 92, 2840–2843. [Google Scholar] [CrossRef] [Green Version]
- Romei, C.; Ciampi, R.; Faviana, P.; Agate, L.; Molinaro, E.; Bottici, V.; Basolo, F.; Miccoli, P.; Pacini, F.; Pinchera, A.; et al. BRAFV600E Mutation, but Not RET/PTC Rearrangements, Is Correlated with a Lower Expression of Both Thyroperoxidase and Sodium Iodide Symporter Genes in Papillary Thyroid Cancer in: Endocrine-Related Cancer Volume 15 Issue 2. 2008. Available online: https://erc.bioscientifica.com/view/journals/erc/15/2/511.xml (accessed on 22 April 2020).
- Espadinha, C.; Santos, J.R.; Sobrinho, L.G.; Bugalho, M.J. Expression of Iodine Metabolism Genes in Human Thyroid Tissues: Evidence for Age and BRAFV600E Mutation Dependency. Clin. Endocrinol. 2009, 70, 629–635. [Google Scholar] [CrossRef]
- Yazgan, A.; Yıldırım, N.; Gözalan, A.; Gümüştaş, S.; Kılıçarslan, A.; Balci, S.; Aydın, C.; Ersoy, R.; Cakir, B.; Güler, G. The Correlation of Sodium Iodide Symporter and BRAFV600E Mutation in Classical Variant Papillary Thyroid Carcinoma. Ann. Diagn. Pathol. 2016, 22, 58–62. [Google Scholar] [CrossRef]
- Marotta, V.; Sciammarella, C.; Vitale, M.; Colao, A.; Faggiano, A. The Evolving Field of Kinase Inhibitors in Thyroid Cancer. Crit. Rev. Oncol. Hematol. 2015, 93, 60–73. [Google Scholar] [CrossRef] [Green Version]
- Cheng, L.; Jin, Y.; Liu, M.; Ruan, M.; Chen, L. HER Inhibitor Promotes BRAF/MEK Inhibitor-Induced Redifferentiation in Papillary Thyroid Cancer Harboring BRAFV600E. Oncotarget 2017, 8, 19843–19854. [Google Scholar] [CrossRef] [Green Version]
- Iravani, A.; Solomon, B.; Pattison, D.A.; Jackson, P.; Ravi Kumar, A.; Kong, G.; Hofman, M.S.; Akhurst, T.; Hicks, R.J. Mitogen-Activated Protein Kinase Pathway Inhibition for Redifferentiation of Radioiodine Refractory Differentiated Thyroid Cancer: An Evolving Protocol. Thyroid 2019, 29, 1634–1645. [Google Scholar] [CrossRef]
- Ullmann, T.M.; Liang, H.; Moore, M.D.; Al-Jamed, I.; Gray, K.D.; Limberg, J.; Stefanova, D.; Buicko, J.L.; Finnerty, B.; Beninato, T.; et al. Dual Inhibition of BRAF and MEK Increases Expression of Sodium Iodide Symporter in Patient-Derived Papillary Thyroid Cancer Cells in Vitro. Surgery 2020, 167, 56–63. [Google Scholar] [CrossRef] [PubMed]
- Ho, A.L.; Grewal, R.K.; Leboeuf, R.; Sherman, E.J.; Pfister, D.G.; Deandreis, D.; Pentlow, K.S.; Zanzonico, P.B.; Haque, S.; Gavane, S.; et al. Selumetinib-Enhanced Radioiodine Uptake in Advanced Thyroid Cancer. N. Engl. J. Med. 2013, 368, 623–632. [Google Scholar] [CrossRef] [PubMed] [Green Version]
- Fu, H.; Cheng, L.; Jin, Y.; Cheng, L.; Liu, M.; Chen, L. MAPK Inhibitors Enhance HDAC Inhibitor-Induced Redifferentiation in Papillary Thyroid Cancer Cells Harboring BRAF V600E: An In Vitro Study. Mol. Oncolytics 2019, 12, 235–245. [Google Scholar] [CrossRef] [PubMed] [Green Version]
- Chakravarty, D.; Santos, E.; Ryder, M.; Knauf, J.A.; Liao, X.-H.; West, B.L.; Bollag, G.; Kolesnick, R.; Thin, T.H.; Rosen, N.; et al. Small-Molecule MAPK Inhibitors Restore Radioiodine Incorporation in Mouse Thyroid Cancers with Conditional BRAF Activation. J. Clin. Investig. 2011, 121, 4700–4711. [Google Scholar] [CrossRef] [Green Version]
- Heasman, S.J.; Ridley, A.J. Mammalian Rho GTPases: New Insights into Their Functions from in Vivo Studies. Nat. Rev. Mol. Cell Biol. 2008, 9, 690–701. [Google Scholar] [CrossRef] [PubMed]
- Byun, J.-Y.; Kim, M.-J.; Yoon, C.-H.; Cha, H.; Yoon, G.; Lee, S.-J. Oncogenic Ras Signals through Activation of Both Phosphoinositide 3-Kinase and Rac1 to Induce c-Jun NH2-Terminal Kinase–Mediated, Caspase-Independent Cell Death. Mol. Cancer Res. 2009, 7, 1534–1542. [Google Scholar] [CrossRef] [PubMed] [Green Version]
- Li, A.; Ma, Y.; Jin, M.; Mason, S.; Mort, R.L.; Blyth, K.; Larue, L.; Sansom, O.J.; Machesky, L.M. Activated Mutant NRasQ61K Drives Aberrant Melanocyte Signaling, Survival, and Invasiveness via a Rac1-Dependent Mechanism. J. Investig. Derm. 2012, 132, 2610–2621. [Google Scholar] [CrossRef] [Green Version]
- Bright, M.D.; Clarke, P.A.; Workman, P.; Davies, F.E. Oncogenic RAC1 and NRAS Drive Resistance to Endoplasmic Reticulum Stress through MEK/ERK Signalling. Cell Signal 2018, 44, 127–137. [Google Scholar] [CrossRef]
- Faria, M.; Félix, D.; Domingues, R.; Bugalho, M.J.; Matos, P.; Silva, A.L. Antagonistic Effects of RAC1 and Tumor-Related RAC1b on NIS Expression in Thyroid. J. Mol. Endocrinol. 2019, 63, 309–320. [Google Scholar] [CrossRef]
- Faria, M.; Domingues, R.; Bugalho, M.J.; Silva, A.L.; Matos, P. Analysis of NIS Plasma Membrane Interactors Discloses Key Regulation by a SRC/RAC1/PAK1/PIP5K/EZRIN Pathway with Potential Implications for Radioiodine Re-Sensitization Therapy in Thyroid Cancer. Cancers 2021, 13, 5460. [Google Scholar] [CrossRef] [PubMed]
- Matos, P.; Collard, J.G.; Jordan, P. Tumor-Related Alternatively Spliced Rac1b Is Not Regulated by Rho-GDP Dissociation Inhibitors and Exhibits Selective Downstream Signaling. J. Biol. Chem. 2003, 278, 50442–50448. [Google Scholar] [CrossRef] [Green Version]
- Scudieri, P.; Musante, I.; Gianotti, A.; Moran, O.; Galietta, L.J.V. Intermolecular Interactions in the TMEM16A Dimer Controlling Channel Activity. Sci. Rep. 2016, 6, 38788. [Google Scholar] [CrossRef] [PubMed] [Green Version]
- Ishii, N.; Harada, N.; Joseph, E.W.; Ohara, K.; Miura, T.; Sakamoto, H.; Matsuda, Y.; Tomii, Y.; Tachibana-Kondo, Y.; Iikura, H.; et al. Enhanced Inhibition of ERK Signaling by a Novel Allosteric MEK Inhibitor, CH5126766, That Suppresses Feedback Reactivation of RAF Activity. Cancer Res. 2013, 73, 4050–4060. [Google Scholar] [CrossRef] [PubMed] [Green Version]
- Matos, A.M.; Gomes-Duarte, A.; Faria, M.; Barros, P.; Jordan, P.; Amaral, M.D.; Matos, P. Prolonged Co-Treatment with HGF Sustains Epithelial Integrity and Improves Pharmacological Rescue of Phe508del-CFTR. Sci. Rep. 2018, 8, 13026. [Google Scholar] [CrossRef] [PubMed]
- Faria, M.; Matos, P.; Pereira, T.; Cabrera, R.; Cardoso, B.A.; Bugalho, M.J.; Silva, A.L. RAC1b Overexpression Stimulates Proliferation and NF-KB-Mediated Anti-Apoptotic Signaling in Thyroid Cancer Cells. PLoS ONE 2017, 12, e0172689. [Google Scholar] [CrossRef] [PubMed] [Green Version]
- Oh, J.M.; Ahn, B.-C. Molecular Mechanisms of Radioactive Iodine Refractoriness in Differentiated Thyroid Cancer: Impaired Sodium Iodide Symporter (NIS) Expression Owing to Altered Signaling Pathway Activity and Intracellular Localization of NIS. Theranostics 2021, 11, 6251–6277. [Google Scholar] [CrossRef]
- Pratilas, C.A.; Solit, D.B. Targeting the Mitogen-Activated Protein Kinase Pathway: Physiological Feedback and Drug Response. Clin. Cancer Res. 2010, 16, 3329–3334. [Google Scholar] [CrossRef] [Green Version]
- Duncan, J.S.; Whittle, M.C.; Nakamura, K.; Abell, A.N.; Midland, A.A.; Zawistowski, J.S.; Johnson, N.L.; Granger, D.A.; Jordan, N.V.; Darr, D.B.; et al. Dynamic Reprogramming of the Kinome in Response to Targeted MEK Inhibition in Triple-Negative Breast Cancer. Cell 2012, 149, 307–321. [Google Scholar] [CrossRef] [Green Version]
- Nagarajah, J.; Le, M.; Knauf, J.A.; Ferrandino, G.; Montero-Conde, C.; Pillarsetty, N.; Bolaender, A.; Irwin, C.; Krishnamoorthy, G.P.; Saqcena, M.; et al. Sustained ERK Inhibition Maximizes Responses of BrafV600E Thyroid Cancers to Radioiodine. J. Clin. Investig. 2016, 126, 4119–4124. [Google Scholar] [CrossRef] [PubMed] [Green Version]
- Jensen, H.H.; Login, F.H.; Park, J.-Y.; Kwon, T.-H.; Nejsum, L.N. Immunohistochemical Evalulation of Activated Ras and Rac1 as Potential Downstream Effectors of Aquaporin-5 in Breast Cancer in Vivo. Biochem. Biophys. Res. Commun. 2017, 493, 1210–1216. [Google Scholar] [CrossRef] [PubMed]


Publisher’s Note: MDPI stays neutral with regard to jurisdictional claims in published maps and institutional affiliations. |
© 2021 by the authors. Licensee MDPI, Basel, Switzerland. This article is an open access article distributed under the terms and conditions of the Creative Commons Attribution (CC BY) license (https://creativecommons.org/licenses/by/4.0/).
Share and Cite
Faria, M.; Domingues, R.; Bugalho, M.J.; Matos, P.; Silva, A.L. MAPK Inhibition Requires Active RAC1 Signaling to Effectively Improve Iodide Uptake by Thyroid Follicular Cells. Cancers 2021, 13, 5861. https://0-doi-org.brum.beds.ac.uk/10.3390/cancers13225861
Faria M, Domingues R, Bugalho MJ, Matos P, Silva AL. MAPK Inhibition Requires Active RAC1 Signaling to Effectively Improve Iodide Uptake by Thyroid Follicular Cells. Cancers. 2021; 13(22):5861. https://0-doi-org.brum.beds.ac.uk/10.3390/cancers13225861
Chicago/Turabian StyleFaria, Márcia, Rita Domingues, Maria João Bugalho, Paulo Matos, and Ana Luísa Silva. 2021. "MAPK Inhibition Requires Active RAC1 Signaling to Effectively Improve Iodide Uptake by Thyroid Follicular Cells" Cancers 13, no. 22: 5861. https://0-doi-org.brum.beds.ac.uk/10.3390/cancers13225861