
A Novel Therapeutic Target for Small-Cell Lung Cancer: Tumor-Associated Repair-like Schwann Cells

 and
and 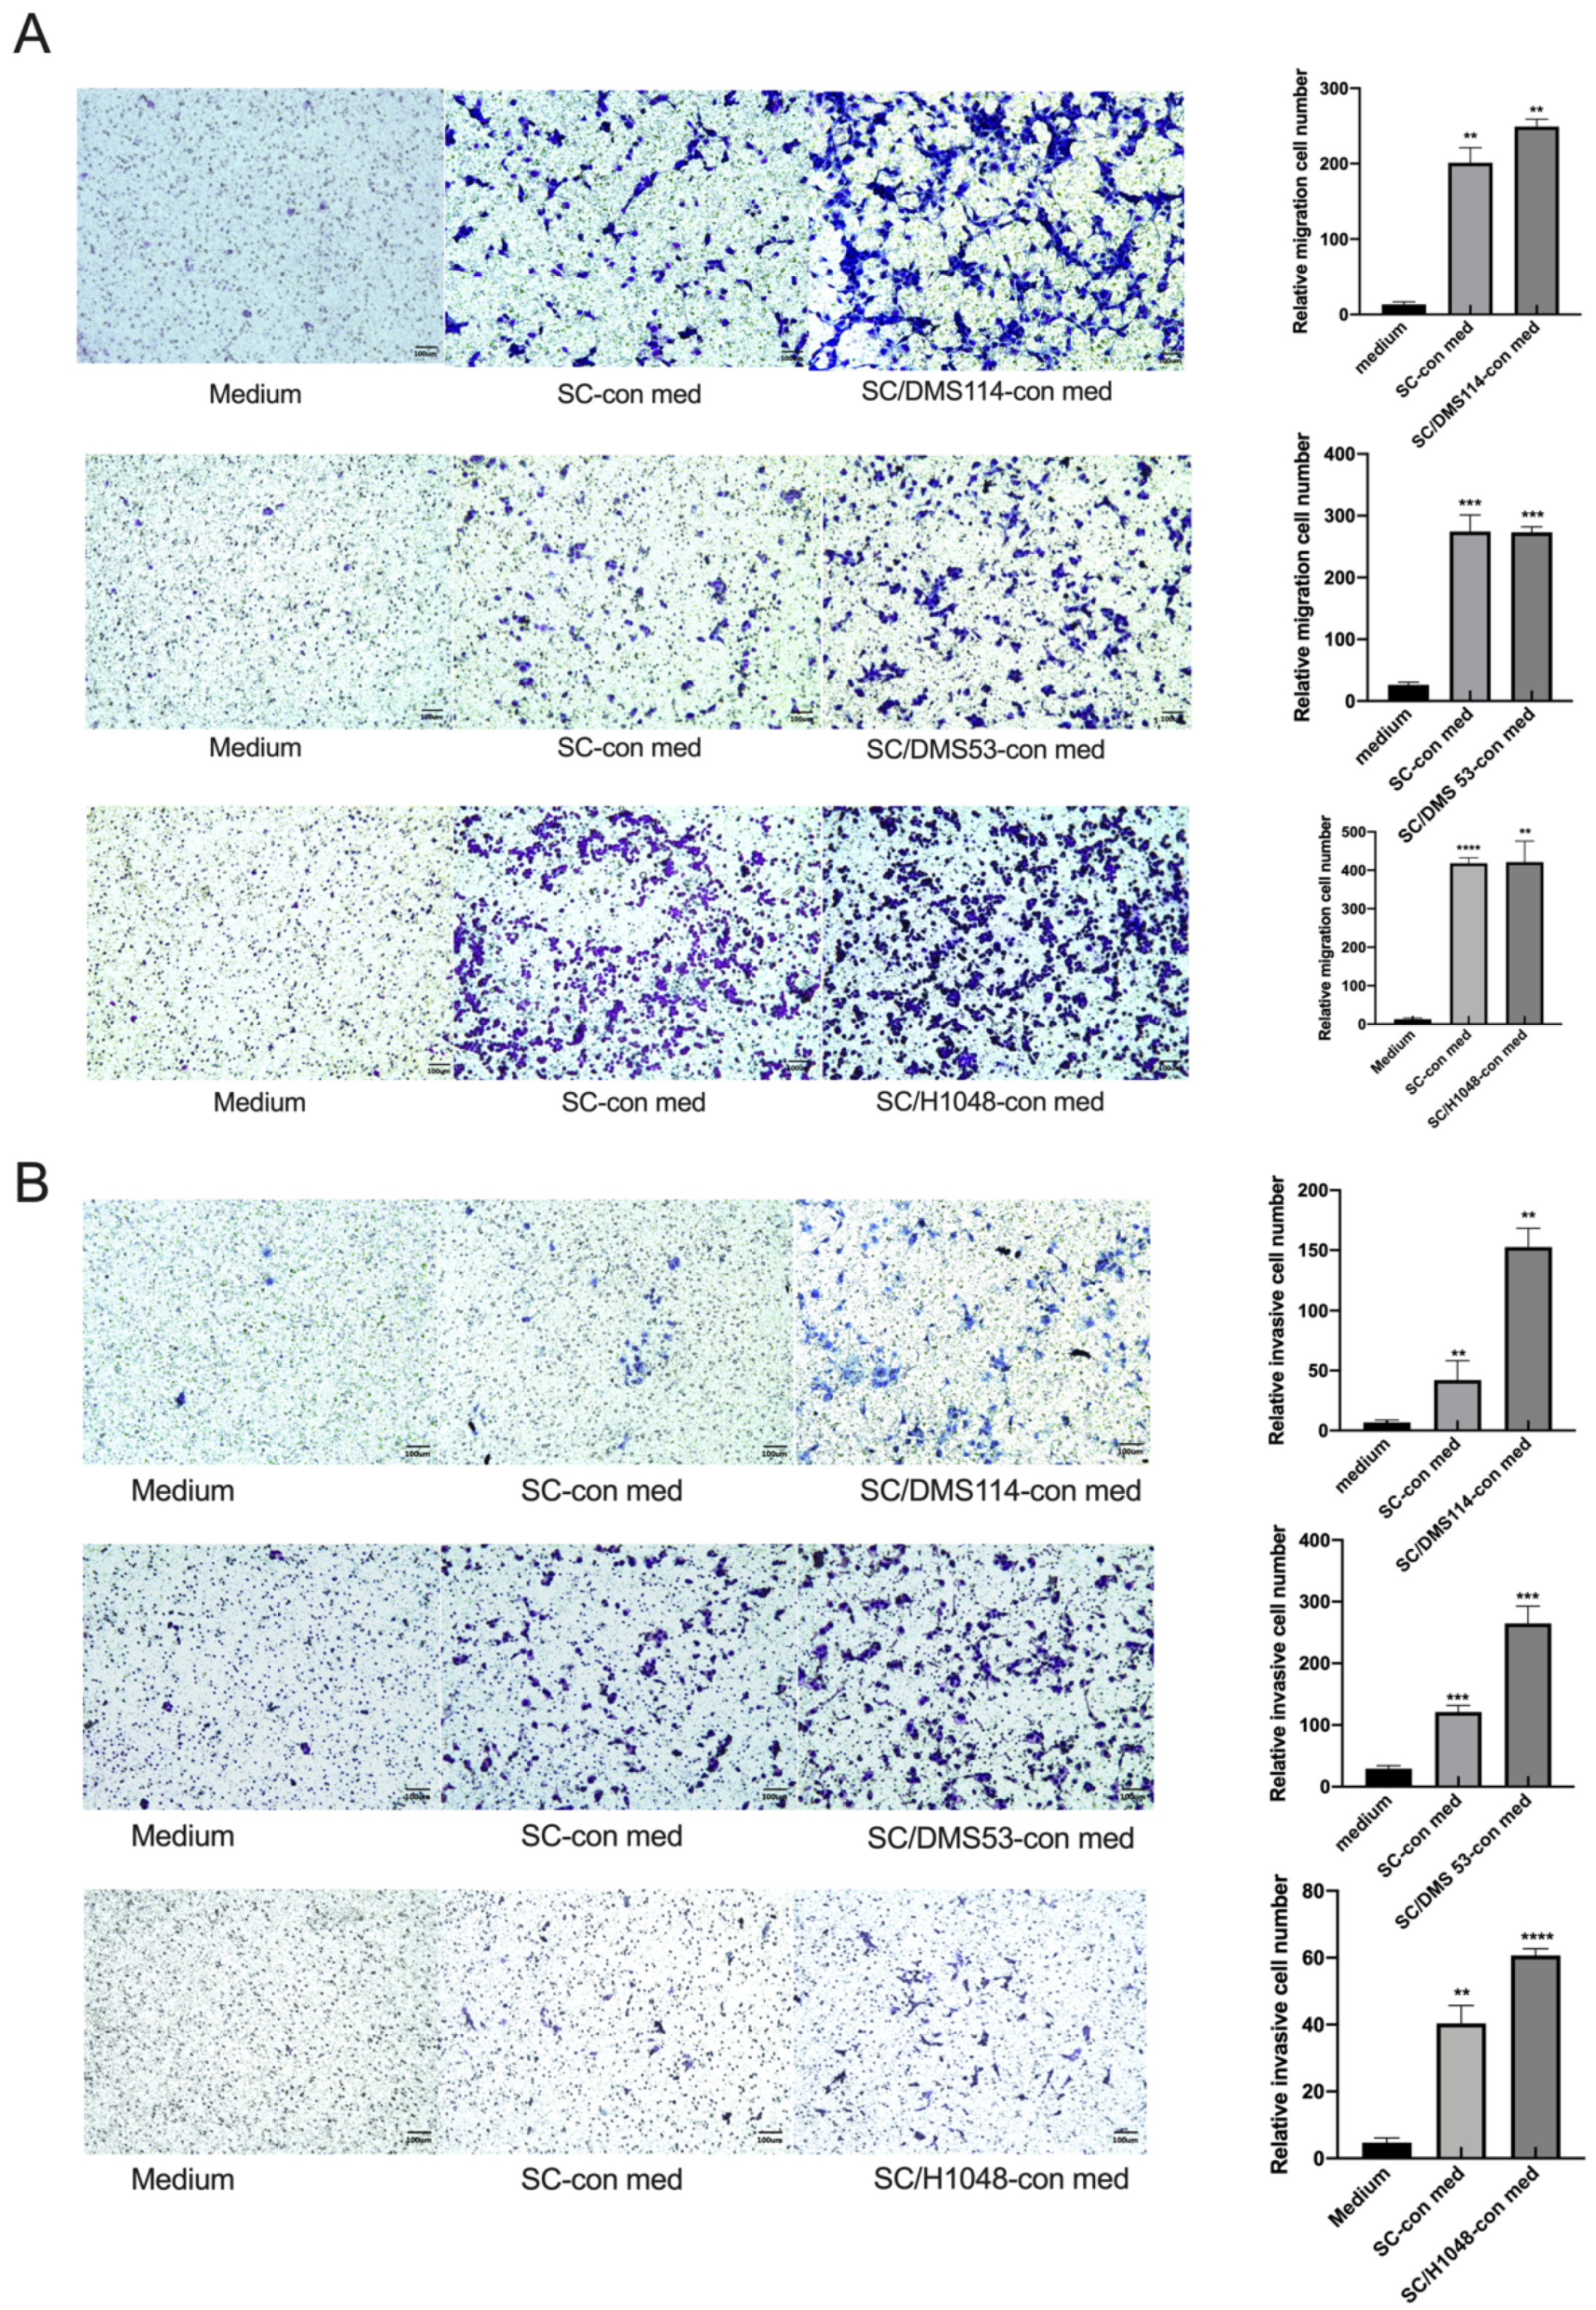
Abstract
:Simple Summary
Abstract
1. Introduction
2. Materials and Methods
2.1. Cell Cultures
2.2. Cell-Conditioned Media
2.3. Xenograft Experiments
2.4. Cell Migration Assay
2.5. Cell Invasion Assay
2.6. Cell Proliferation Assay
2.7. Apoptosis Assay
2.8. RNA Extraction
2.9. RNA Sequencing
2.10. Quality Control
2.11. Identification of Differentially Expressed Genes (DEGs)
2.12. Gene Ontology (GO) Annotations and the Kyoto Encyclopedia of Genes and Genomes (KEGG) Pathway Analyses
2.13. ceRNA Network Analysis
2.14. Statistical Analysis
3. Results
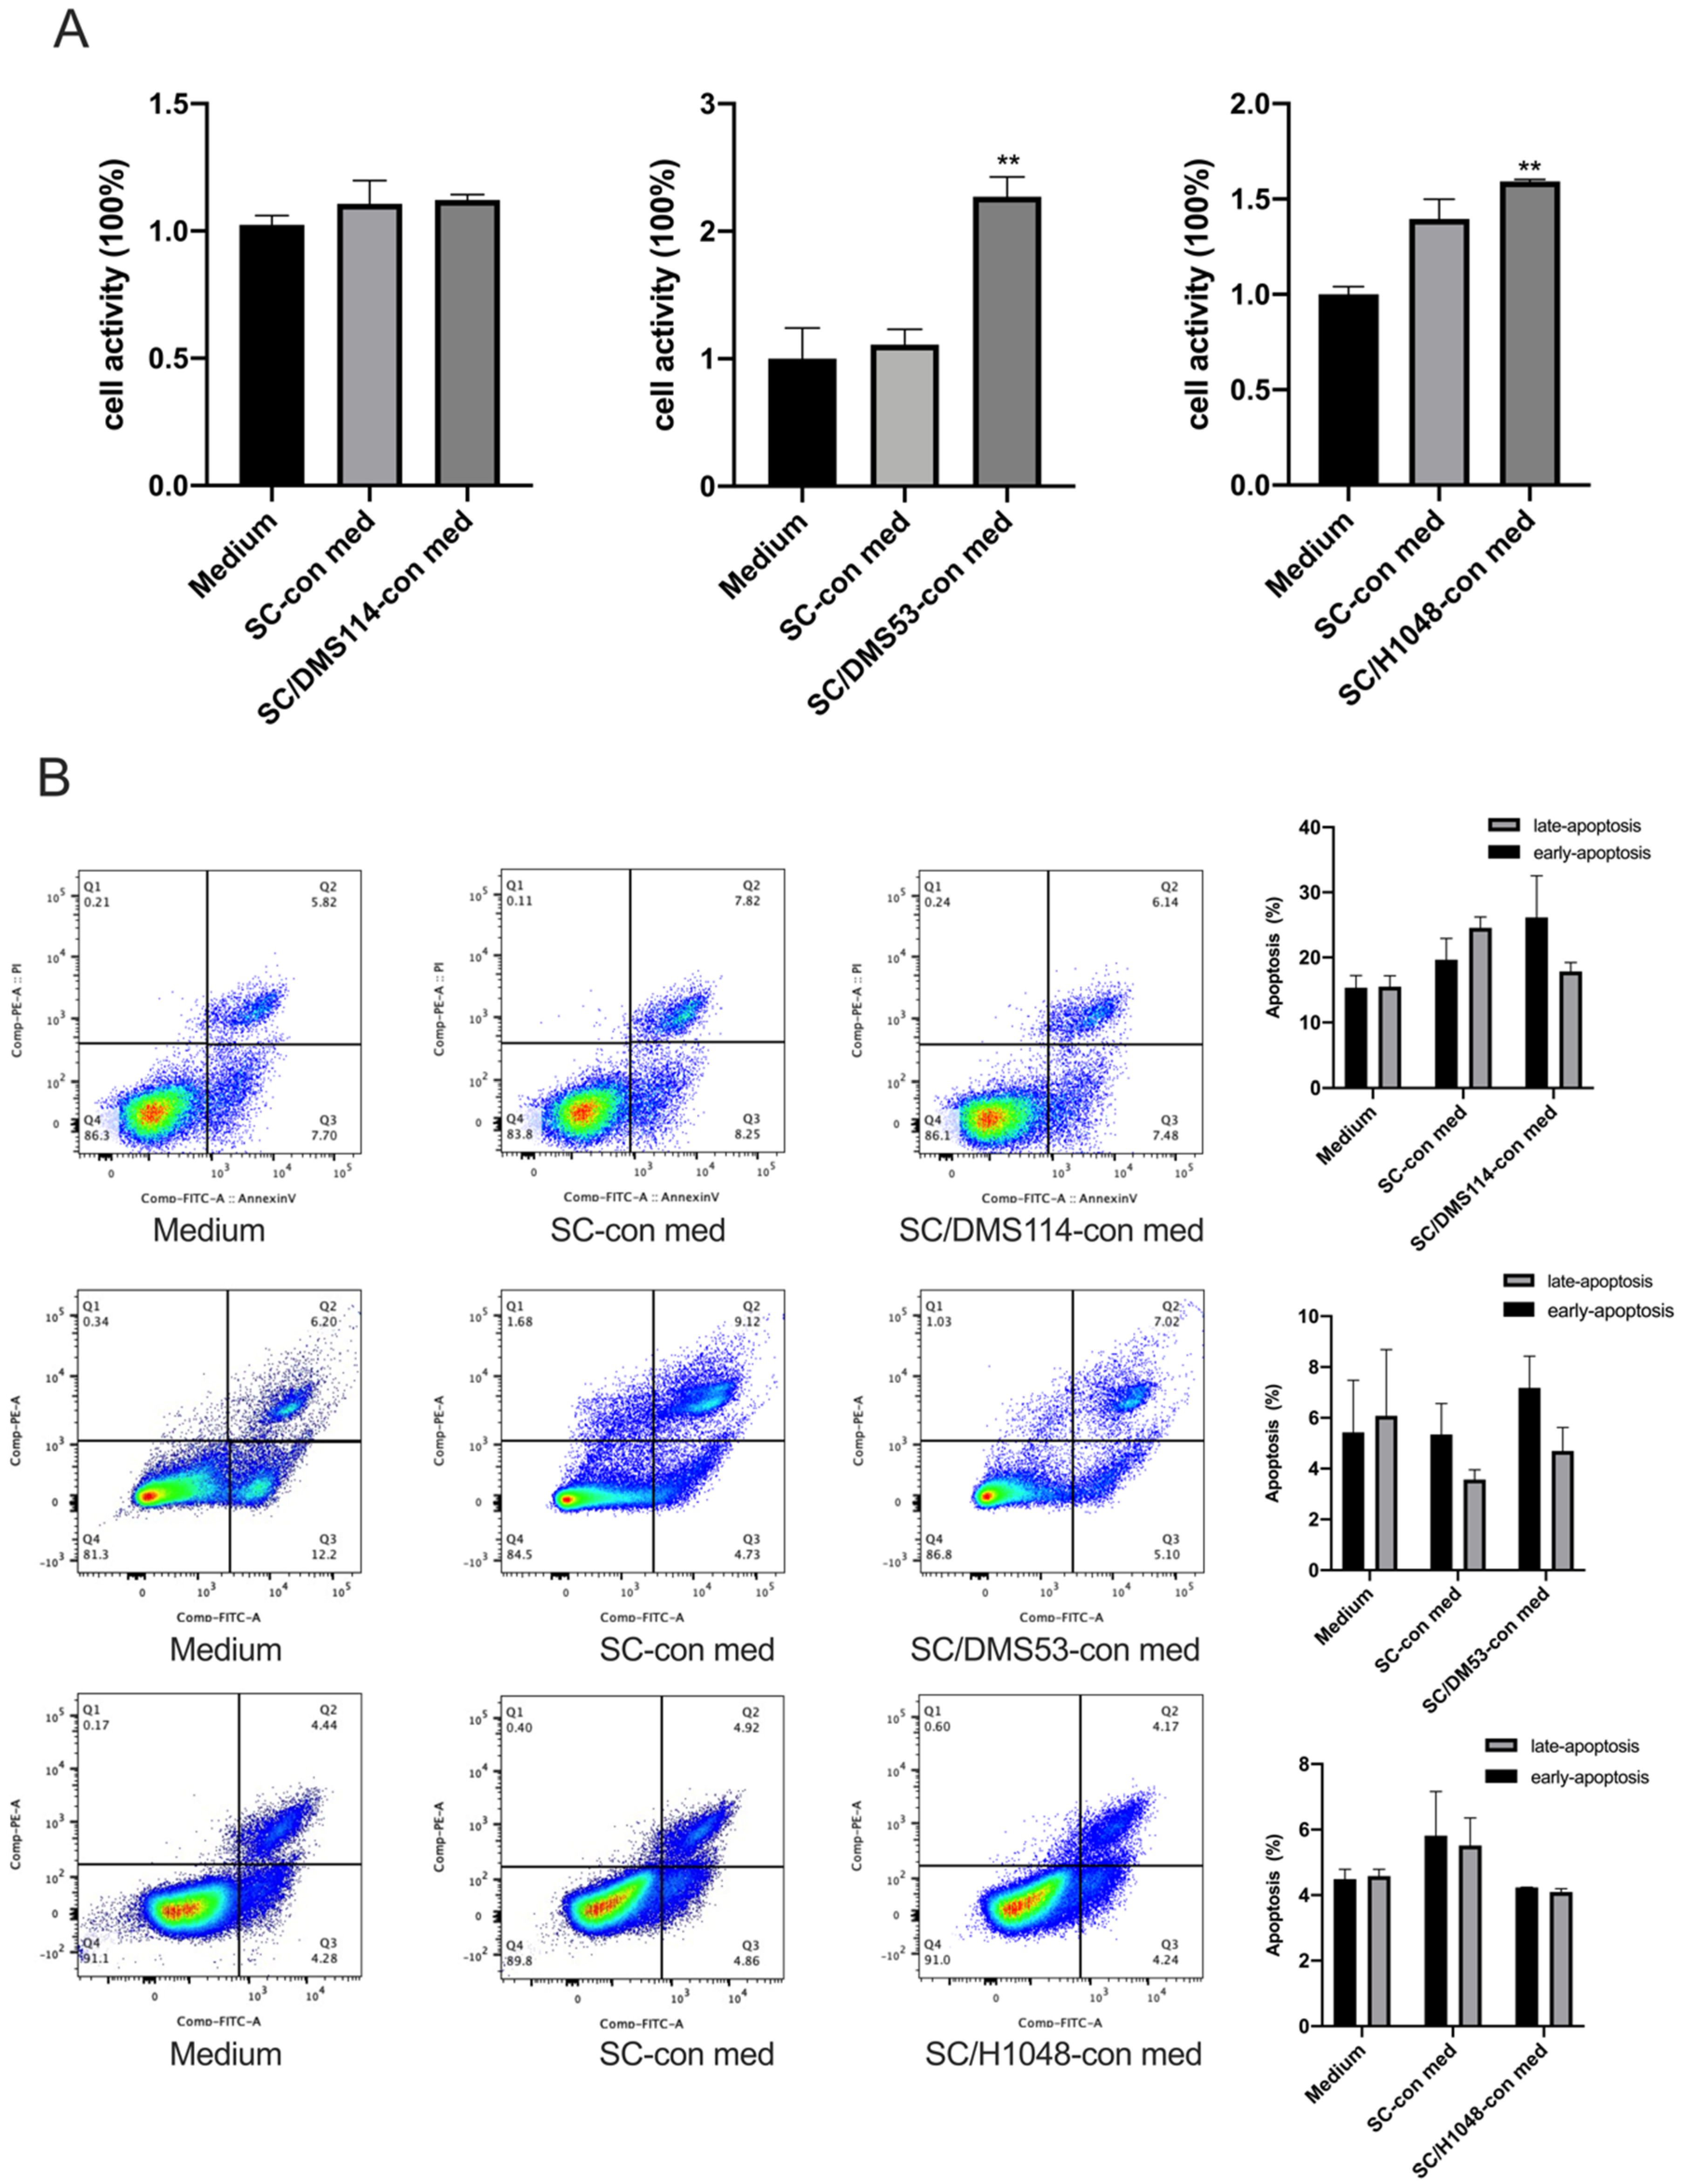
3.1. TA-SCs and SCs Regulate the Migration, Invasion, and Proliferation of SCLC Cells In Vitro
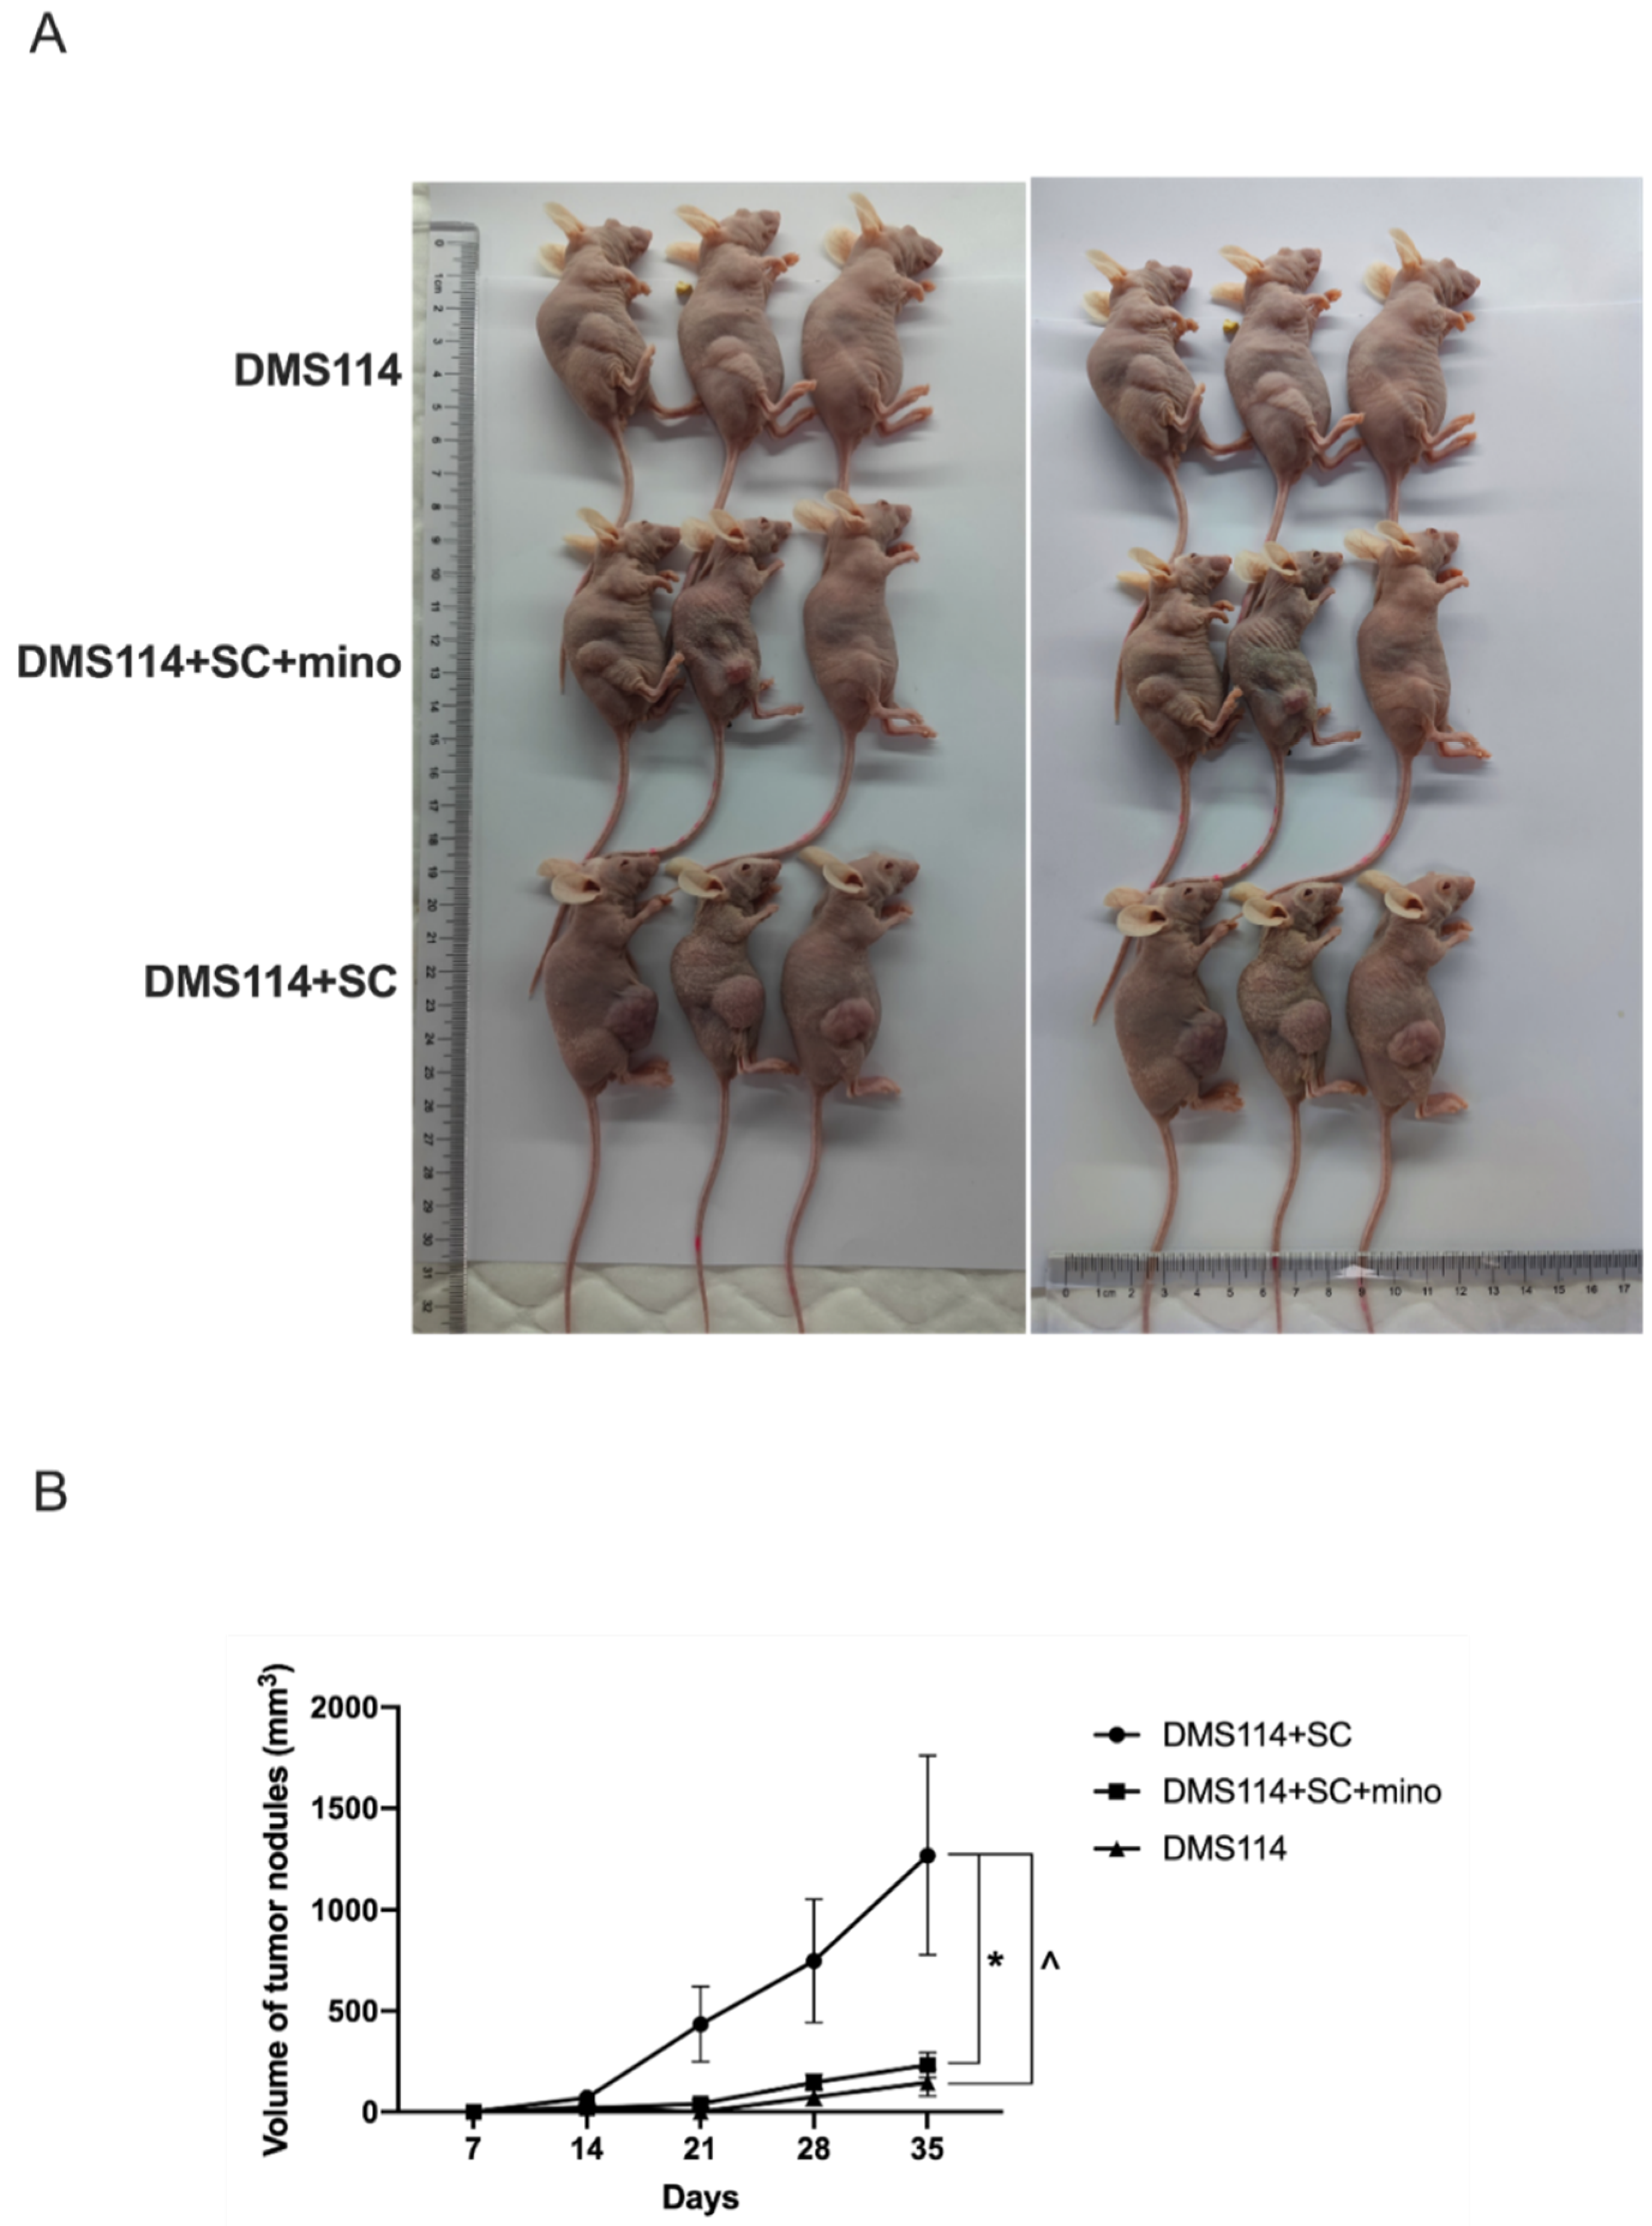
3.2. TA-SCs and SCs Promote the Growth of SCLC Cells In Vivo
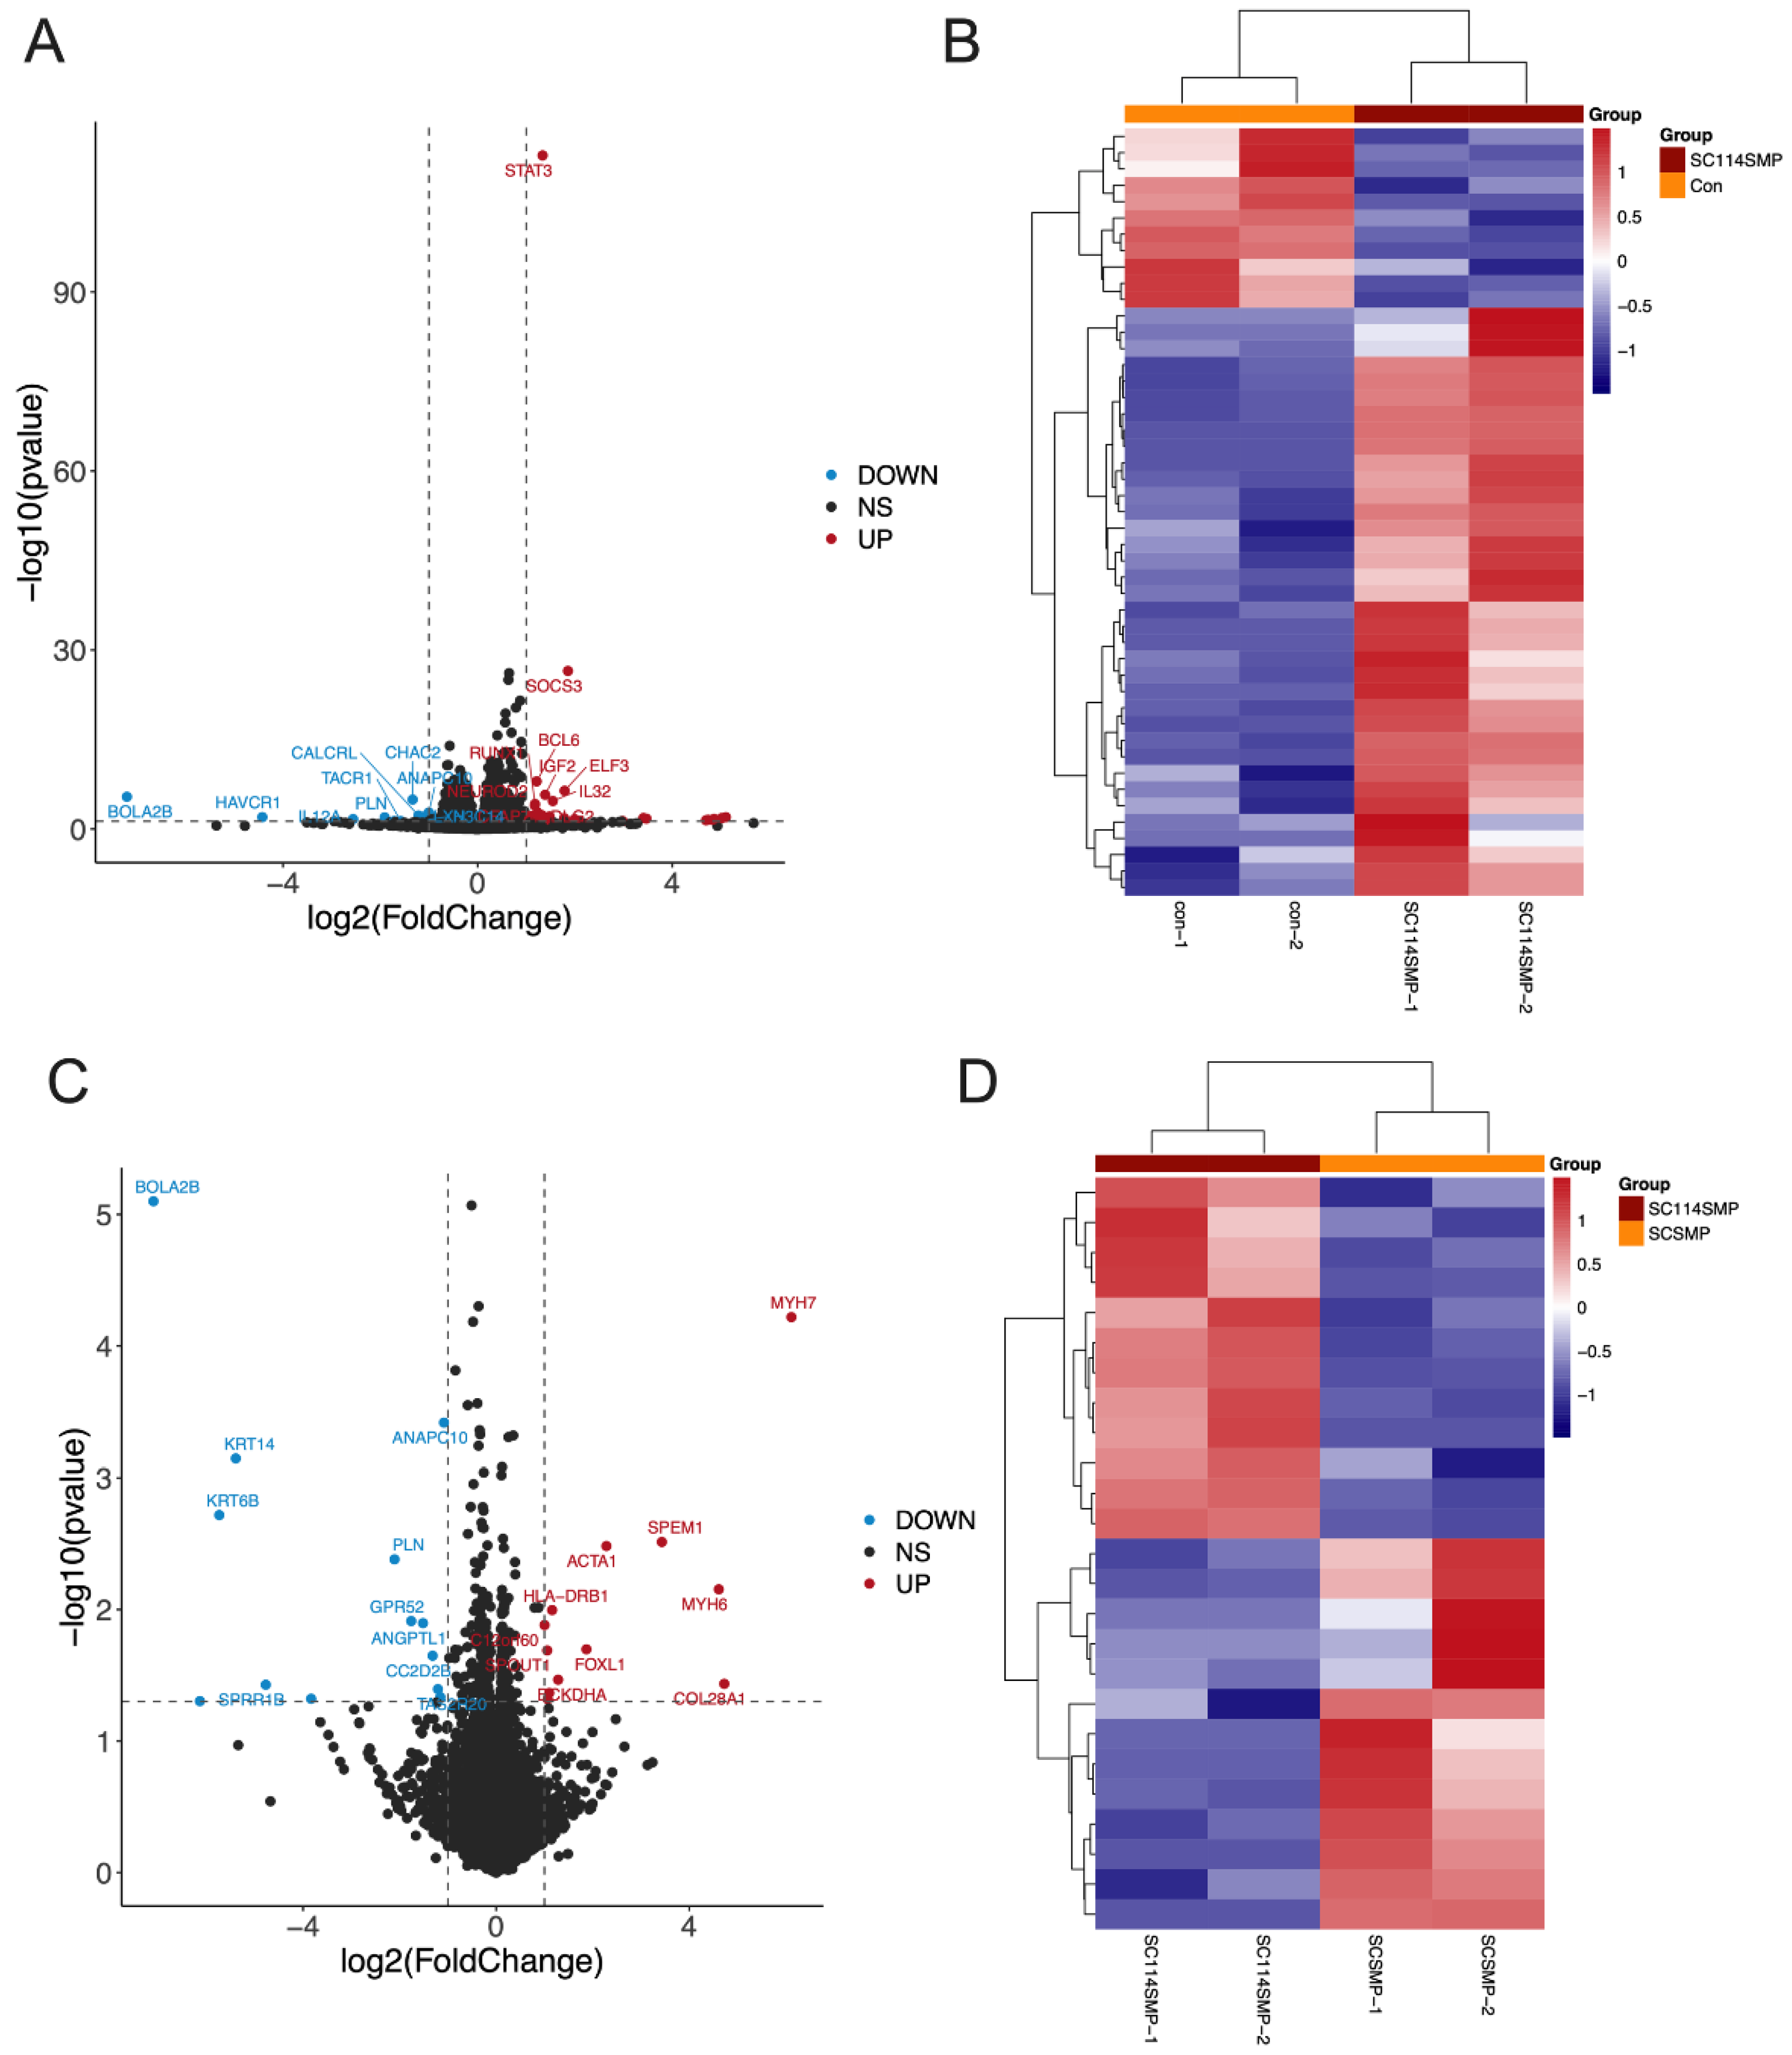
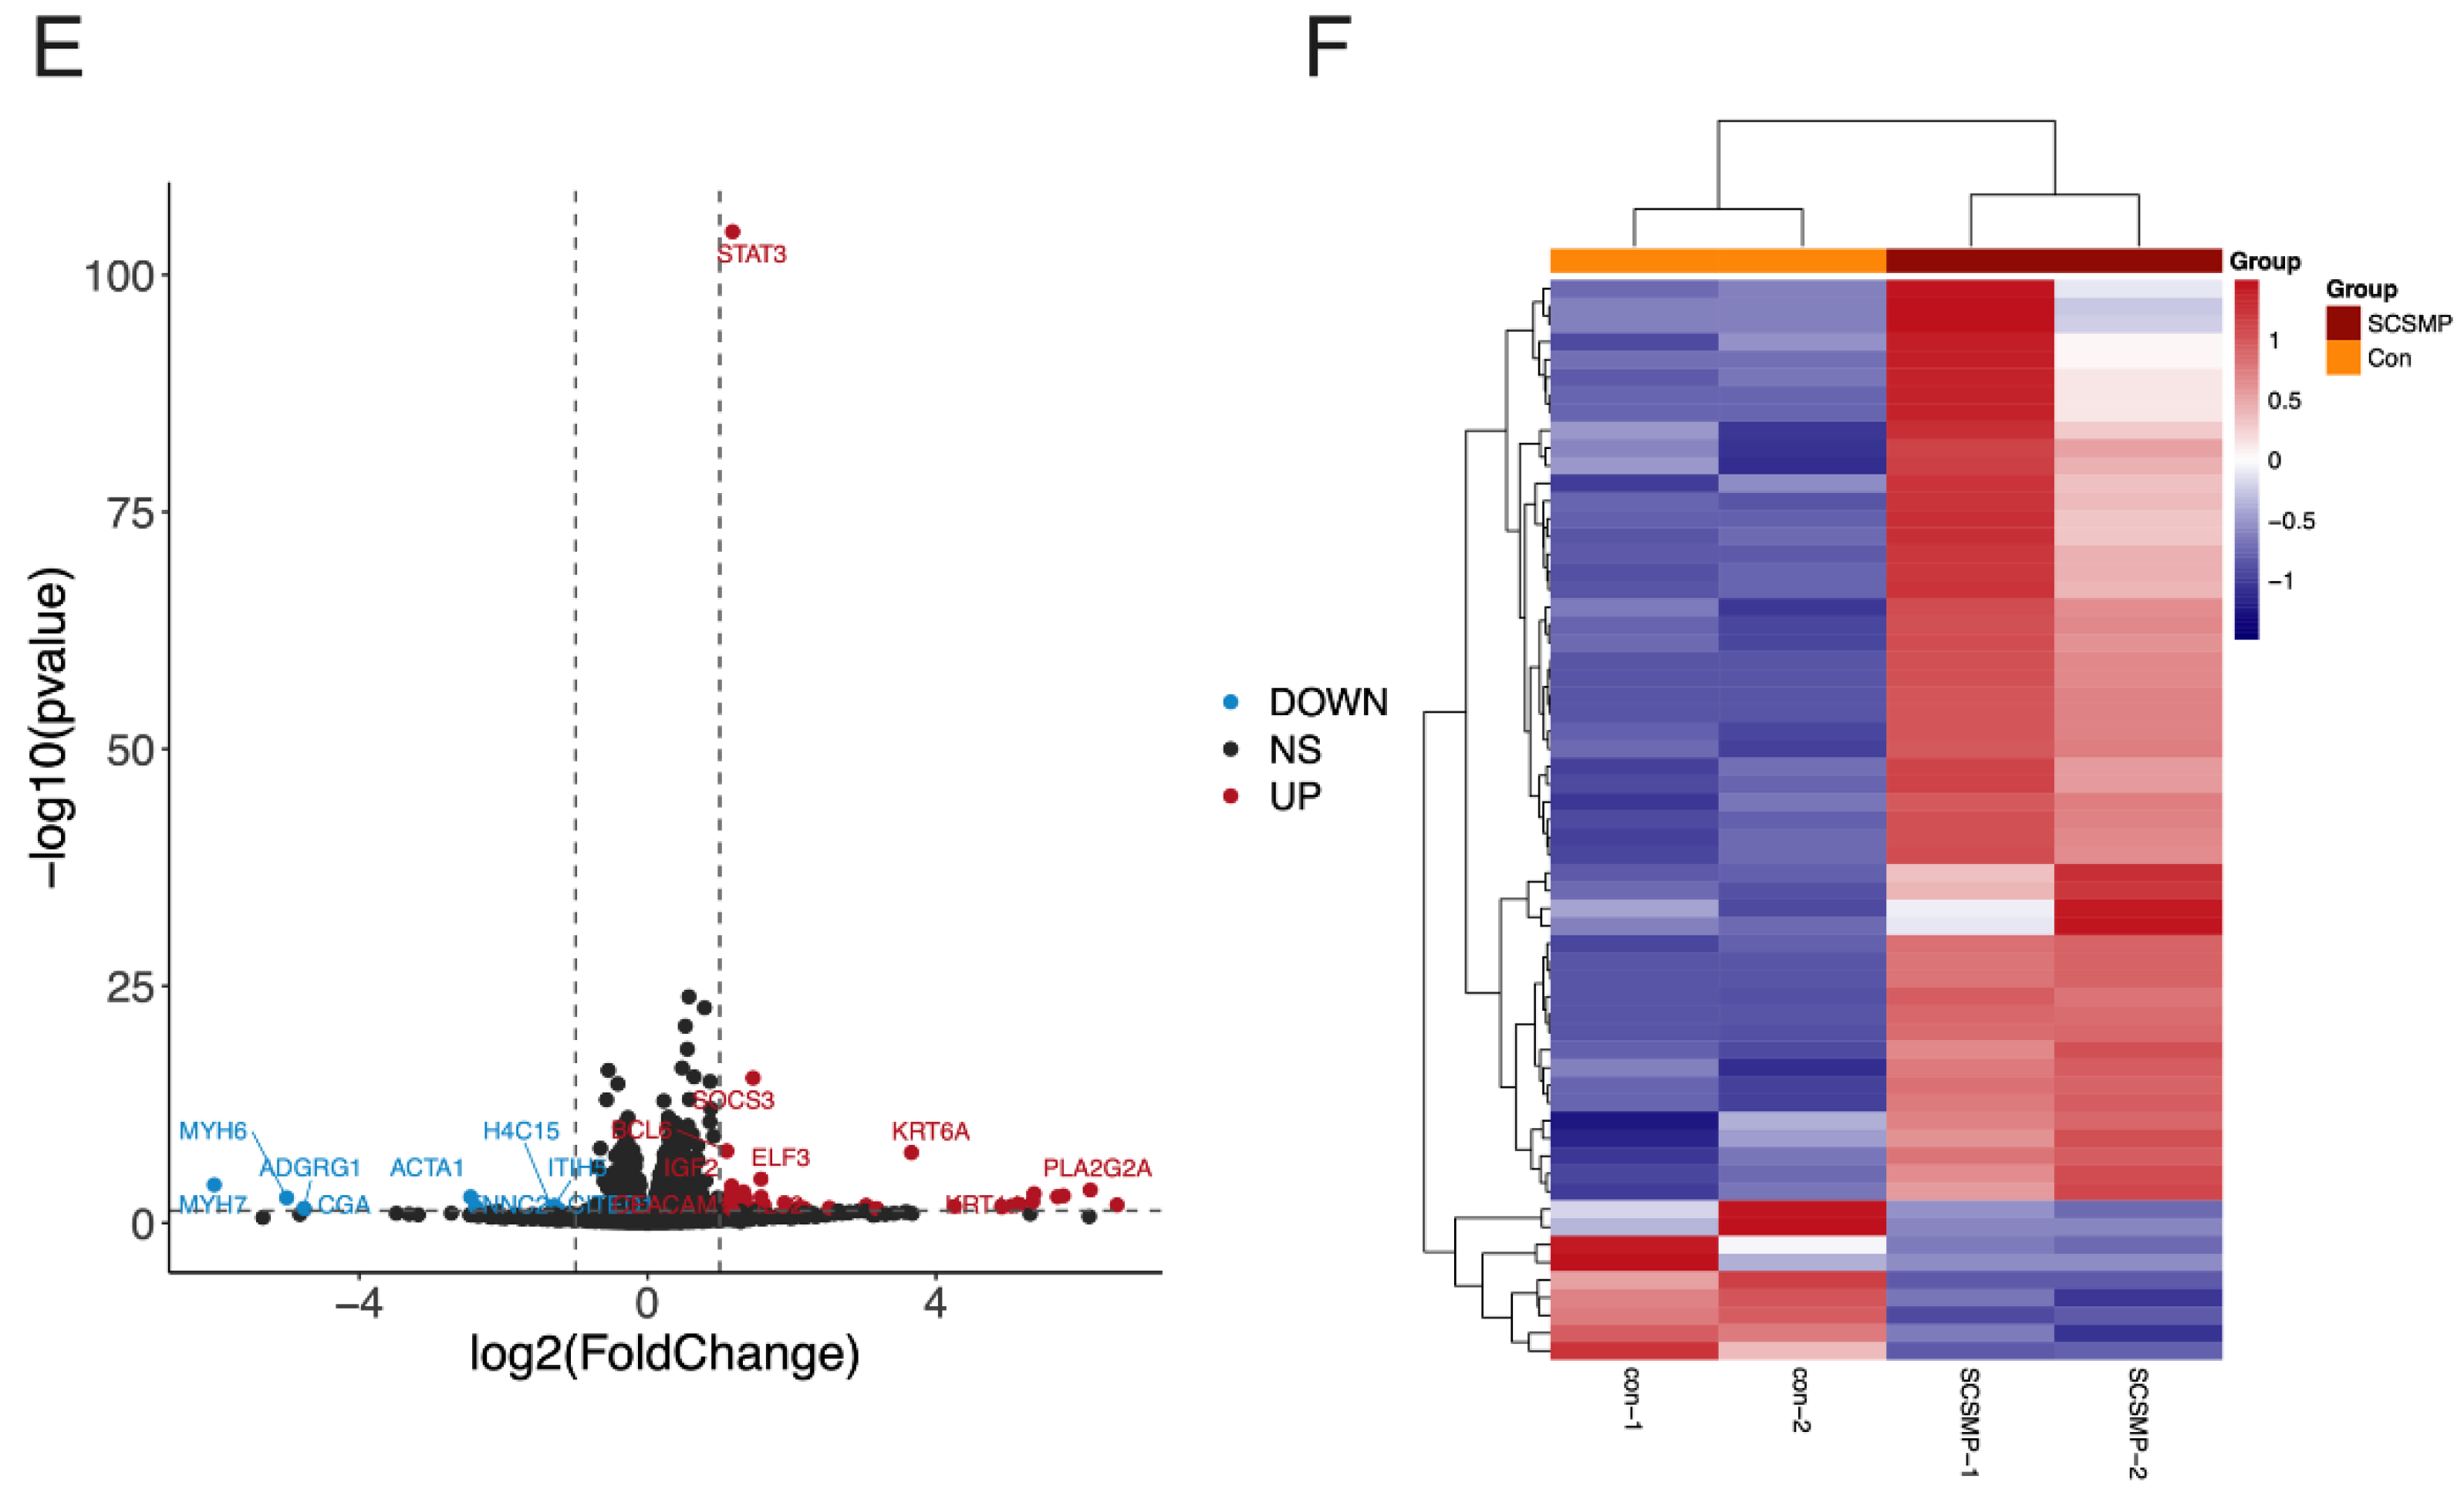
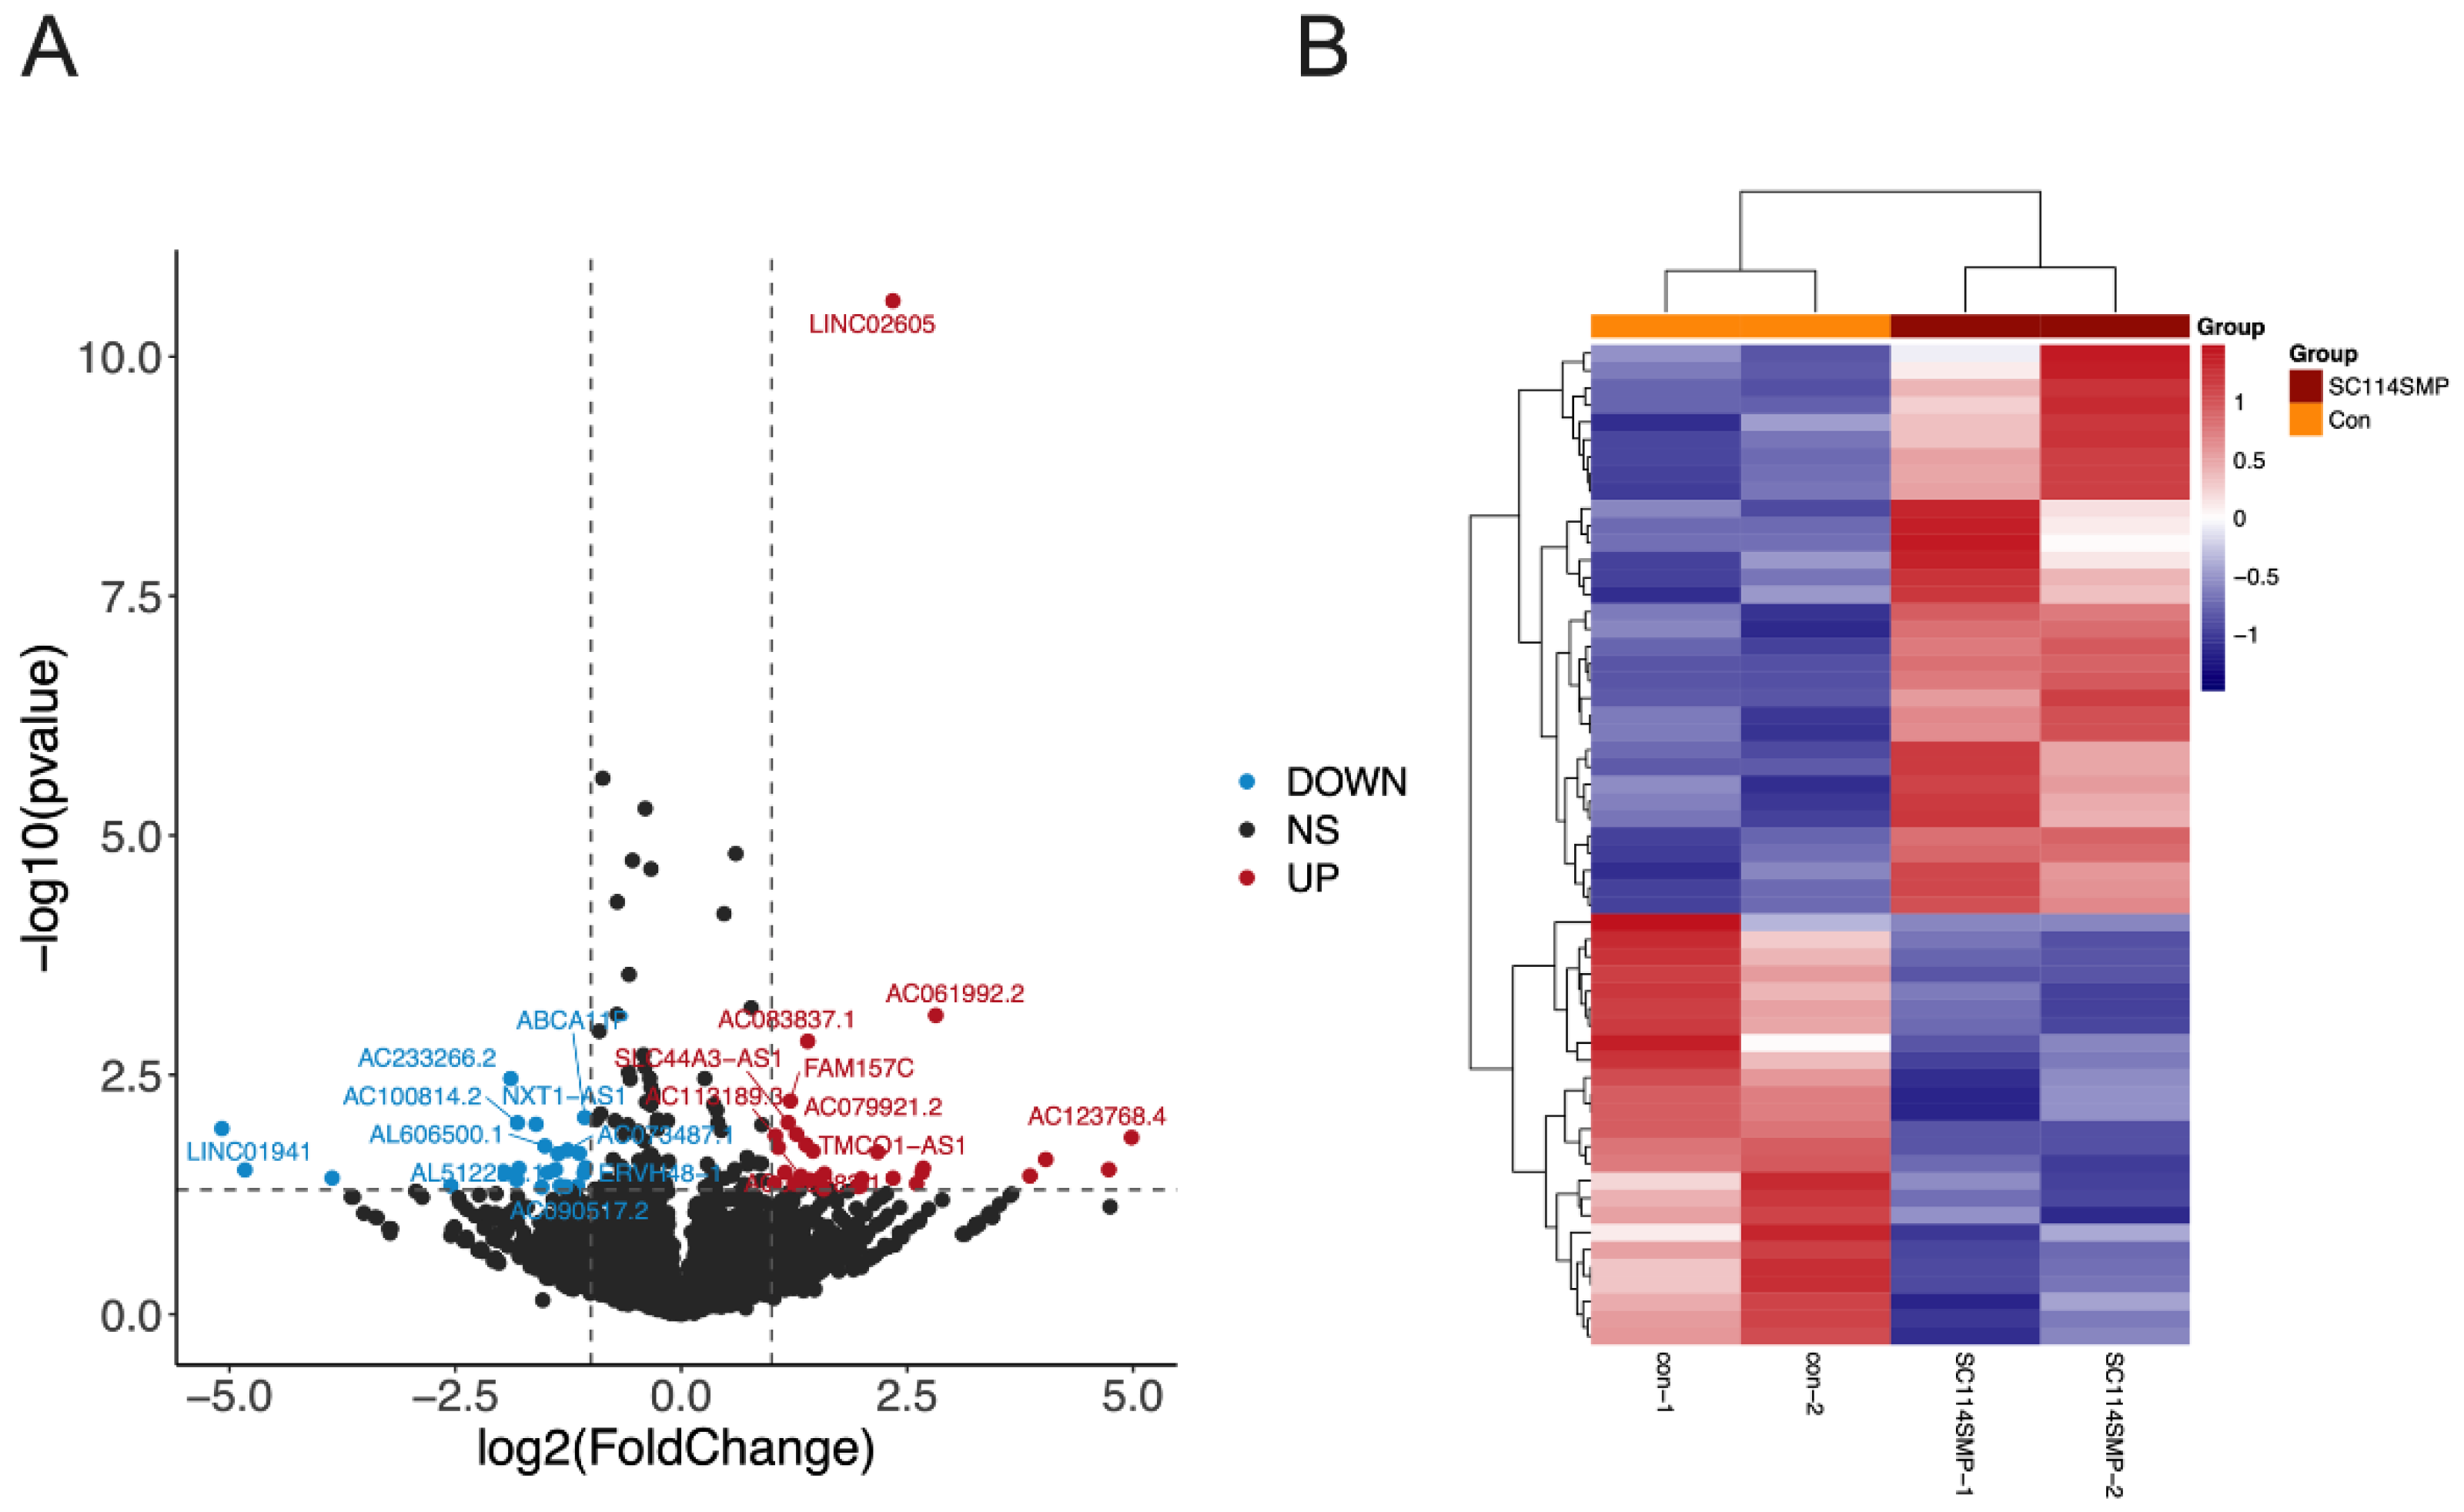
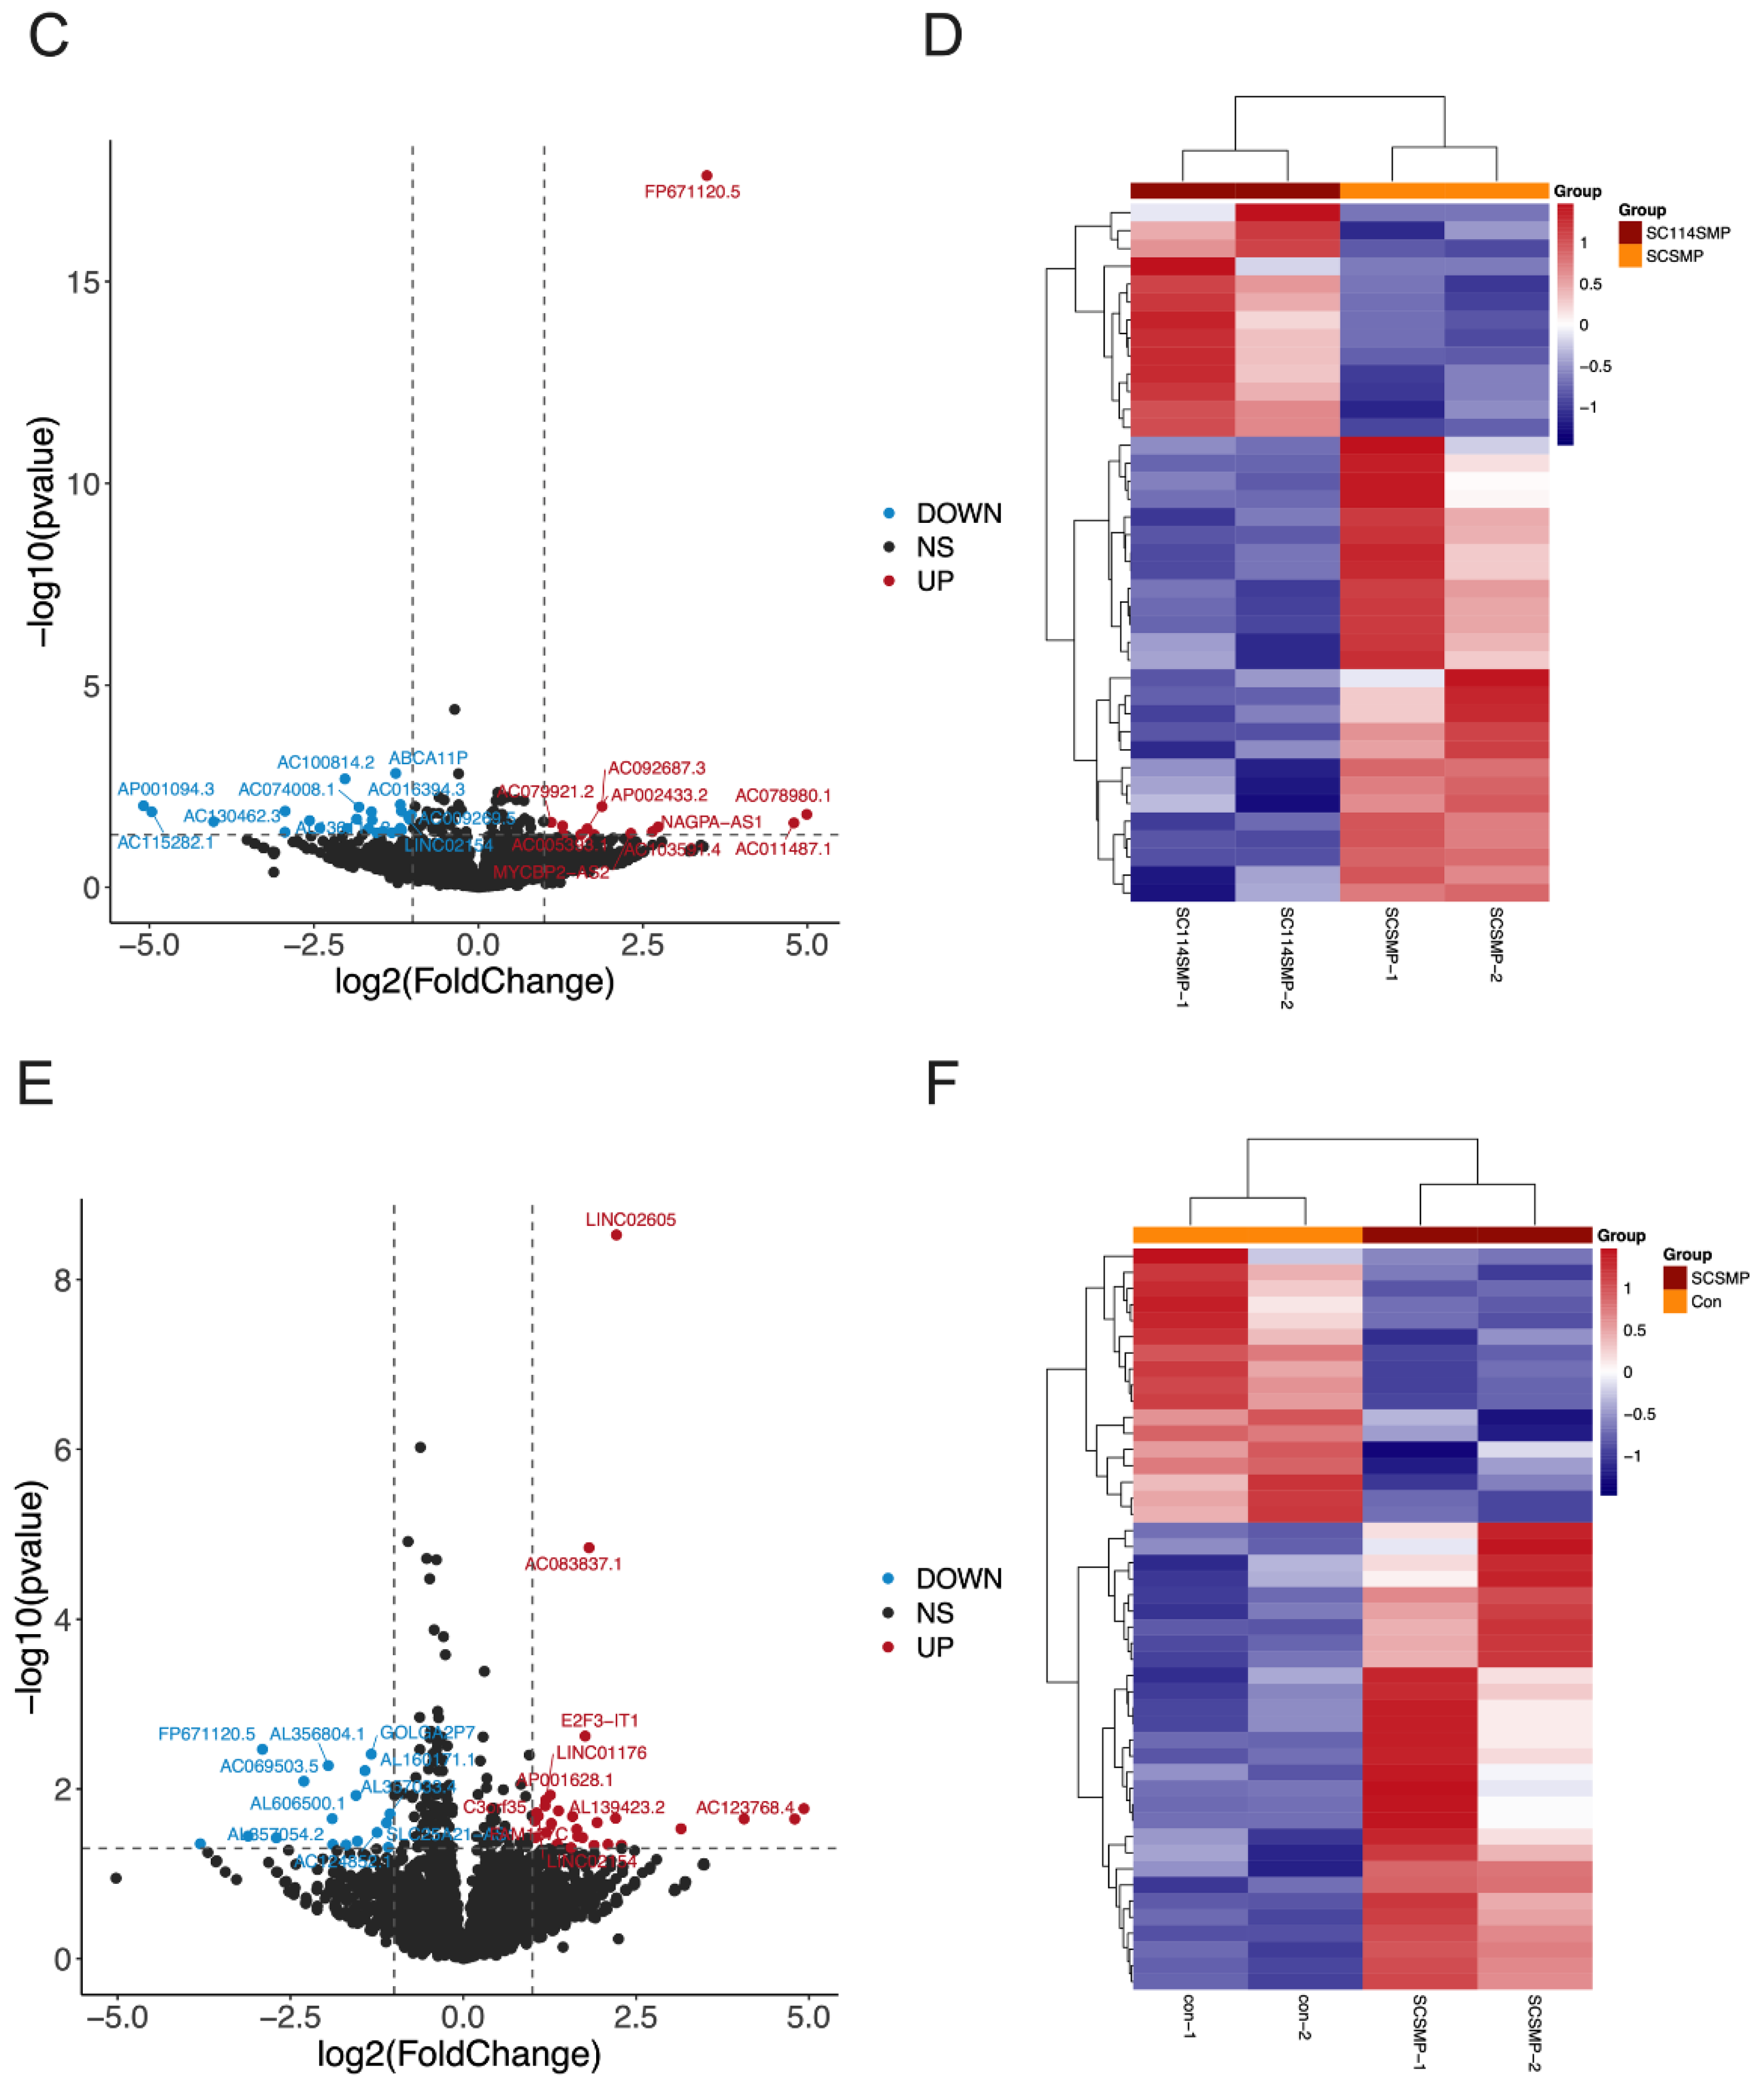
3.3. Analysis of DEGs in the Cancer Cells from the TAR-SC Group, the SC Group, and the Control Group
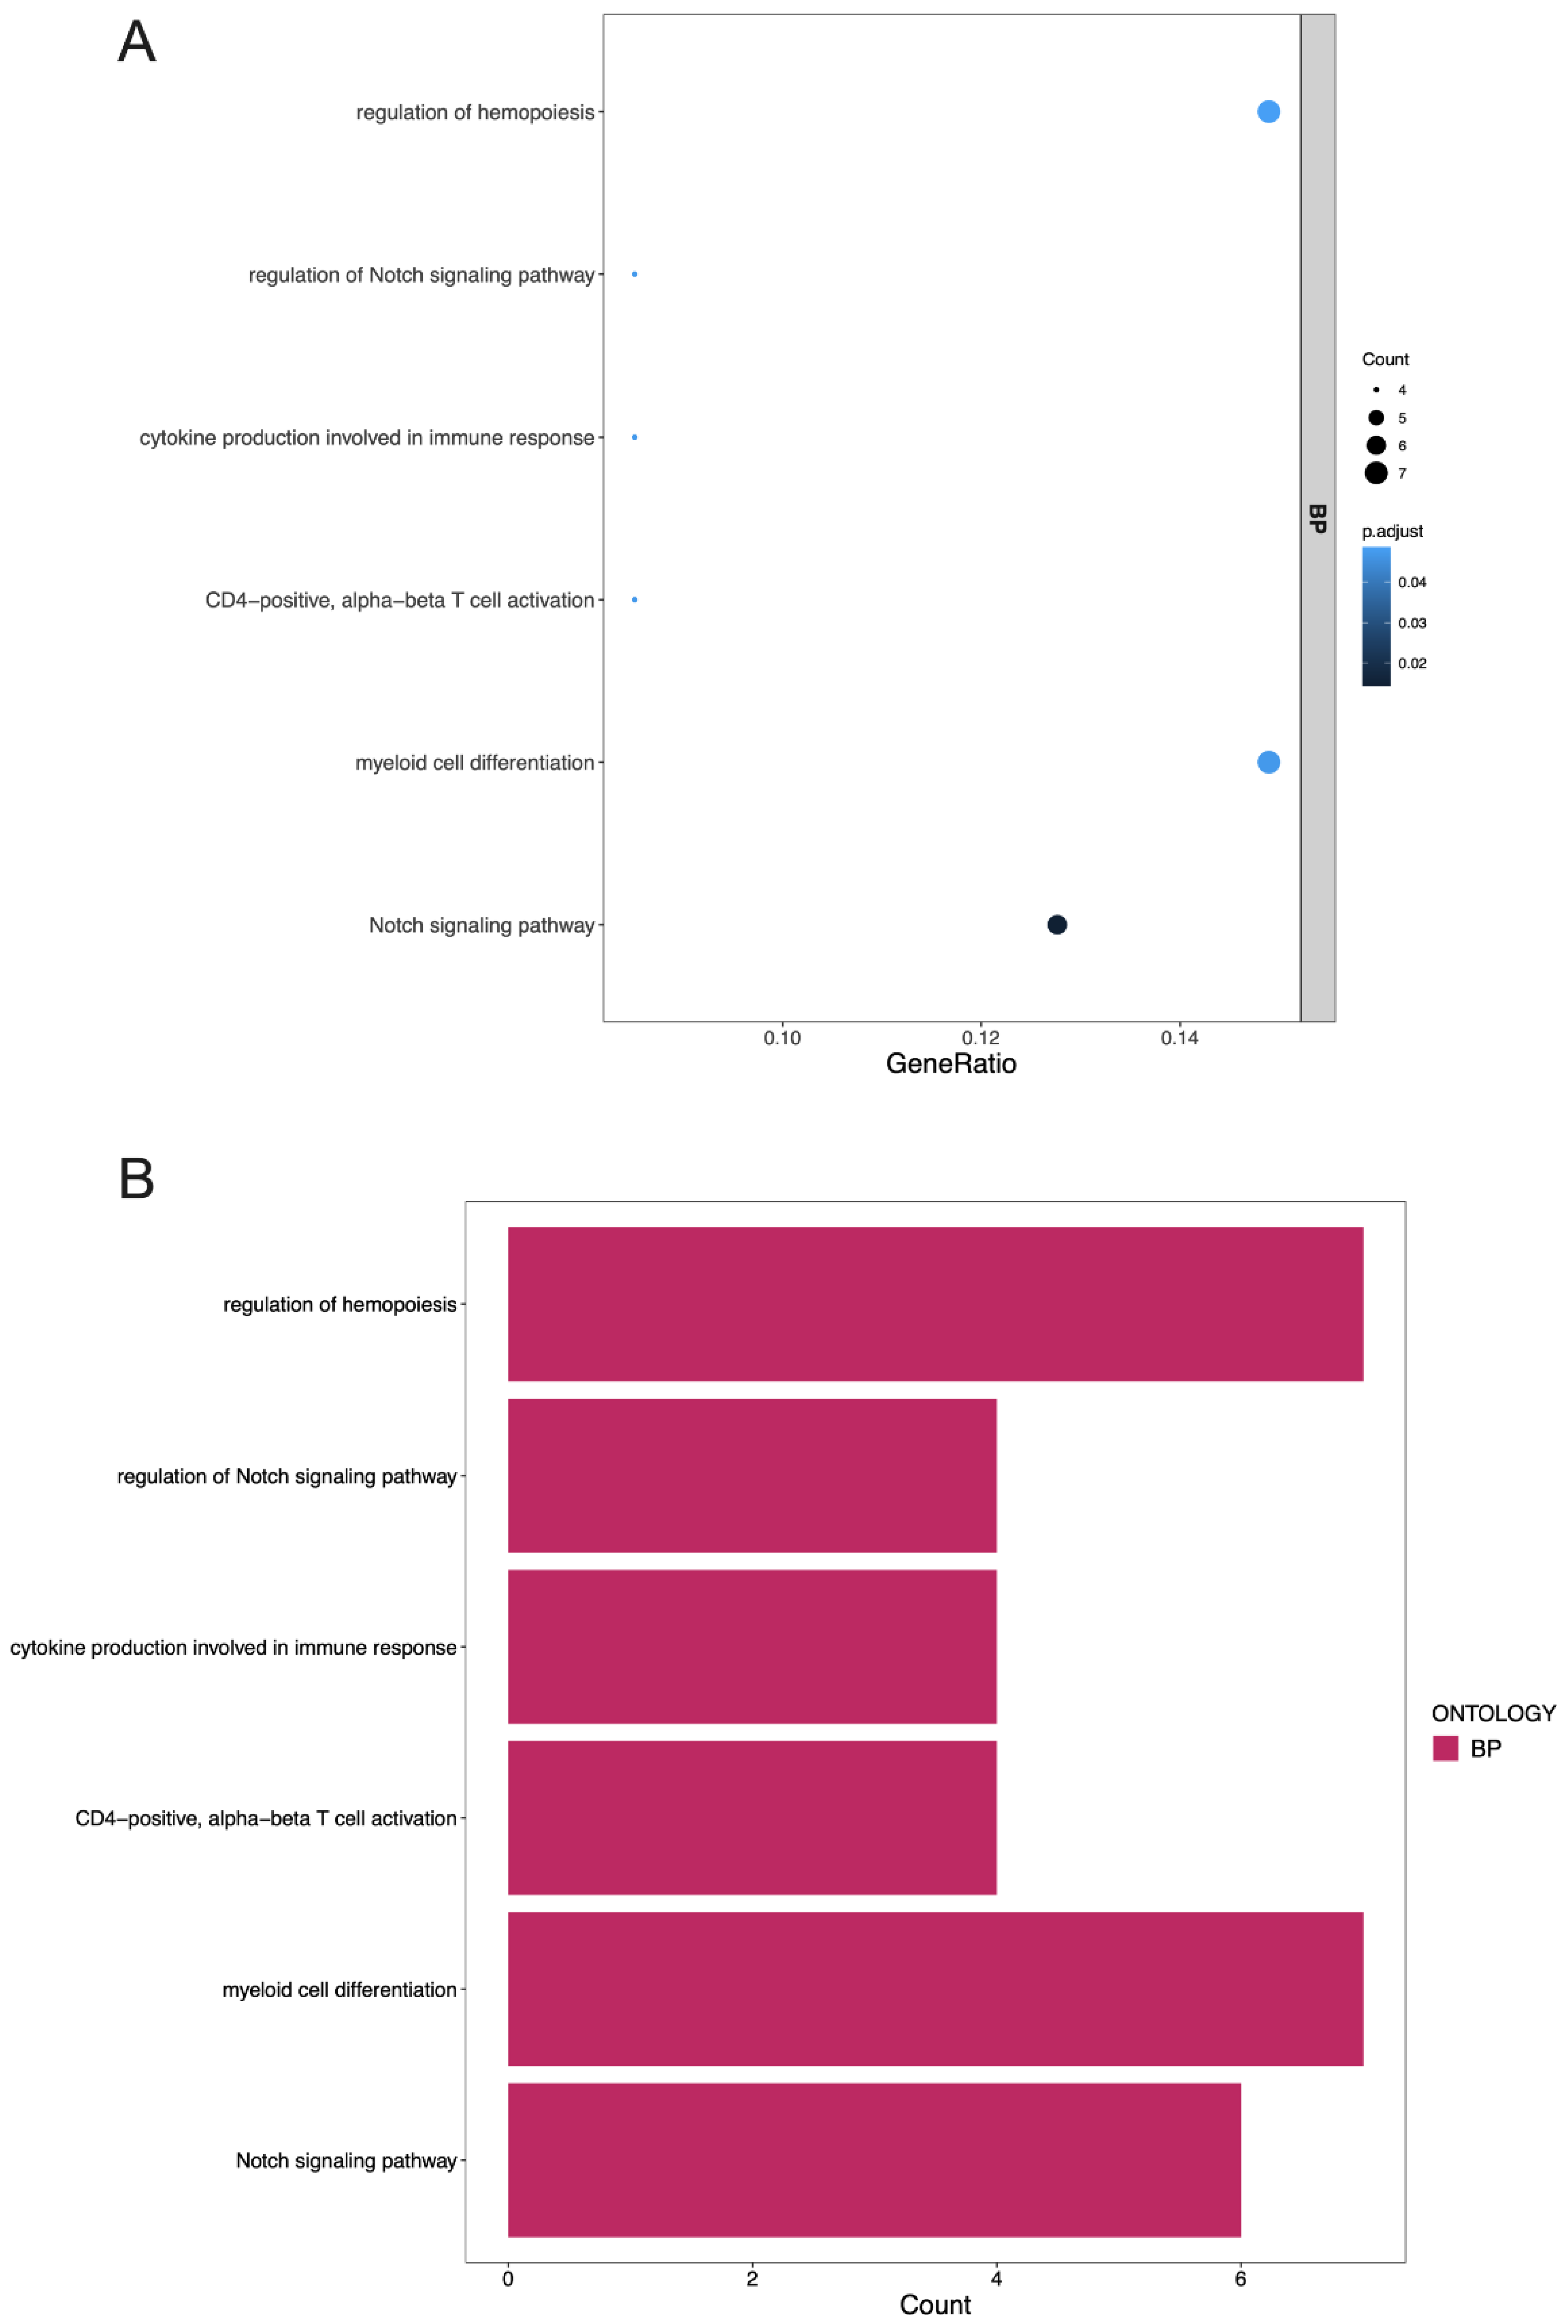
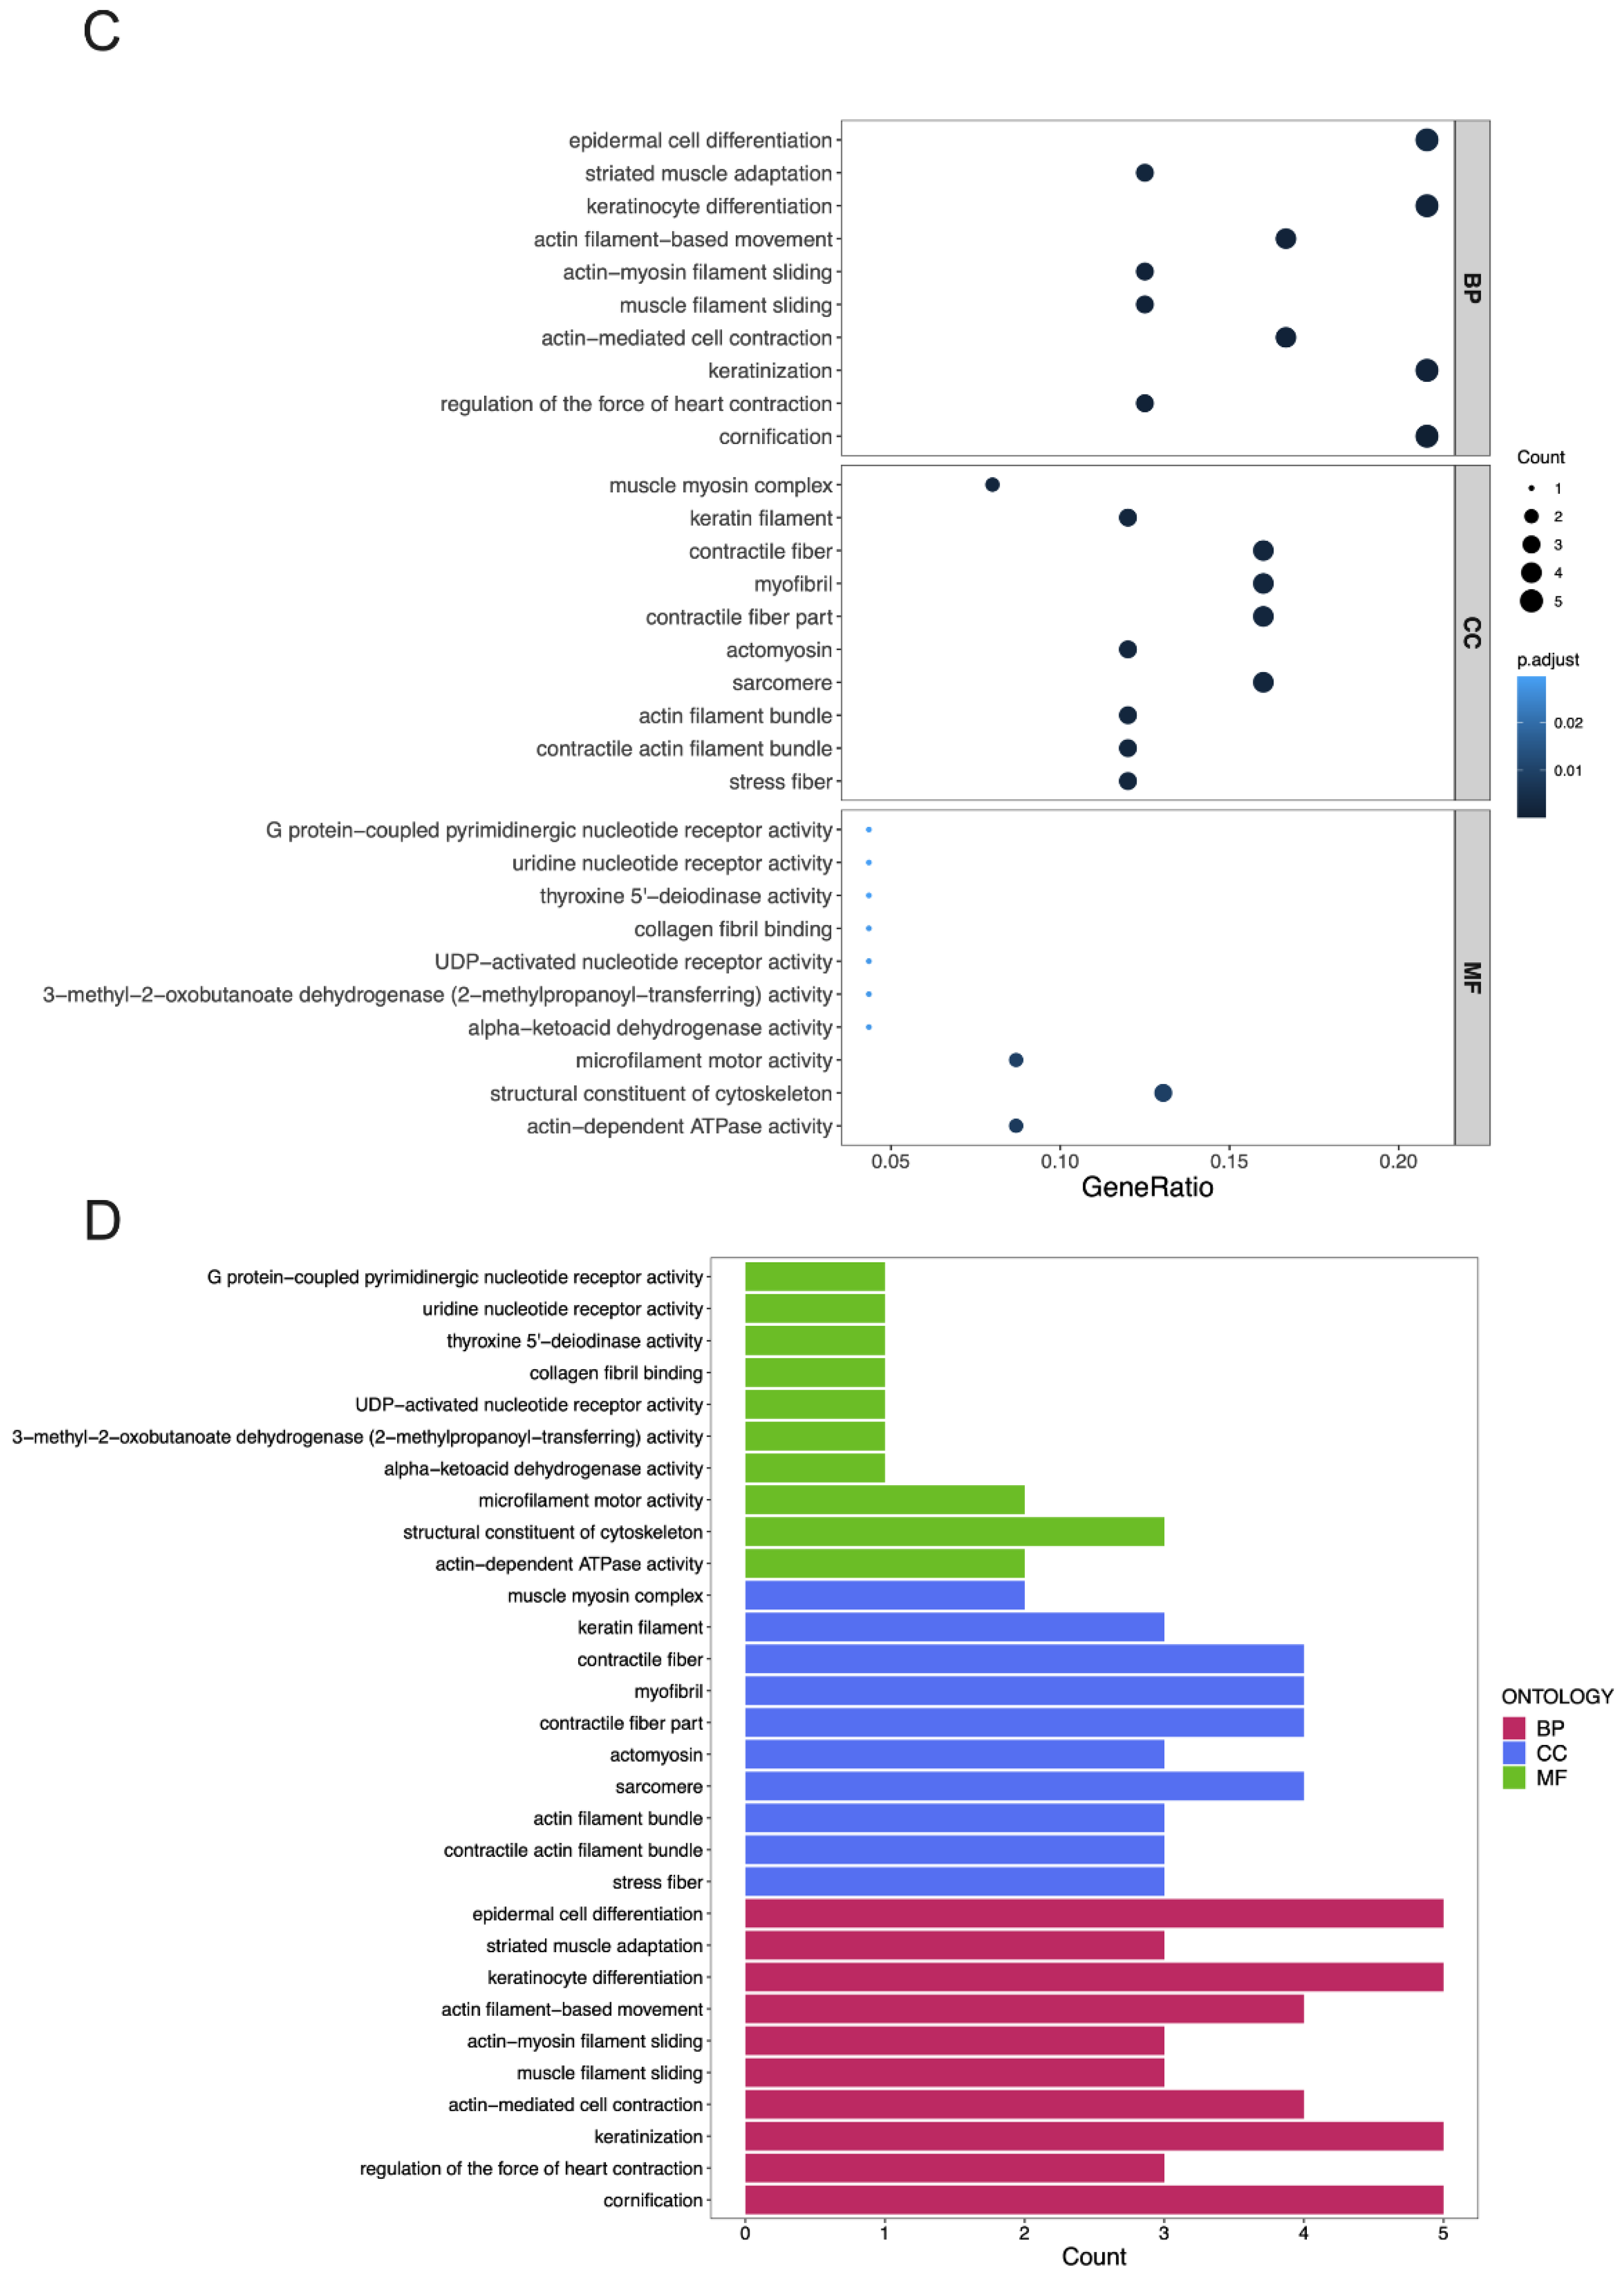
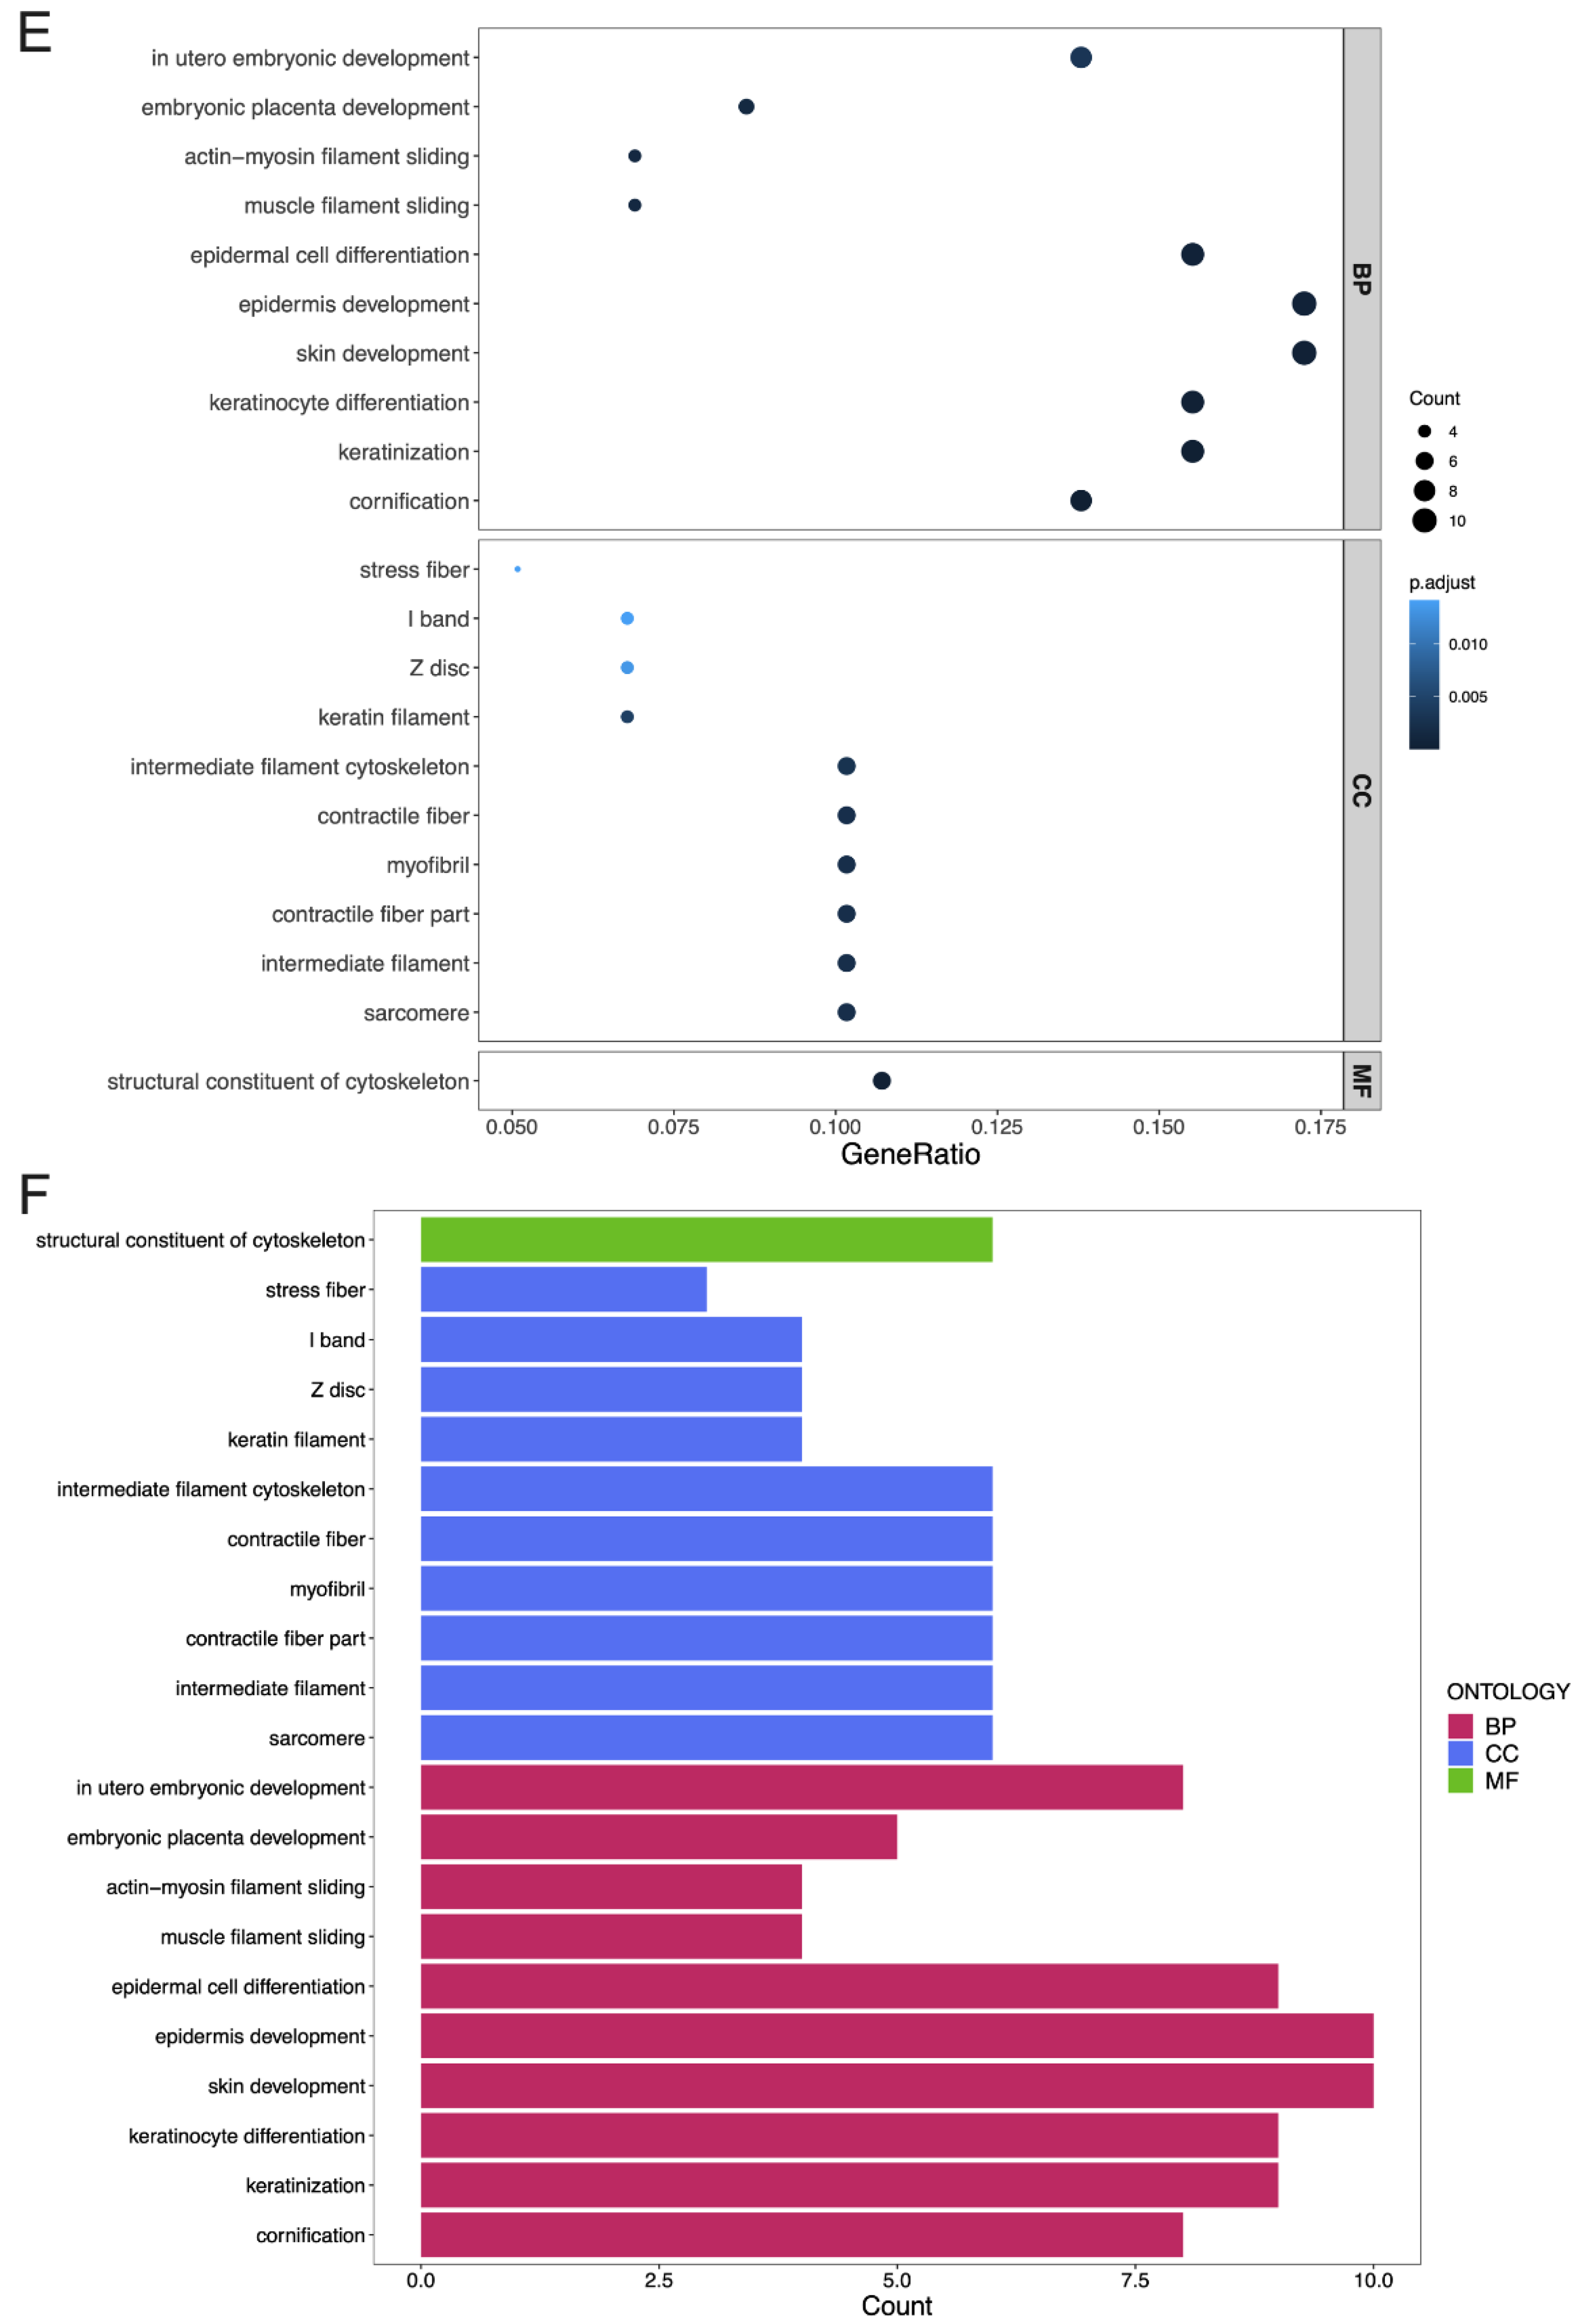
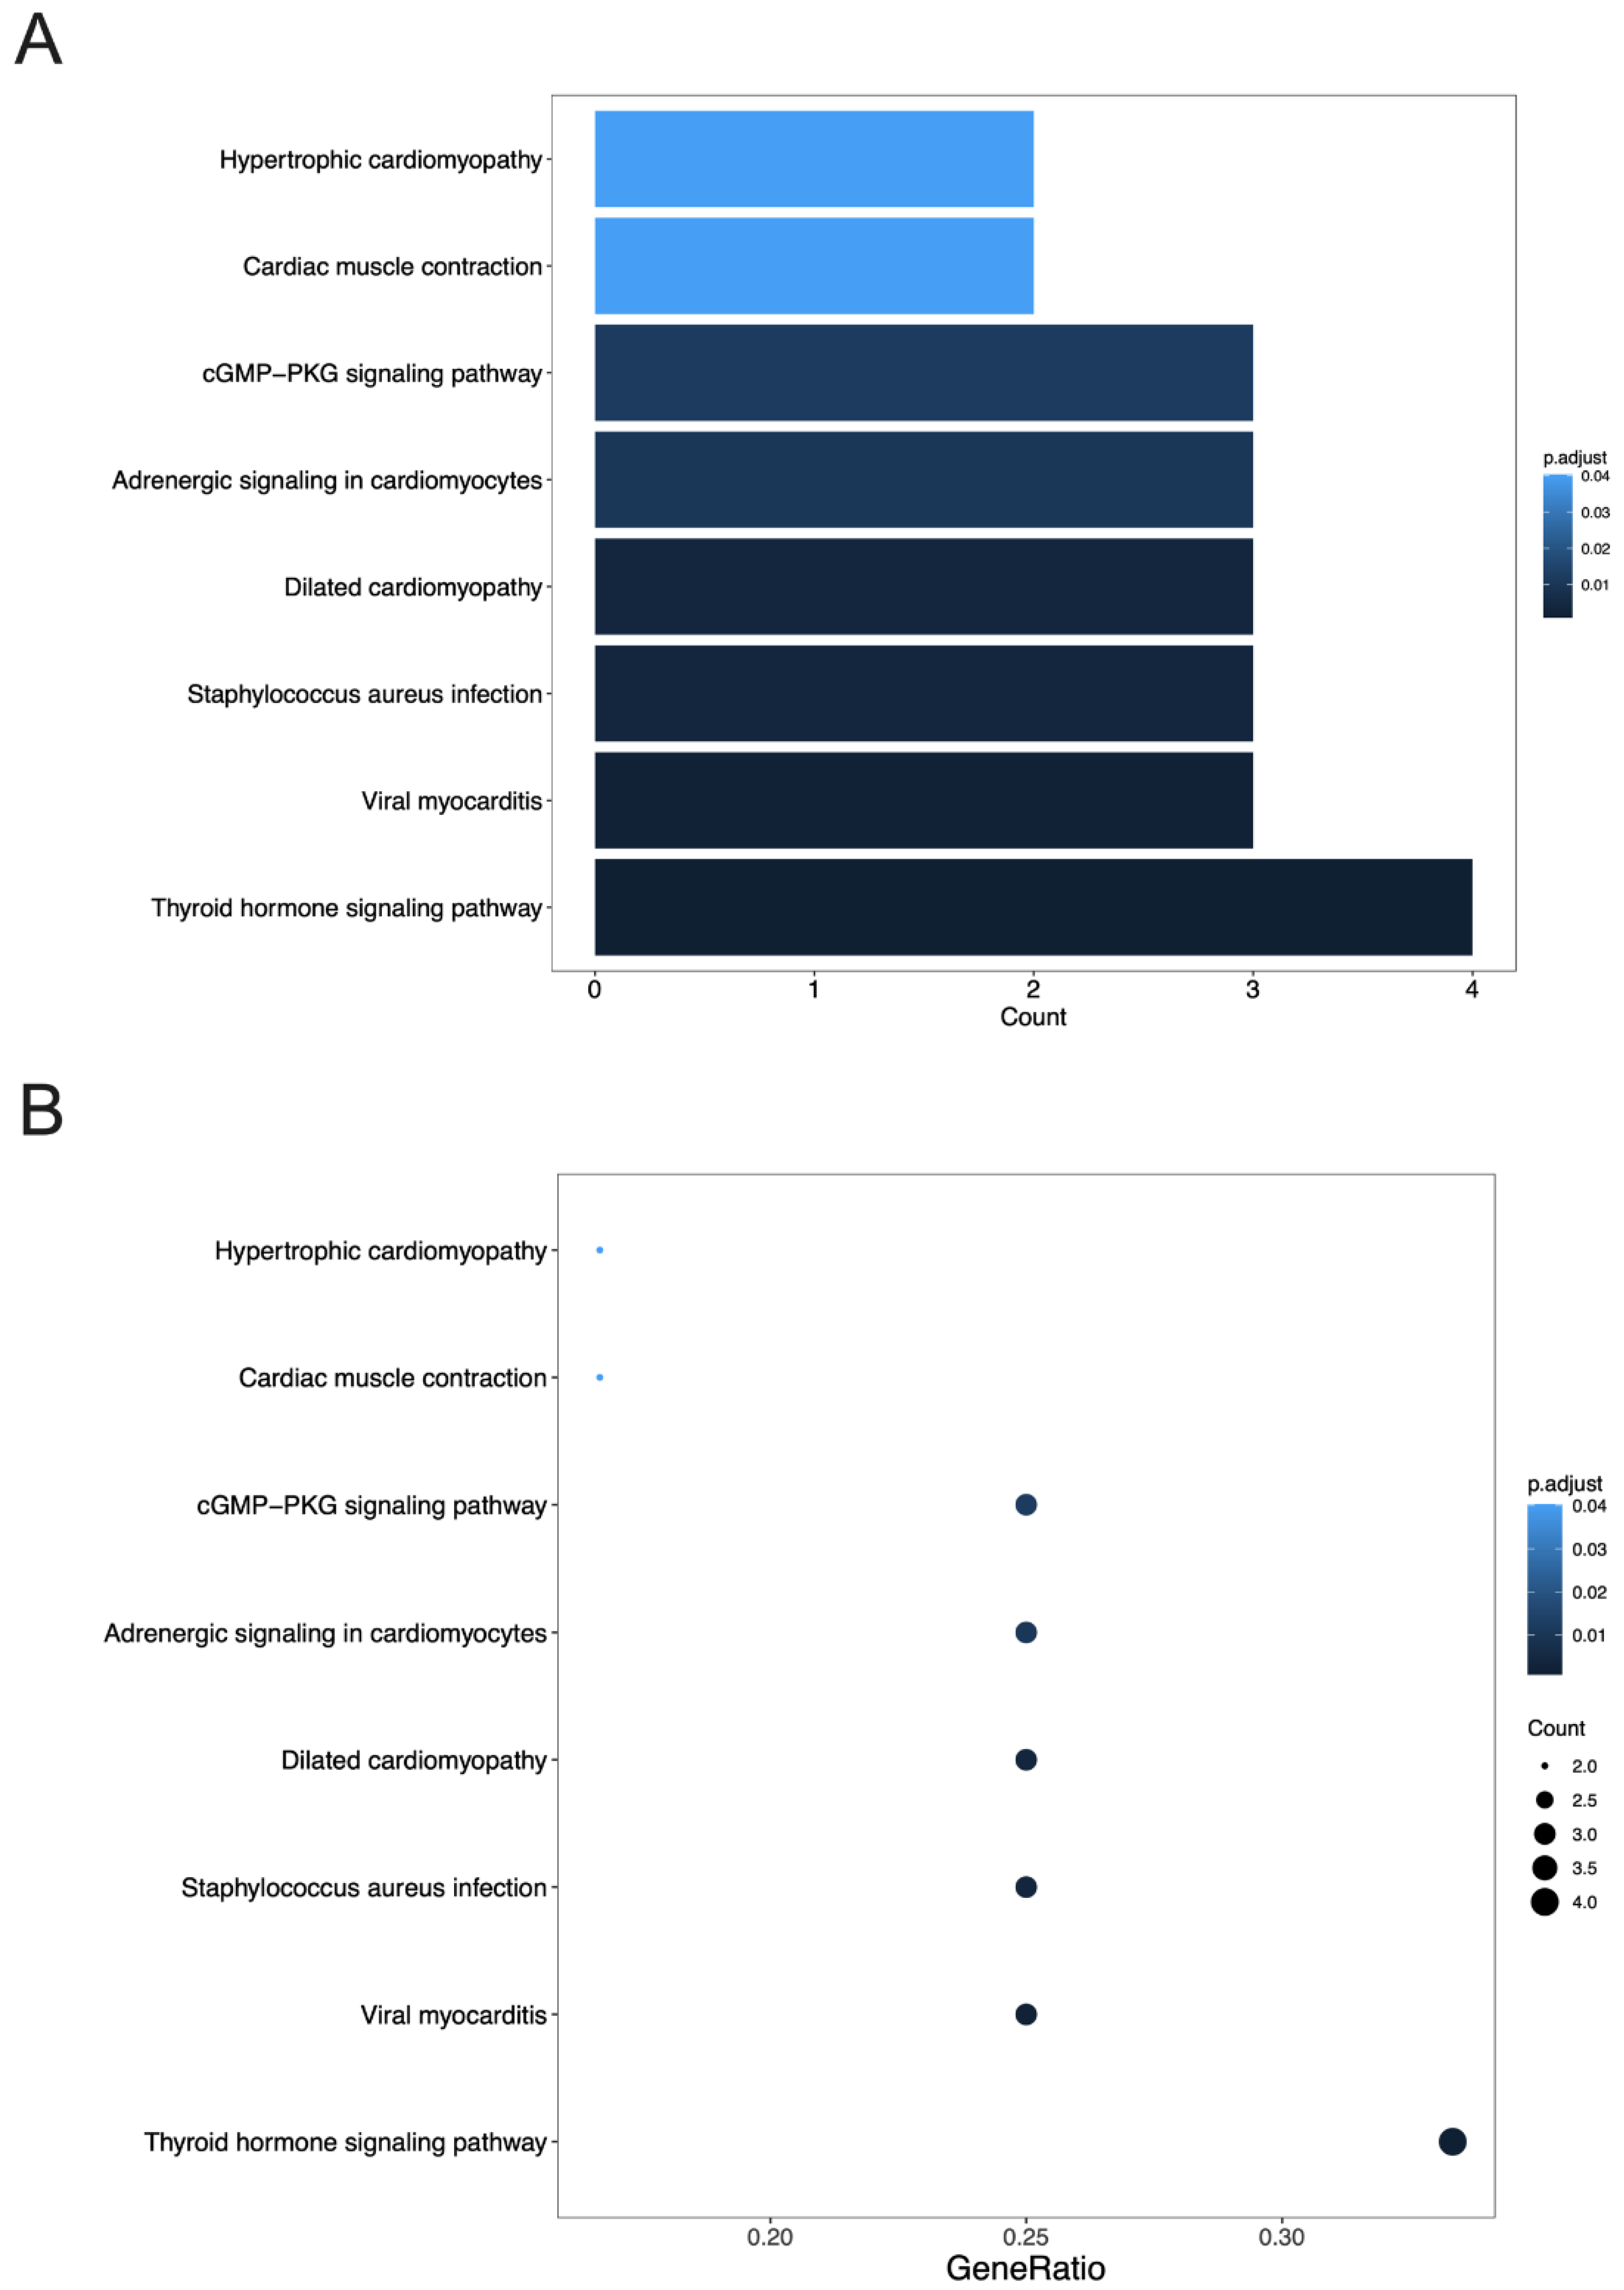
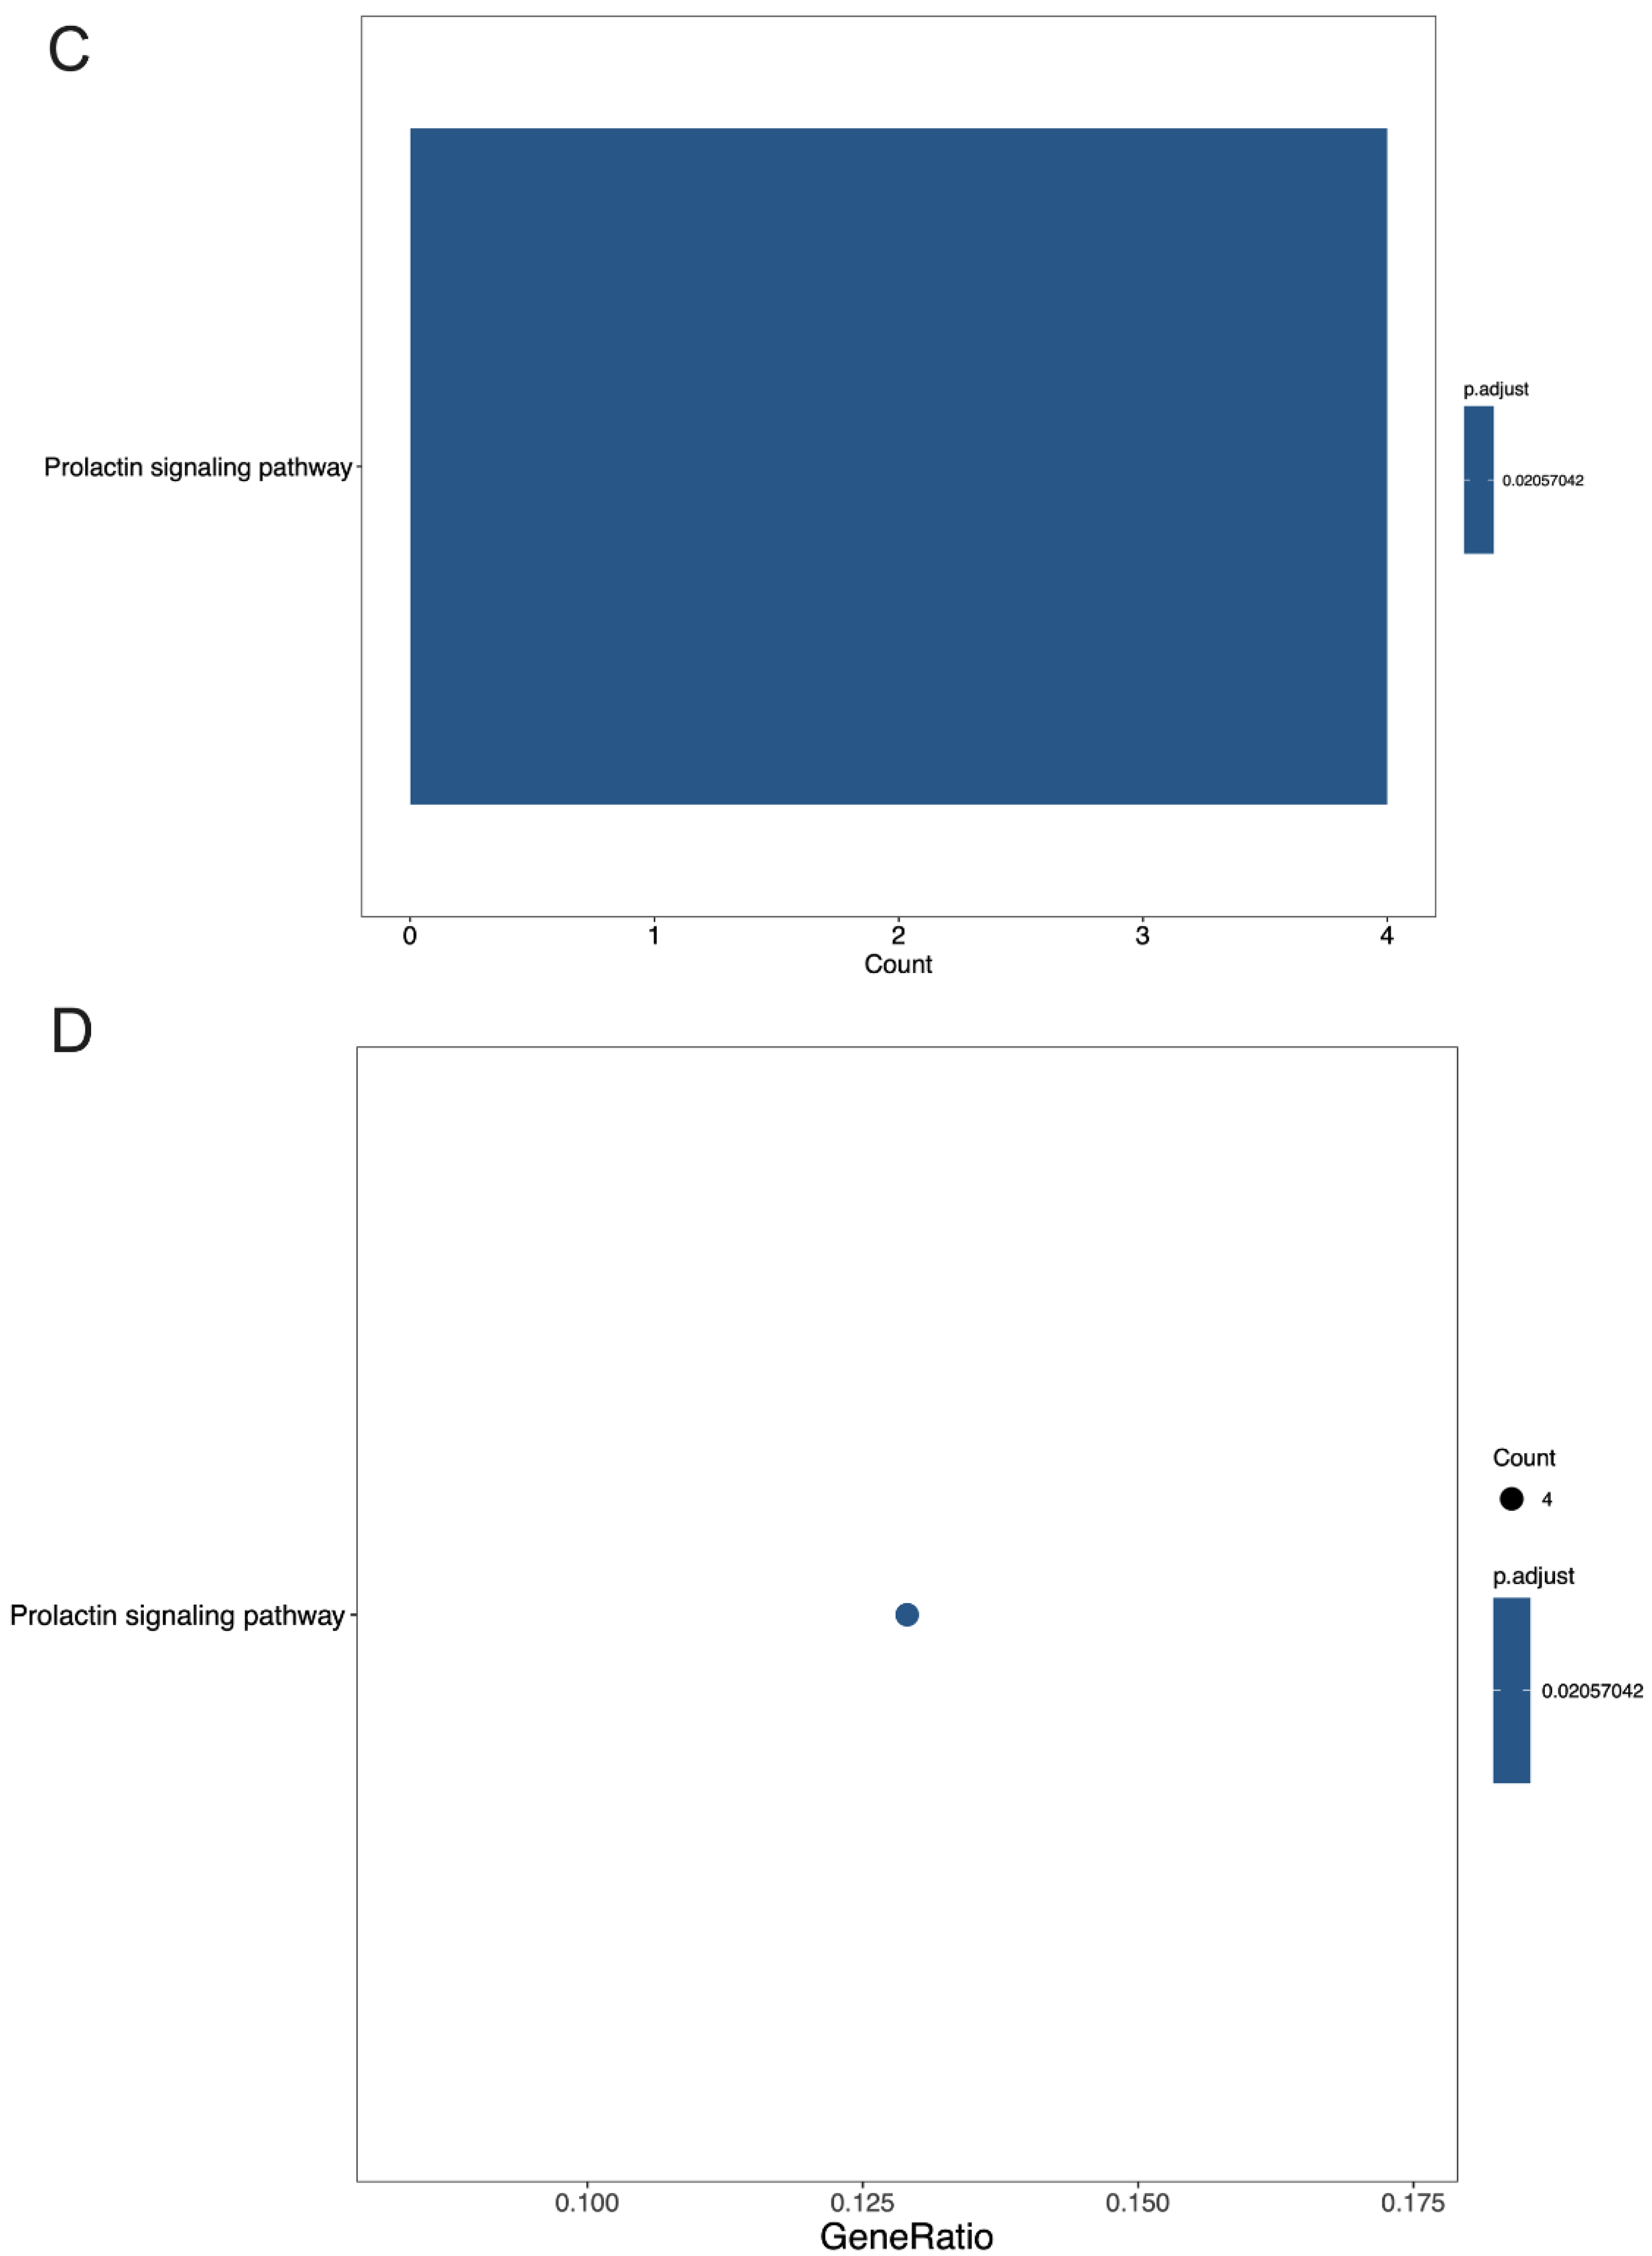
3.4. GO Terms and the KEGG Pathway Analysis of DEGs
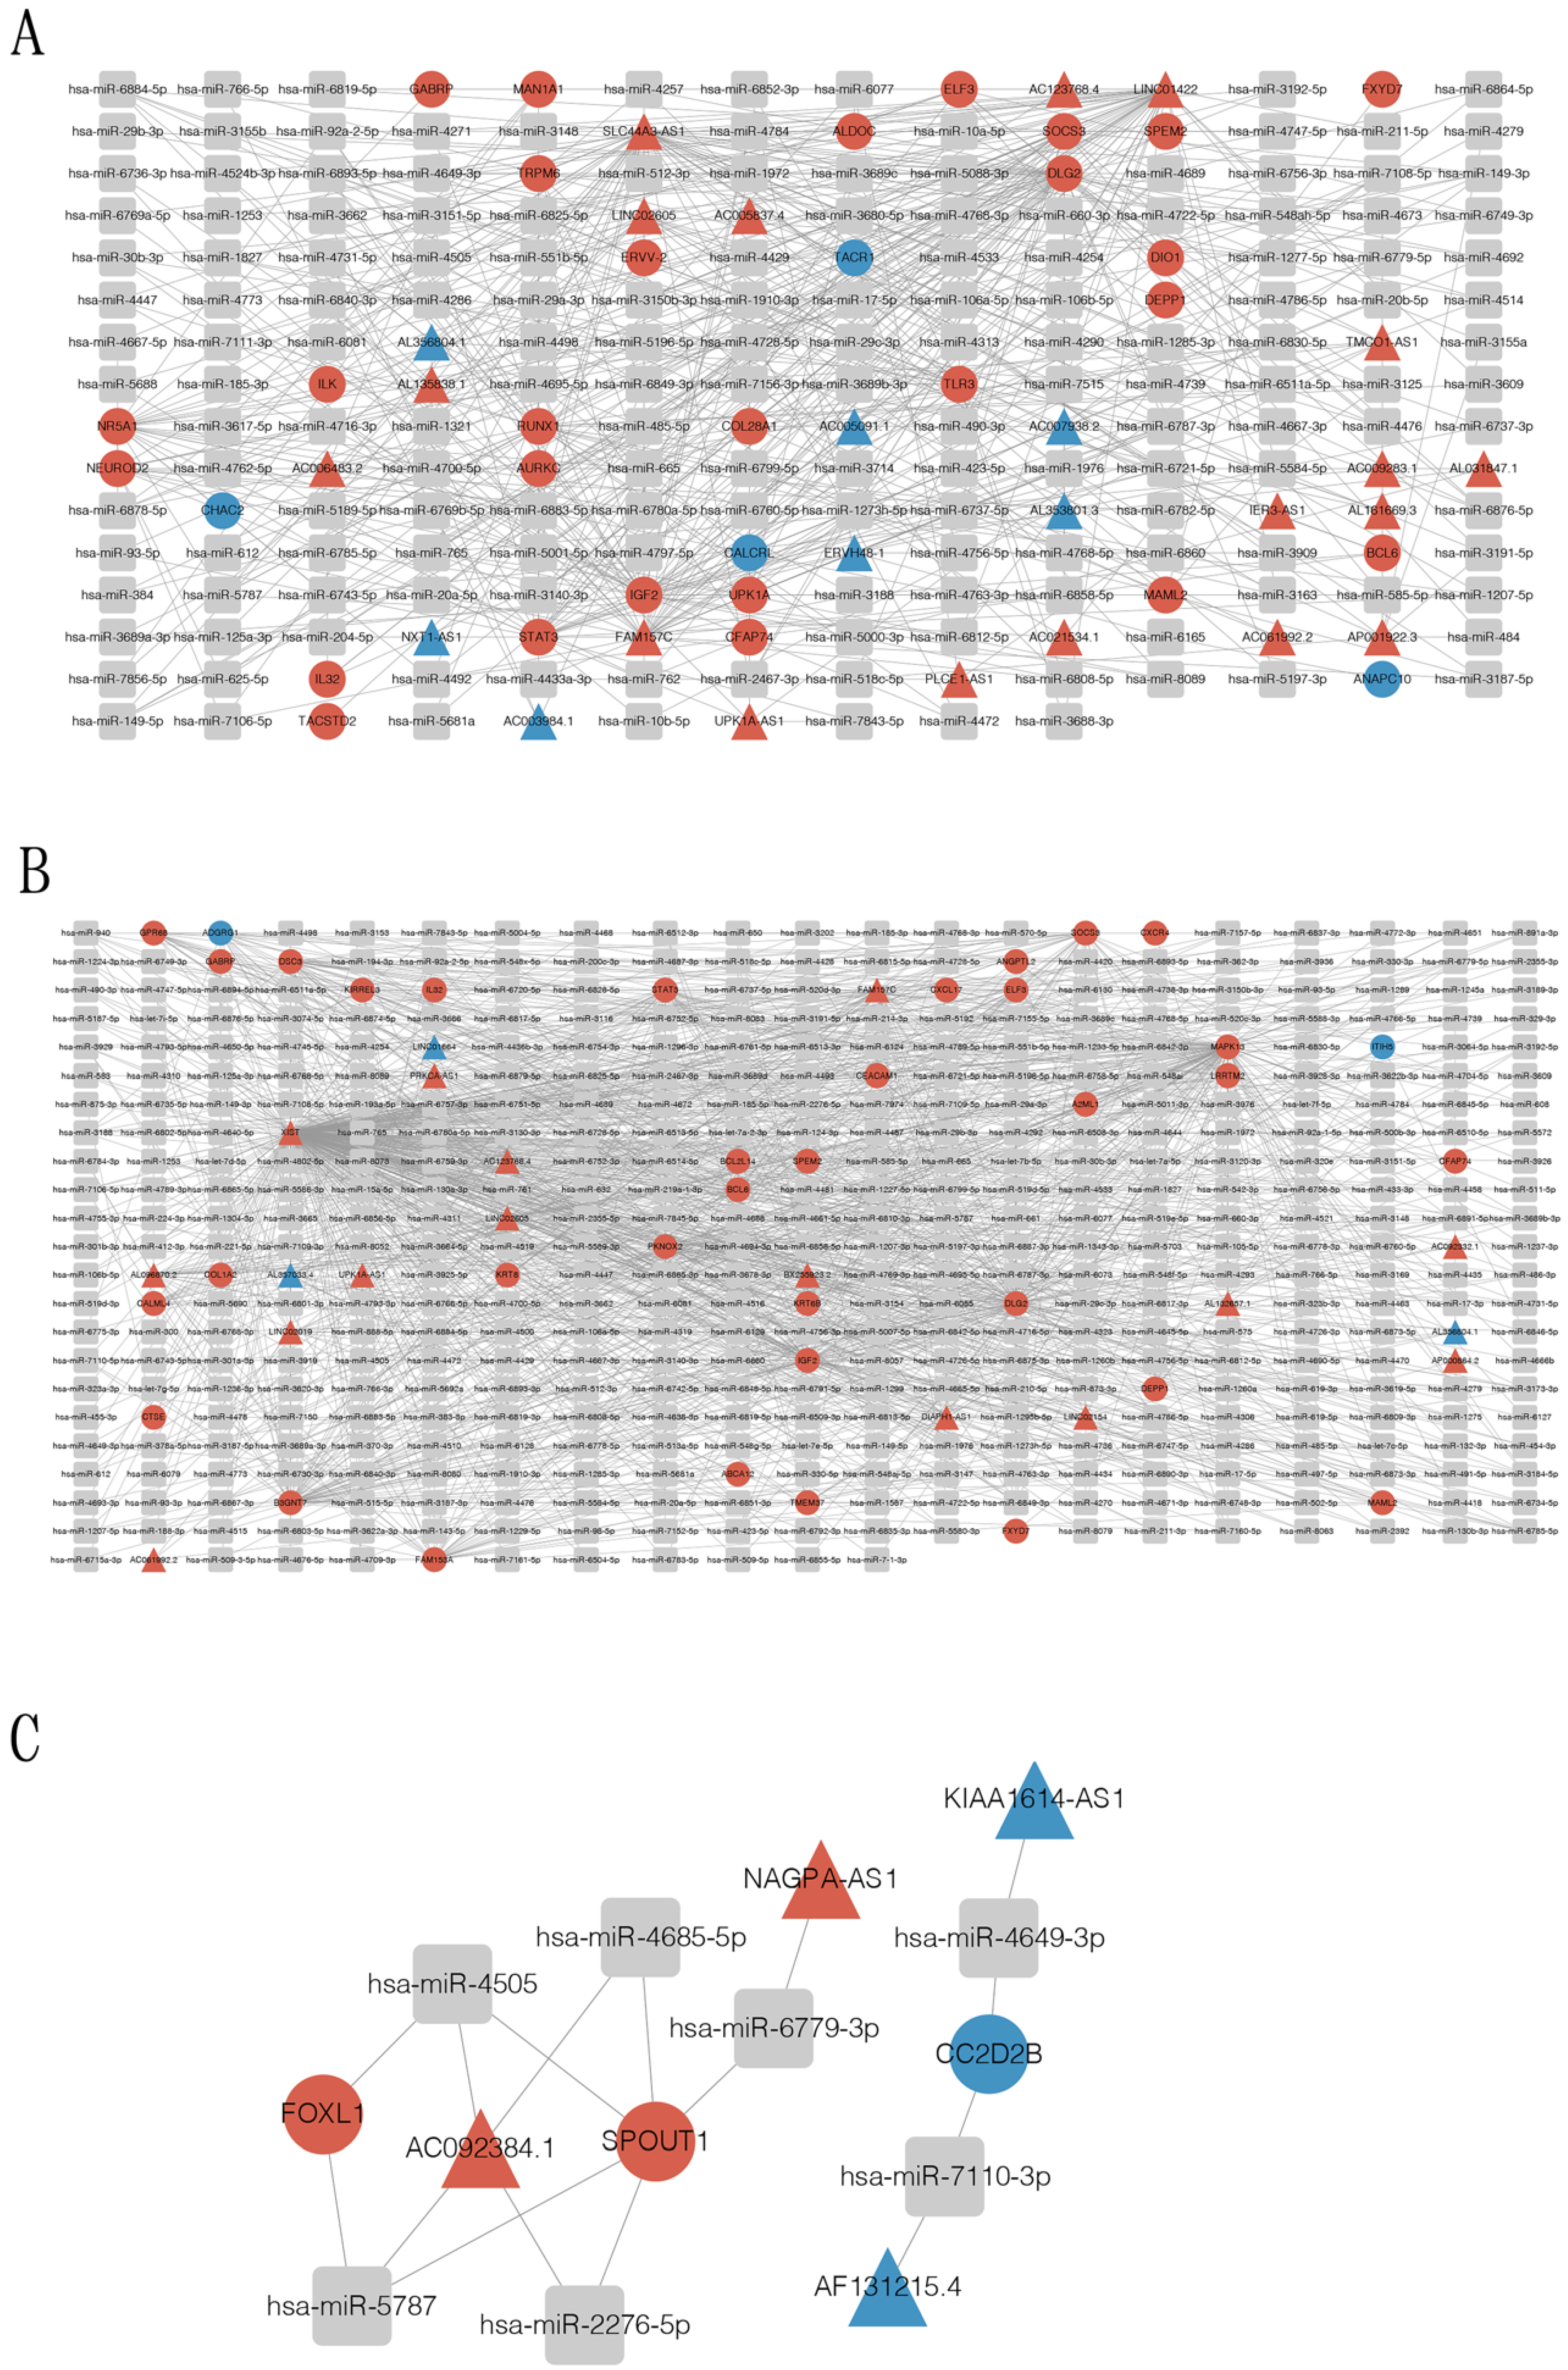
3.5. Construction of Circular RNA-Associated ceRNA Networks
4. Discussion
5. Conclusions
Supplementary Materials
Author Contributions
Funding
Institutional Review Board Statement
Informed Consent Statement
Data Availability Statement
Conflicts of Interest
References
- Siegel, R.L.; Miller, K.D.; Jemal, A. Cancer Statistics, 2017. CA Cancer J. Clin. 2017, 67, 7–30. [Google Scholar] [CrossRef] [PubMed] [Green Version]
- Torre, L.A.; Siegel, R.L.; Jemal, A. Lung Cancer Statistics. Adv. Exp. Med. Biol. 2016, 893, 1–19. [Google Scholar] [CrossRef] [PubMed]
- Hanahan, D.; Weinberg, R.A. Hallmarks of cancer: The next generation. Cell 2011, 144, 646–674. [Google Scholar] [CrossRef] [PubMed] [Green Version]
- Dyachuk, V.; Furlan, A.; Shahidi, M.K.; Giovenco, M.; Kaukua, N.; Konstantinidou, C.; Pachnis, V.; Memic, F.; Marklund, U.; Müller, T.; et al. Parasympathetic neurons originate from nerve-associated peripheral glial progenitors. Science 2014, 345, 82–87. [Google Scholar] [CrossRef] [PubMed] [Green Version]
- Baraldi, J.H.; Martyn, G.V.; Shurin, G.V.; Shurin, M.R. Tumor Innervation: History, Methodologies, and Significance. Cancers 2022, 14, 1979. [Google Scholar] [CrossRef] [PubMed]
- Ayala, G.E.; Dai, H.; Powell, M.; Li, R.; Ding, Y.; Wheeler, T.M.; Shine, D.; Kadmon, D.; Thompson, T.; Miles, B.J.; et al. Cancer-Related Axonogenesis and Neurogenesis in Prostate Cancer. Clin. Cancer Res. 2008, 14, 7593–7603. [Google Scholar] [CrossRef] [PubMed] [Green Version]
- Ayala, G.E.; Wheeler, T.M.; Shine, H.D.; Schmelz, M.; Frolov, A.; Chakraborty, S.; Rowley, D. In vitro dorsal root ganglia and human prostate cell line interaction: Redefining perineural invasion in prostate cancer. Prostate 2001, 49, 213–223. [Google Scholar] [CrossRef]
- Ceyhan, G.O.; Demir, I.E.; Altintas, B.; Rauch, U.; Thiel, G.; Müller, M.W.; Giese, N.A.; Friess, H.; Schäfer, K.-H. Neural invasion in pancreatic cancer: A mutual tropism between neurons and cancer cells. Biochem. Biophys. Res. Commun. 2008, 374, 442–447. [Google Scholar] [CrossRef]
- Albo, D.; Akay, C.L.; Marshall, C.L.; Wilks, J.A.; Verstovsek, G.; Liu, H.; Agarwal, N.; Berger, D.H.; Ayala, G.E. Neurogenesis in colorectal cancer is a marker of aggressive tumor behavior and poor outcomes. Cancer 2011, 117, 4834–4845. [Google Scholar] [CrossRef] [PubMed]
- Taveggia, C.; Feltri, M.L. Beyond Wrapping: Canonical and Noncanonical Functions of Schwann Cells. Annu. Rev. Neurosci. 2022, 45, 561–580. [Google Scholar] [CrossRef]
- Bunimovich, Y.L.; Keskinov, A.A.; Shurin, G.V.; Shurin, M.R. Schwann cells: A new player in the tumor microenvironment. Cancer Immunol. Immunother. 2017, 66, 959–968. [Google Scholar] [CrossRef] [Green Version]
- Deborde, S.; Wong, R.J. The Role of Schwann Cells in Cancer. Adv. Biol. 2022, 6, 2200089. [Google Scholar] [CrossRef] [PubMed]
- Shurin, G.V.; Kruglov, O.; Ding, F.; Lin, Y.; Hao, X.; Keskinov, A.A.; You, Z.; Lokshin, A.E.; LaFramboise, W.A.; Falo, L.D., Jr.; et al. Melanoma-induced reprogramming of Schwann cell signaling aids tumor growth. Cancer Res. 2019, 79, 2736–2747. [Google Scholar] [CrossRef] [PubMed] [Green Version]
- Martyn, G.V.; Shurin, G.V.; Keskinov, A.A.; Bunimovich, Y.L.; Shurin, M.R. Schwann cells shape the neuro-immune environs and control cancer progression. Cancer Immunol. Immunother. 2019, 68, 1819–1829. [Google Scholar] [CrossRef] [PubMed]
- Silva, V.M.; Gomes, J.A.; Tenório, L.P.G.; Neta, G.C.D.O.; Paixão, K.D.C.; Duarte, A.K.F.; Da Silva, G.C.B.; Ferreira, R.J.S.; Koike, B.D.V.; Sales-Marques, C.; et al. Schwann cell reprogramming and lung cancer progression: A meta-analysis of transcriptome data. Oncotarget 2019, 10, 7288–7307. [Google Scholar] [CrossRef] [Green Version]
- Deborde, S.; Omelchenko, T.; Lyubchik, A.; Zhou, Y.; He, S.; McNamara, W.F.; Chernichenko, N.; Lee, S.-Y.; Barajas, F.; Chen, C.-H.; et al. Schwann cells induce cancer cell dispersion and invasion. J. Clin. Investig. 2016, 126, 1538–1554. [Google Scholar] [CrossRef] [Green Version]
- Zhou, Y.; Shurin, G.V.; Zhong, H.; Bunimovich, Y.L.; Han, B.; Shurin, M.R. Schwann Cells Augment Cell Spreading and Metastasis of Lung Cancer. Cancer Res. 2018, 78, 5927–5939. [Google Scholar] [CrossRef] [Green Version]
- Zhou, Y.; Li, J.; Han, B.; Zhong, R.; Zhong, H. Schwann cells promote lung cancer proliferation by promoting the M2 polarization of macrophages. Cell. Immunol. 2020, 357, 104211. [Google Scholar] [CrossRef]
- Gazdar, A.F.; Bunn, P.A.; Minna, J.D. Small-cell lung cancer: What we know, what we need to know and the path forward. Nat. Rev. Cancer 2017, 17, 725–737. [Google Scholar] [CrossRef]
- Remon, J.; Aldea, M.; Besse, B.; Planchard, D.; Reck, M.; Giaccone, G.; Soria, J.-C. Small cell lung cancer: A slightly less orphan disease after immunotherapy. Ann. Oncol. 2021, 32, 698–709. [Google Scholar] [CrossRef]
- van Meerbeeck, J.P.; Fennell, D.A.; De Ruysscher, D.K. Small-cell lung cancer. Lancet 2011, 378, 1741–1755. [Google Scholar] [CrossRef] [PubMed]
- Tsui, D.C.C.; Camidge, D.R.; Rusthoven, C.G. Managing Central Nervous System Spread of Lung Cancer: The State of the Art. J. Clin. Oncol. 2022, 40, 642–660. [Google Scholar] [CrossRef] [PubMed]
- Zanella, C.; Leone, A.G.; Zambelli, L.; Bottiglieri, A.; Canziani, L.; Brambilla, M.; Russo, G.L.; Platania, M.; De Braud, F.; Occhipinti, M. Paraneoplastic neurological syndromes in patients affected by SCLC: A case series. Tumori J. 2022, 108, NP11–NP14. [Google Scholar] [CrossRef]
- Bioconductor. Available online: https://bioconductor.org/packages/release/bioc/html/DESeq2.html (accessed on 20 October 2022).
- Enright, A.J.; John, B.; Gaul, U.; Tuschl, T.; Sander, C.; Marks, D. microRNA Target Detection. Available online: https://cbio.mskcc.org/miRNA2003/miranda.html (accessed on 20 October 2022).
- Target Scan Human. Available online: https://www.targetscan.org/vert_72/ (accessed on 20 October 2022).
- miRDB. Available online: https://www.mirdb.org (accessed on 20 October 2022).
- microRNA-Target Interactions Database. Available online: https://mirtarbase.cuhk.edu.cn/ (accessed on 20 October 2022).
- miRWalk. Available online: http://mirwalk.umm.uni-heidelberg.de (accessed on 20 October 2022).
- Su, D.; Guo, X.; Huang, L.; Ye, H.; Li, Z.; Lin, L.; Chen, R.; Zhou, Q. Tumor-neuroglia interaction promotes pancreatic cancer metastasis. Theranostics 2020, 10, 5029–5047. [Google Scholar] [CrossRef] [PubMed]
- Ein, L.; Mei, C.; Bracho, O.; Bas, E.; Monje, P.; Weed, D.; Sargi, Z.; Thomas, G.; Dinh, C. Modulation of BDNF–TRKB Interactions on Schwann Cell-induced Oral Squamous Cell Carcinoma Dispersion in vitro. Anticancer Res. 2019, 39, 5933–5942. [Google Scholar] [CrossRef] [PubMed]
- Sun, L.; Chen, S.; Chen, M. Schwann Cells in the Tumor Microenvironment: Need More Attention. J. Oncol. 2022, 2022, 1–10. [Google Scholar] [CrossRef] [PubMed]
- Erin, N.; Shurin, G.V.; Baraldi, J.H.; Shurin, M.R. Regulation of Carcinogenesis by Sensory Neurons and Neuromediators. Cancers 2022, 14, 2333. [Google Scholar] [CrossRef] [PubMed]
- Yurteri, Ü.; Çifcibaşı, K.; Friess, H.; Ceyhan, G.O.; Istvanffy, R.; Demir, I.E. Schwann Cells in Peripheral Cancers: Bystanders or Prwomoters? Adv. Biol. 2022, 6, e2200033. [Google Scholar] [CrossRef]
- Zhang, S.H.; Shurin, G.V.; Khosravi, H.; Kazi, R.; Kruglov, O.; Shurin, M.R.; Bunimovich, Y.L. Immunomodulation by Schwann cells in disease. Cancer Immunol. Immunother. 2020, 69, 245–253. [Google Scholar] [CrossRef]
- Huang, T.; Fan, Q.; Wang, Y.; Cui, Y.; Wang, Z.; Yang, L.; Sun, X.; Wang, Y. Schwann Cell-Derived CCL2 Promotes the Perineural Invasion of Cervical Cancer. Front. Oncol. 2020, 10, 19. [Google Scholar] [CrossRef]
- Hanlon, M.M.; Rakovich, T.; Cunningham, C.C.; Ansboro, S.; Veale, D.J.; Fearon, U.; McGarry, T. STAT3 Mediates the Differential Effects of Oncostatin M and TNFα on RA Synovial Fibroblast and Endothelial Cell Function. Front. Immunol. 2019, 10, 2056. [Google Scholar] [CrossRef] [Green Version]
- Rawlings, J.S.; Rosler, K.M.; Harrison, D.A. The JAK/STAT signaling pathway. J. Cell Sci. 2004, 117, 1281–1283. [Google Scholar] [CrossRef] [PubMed] [Green Version]
- Wang, T.; Niu, G.; Kortylewski, M.; Burdelya, L.; Shain, K.; Zhang, S.; Bhattacharya, R.; Gabrilovich, D.; Heller, R.; Coppola, D.; et al. Regulation of the innate and adaptive immune responses by Stat-3 signaling in tumor cells. Nat. Med. 2003, 10, 48–54. [Google Scholar] [CrossRef] [PubMed]
- Zou, S.; Tong, Q.; Liu, B.; Huang, W.; Tian, Y.; Fu, X. Targeting STAT3 in Cancer Immunotherapy. Mol. Cancer 2020, 19, 1–19. [Google Scholar] [CrossRef] [PubMed]
- Isomoto, H. Epigenetic alterations in cholangiocarcinoma-sustained IL-6/STAT3 signaling in cholangio- carcinoma due to SOCS3 epigenetic silencing. Digestion 2009, 79, 2–8. [Google Scholar] [CrossRef]
- Boosani, C.S.; Agrawal, D.K. Methylation and microRNA-mediated epigenetic regulation of SOCS3. Mol. Biol. Rep. 2015, 42, 853–872. [Google Scholar] [CrossRef] [Green Version]
- Zhou, T.; Luo, M.; Cai, W.; Zhou, S.; Feng, D.; Xu, C.; Wang, H. Runt-Related Transcription Factor 1 (RUNX1) Promotes TGF-β-Induced Renal Tubular Epithelial-to-Mesenchymal Transition (EMT) and Renal Fibrosis through the PI3K Subunit p110δ. eBioMedicine 2018, 31, 217–225. [Google Scholar] [CrossRef] [Green Version]
- Alonso-Alconada, L.; Muinelo-Romay, L.; Madissoo, K.; Diaz-Lopez, A.; Krakstad, C.; Trovik, J.; Wik, E.; Hapangama, D.; Coenegrachts, L.; Cano, A.; et al. Molecular profiling of circulating tumor cells links plasticity to the metastatic process in endometrial cancer. Mol. Cancer 2014, 13, 223. [Google Scholar] [CrossRef] [Green Version]
- Scheitz, C.J.; Lee, T.S.; McDermitt, D.J.; Tumbar, T. Defining a tissue stem cell-driven Runx1/Stat3 signalling axis in epithelial cancer. EMBO J. 2012, 31, 4124–4139. [Google Scholar] [CrossRef] [Green Version]
- Nigri, J.; Gironella, M.; Bressy, C.; Vila-Navarro, E.; Roques, J.; Lac, S.; Bontemps, C.; Kozaczyk, C.; Cros, J.; Pietrasz, D.; et al. PAP/REG3A favors perineural invasion in pancreatic adenocarcinoma and serves as a prognostic marker. Cell. Mol. Life Sci. 2017, 74, 4231–4243. [Google Scholar] [CrossRef]
- Zhou, B.; Lin, W.; Long, Y.; Yang, Y.; Zhang, H.; Wu, K.; Chu, Q. Notch signaling pathway: Architecture, disease, and therapeutics. Signal Transduct. Target. Therapy 2022, 7, 95. [Google Scholar] [CrossRef] [PubMed]
- Anusewicz, D.; Orzechowska, M.; Bednarek, A. Notch Signaling Pathway in Cancer—Review with Bioinformatic Analysis. Cancers 2021, 13, 768. [Google Scholar] [CrossRef] [PubMed]
- Majumder, S.; Crabtree, J.S.; Golde, T.E.; Minter, L.M.; Osborne, B.A.; Miele, L. Targeting Notch in oncology: The path forward. Nat. Rev. Drug Discov. 2021, 20, 125–144. [Google Scholar] [CrossRef] [PubMed]
- George, J.; Lim, J.S.; Jang, S.J.; Cun, Y.; Ozretić, L.; Kong, G.; Leenders, F.; Lu, X.; Fernández-Cuesta, L.; Bosco, G.; et al. Comprehensive genomic profiles of small cell lung cancer. Nature 2015, 524, 47–53. [Google Scholar] [CrossRef] [PubMed] [Green Version]
- Woodhoo, A.; Alonso, M.B.D.; Droggiti, A.; Turmaine, M.; D’Antonio, M.; Parkinson, D.B.; Wilton, D.K.; Al-Shawi, R.; Simons, P.; Shen, J.; et al. Notch controls embryonic Schwann cell differentiation, postnatal myelination and adult plasticity. Nat. Neurosci. 2009, 12, 839–847. [Google Scholar] [CrossRef] [Green Version]
- Miyashita, N.; Horie, M.; Suzuki, H.I.; Saito, M.; Mikami, Y.; Okuda, K.; Boucher, R.C.; Suzukawa, M.; Hebisawa, A.; Saito, A.; et al. FOXL1 Regulates Lung Fibroblast Function via Multiple Mechanisms. Am. J. Respir. Cell Mol. Biol. 2020, 63, 831–842. [Google Scholar] [CrossRef]
- Luo, D.-B.; Lv, H.-B.; Sun, X.-H.; Wang, Y.; Chu, J.-H.; Salai, A.-L. LncRNA TRERNA1 promotes malignant progression of NSCLC through targeting FOXL1. Eur. Rev. Med. Pharmacol. Sci. 2020, 24, 1233–1242. [Google Scholar]
- Dombi, E.; Baldwin, A.; Marcus, L.J.; Fisher, M.J.; Weiss, B.; Kim, A.; Whitcomb, P.; Martin, S.; Aschbacher-Smith, L.E.; Rizvi, T.A.; et al. Activity of Selumetinib in Neurofibromatosis Type 1–Related Plexiform Neurofibromas. N. Engl. J. Med. 2016, 375, 2550–2560. [Google Scholar] [CrossRef]


Publisher’s Note: MDPI stays neutral with regard to jurisdictional claims in published maps and institutional affiliations. |
© 2022 by the authors. Licensee MDPI, Basel, Switzerland. This article is an open access article distributed under the terms and conditions of the Creative Commons Attribution (CC BY) license (https://creativecommons.org/licenses/by/4.0/).
Share and Cite
Cao, S.; Wang, Y.; Zhou, Y.; Zhang, Y.; Ling, X.; Zhang, L.; Li, J.; Yang, Y.; Wang, W.; Shurin, M.R.; et al. A Novel Therapeutic Target for Small-Cell Lung Cancer: Tumor-Associated Repair-like Schwann Cells. Cancers 2022, 14, 6132. https://0-doi-org.brum.beds.ac.uk/10.3390/cancers14246132
Cao S, Wang Y, Zhou Y, Zhang Y, Ling X, Zhang L, Li J, Yang Y, Wang W, Shurin MR, et al. A Novel Therapeutic Target for Small-Cell Lung Cancer: Tumor-Associated Repair-like Schwann Cells. Cancers. 2022; 14(24):6132. https://0-doi-org.brum.beds.ac.uk/10.3390/cancers14246132
Chicago/Turabian StyleCao, Shuhui, Yue Wang, Yan Zhou, Yao Zhang, Xuxinyi Ling, Lincheng Zhang, Jingwen Li, Yu Yang, Weimin Wang, Michael R. Shurin, and et al. 2022. "A Novel Therapeutic Target for Small-Cell Lung Cancer: Tumor-Associated Repair-like Schwann Cells" Cancers 14, no. 24: 6132. https://0-doi-org.brum.beds.ac.uk/10.3390/cancers14246132