
Prediction of Early Response to Immunotherapy: DCE-US as a New Biomarker

 , , , , , and
Abstract
:Simple Summary
Abstract
1. Introduction
2. Materials and Methods
2.1. Patients
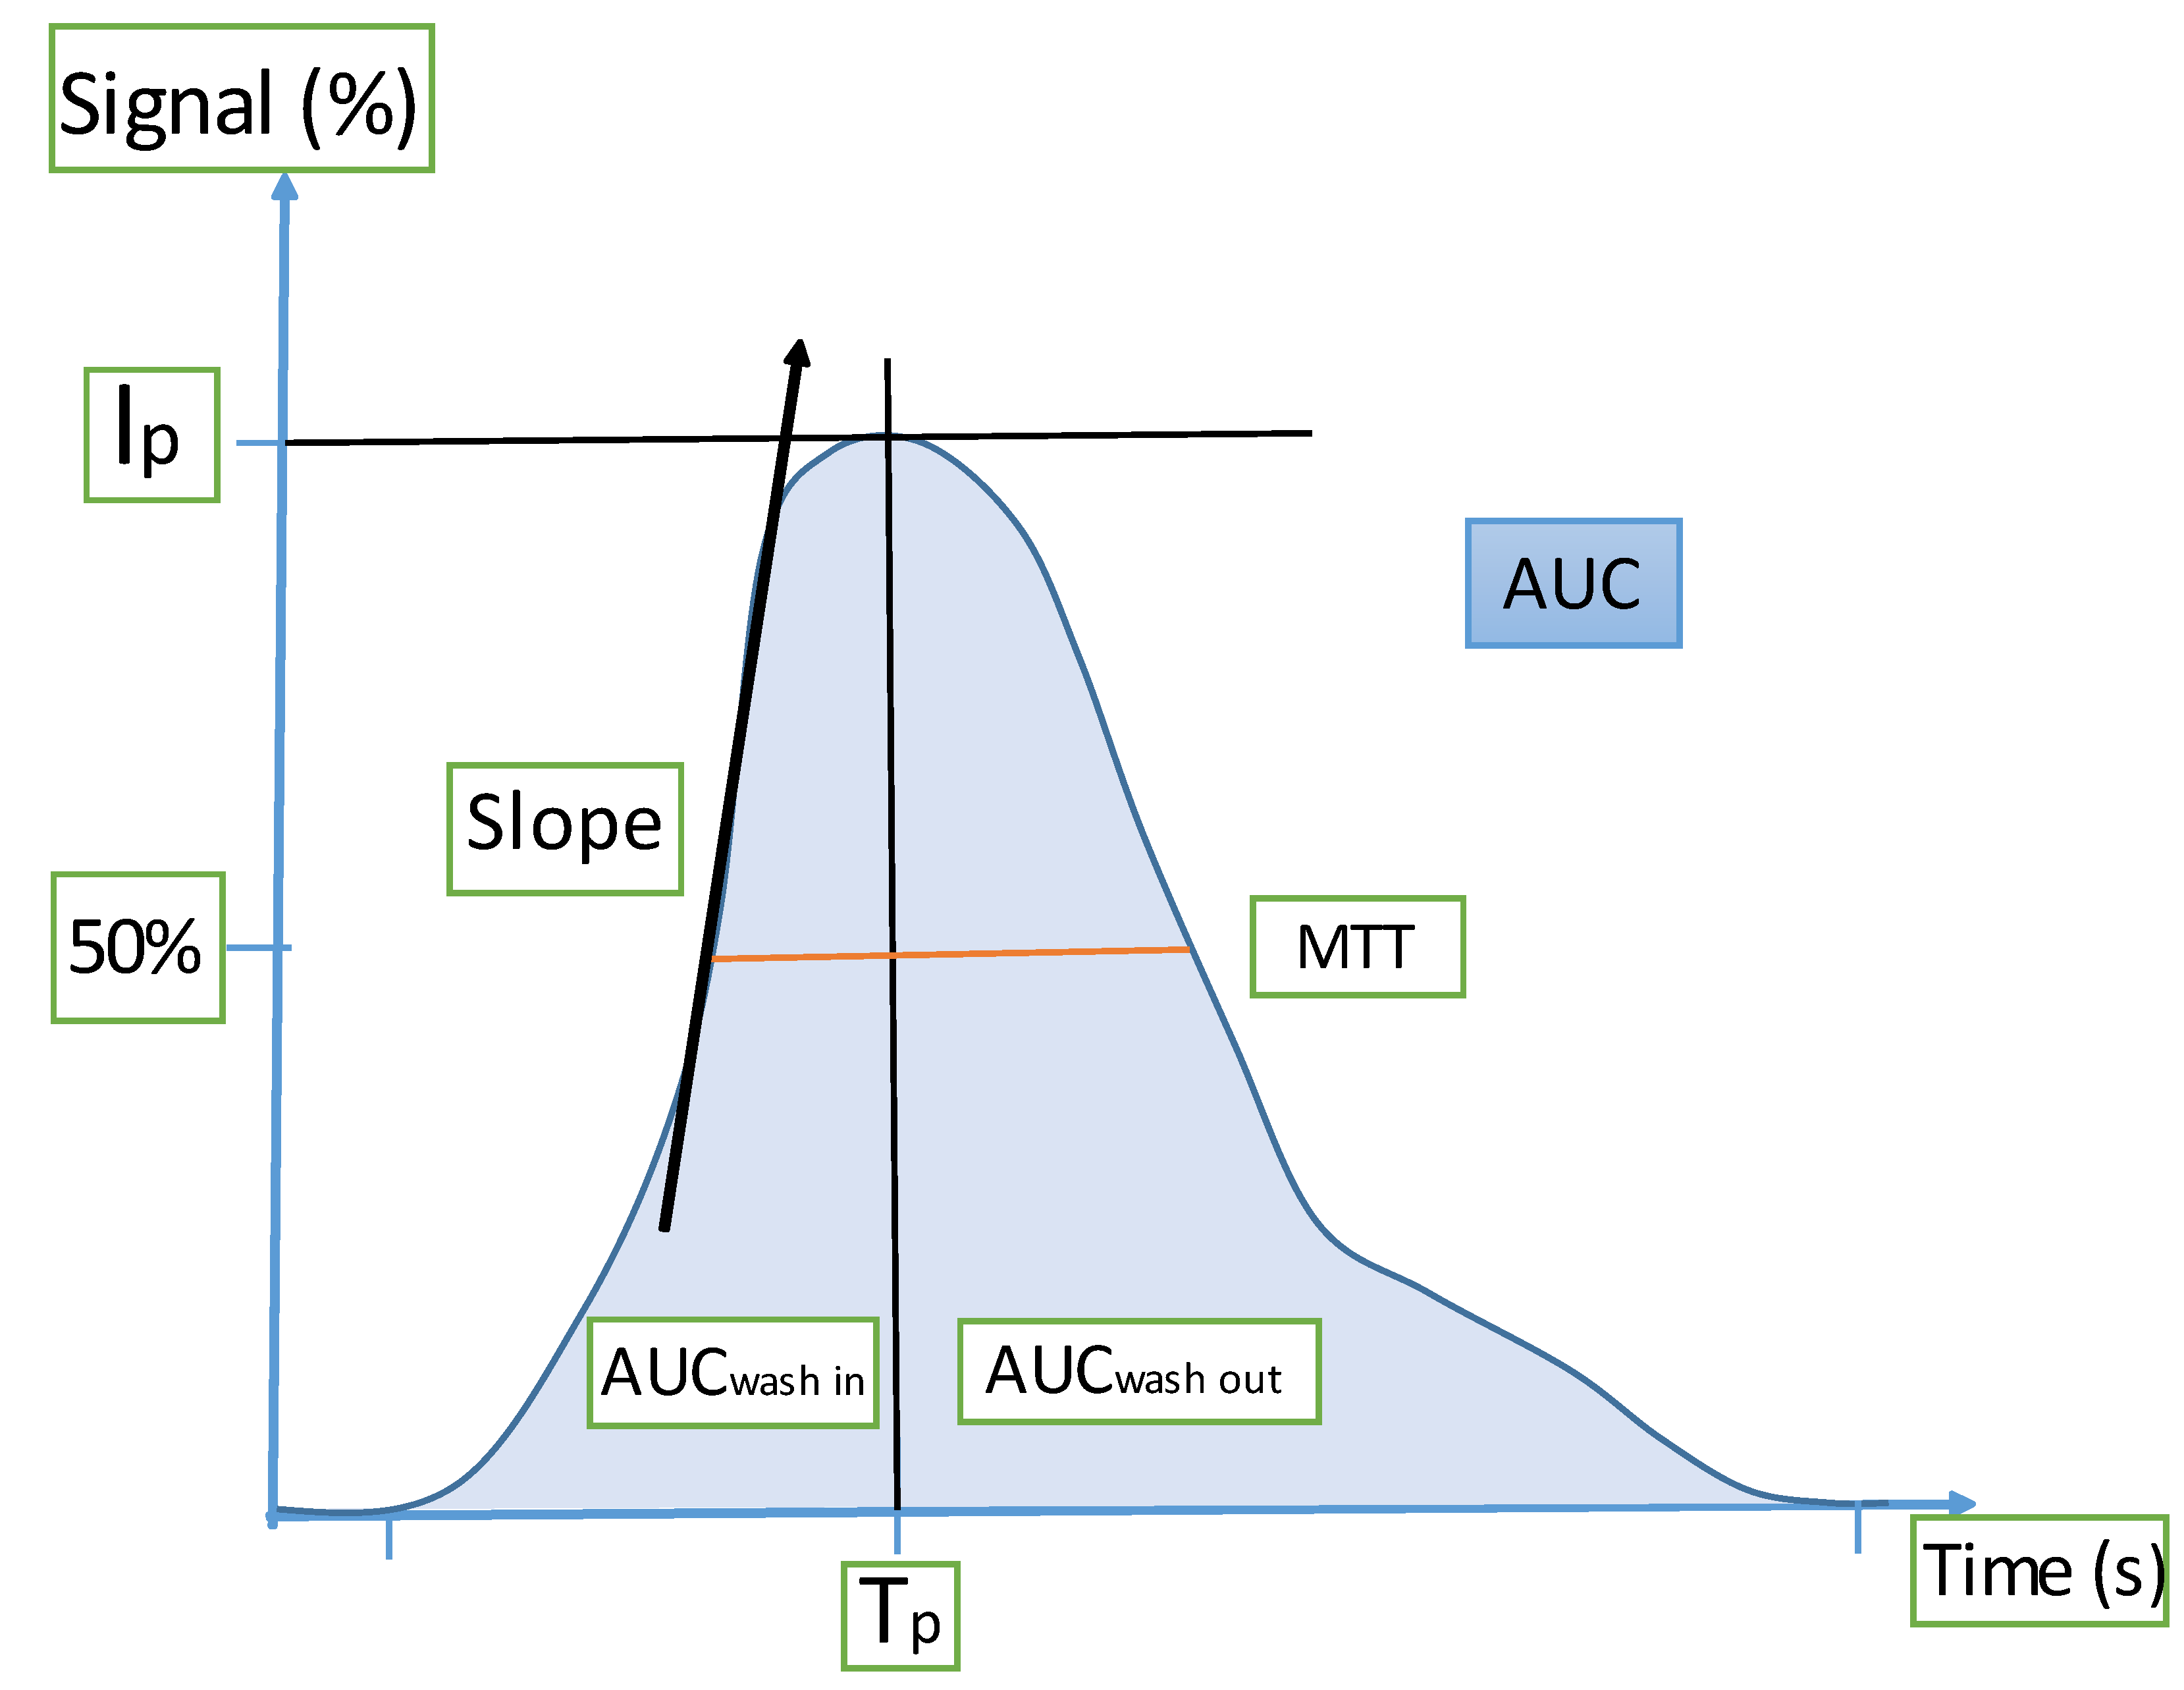
2.2. DCE-US Technique and Quantification
2.3. Assessments
2.4. Analysis
3. Results
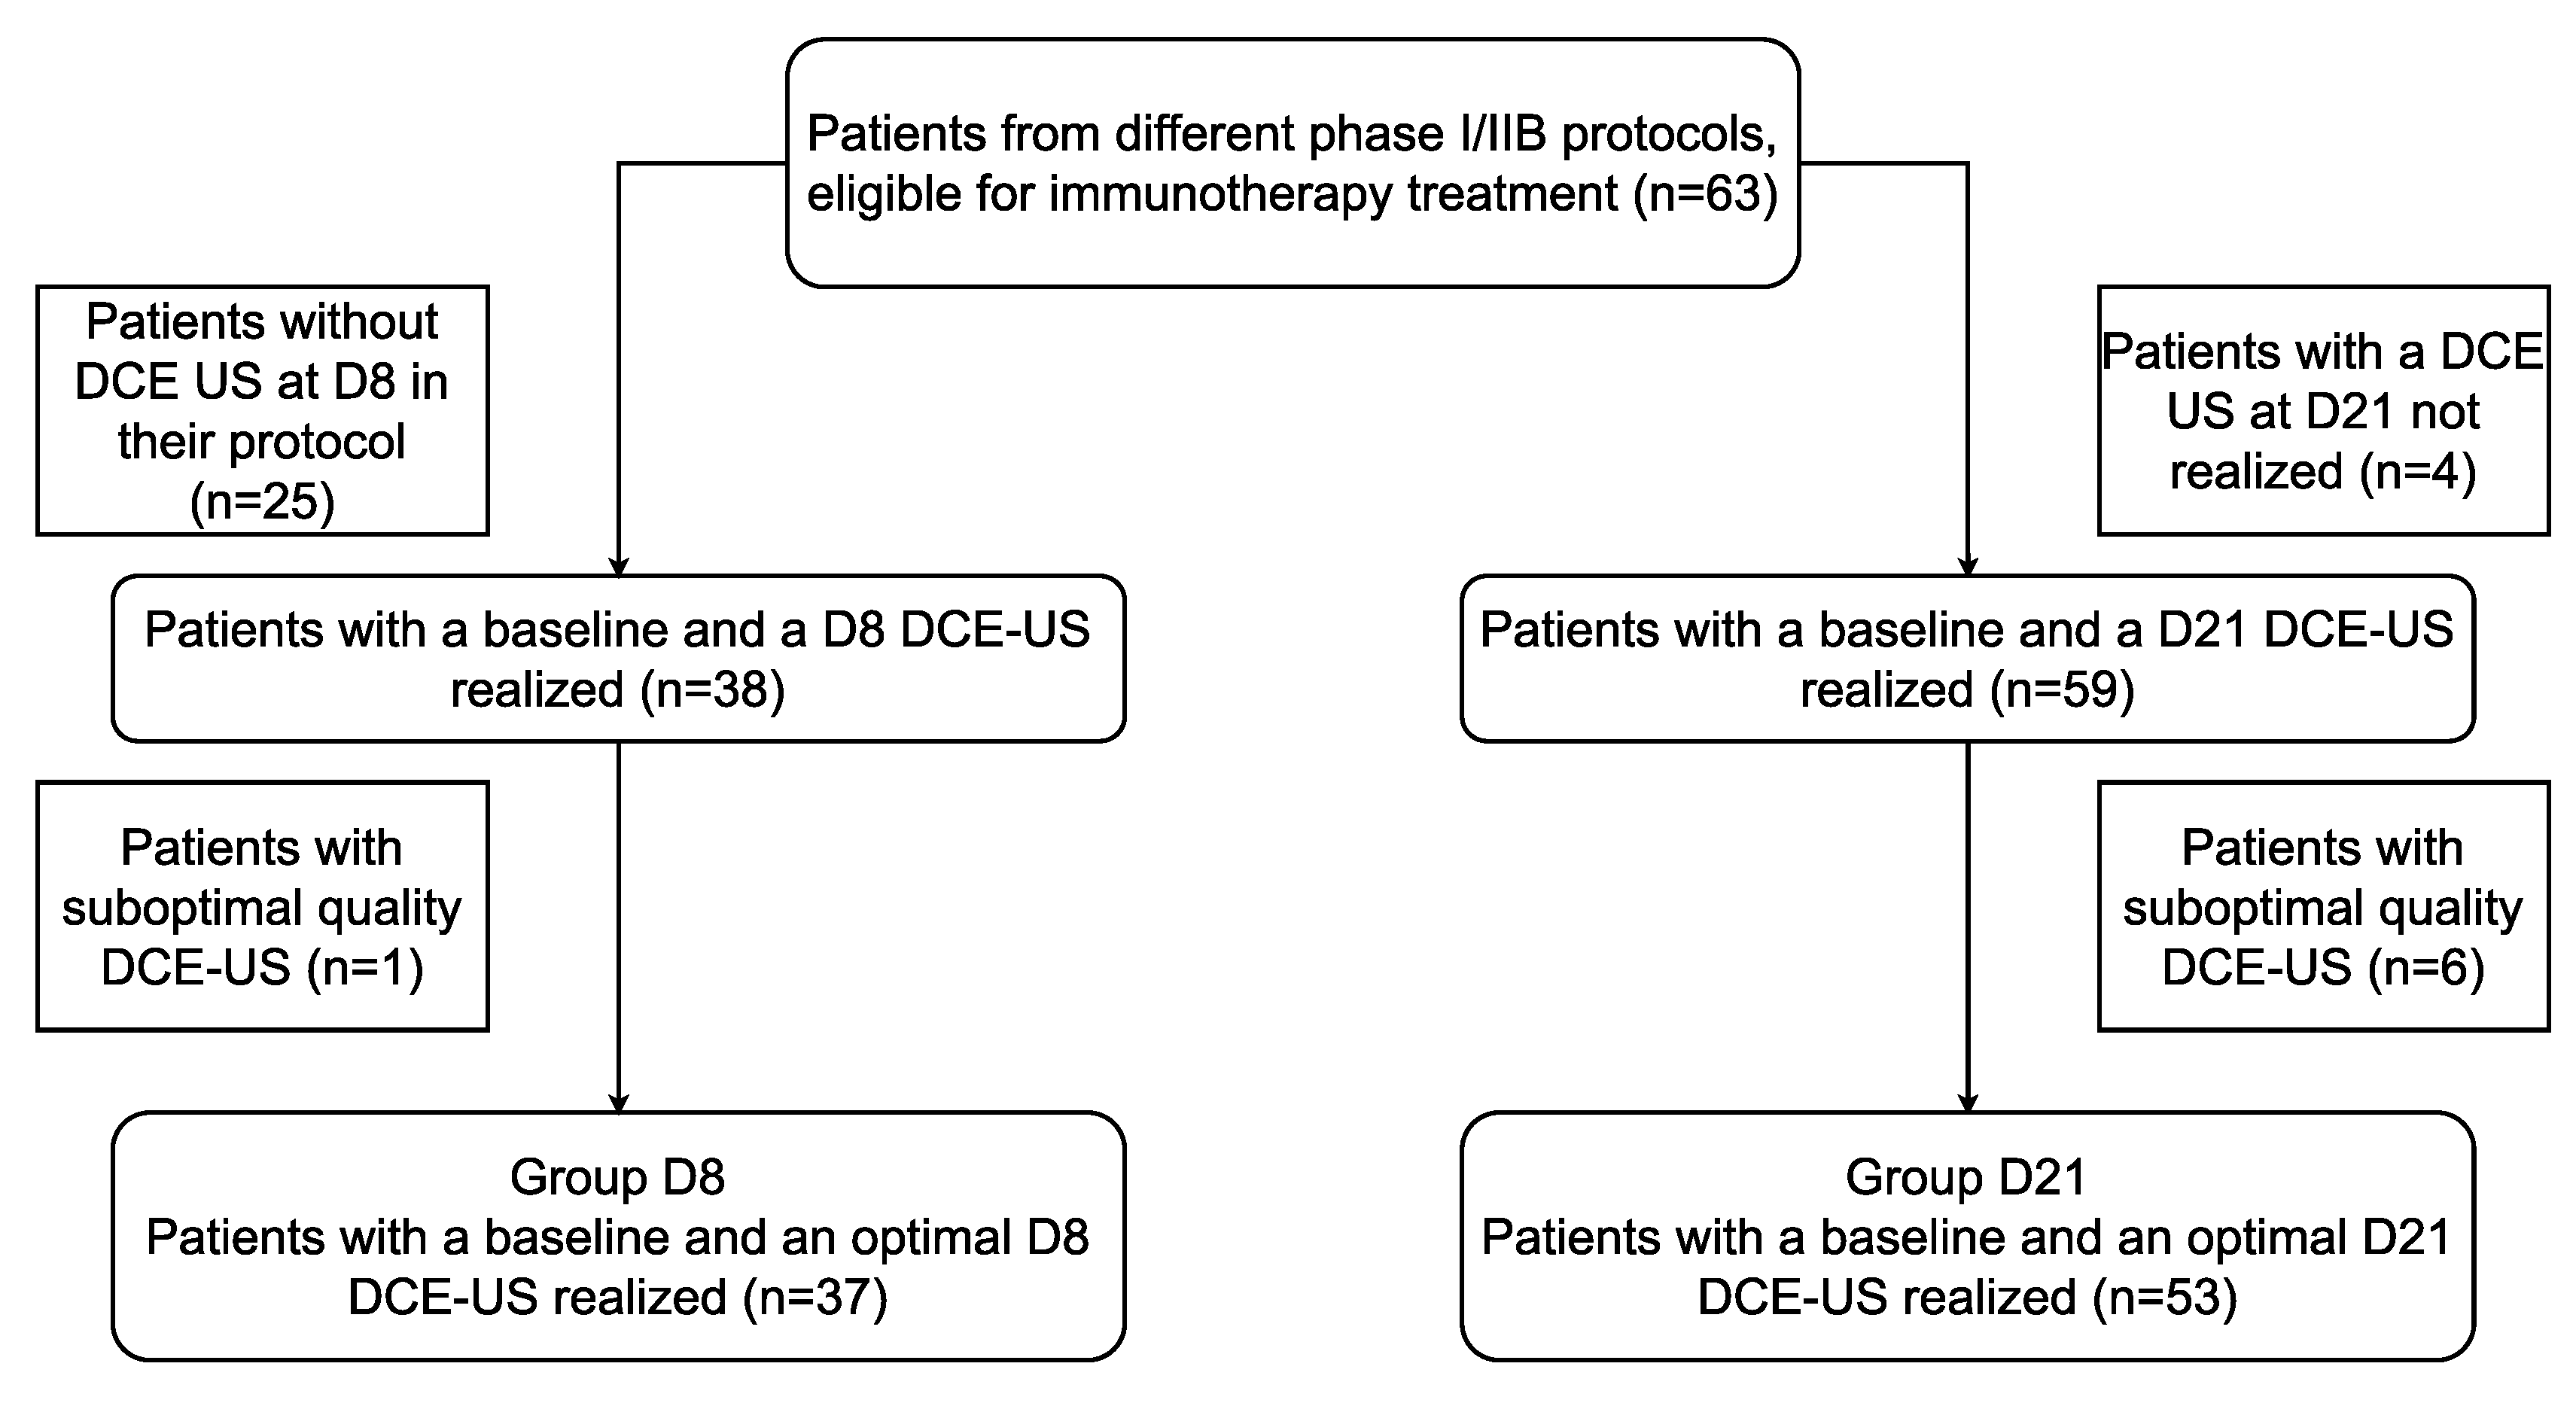
3.1. Population
3.2. At D8
3.3. At D21
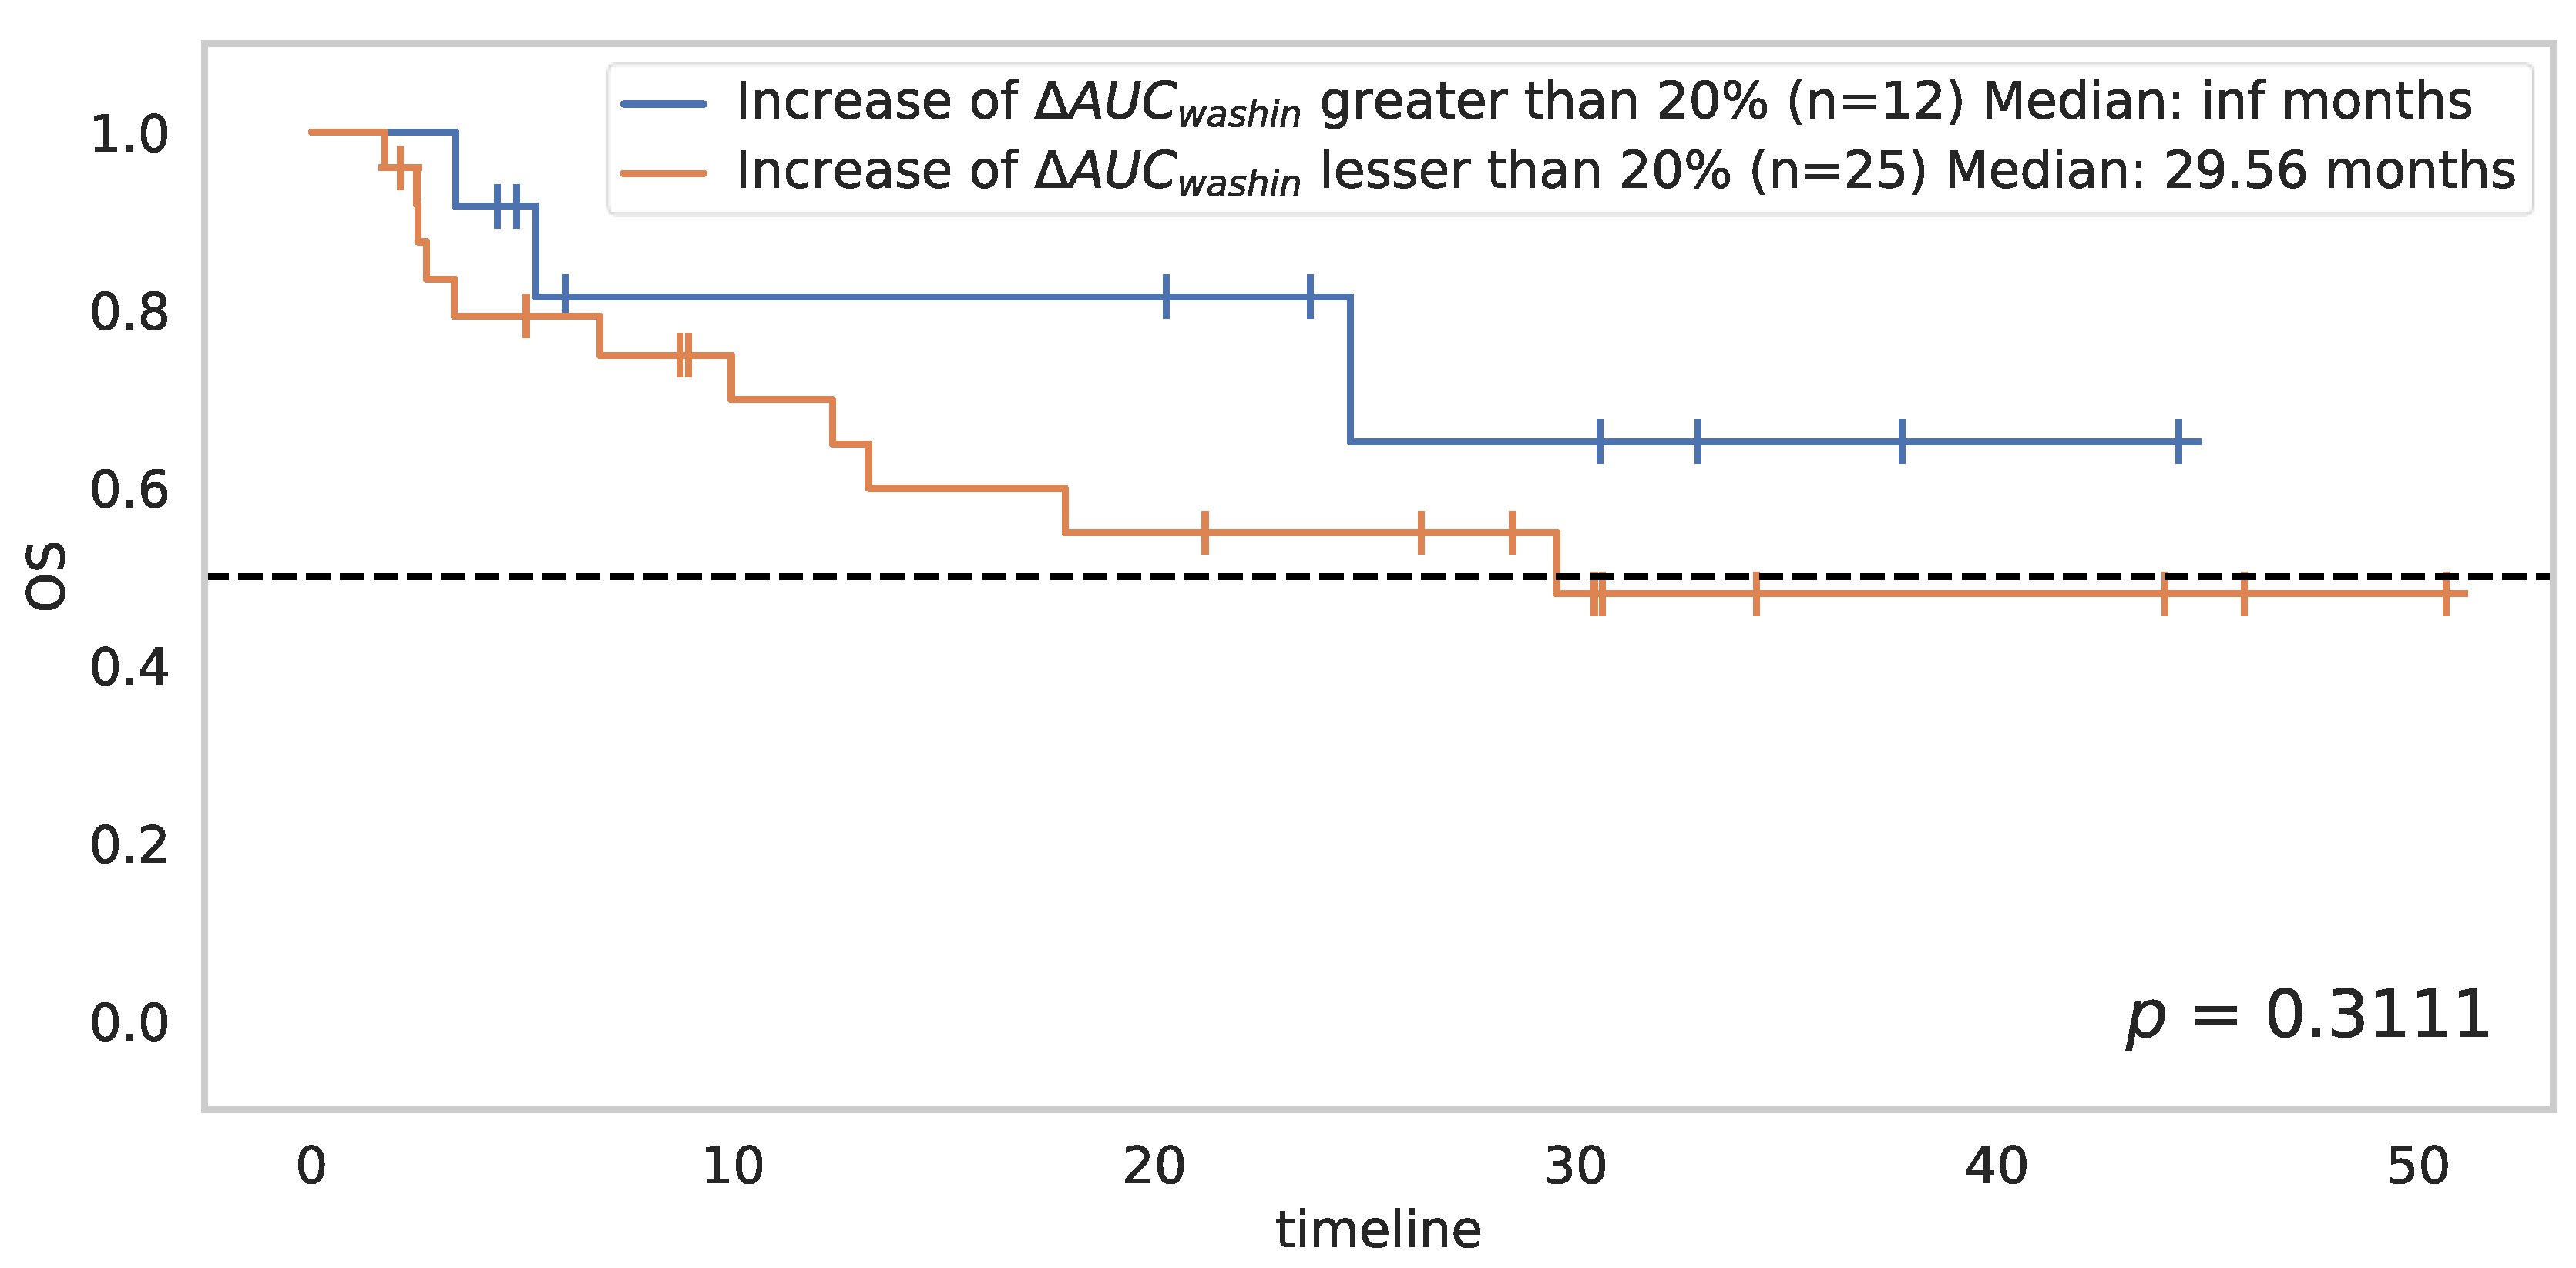
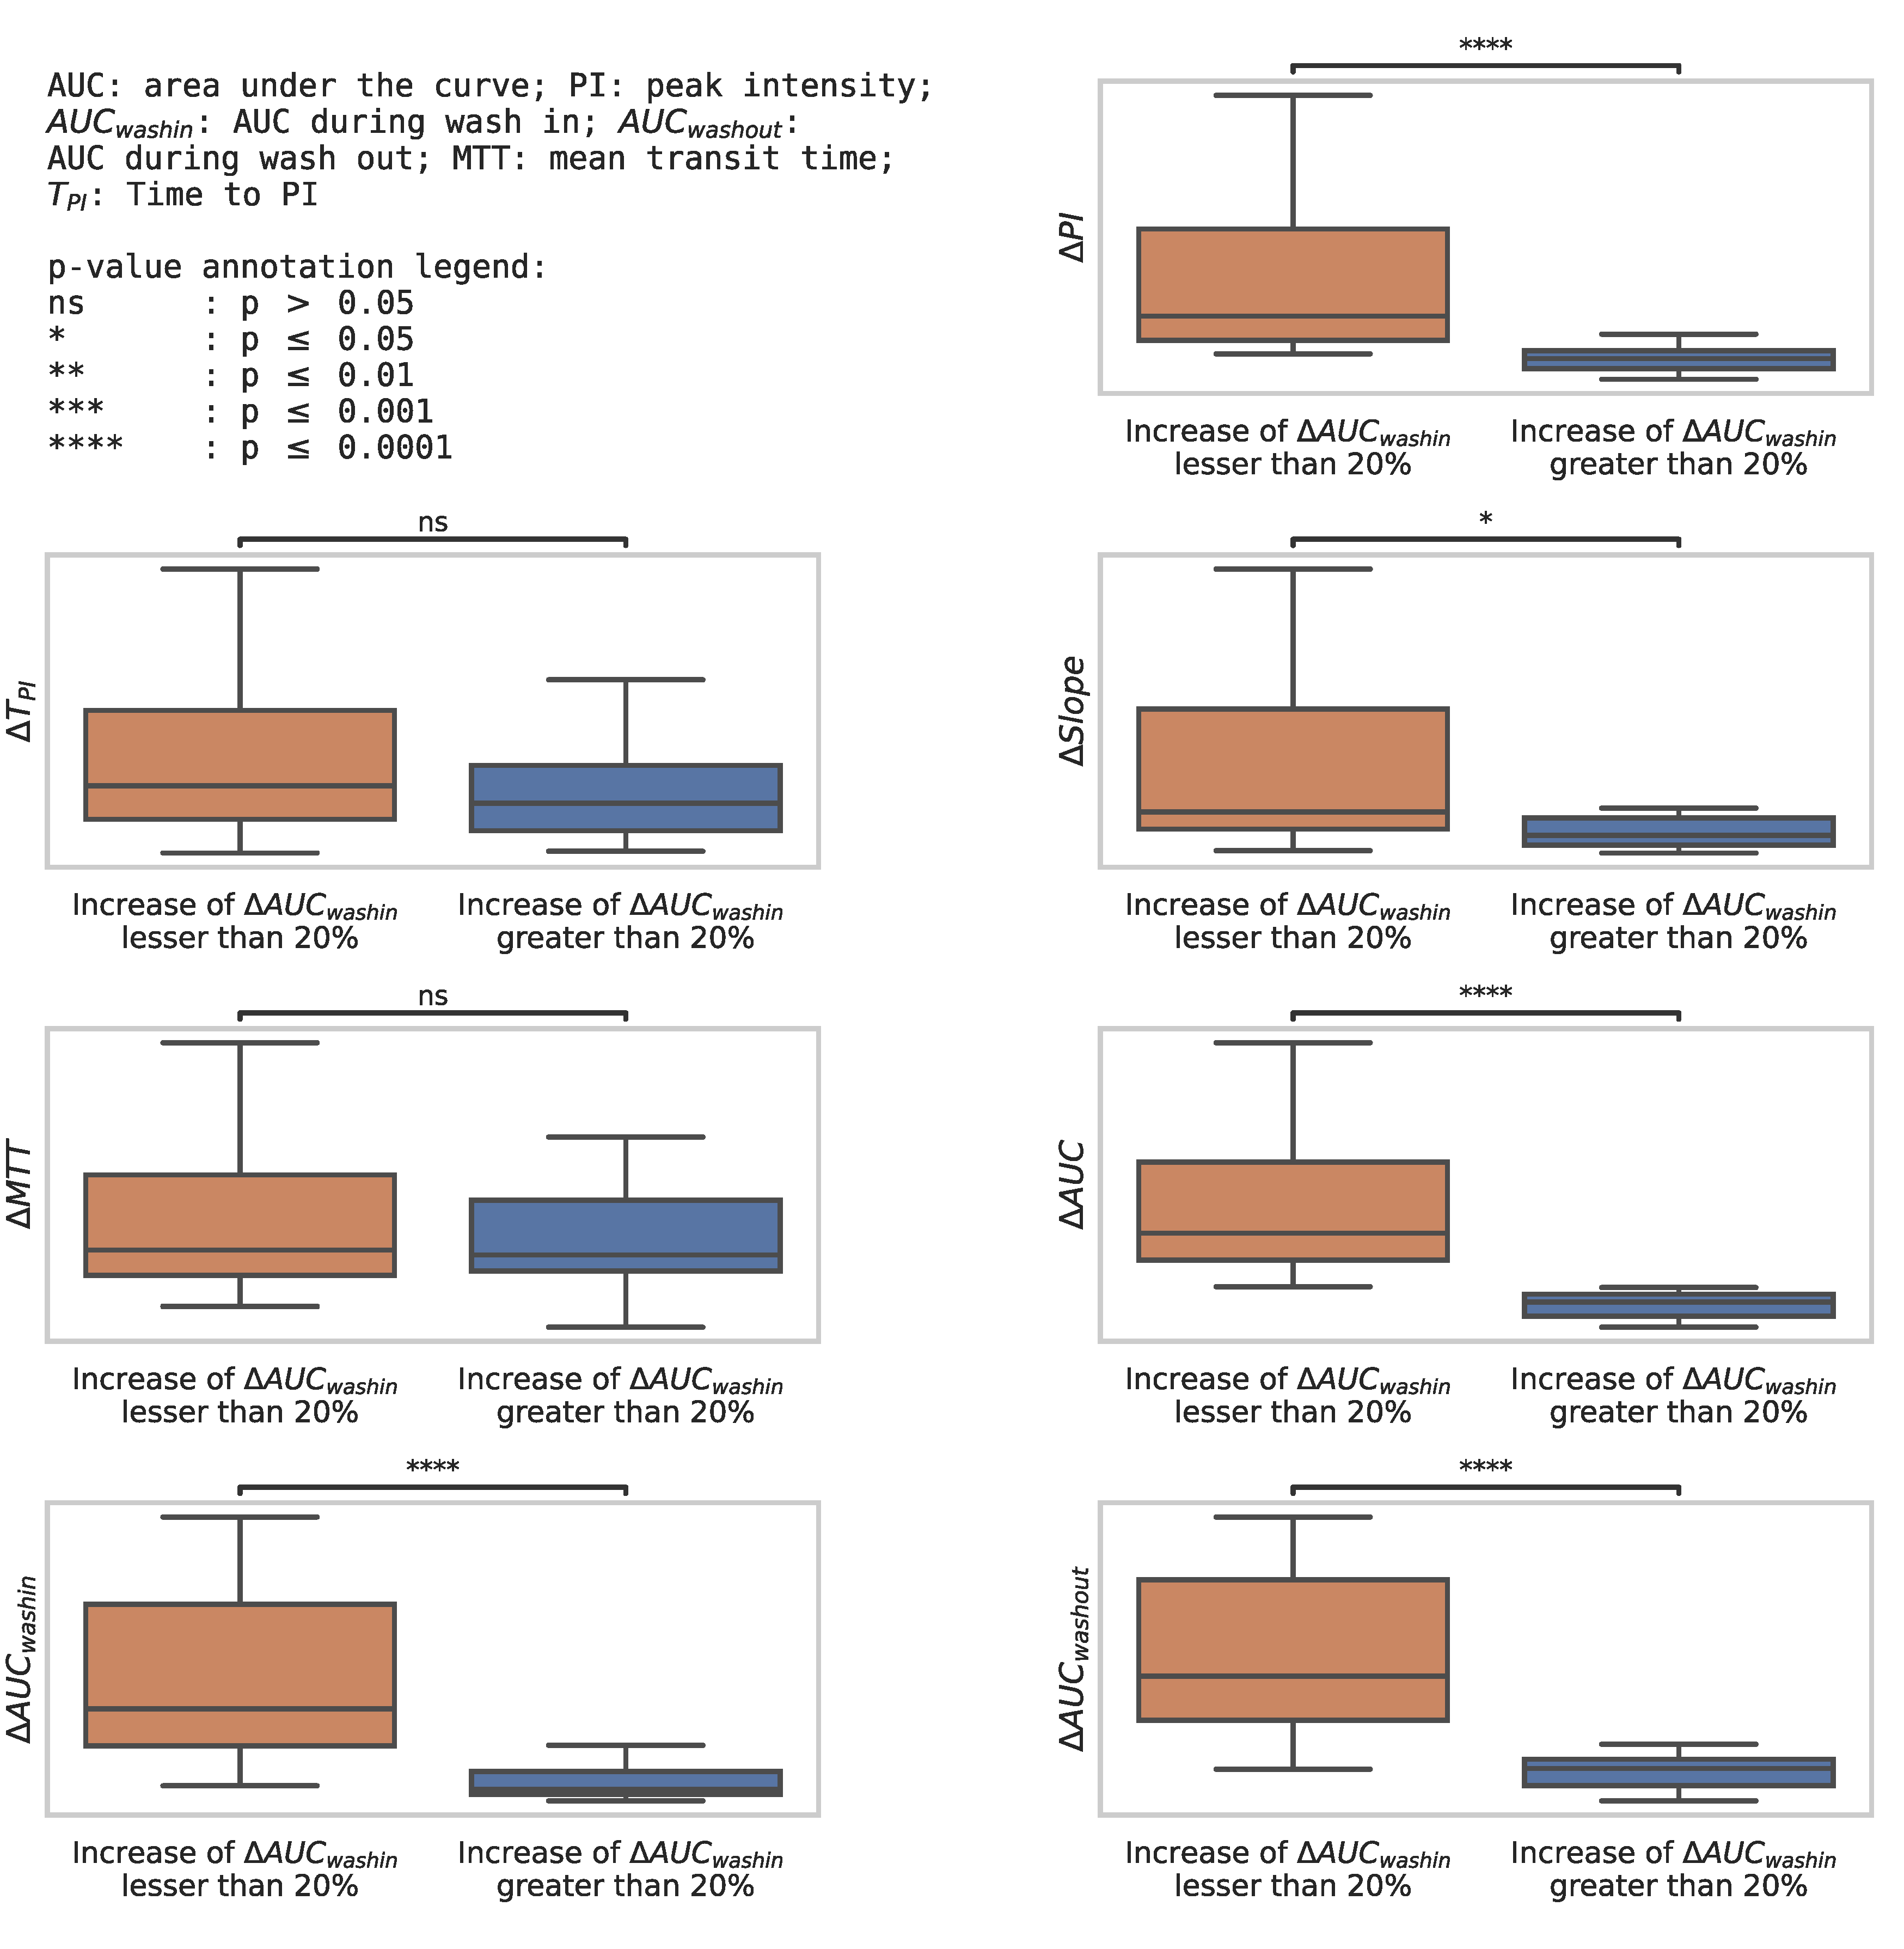
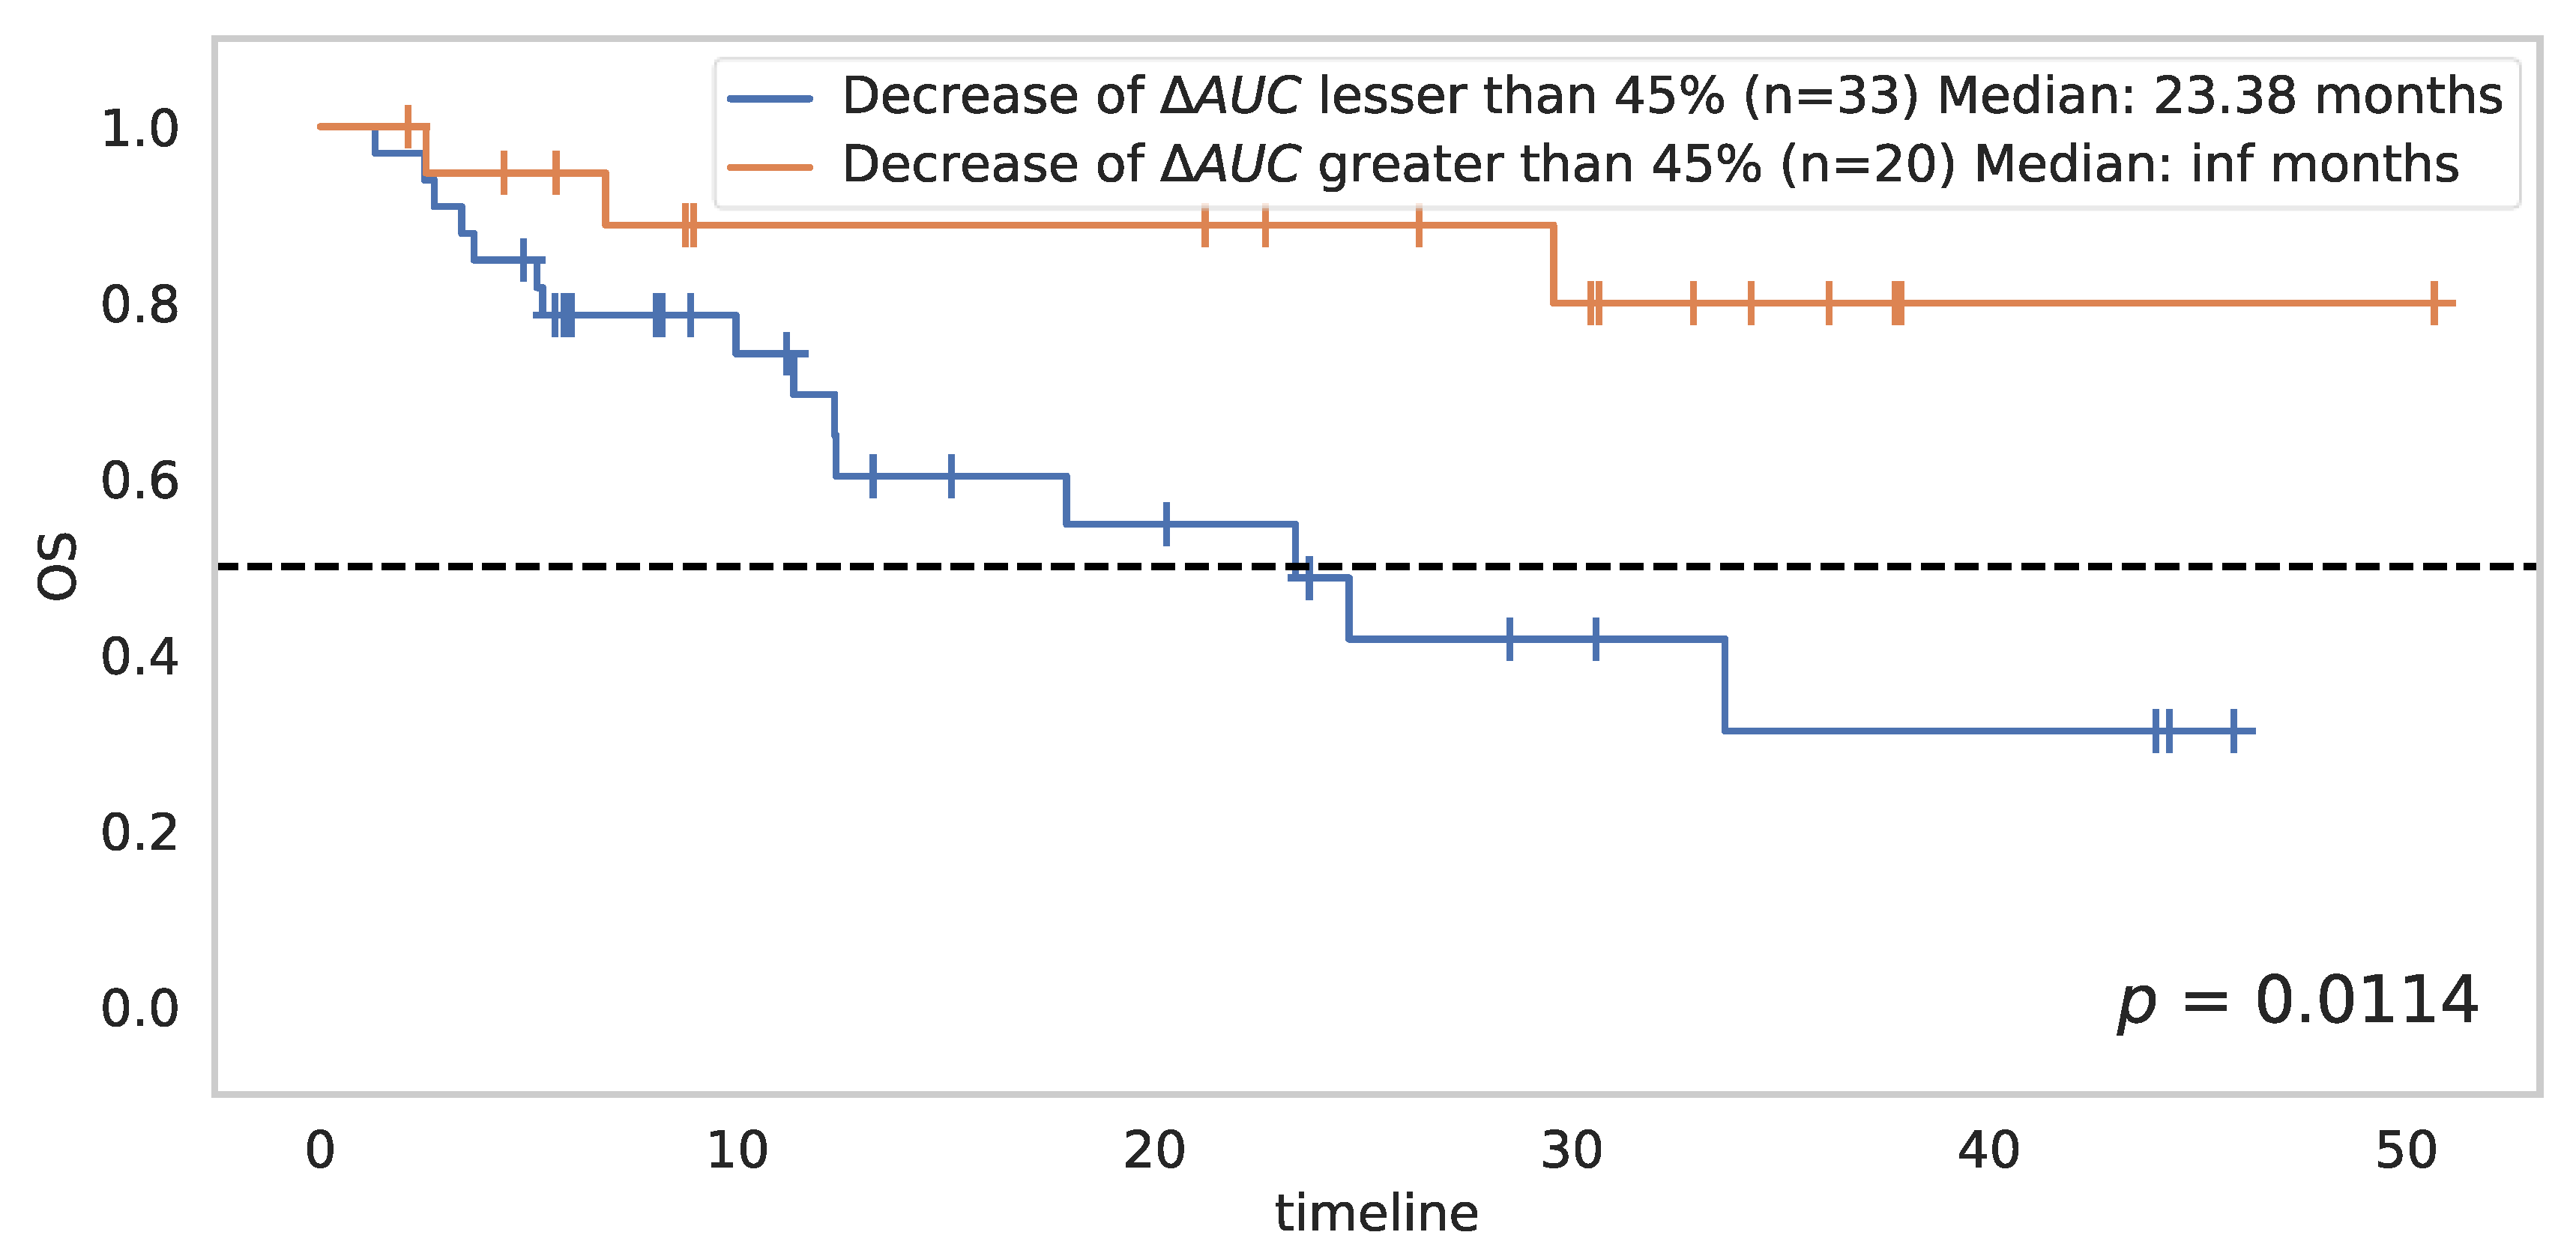
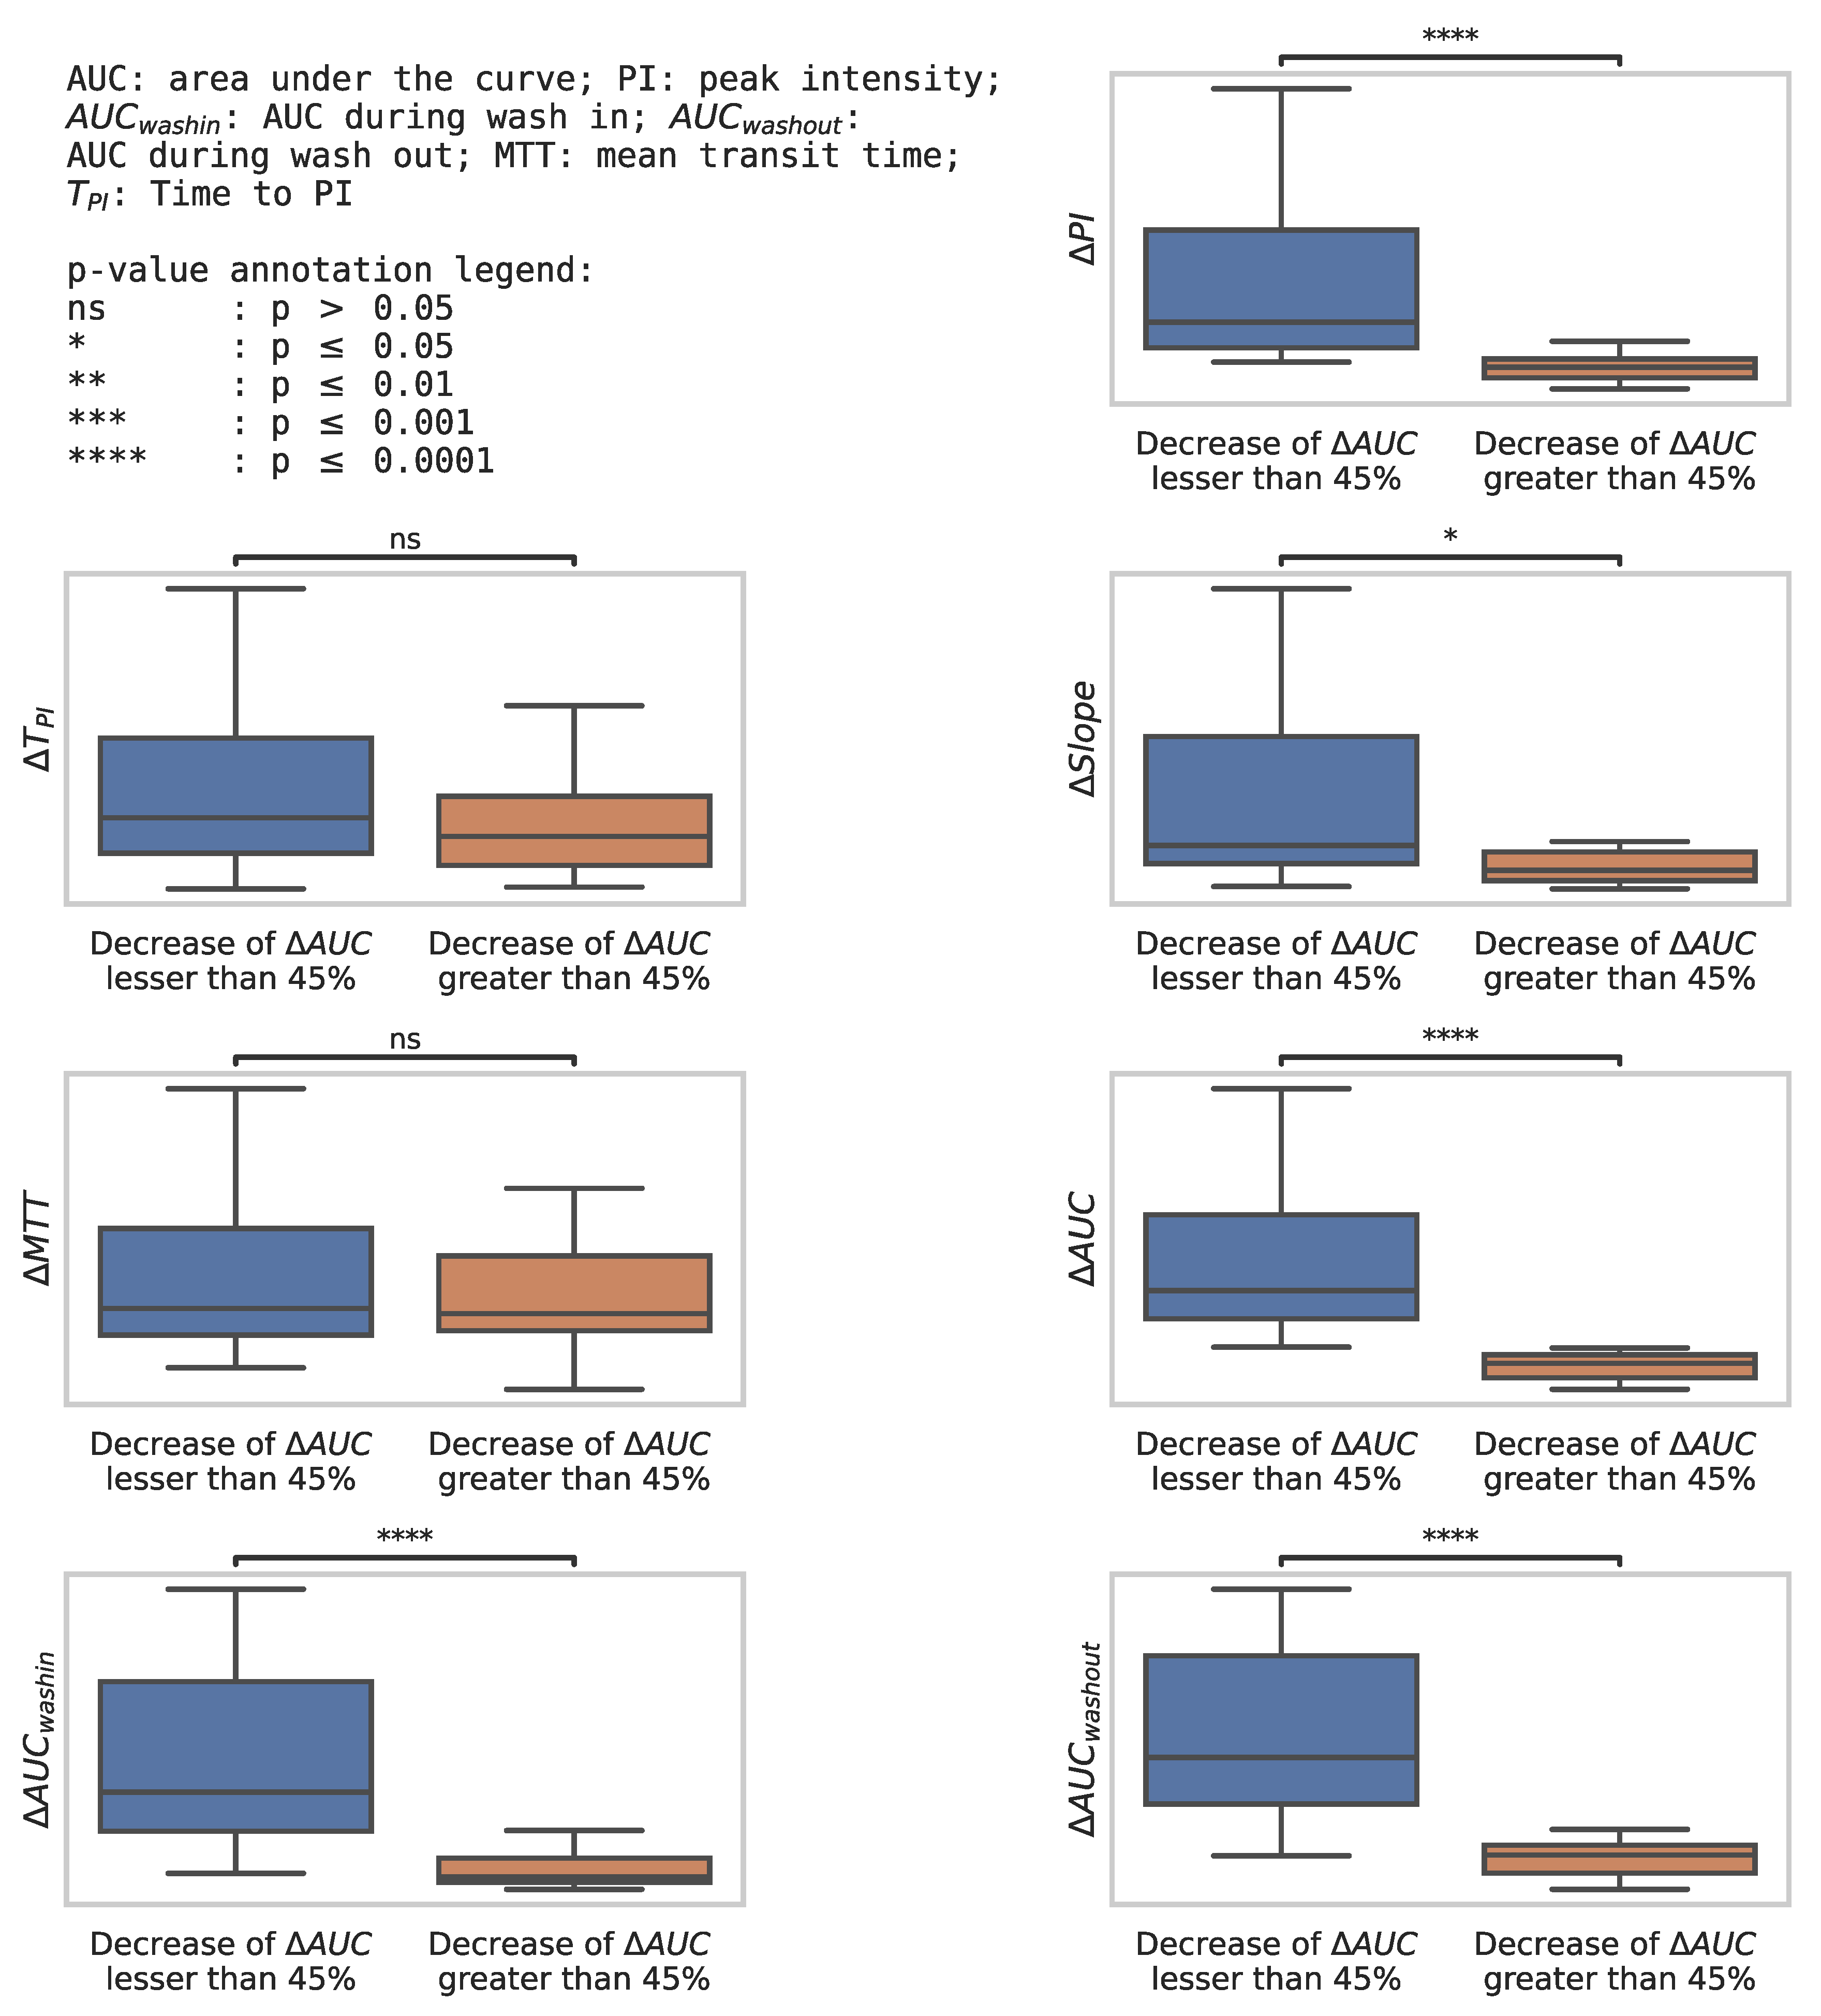
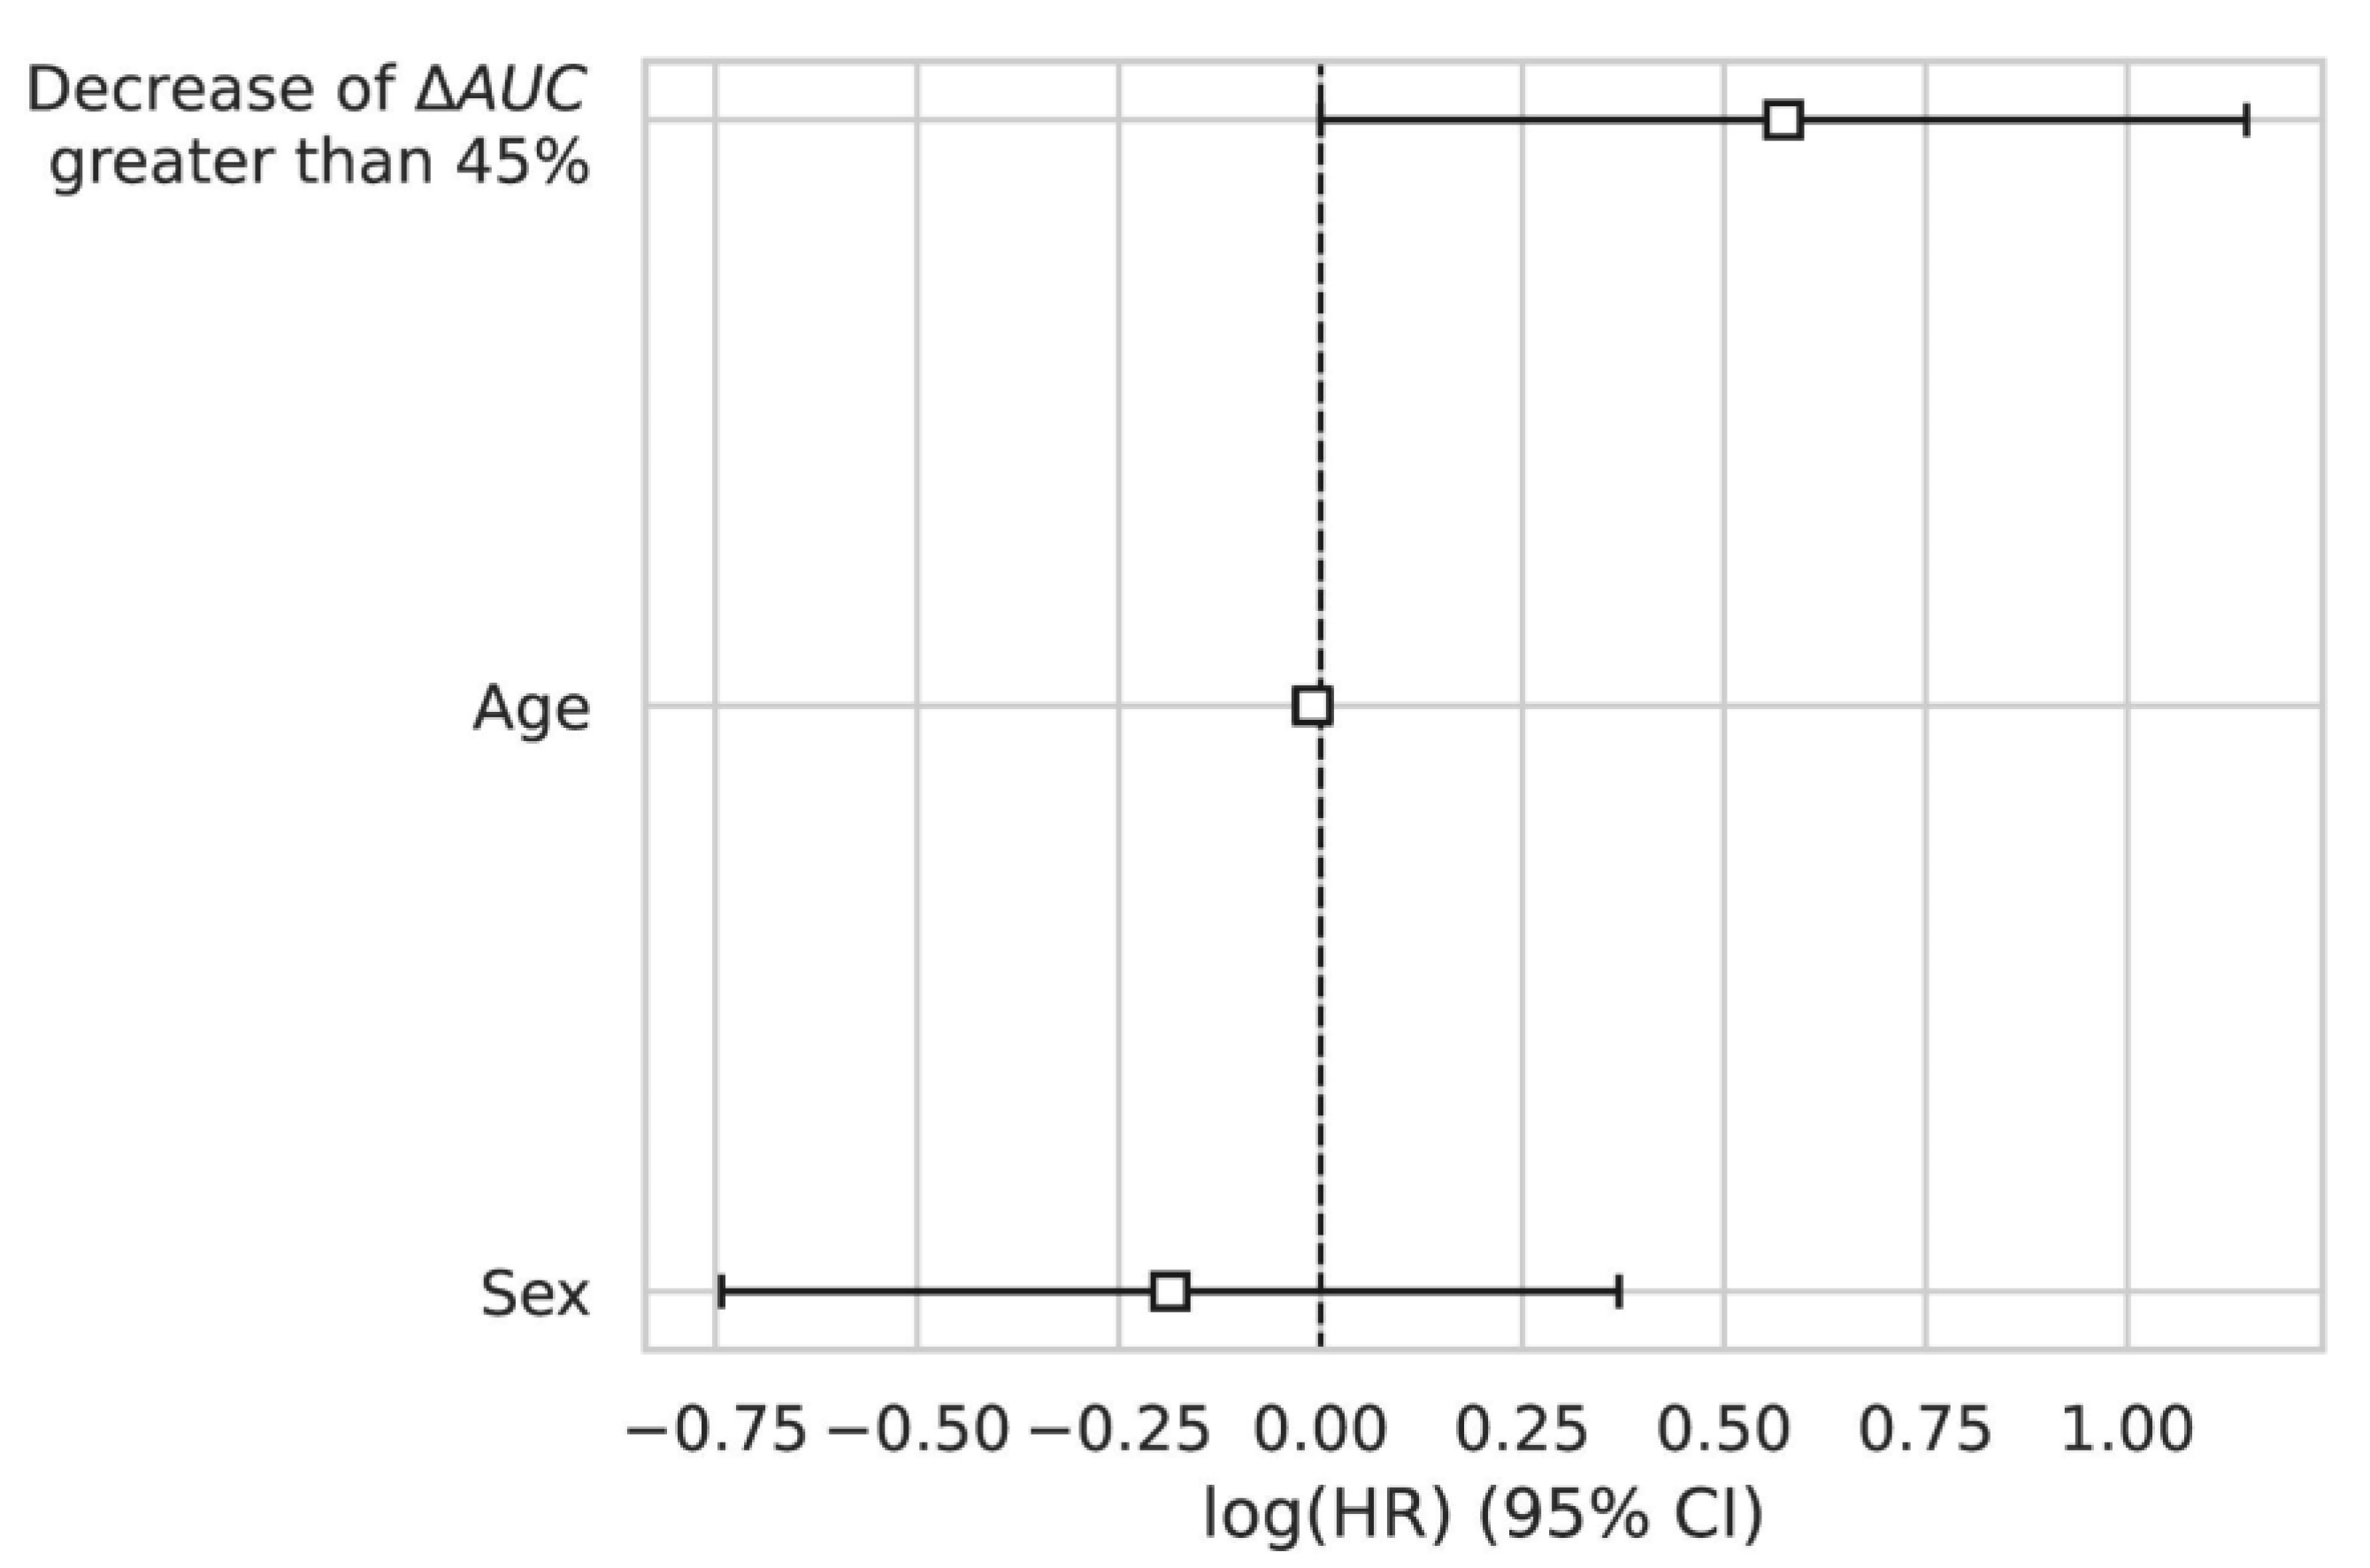
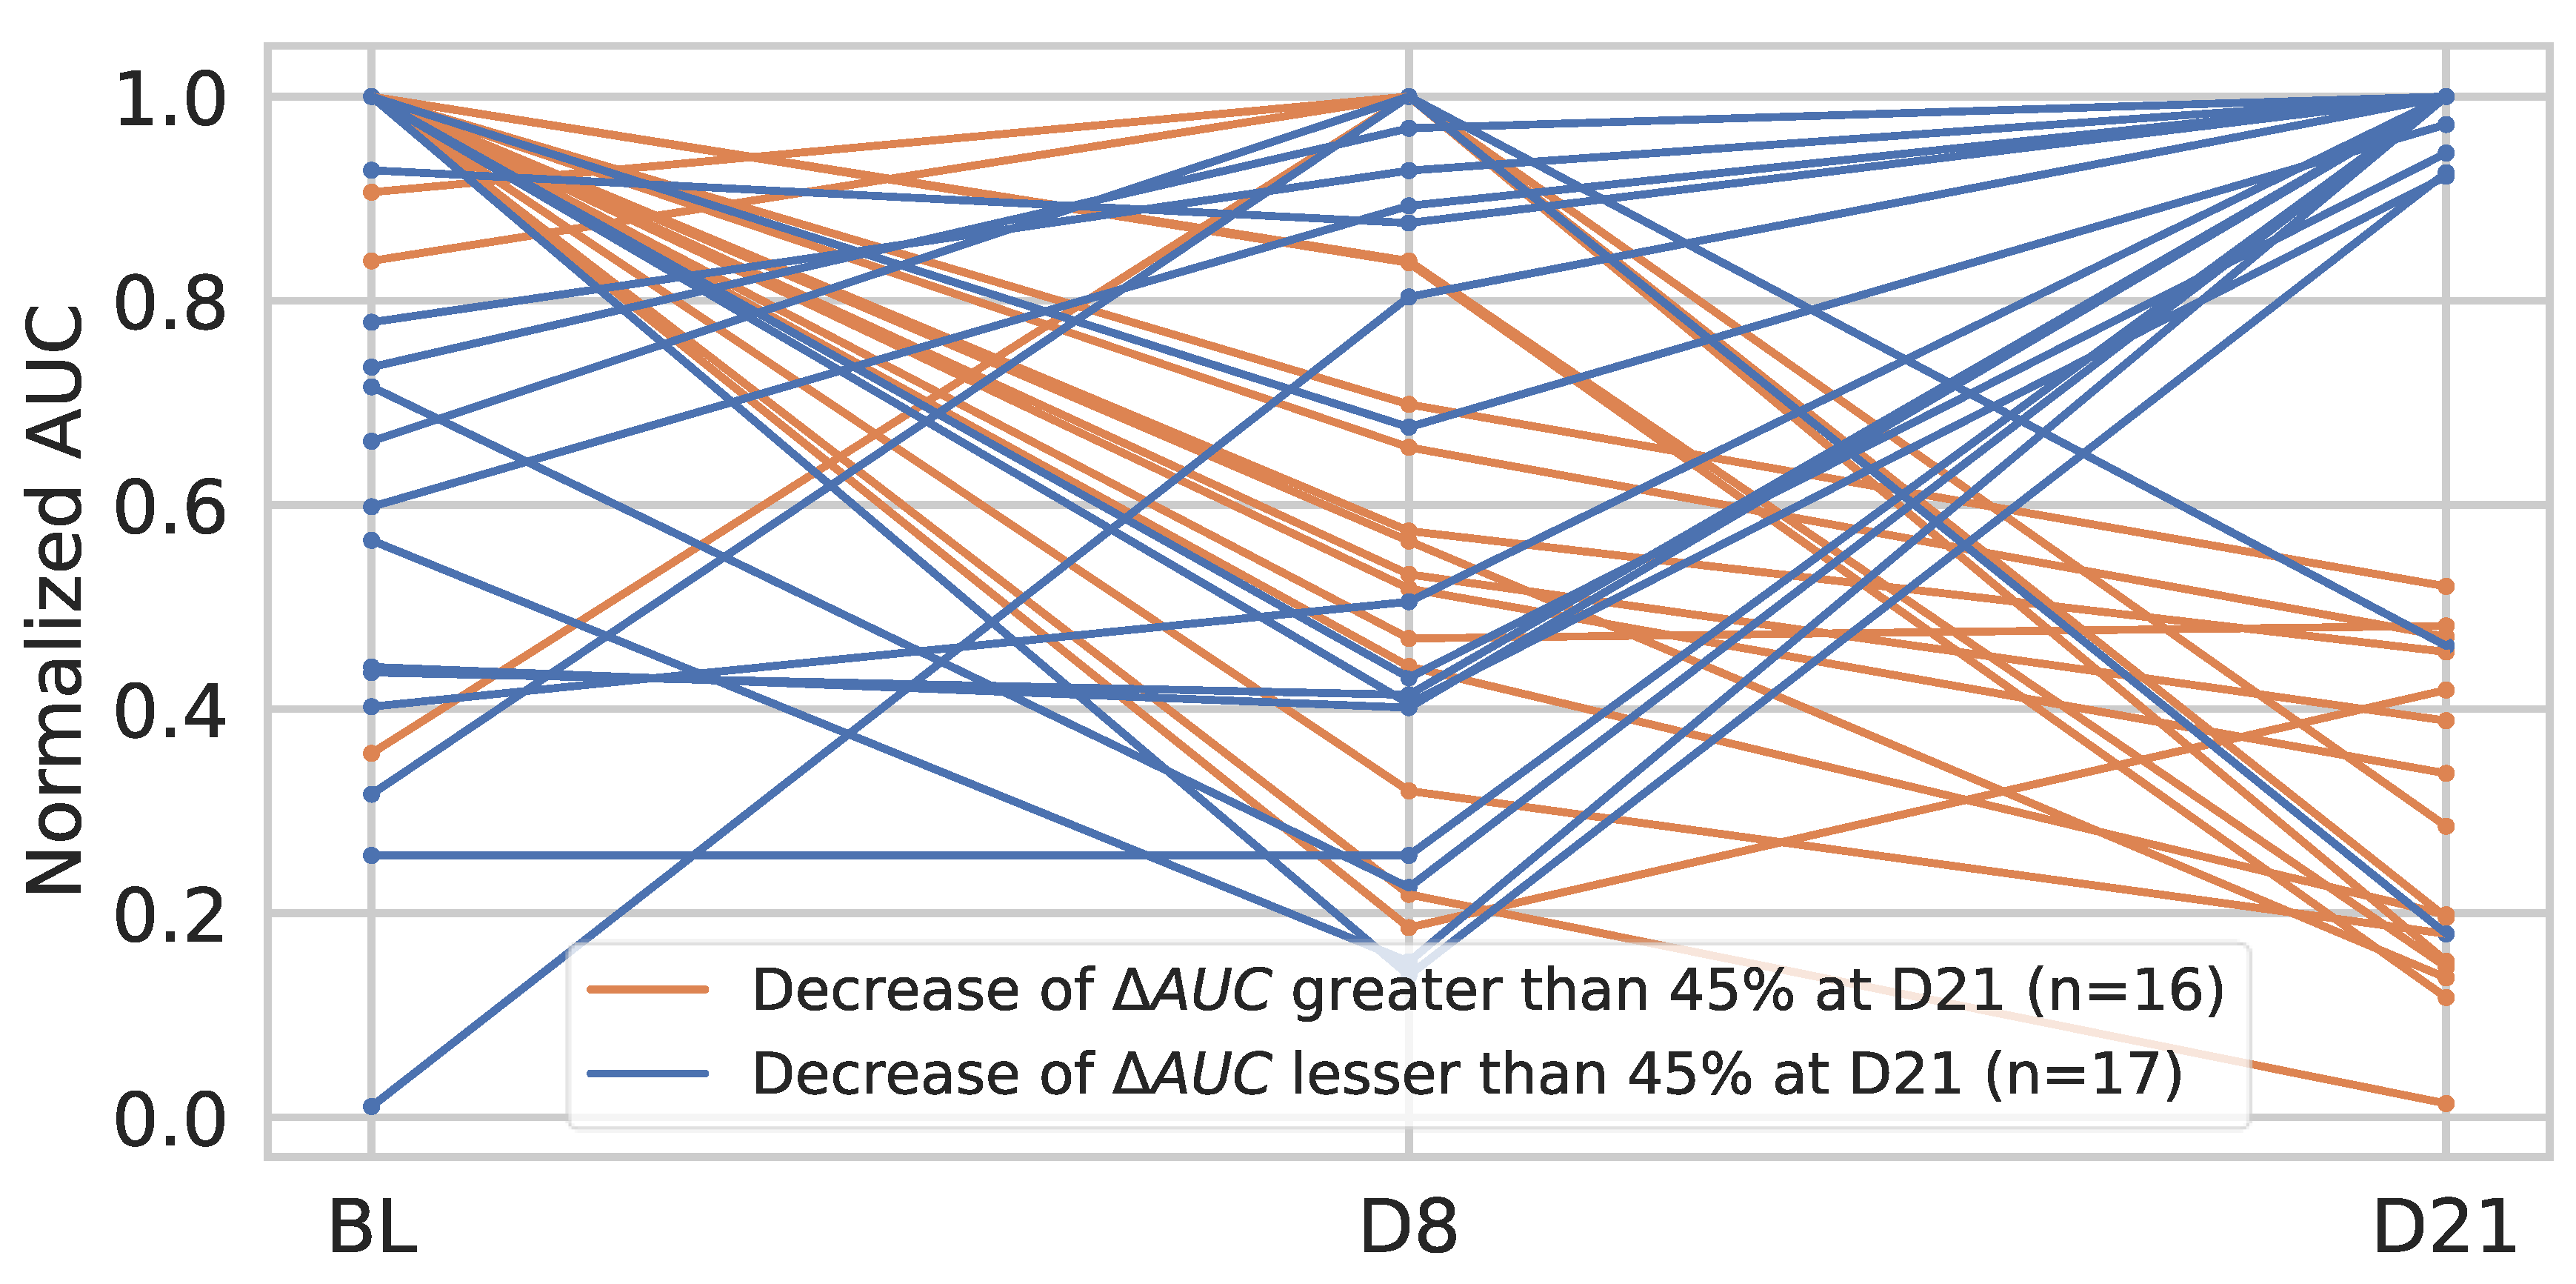
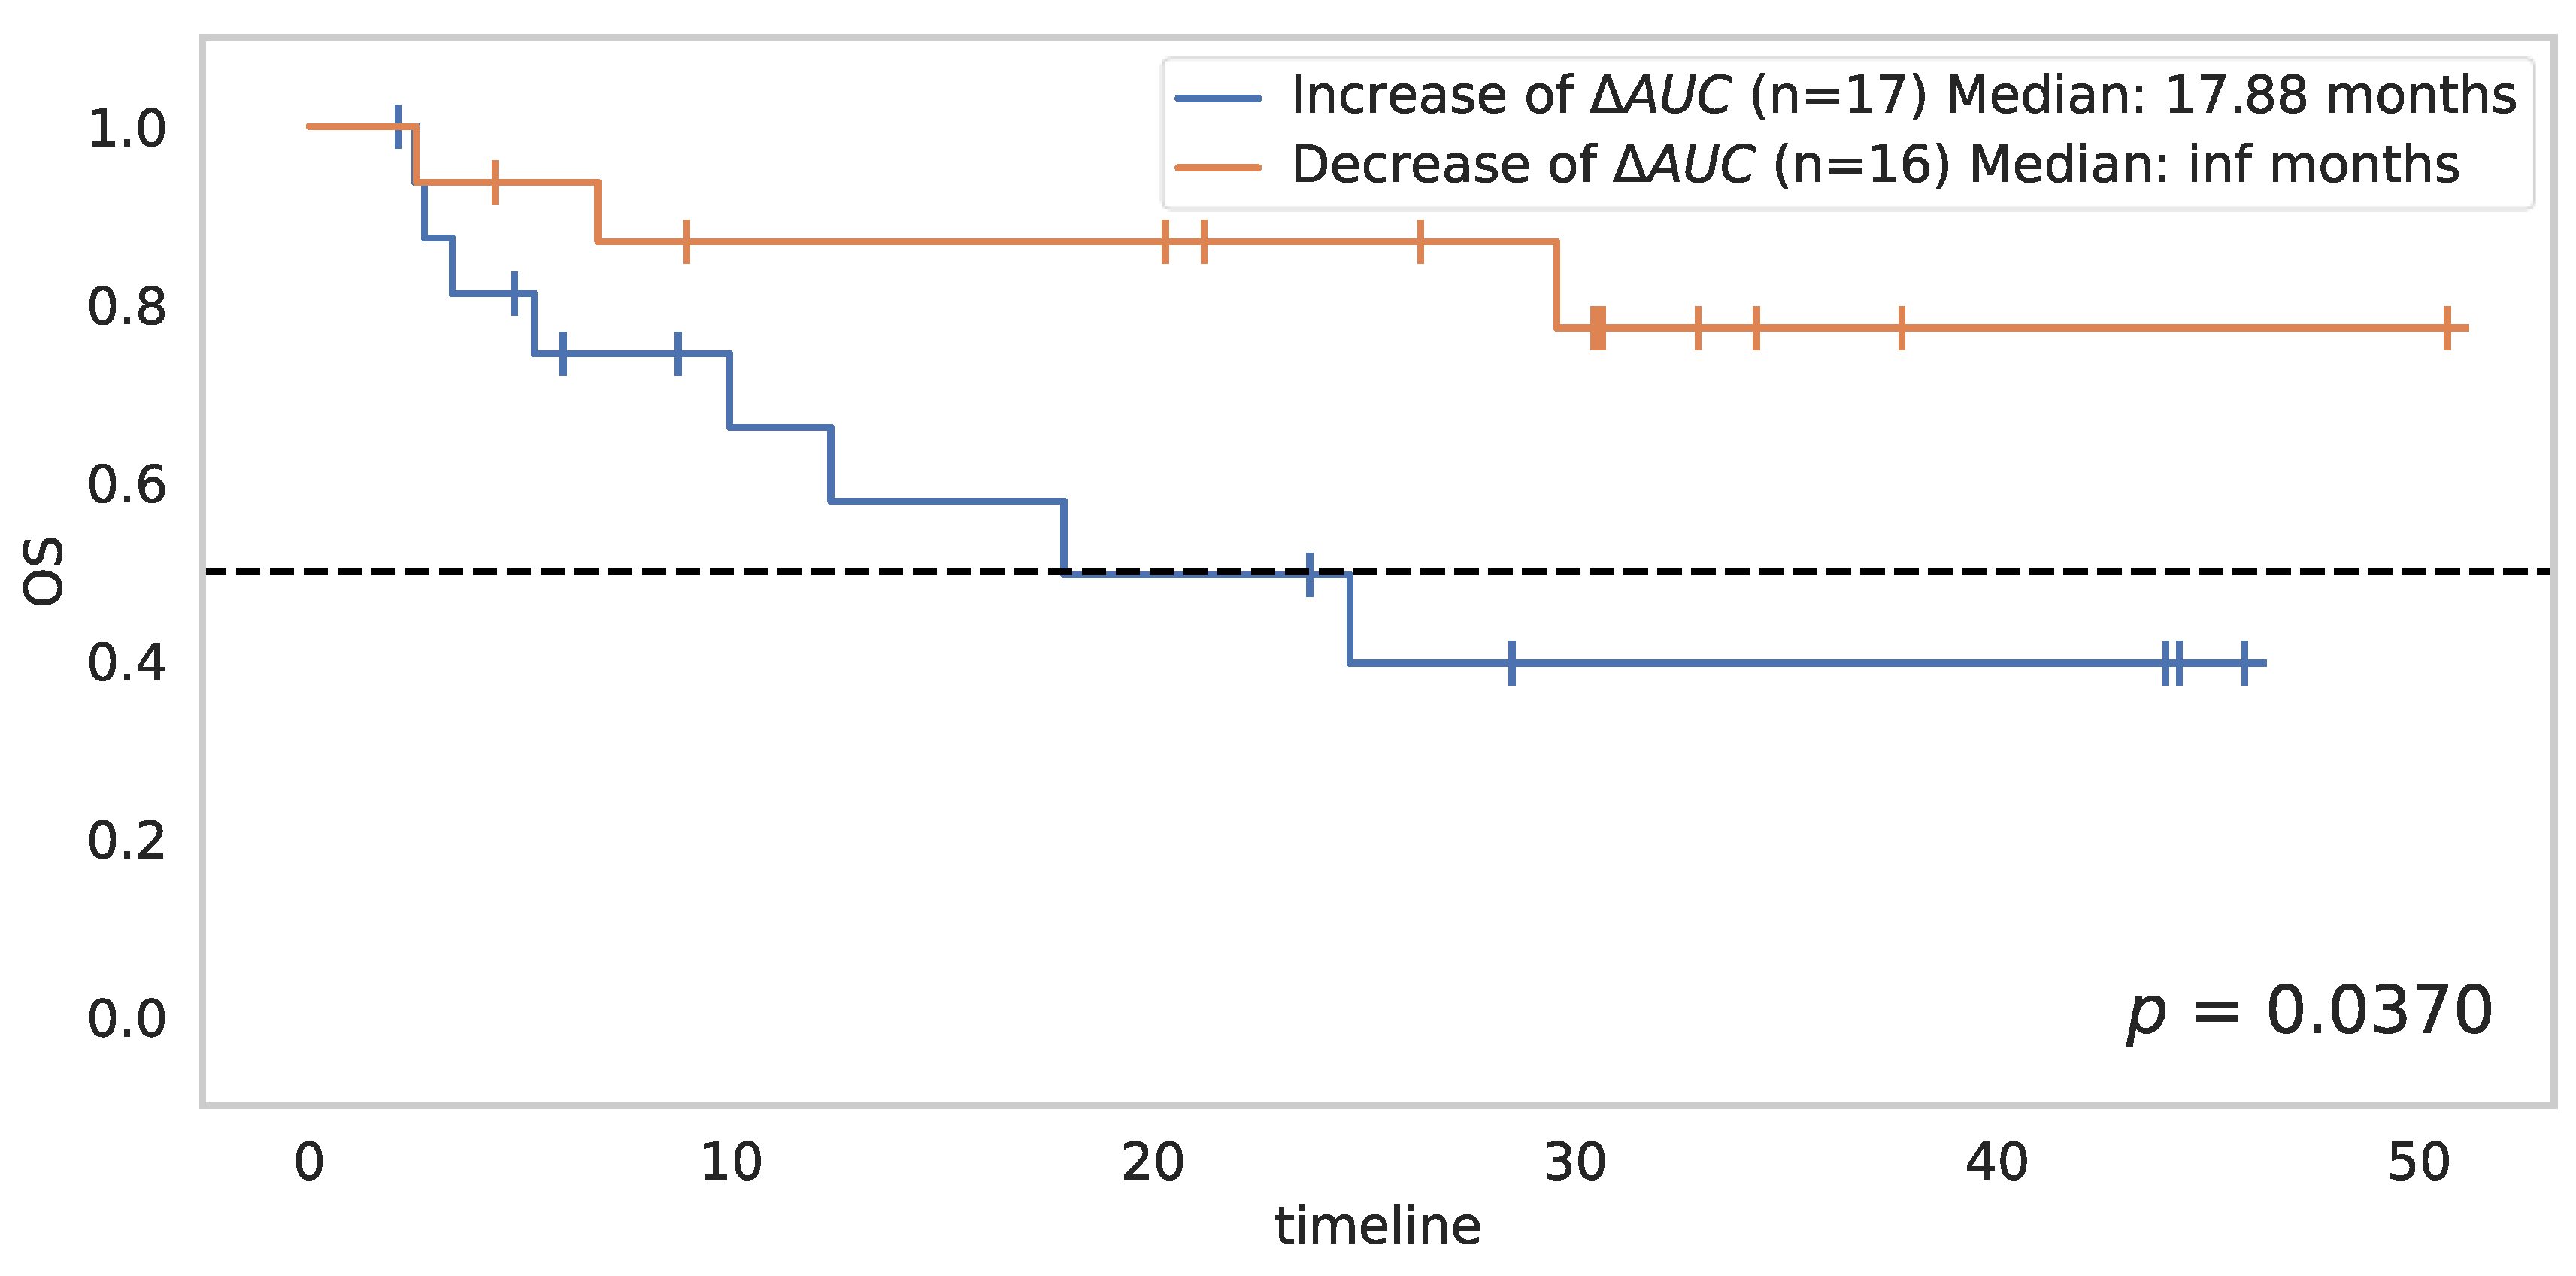
3.4. Change in AUC between D8 and D21
4. Discussion
5. Conclusions
Author Contributions
Funding
Institutional Review Board Statement
Informed Consent Statement
Data Availability Statement
Acknowledgments
Conflicts of Interest
References
- Makaremi, S.; Asadzadeh, Z.; Hemmat, N.; Baghbanzadeh, A.; Sgambato, A.; Ghorbaninezhad, F.; Safarpour, H.; Argentiero, A.; Brunetti, O.; Bernardini, R.; et al. Immune Checkpoint Inhibitors in Colorectal Cancer: Challenges and Future Prospects. Biomedicines 2021, 9, 1075. [Google Scholar] [CrossRef]
- Graziani, G.; Tentori, L.; Navarra, P. Ipilimumab: A novel immunostimulatory monoclonal antibody for the treatment of cancer. Pharm. Res. 2012, 65, 9–22. [Google Scholar] [CrossRef] [PubMed]
- Hargadon, K.M.; Johnson, C.E.; Williams, C.J. Immune checkpoint blockade therapy for cancer: An overview of FDA-approved immune checkpoint inhibitors. Int. Immunopharmacol. 2018, 62, 29–39. [Google Scholar] [CrossRef] [PubMed]
- Hodi, F.S.; Chiarion-Sileni, V.; Gonzalez, R.; Grob, J.J.; Rutkowski, P.; Cowey, C.L.; Lao, C.D.; Schadendorf, D.; Wagstaff, J.; Dummer, R.; et al. Nivolumab plus ipilimumab or nivolumab alone versus ipilimumab alone in advanced melanoma (CheckMate 067): 4-year outcomes of a multicentre, randomised, phase 3 trial. Lancet Oncol. 2018, 19, 1480–1492. [Google Scholar] [CrossRef]
- Younes, A.; Santoro, A.; Shipp, M.; Zinzani, P.L.; Timmerman, J.M.; Ansell, S.; Armand, P.; Fanale, M.; Ratanatharathorn, V.; Kuruvilla, J.; et al. Nivolumab for classical Hodgkin’s lymphoma after failure of both autologous stem-cell transplantation and brentuximab vedotin: A multicentre, multicohort, single-arm phase 2 trial. Lancet Oncol. 2016, 17, 1283–1294. [Google Scholar] [CrossRef] [Green Version]
- Ziogas, I.A.; Evangeliou, A.P.; Giannis, D.; Giannis, D.; Hayat, M.H.; Mylonas, K.S.; Tohme, S.; Geller, D.A.; Elias, N.; Goyal, L.; et al. The Role of Immunotherapy in Hepatocellular Carcinoma: A Systematic Review and Pooled Analysis of 2402 Patients. Oncologist 2021, 26, e1036–e1049. [Google Scholar] [CrossRef]
- Chung, H.C.; Piha-Paul, S.A.; Lopez-Martin, J.; Schellens, J.H.M.; Kao, K.; Miller, W.H., Jr.; Delord, J.P.; Gao, B.; Planchard, D.; Gottfried, M.; et al. Pembrolizumab After Two or More Lines of Previous Therapy in Patients With Recurrent or Metastatic SCLC: Results From the KEYNOTE-028 and KEYNOTE-158 Studies. J. Thorac. Oncol. 2020, 15, 618–627. [Google Scholar] [CrossRef] [Green Version]
- Brahmer, J.; Reckamp, K.L.; Baas, P.; Crinò, L.; Eberhardt, W.E.E.; Poddubskaya, E.; Antonia, S.; Pluzanski, A.; Vokes, E.E.; Holgado, E.; et al. Nivolumab versus Docetaxel in Advanced Squamous-Cell Non-Small-Cell Lung Cancer. N. Engl. J. Med. 2015, 373, 123–135. [Google Scholar] [CrossRef] [Green Version]
- Overman, M.J.; McDermott, R.; Leach, J.L.; Lonardi, S.; Lenz, H.J.; Morse, M.A.; Desai, J.; Hill, A.; Axelson, M.; Moss, R.A.; et al. Nivolumab in patients with metastatic DNA mismatch repair deficient/microsatellite instability–high colorectal cancer (CheckMate 142): Results of an open-label, multicentre, phase 2 study. Lancet Oncol. 2017, 18, 1182–1191. [Google Scholar] [CrossRef]
- Frelaut, M.; du Rusquec, P.; de Moura, A.; Tourneau, C.L.; Borcoman, E. Pseudo-progression and Hyperprogression as New Forms of Response to Immunotherapy. BioDrugs 2020, 34, 463–476. [Google Scholar] [CrossRef]
- Seymour, L.; Bogaerts, J.; Perrone, A.; Ford, R.; Schwartz, L.H.; Mandrekar, S.; Lin, N.U.; Litière, S.; Dancey, J.; Chen, A.; et al. iRECIST: Guidelines for response criteria for use in trials testing immunotherapeutics. Lancet Oncol. 2017, 18, e143–e152. [Google Scholar] [CrossRef] [Green Version]
- Carter, B.W.; Bhosale, P.R.; Yang, W.T. Immunotherapy and the role of imaging. Cancer 2018, 124, 2906–2922. [Google Scholar] [CrossRef] [PubMed]
- Dietrich, C.; Averkiou, M.; Correas, J.M.; Lassau, N.; Leen, E.; Piscaglia, F. An EFSUMB Introduction into Dynamic Contrast-Enhanced Ultrasound (DCE-US) for Quantification of Tumour Perfusion. Ultraschall Der Med. Eur. J. Ultrasound 2012, 33, 344–351. [Google Scholar] [CrossRef] [PubMed]
- Lassau, N.; Bonastre, J.; Kind, M.; Vilgrain, V.; Lacroix, J.; Cuinet, M.; Taieb, S.; Aziza, R.; Sarran, A.; Labbe-Devilliers, C. Validation of Dynamic Contrast-Enhanced Ultrasound in Predicting Outcomes of Antiangiogenic Therapy for Solid Tumors. Investig. Radiol. 2014, 49, 794–800. [Google Scholar] [CrossRef] [Green Version]
- Relecom, A.; Merhi, M.; Inchakalody, V.; Uddin, S.; Rinchai, D.; Bedognetti, D.; Dermime, S. Emerging dynamics pathways of response and resistance to PD-1 and CTLA-4 blockade: Tackling uncertainty by confronting complexity. J. Exp. Clin. Cancer Res. 2021, 40, 74. [Google Scholar] [CrossRef]
- Lausen, B.; Lerche, R.; Schumacher, M. Maximally Selected Rank Statistics for Dose-Response Problems. Biom. J. 2002, 44, 131–147. [Google Scholar] [CrossRef]
- Kassambara, A.; Kosinski, M.; Biecek, P.; Fabian, S. Survminer: Drawing Survival Curves Using ‘ggplot2’; R Package Version 0.3; Mathsoft: Cambridge, MA, USA, 2017; pp. 52–54. [Google Scholar]
- Lassau, N.; Coiffier, B.; Faivre, L.; Baya, B.; Bidault, S.; Girard, E.; Asselain, B.; Pitre-Champagnat, S.; Koscielny, S. Study of Intrapatient Variability and Reproducibility of Quantitative Tumor Perfusion Parameters Evaluated With Dynamic Contrast-Enhanced Ultrasonography. Investig. Radiol. 2017, 52, 148–154. [Google Scholar] [CrossRef]
- Lemaire, V.; Shemesh, C.S.; Rotte, A. Pharmacology-based ranking of anti-cancer drugs to guide clinical development of cancer immunotherapy combinations. J. Exp. Clin. Cancer Res. 2021, 40, 311. [Google Scholar] [CrossRef]
- Goldfarb, L.; Duchemann, B.; Chouahnia, K.; Zelek, L.; Soussan, M. Monitoring anti-PD-1-based immunotherapy in non-small cell lung cancer with FDG PET: Introduction of iPERCIST. EJNMMI Res. 2019, 9, 8. [Google Scholar] [CrossRef]
- Kaira, K.; Higuchi, T.; Naruse, I.; Arisaka, Y.; Tokue, A.; Altan, B.; Suda, S.; Mogi, A.; Shimizu, K.; Sunaga, N.; et al. Metabolic activity by 18F–FDG-PET/CT is predictive of early response after nivolumab in previously treated NSCLC. Eur. J. Nucl. Med. Mol. Imaging 2018, 45, 56–66. [Google Scholar] [CrossRef]
- Umemura, Y.; Wang, D.; Peck, K.K.; Flynn, J.; Zhang, Z.; Fatovic, R.; Anderson, E.S.; Beal, K.; Shoushtari, A.N.; Kaley, T.; et al. DCE-MRI perfusion predicts pseudo-progression in metastatic melanoma treated with immunotherapy. J. Neurooncol. 2020, 146, 339–346. [Google Scholar] [CrossRef] [PubMed]
- Bera, K.; Braman, N.; Gupta, A.; Velcheti, V.; Madabhushi, A. Predicting cancer outcomes with radiomics and artificial intelligence in radiology. Nat. Rev. Clin. Oncol. 2021, 19, 132–146. [Google Scholar] [CrossRef] [PubMed]
- Trebeschi, S.; Drago, S.G.; Birkbak, N.J.; Kurilova, I.; Pizzi, D.; Lalezari, F.; Lambregts, D.M.J.; Rohaan, M.W.; Parmar, C.; Rozeman, E.A.; et al. Predicting response to cancer immunotherapy using noninvasive radiomic biomarkers. Ann. Oncol. 2019, 30, 998–1004. [Google Scholar] [CrossRef] [Green Version]
- Khorrami, M.; Prasanna, P.; Gupta, A.; Pradnya, P.; Velu, P.D.; Thawani, R.; Corredor, G.; Alilou, M.; Bera, K.; Fu, P.; et al. Changes in CT radiomic features associated with lymphocyte distribution predict overall survival and response to immunotherapy in non-small cell lung cancer. Cancer Immunol. Res. 2020, 8, 108–119. [Google Scholar] [CrossRef] [PubMed]


| Characteristics | No. | % |
|---|---|---|
| Total patients | 63 | 100 |
| Age (Median (IQR)) in years | 56 (45–63) | |
| Male | 38 | 60 |
| Female | 25 | 40 |
| Tumor type | ||
| Melanoma | 22 | 35 |
| Sarcoma | 16 | 25 |
| Colorectal cancer | 10 | 16 |
| Kidney cancer | 11 | 18 |
| Hepatocellular cancer | 4 | 6 |
| Treatment | ||
| Atezolizumab | 25 | 40 |
| Nivolumab | 22 | 35 |
| Pembrolizumab | 16 | 25 |
| ΔD8/BASELINE | p-Value |
|---|---|
| ΔAUC | 0.2529 |
| ΔPI | 0.4810 |
| ΔAUCwash in | 0.0593 |
| ΔAUCwash out | 0.2529 |
| ΔSlope | 0.2885 |
| ΔMTT | 0.4732 |
| ΔTPI | 0.0892 |
| ΔD21/BASELINE | p-Value |
|---|---|
| ΔAUC | 0.0028 |
| ΔPI | 0.0058 |
| ΔAUCwash in | 0.0294 |
| ΔAUCwash out | 0.0081 |
| ΔSlope | 0.0592 |
| ΔMTT | 0.1387 |
| ΔTPI | 0.2876 |
Publisher’s Note: MDPI stays neutral with regard to jurisdictional claims in published maps and institutional affiliations. |
© 2022 by the authors. Licensee MDPI, Basel, Switzerland. This article is an open access article distributed under the terms and conditions of the Creative Commons Attribution (CC BY) license (https://creativecommons.org/licenses/by/4.0/).
Share and Cite
Naccache, R.; Belkouchi, Y.; Lawrance, L.; Benatsou, B.; Hadchiti, J.; Cournede, P.-H.; Ammari, S.; Talbot, H.; Lassau, N. Prediction of Early Response to Immunotherapy: DCE-US as a New Biomarker. Cancers 2022, 14, 1337. https://0-doi-org.brum.beds.ac.uk/10.3390/cancers14051337
Naccache R, Belkouchi Y, Lawrance L, Benatsou B, Hadchiti J, Cournede P-H, Ammari S, Talbot H, Lassau N. Prediction of Early Response to Immunotherapy: DCE-US as a New Biomarker. Cancers. 2022; 14(5):1337. https://0-doi-org.brum.beds.ac.uk/10.3390/cancers14051337
Chicago/Turabian StyleNaccache, Raphael, Younes Belkouchi, Littisha Lawrance, Baya Benatsou, Joya Hadchiti, Paul-Henry Cournede, Samy Ammari, Hugues Talbot, and Nathalie Lassau. 2022. "Prediction of Early Response to Immunotherapy: DCE-US as a New Biomarker" Cancers 14, no. 5: 1337. https://0-doi-org.brum.beds.ac.uk/10.3390/cancers14051337