
MicroRNA Landscape in Endometrial Carcinomas in an Asian population: Unraveling Subtype-Specific Signatures
 , ,
, ,
Abstract
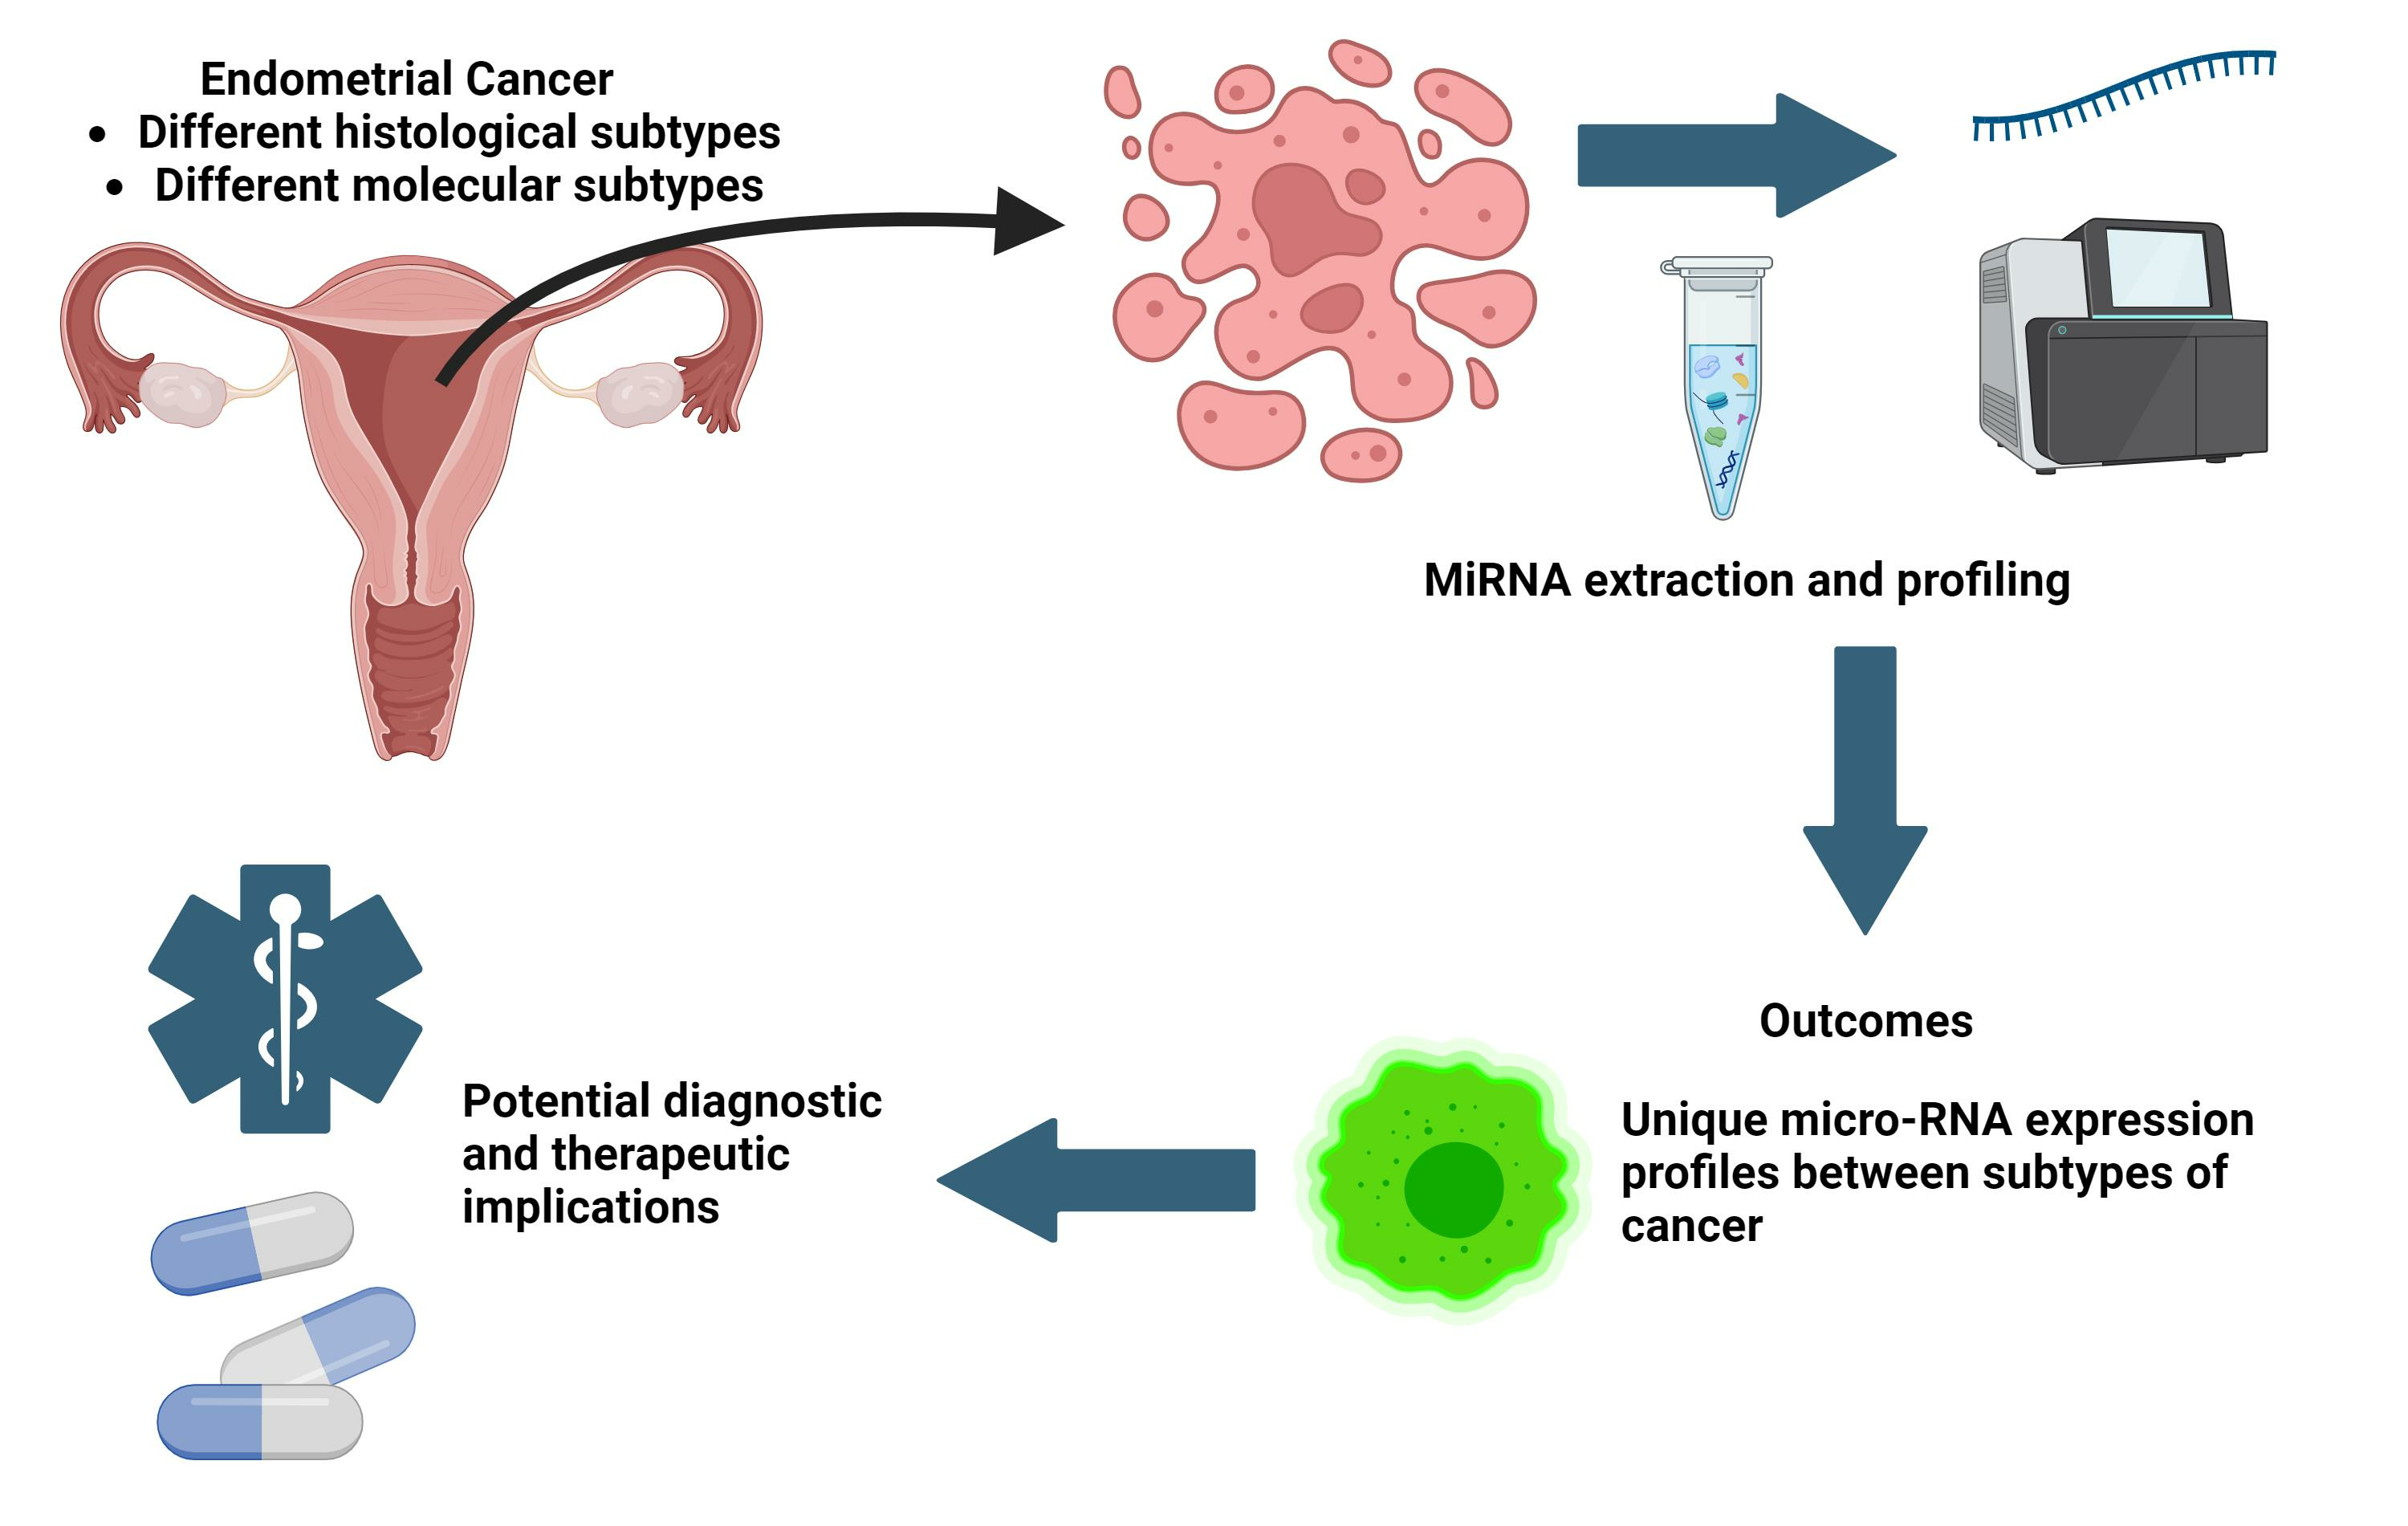
:Simple Summary
Abstract

1. Introduction
2. Materials and Methods
2.1. Patients and Cases
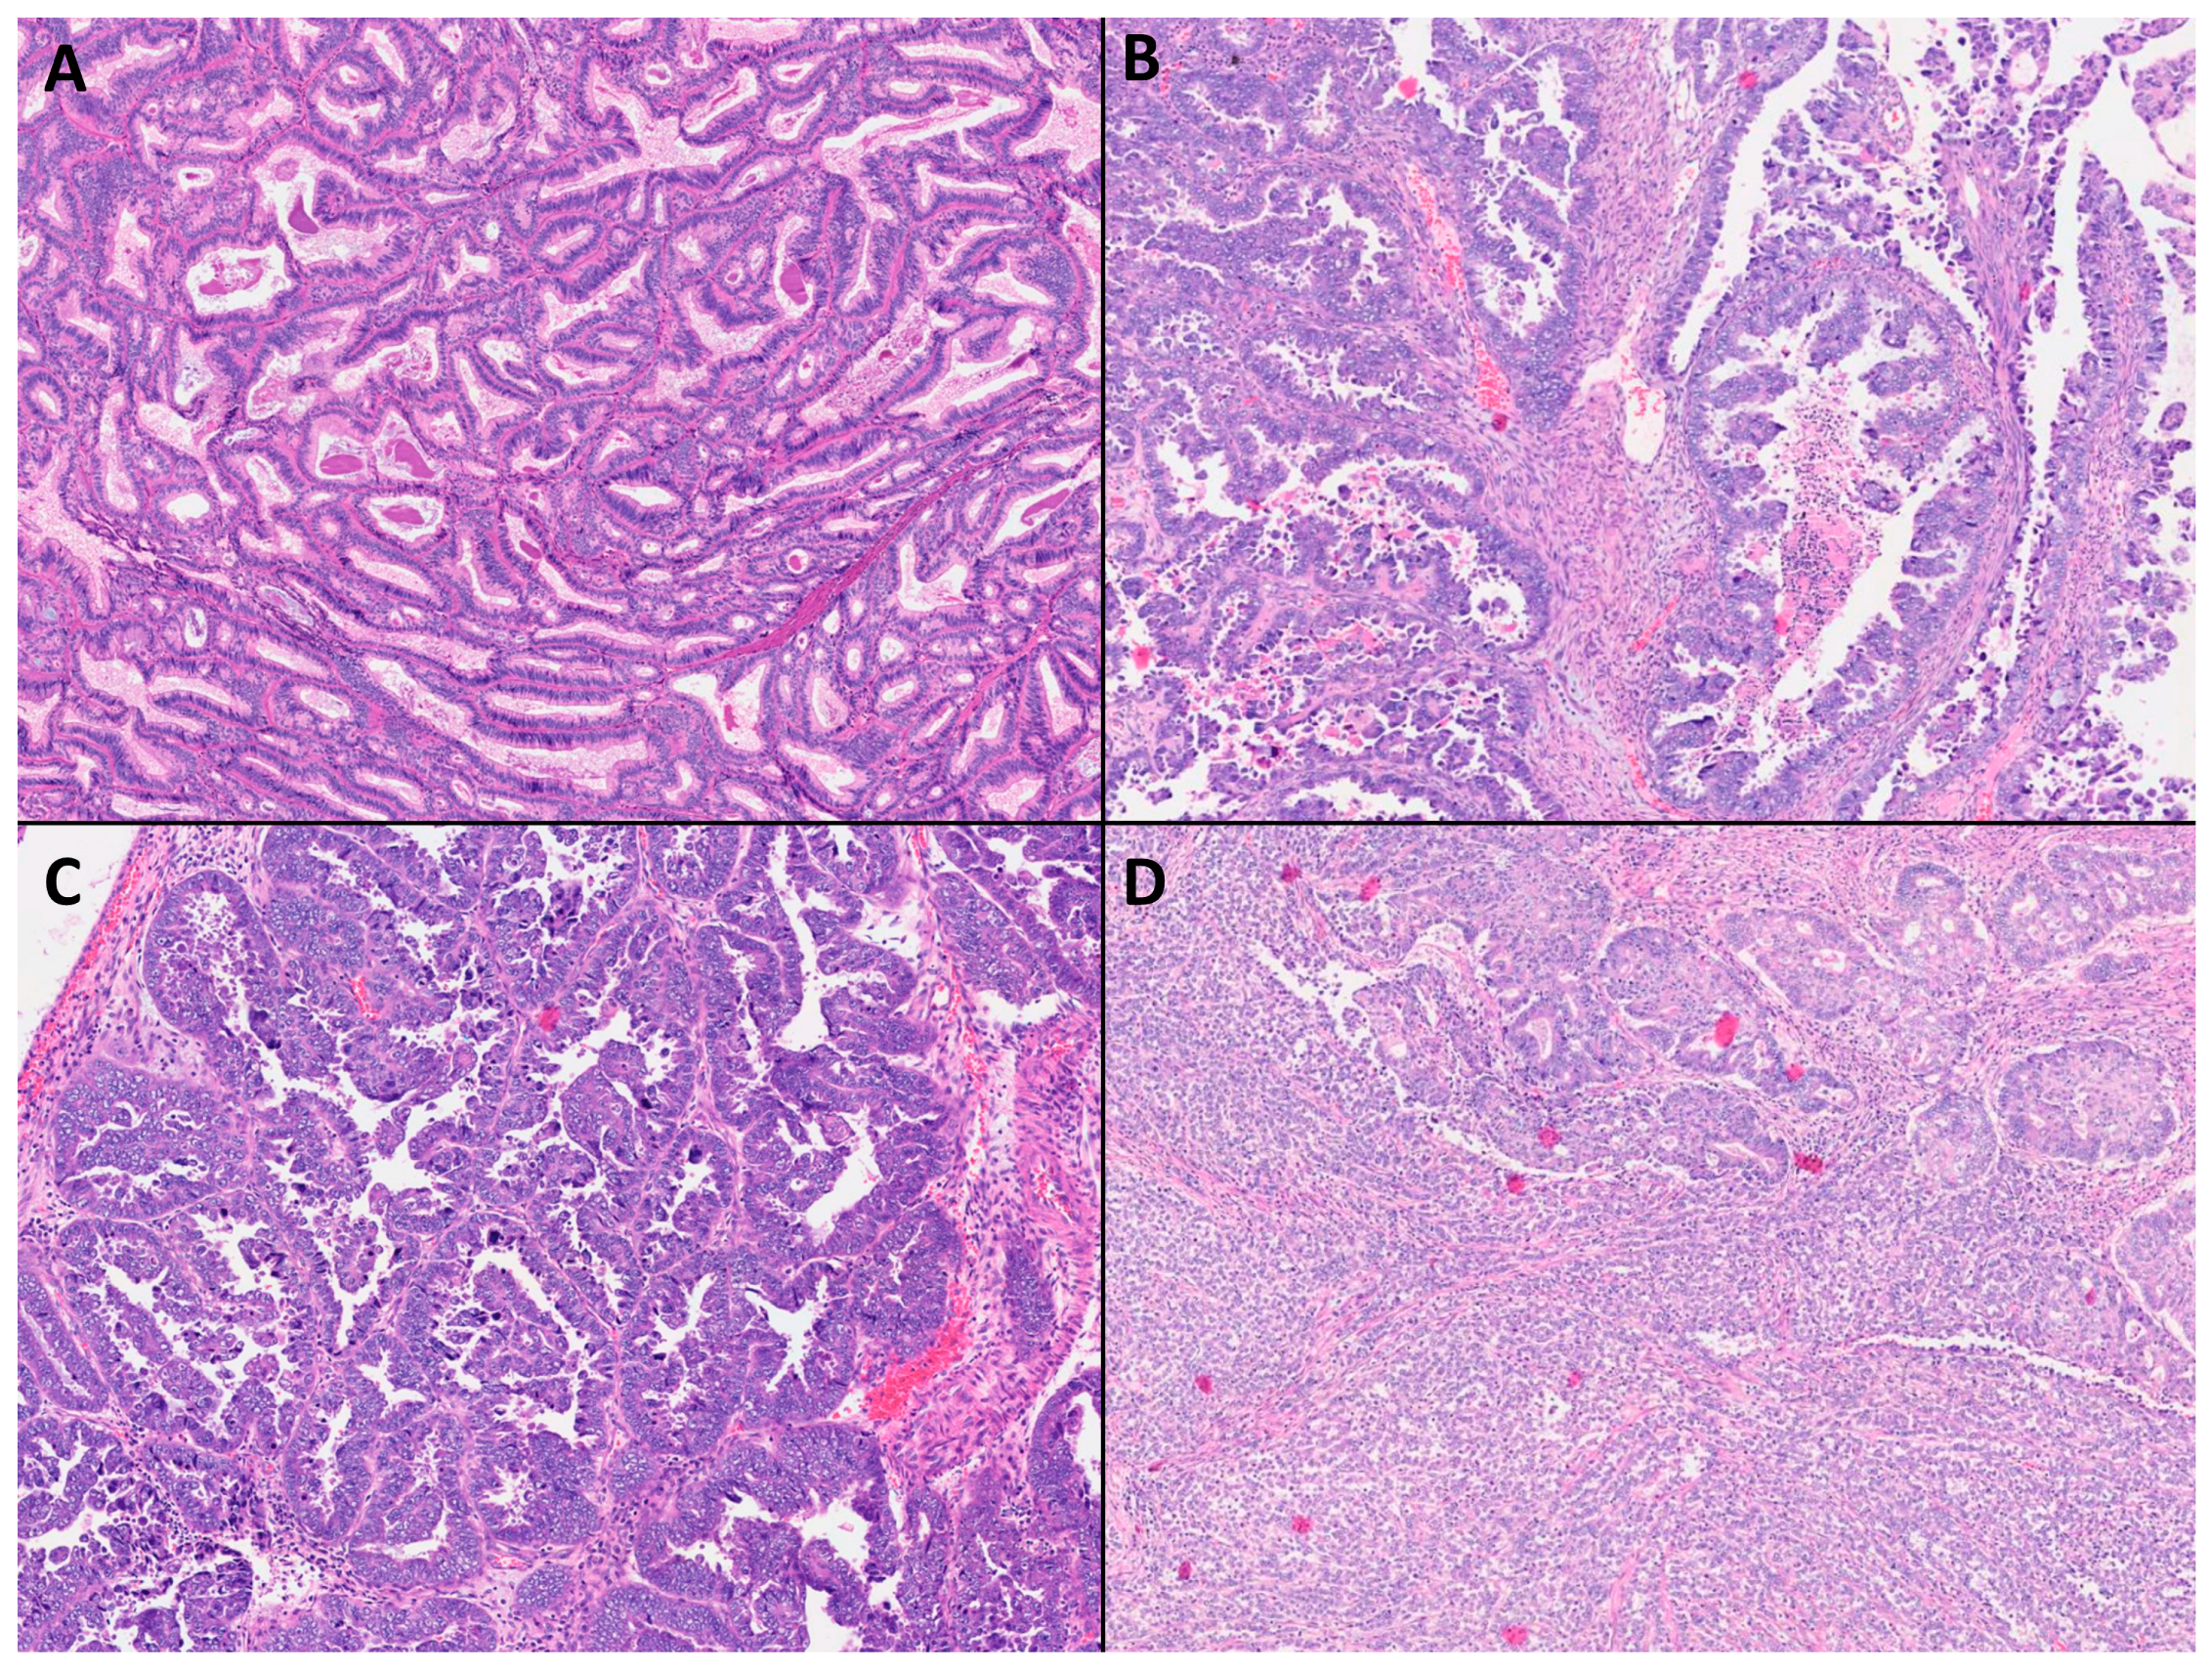
2.2. Classification According to Histological Subtypes
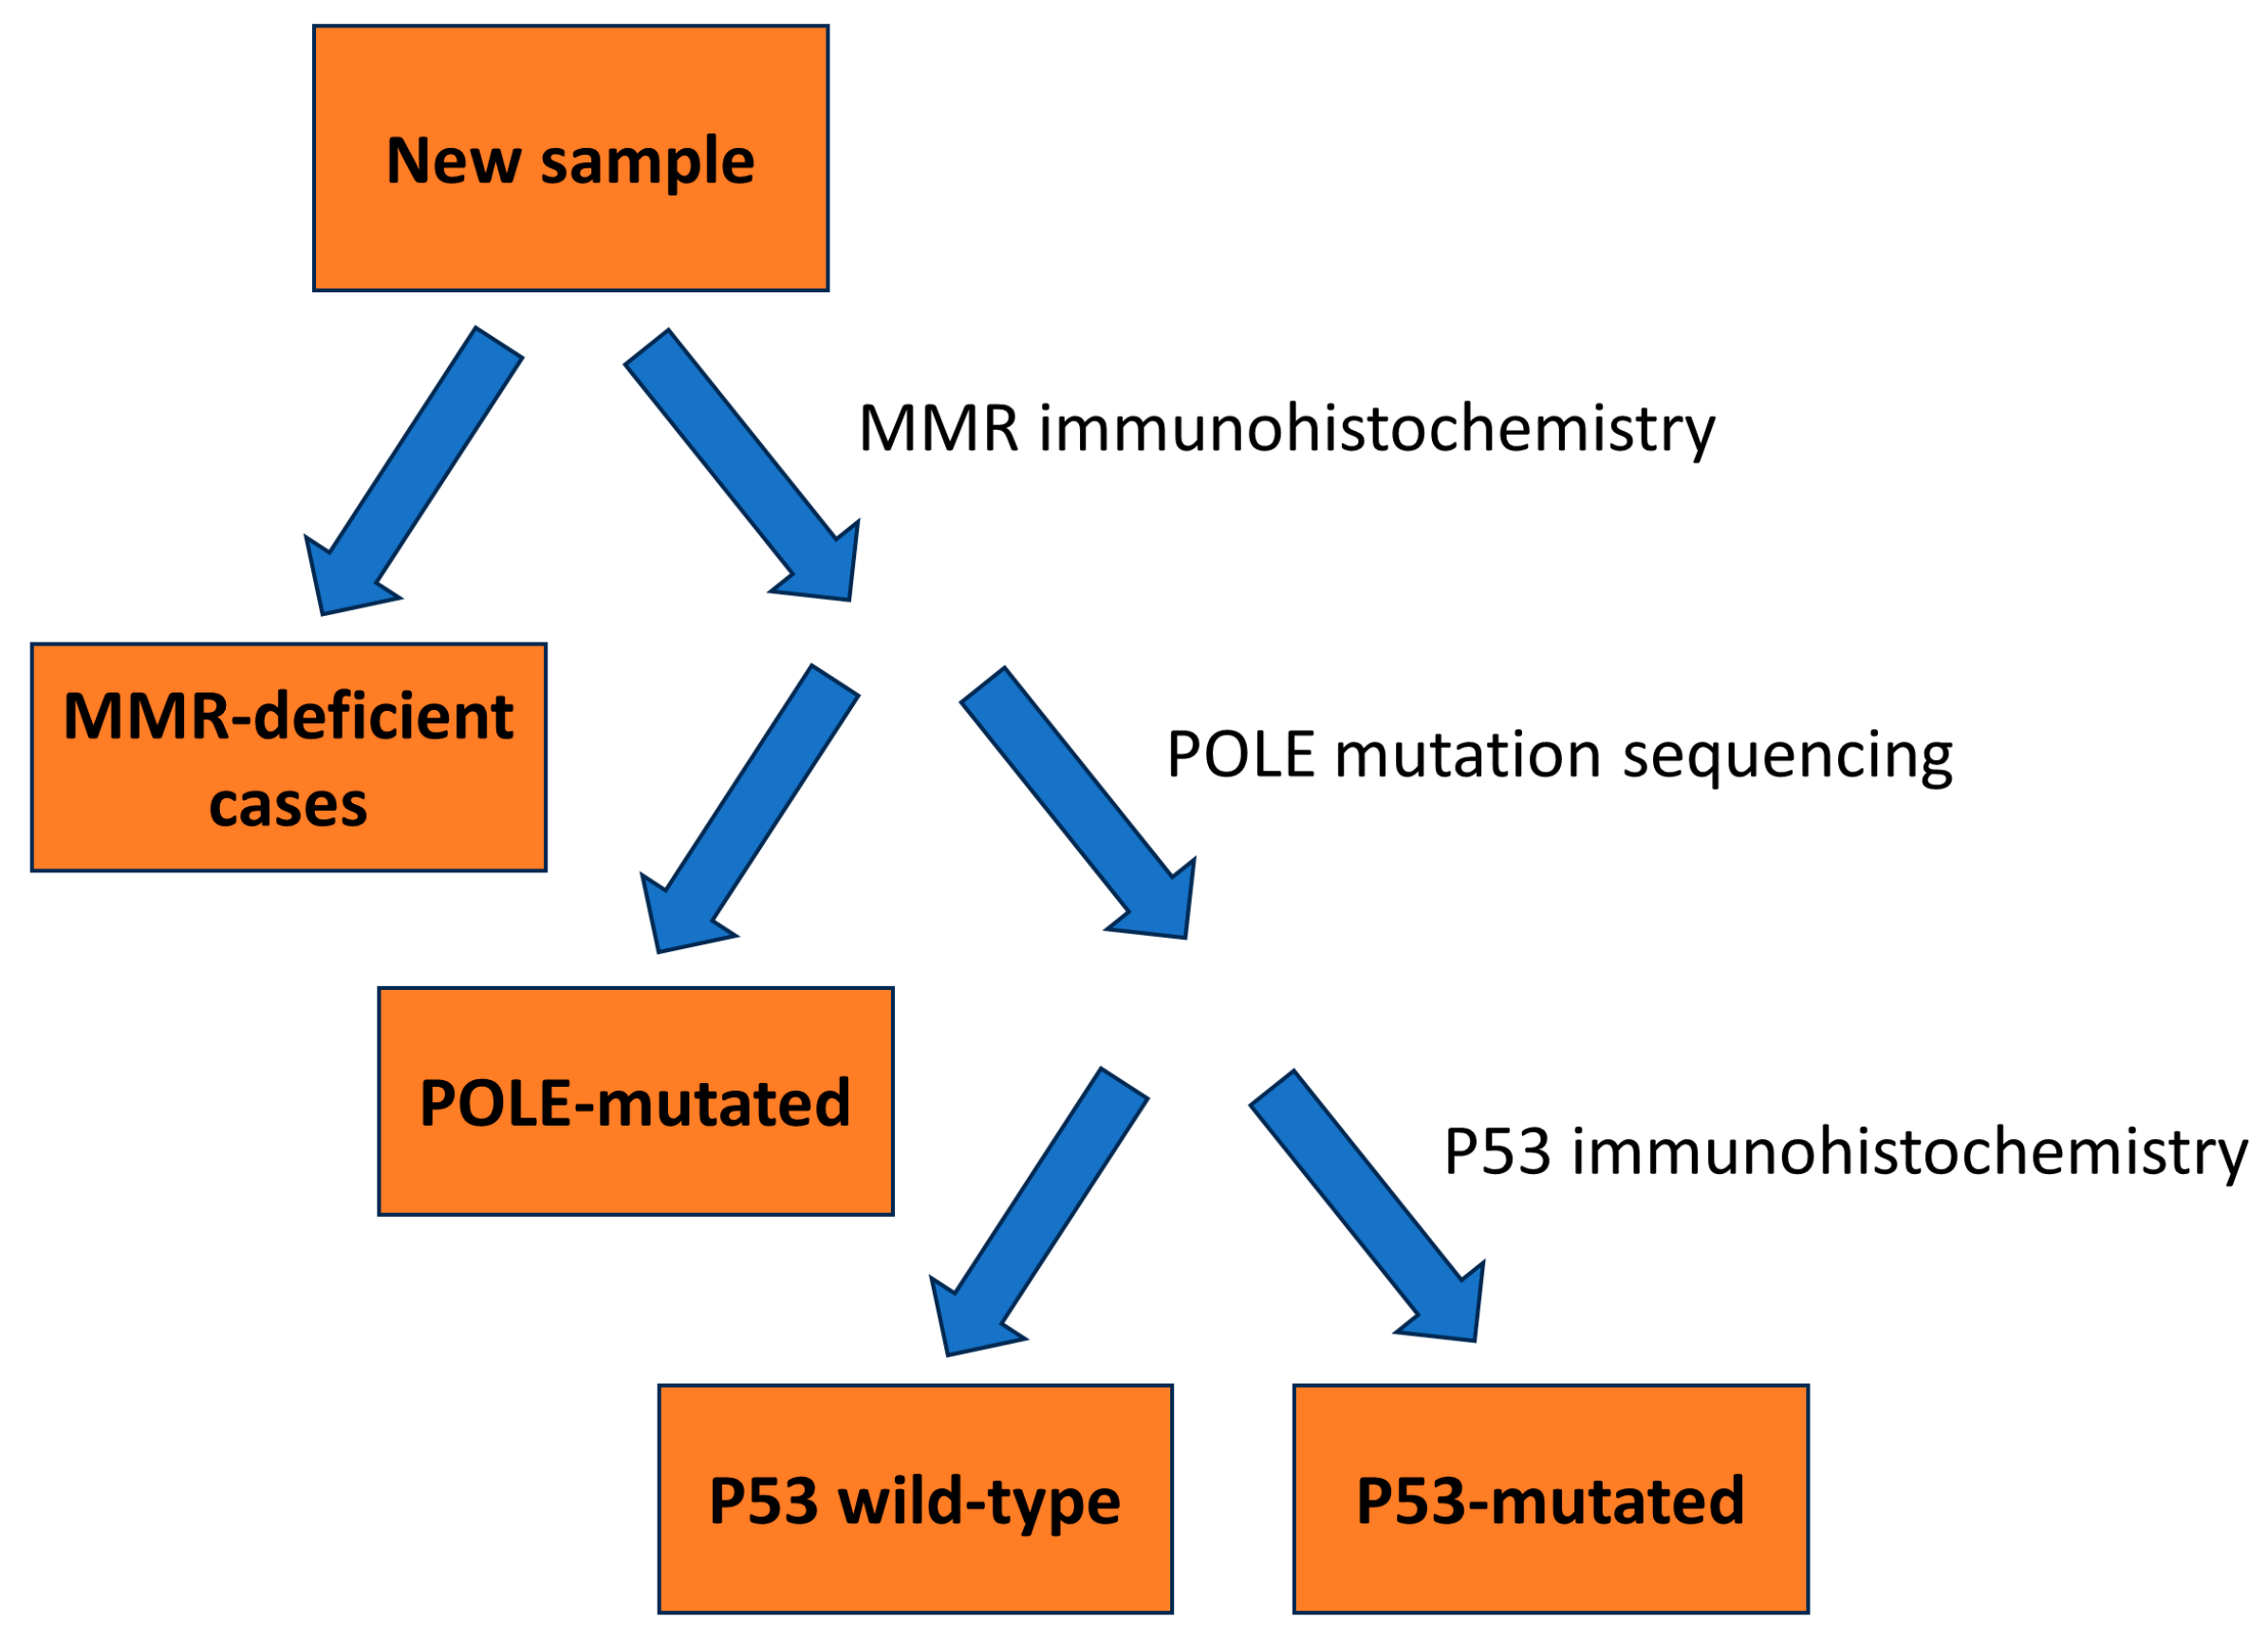
2.3. Classification According to Molecular Subtypes
2.4. DNA Extraction
2.5. Library Preparation for Sequencing
2.6. DNA Sequencing
2.7. CTNNB1 Mutations
2.8. POLE Mutation Analysis
2.9. Constructing the Tissue Microarray (TMA)
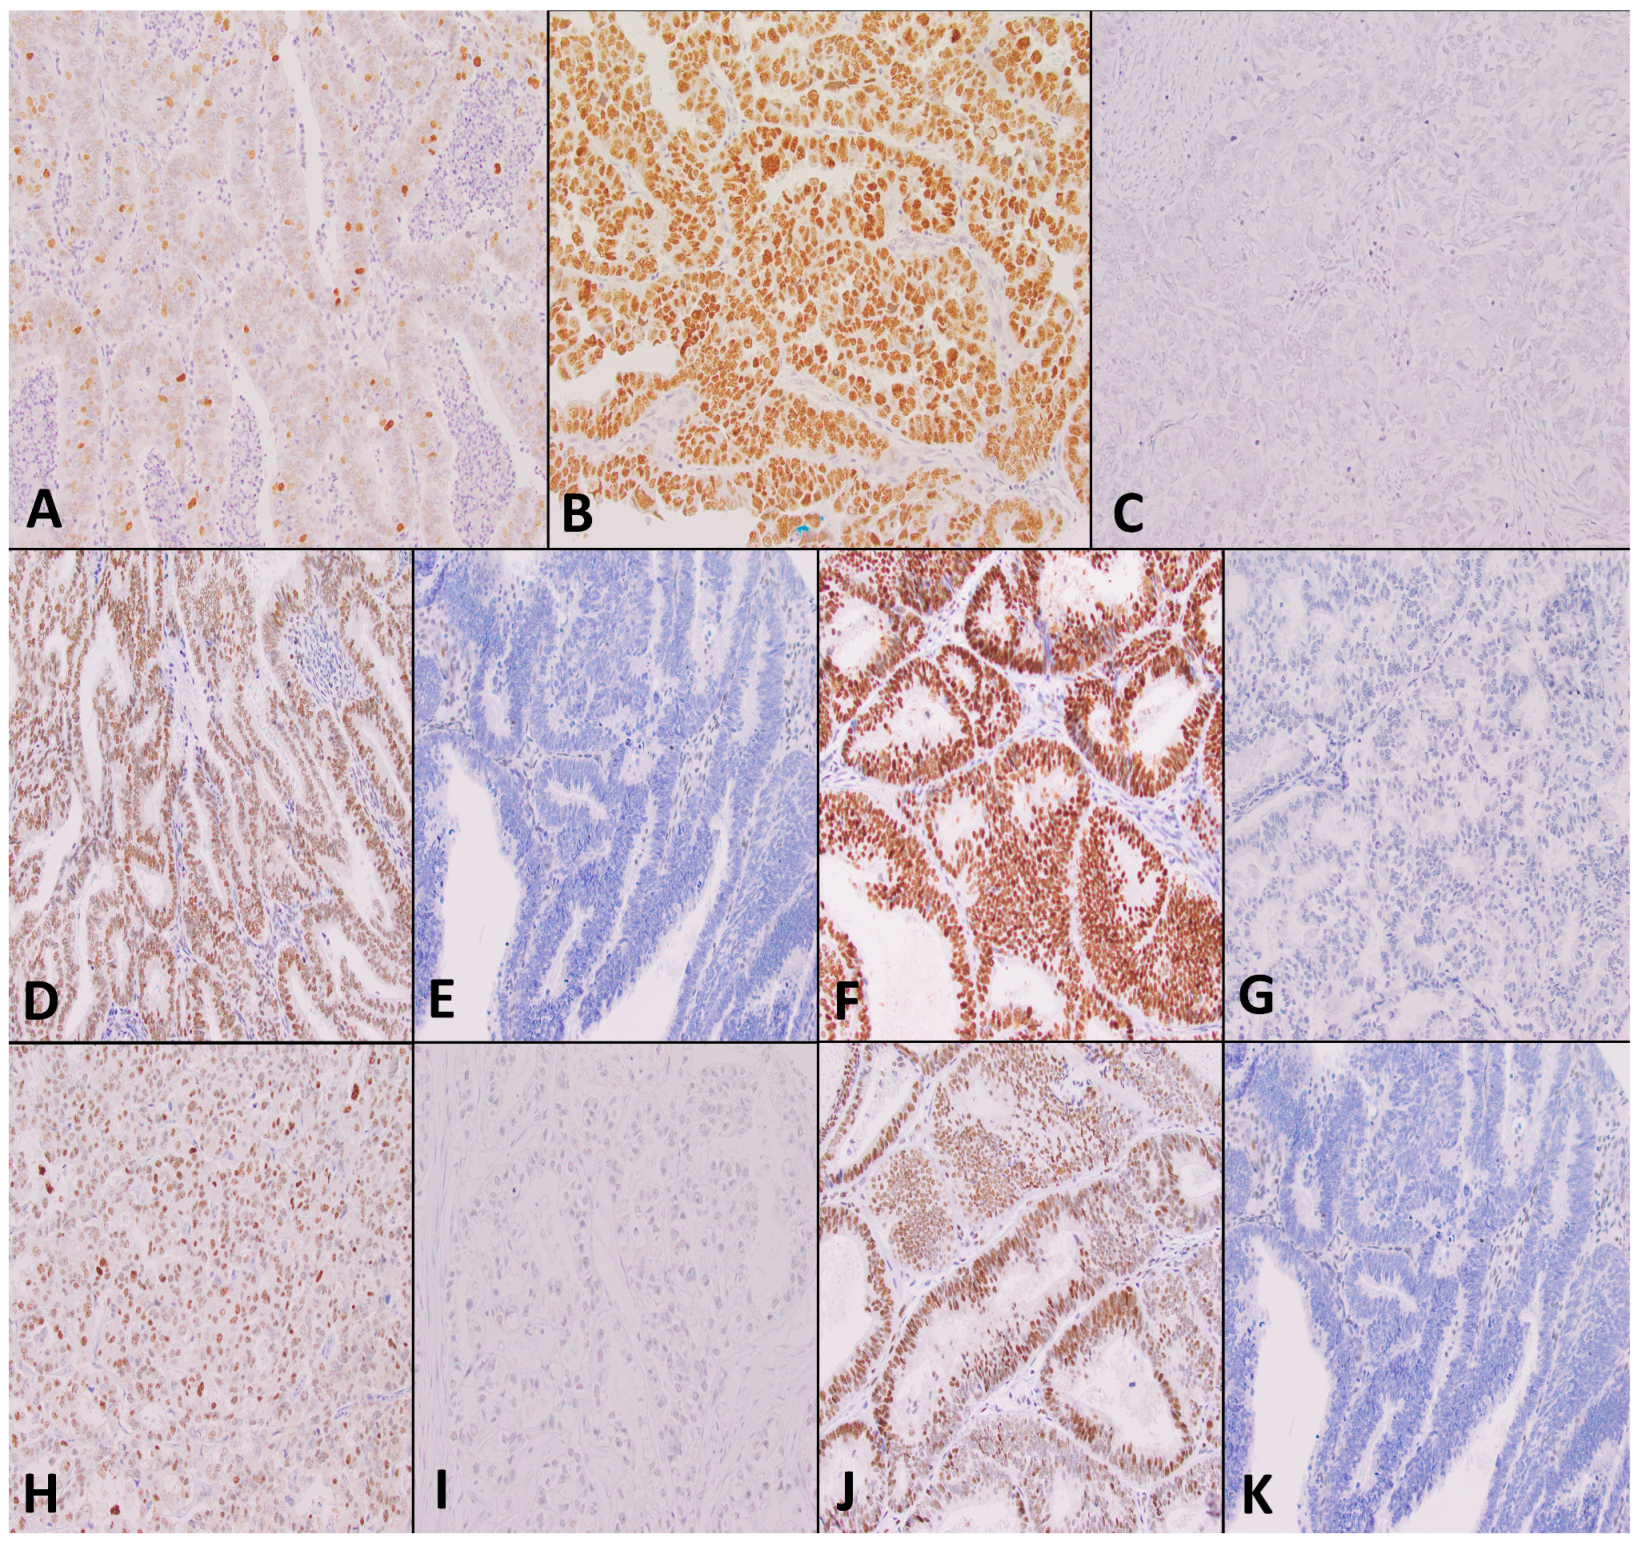
2.10. Immunohistochemistry for DNA Mismatch Repair and p53 Staining
2.11. Analysis of TMA
2.12. RNA Extraction
2.13. Statistical Analysis
3. Results
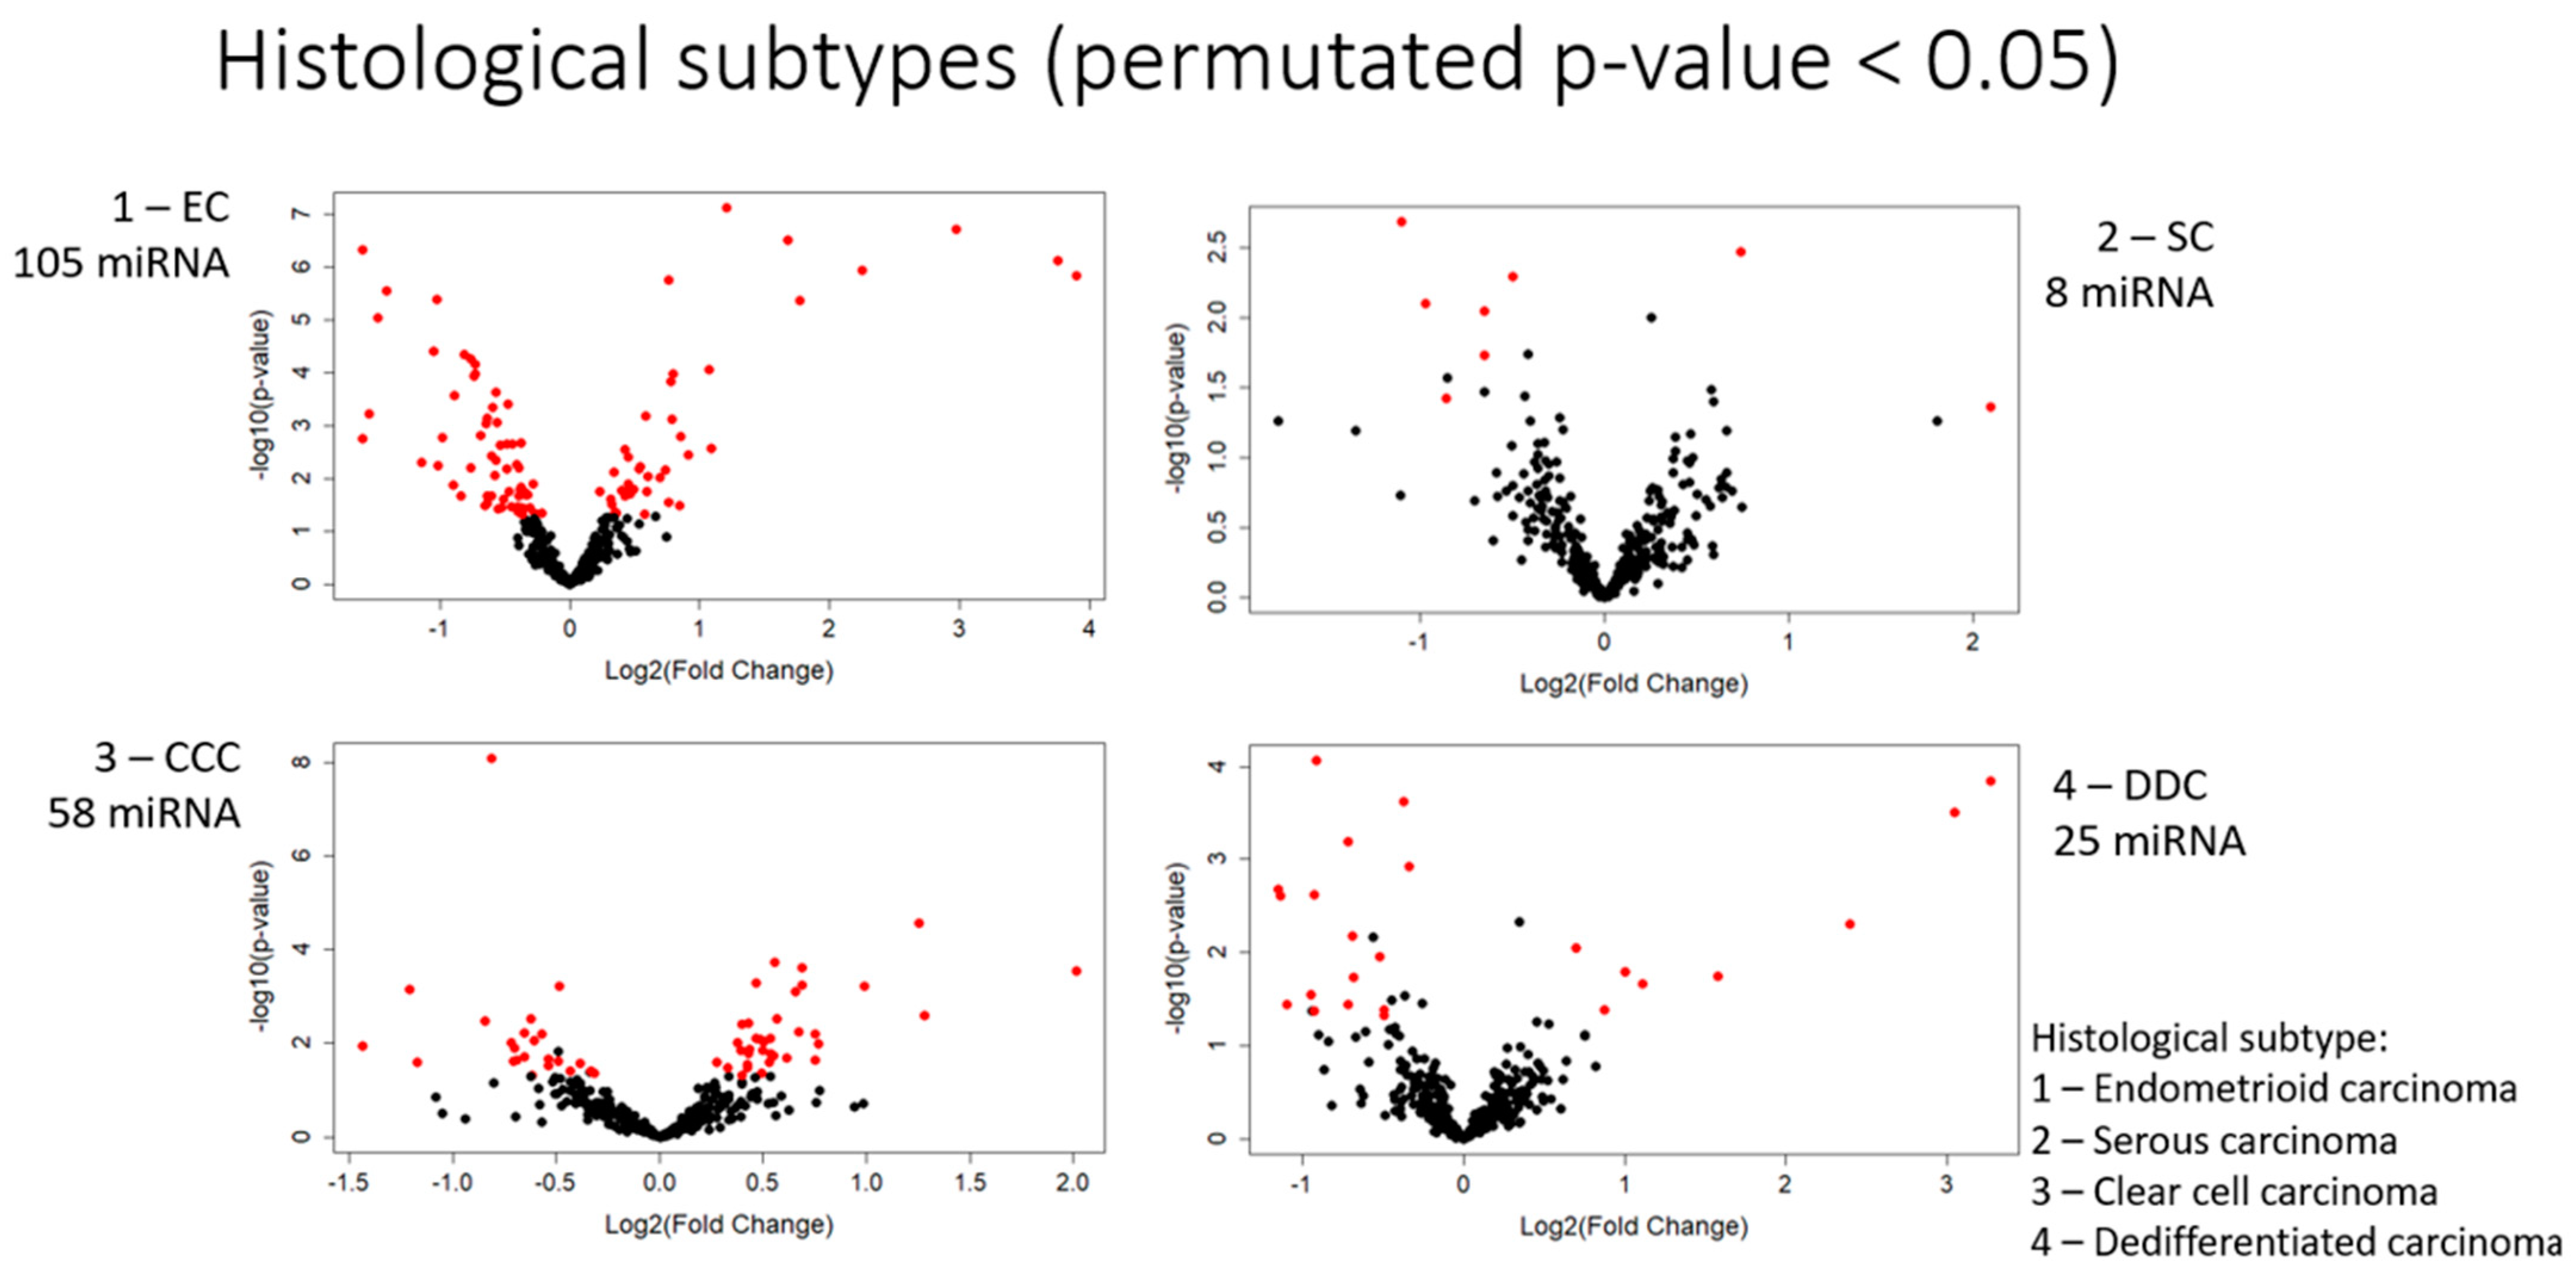
3.1. Differential Expression of miRNAs between Histological Subtypes
3.1.1. Endometrioid Carcinoma
3.1.2. Serous Carcinoma
3.1.3. Clear Cell Carcinoma
3.1.4. De-Differentiated Carcinoma
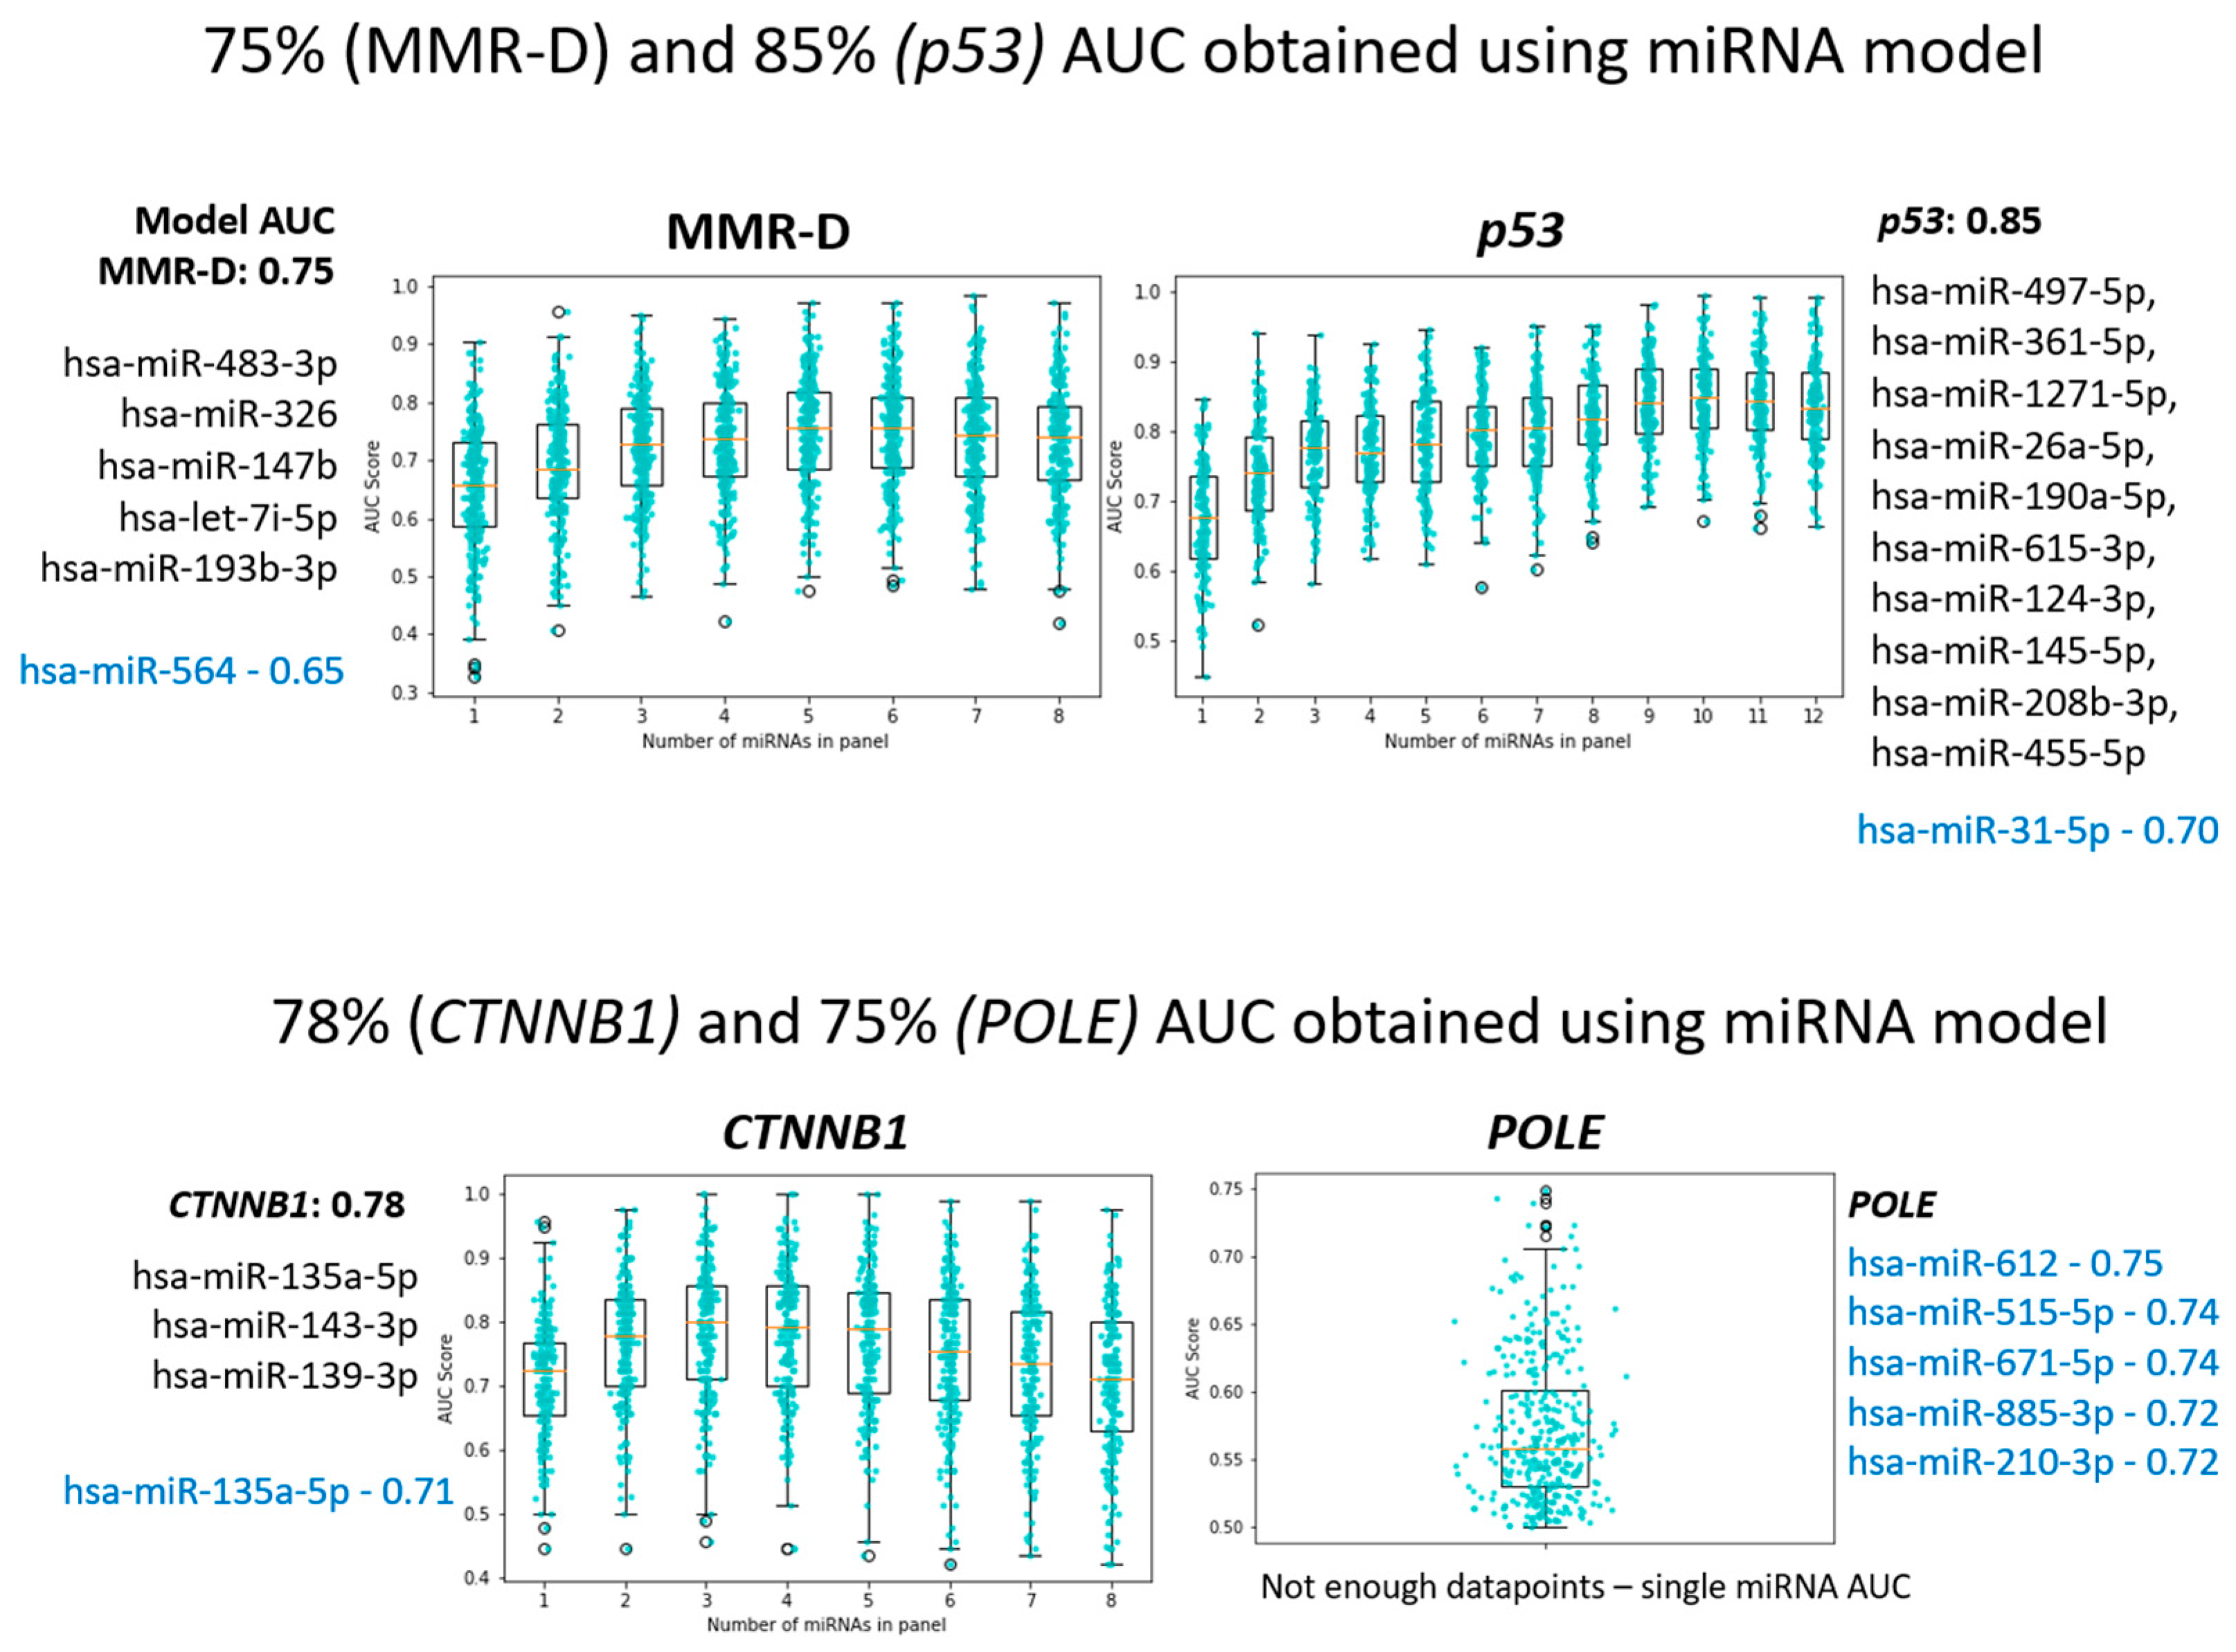
3.2. Differential Expression of MiRNAs between Molecular Subtypes
3.2.1. MMR-Deficient Group
3.2.2. POLE-Ultra-Mutated Group
3.2.3. P53 Mutant Group (Surrogate for Copy Number High)
3.2.4. P53 Wild Type (Surrogate for Copy Number Low)
3.2.5. CTNNB1 Mutation
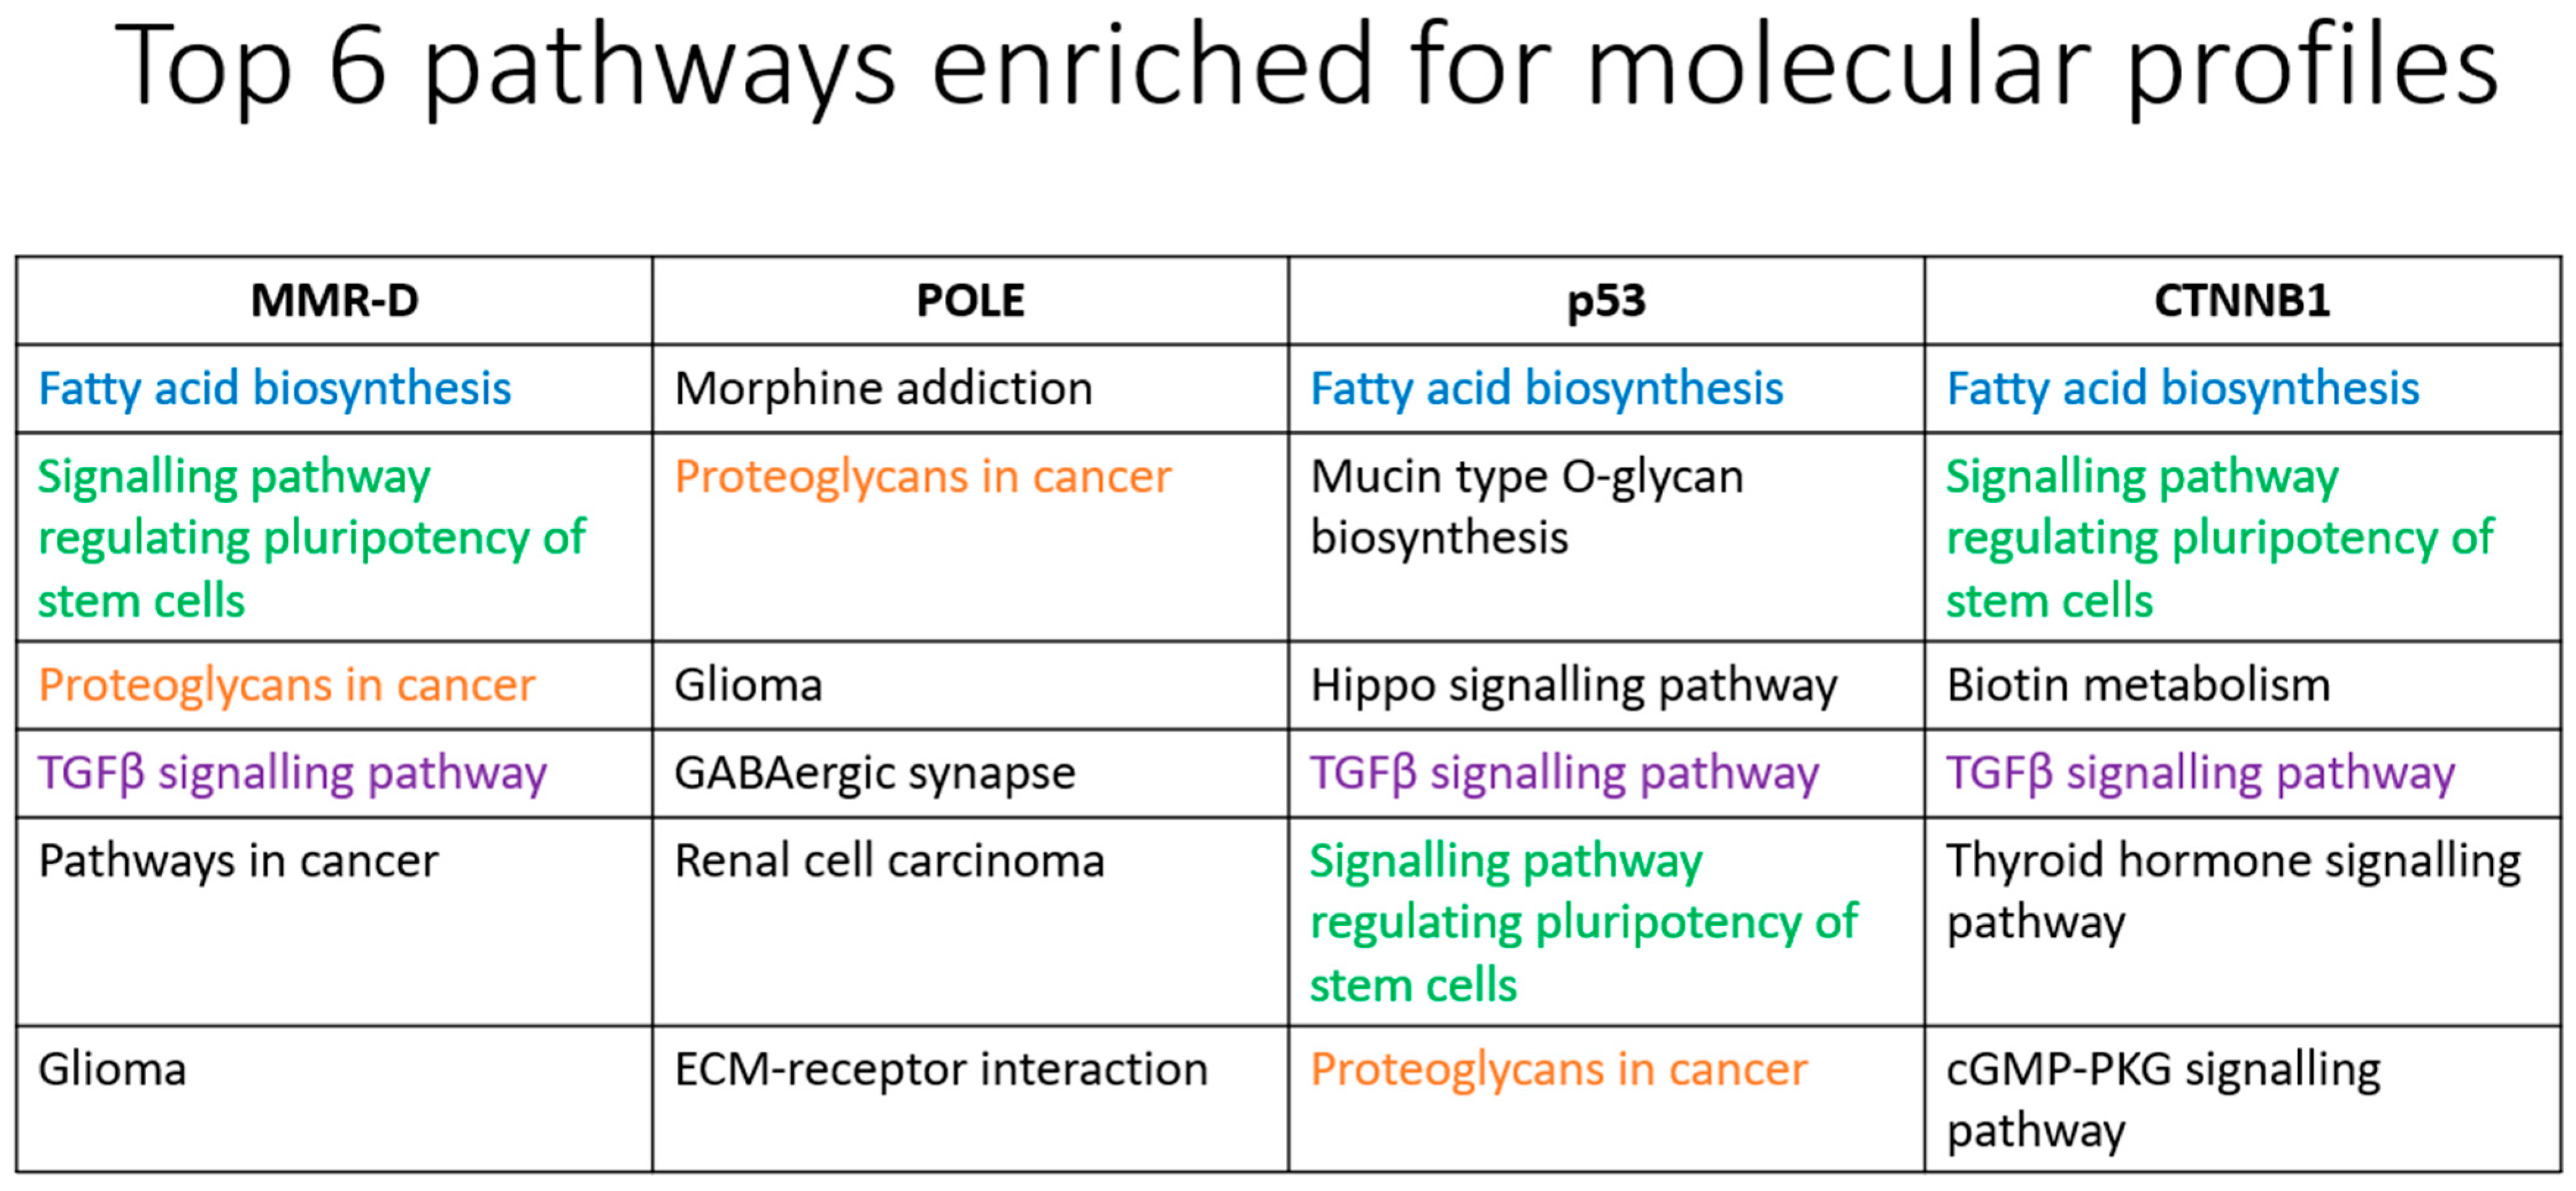
3.2.6. MirPath Analysis
4. Discussion
4.1. Limitations of the Paper
4.2. Evaluation of miRNA Expression with Molecular Subtype
4.3. MMR-Deficient Tumors
4.4. POLE-Ultra-Mutated Tumors
4.5. P53 Mutation (Surrogate for Copy Number High)
4.6. Evaluation of miRNA Expression with CTNNB1 Mutation
4.7. MirPath Analysis
5. Conclusions
Supplementary Materials
Author Contributions
Funding
Institutional Review Board Statement
Informed Consent Statement
Data Availability Statement
Acknowledgments
Conflicts of Interest
References
- Ferlay, J.; Colombet, M.; Soerjomataram, I.; Parkin, D.M.; Piñeros, M.; Znaor, A.; Bray, F. Cancer statistics for the year 2020: An overview. Int. J. Cancer 2021, 149, 778–789. [Google Scholar] [CrossRef]
- Cancer Genome Atlas Research Network; Kandoth, C.; Schultz, N.; Cherniack, A.D.; Akbani, R.; Liu, Y.; Shen, H.; Robertson, A.G.; Pashtan, I.; Shen, R.; et al. Integrated genomic characterization of endometrial carcinoma. Nature 2013, 497, 67–73. [Google Scholar] [CrossRef]
- Lau, N.C.; Lim, L.P.; Weinstein, E.G.; Bartel, D.P. An abundant class of tiny RNAs with probable regulatory roles in Caenorhabditis elegans. Science 2001, 294, 858–862. [Google Scholar] [CrossRef]
- Lagos-Quintana, M.; Rauhut, R.; Lendeckel, W.; Tuschl, T. Identification of novel genes coding for small expressed RNAs. Science 2001, 294, 853–858. [Google Scholar] [CrossRef]
- Bentwich, I.; Avniel, A.; Karov, Y.; Aharonov, R.; Gilad, S.; Barad, O.; Barzilai, A.; Einat, P.; Einav, U.; Meiri, E.; et al. Identification of hundreds of conserved and nonconserved human microRNAs. Nat. Genet. 2005, 37, 766–770. [Google Scholar] [CrossRef]
- Gu, S.; Kay, M.A. How do miRNAs mediate translational repression? Silence 2010, 1, 11. [Google Scholar] [CrossRef]
- Van Kouwenhove, M.; Kedde, M.; Agami, R. MicroRNA regulation by RNA-binding proteins and its implications for cancer. Nat. Rev. Cancer 2011, 11, 644–656. [Google Scholar] [CrossRef]
- Bartel, D.P. MicroRNAs: Genomics, biogenesis, mechanism, and function. Cell 2004, 116, 281–297. [Google Scholar] [CrossRef]
- Harfe, B.D. MicroRNAs in vertebrate development. Curr. Opin. Genet. Dev. 2005, 15, 410–415. [Google Scholar] [CrossRef]
- Friedman, R.C.; Farh, K.K.H.; Burge, C.B.; Bartel, D.P. Most mammalian mRNAs are conserved targets of microRNAs. Genome Res. 2009, 19, 92–105. [Google Scholar] [CrossRef]
- Esteller, M. Non-coding RNAs in human disease. Nat. Rev. Genet. 2011, 12, 861–874. [Google Scholar] [CrossRef]
- Farh, K.K.H.; Grimson, A.; Jan, C.; Lewis, B.P.; Johnston, W.K.; Lim, L.P.; Burge, C.B.; Bartel, D.P. The widespread impact of mammalian MicroRNAs on mRNA repression and evolution. Science 2005, 310, 1817–1821. [Google Scholar] [CrossRef]
- Landgraf, P.; Rusu, M.; Sheridan, R.; Sewer, A.; Iovino, N.; Aravin, A.; Pfeffer, S.; Rice, A.; Kamphorst, A.O.; Landthaler, M.; et al. A mammalian microRNA expression atlas based on small RNA library sequencing. Cell 2007, 129, 1401–1414. [Google Scholar] [CrossRef]
- Calin, G.A.; Croce, C.M. MicroRNA signatures in human cancers. Nat. Rev. Cancer 2006, 6, 857–866. [Google Scholar] [CrossRef]
- Esquela-Kerscher, A.; Slack, F.J. Oncomirs-microRNAs with a role in cancer. Nat. Rev. Cancer 2006, 6, 259–269. [Google Scholar] [CrossRef]
- Zhang, W.; Dahlberg, J.E.; Tam, W. MicroRNAs in Tumorigenesis: A Primer. Am. J. Pathol. 2007, 171, 728–738. [Google Scholar] [CrossRef]
- Ardekani, A.M.; Naeini, M.M. The Role of MicroRNAs in Human Diseases. Avicenna J. Med. Biotechnol. 2010, 2, 161–179. [Google Scholar]
- Lu, J.; Getz, G.; Miska, E.A.; Alvarez-Saavedra, E.; Lamb, J.; Peck, D.; Sweet-Cordero, A.; Ebert, B.L.; Mak, R.H.; Ferrando, A.A.; et al. MicroRNA expression profiles classify human cancers. Nature 2005, 435, 834–838. [Google Scholar] [CrossRef]
- Rosenfeld, N.; Aharonov, R.; Meiri, E.; Rosenwald, S.; Spector, Y.; Zepeniuk, M.; Benjamin, H.; Shabes, N.; Tabak, S.; Levy, A.; et al. MicroRNAs accurately identify cancer tissue origin. Nat. Biotechnol. 2008, 26, 462–469. [Google Scholar] [CrossRef]
- Tsongalis, G.J.; Calin, G.; Cordelier, P.; Croce, C.; Monzon, F.; Szafranska-Schwarzbach, A.E. MicroRNA Analysis: Is It Ready for Prime Time? Clin. Chem. 2013, 59, 343–347. [Google Scholar] [CrossRef]
- Xi, Y.; Nakajima, G.; Gavin, E.; Morris, C.G.; Kudo, K.; Hayashi, K.; Ju, J. Systematic analysis of microRNA expression of RNA extracted from fresh frozen and formalin-fixed paraffin-embedded sample. RNA 2007, 13, 1668–1674. [Google Scholar] [CrossRef] [PubMed]
- Kurnit, K.C.; Kim, G.N.; Fellman, B.M.; Urbauer, D.L.; Mills, G.B.; Zhang, W.; Broaddus, R.R. CTNNB1 (beta-catenin) mutation identifies low grade, early stage endometrial cancer patients at increased risk of recurrence. Mod. Pathol. 2017, 30, 1032–1041. [Google Scholar] [CrossRef] [PubMed]
- Parrish, M.L.; Broaddus, R.R.; Gladden, A.B. Mechanisms of mutant β-catenin in endometrial cancer progression. Front. Oncol. 2022, 12, 1009345. [Google Scholar] [CrossRef] [PubMed]
- Talhouk, A.; McConechy, M.K.; Leung, S.; Li-Chang, H.H.; Kwon, J.S.; Melnyk, N.; Yang, W.; Senz, J.; Boyd, N.; Karnezis, A.N.; et al. A clinically applicable molecular-based classification for endometrial cancers. Br. J. Cancer 2015, 113, 299–310. [Google Scholar] [CrossRef]
- Jurcevic, S.; Olsson, B.; Klinga-Levan, K. MicroRNA expression in human endometrial adenocarcinoma. Cancer Cell Int. 2014, 14, 88. [Google Scholar] [CrossRef]
- Chung, T.K.; Cheung, T.H.; Huen, N.Y.; Wong, K.W.; Lo, K.W.; Yim, S.F.; Siu, N.S.; Wong, Y.M.; Tsang, P.T.; Pang, M.W.; et al. Dysregulated microRNAs and their predicted targets associated with endometrioid endometrial adenocarcinoma in Hong Kong women. Int. J. Cancer 2009, 124, 1358–1365. [Google Scholar] [CrossRef]
- Torres, A.; Torres, K.; Pesci, A.; Ceccaroni, M.; Paszkowski, T.; Cassandrini, P.; Zamboni, G.; Maciejewski, R. Diagnostic and prognostic significance of miRNA signatures in tissues and plasma of endometrioid endometrial carcinoma patients. Int. J. Cancer 2013, 132, 1633–1645. [Google Scholar] [CrossRef]
- Cohn, D.E.; Fabbri, M.; Valeri, N.; Alder, H.; Ivanov, I.; Liu, C.G.; Croce, C.M.; Resnick, K.E. Comprehensive miRNA profiling of surgically staged endometrial cancer. Am. J. Obstet. Gynecol. 2010, 202, 656.e1–656.e8. [Google Scholar] [CrossRef]
- Ratner, E.S.; Tuck, D.; Richter, C.; Nallur, S.; Patel, R.M.; Schultz, V.; Hui, P.; Schwartz, P.E.; Rutherford, T.J.; Weidhaas, J.B. MicroRNA signatures differentiate uterine cancer tumor subtypes. Gynecol. Oncol. 2010, 118, 251–257. [Google Scholar] [CrossRef]
- Devor, E.J.; Hovey, A.M.; Goodheart, M.J.; Ramachandran, S.; Leslie, K.K. microRNA expression profiling of endometrial endometrioid adenocarcinomas and serous adenocarcinomas reveals profiles containing shared, unique and differentiating groups of microRNAs. Oncol. Rep. 2011, 26, 995–1002. [Google Scholar] [CrossRef]
- Liu, S.; Deng, X.; Zhang, J. Identification of dysregulated serum miR-508-3p and miR-885-5p as potential diagnostic biomarkers of clear cell renal carcinoma. Mol. Med. Rep. 2019, 20, 5075–5083. [Google Scholar] [CrossRef] [PubMed]
- Li, S.; Sun, M.Y.; Su, X. MiR-885-5p promotes gastric cancer proliferation and invasion through regulating YPEL1. Eur. Rev. Med. Pharmacol. Sci. 2019, 23, 7913–7919. [Google Scholar] [CrossRef]
- Cui, H.W.; Han, W.Y.; Hou, L.N.; Yang, L.; Li, X.; Su, X.L. miR-1915-3p inhibits Bcl-2 expression in the development of gastric cancer. Biosci. Rep. 2019, 39, BSR20182321. [Google Scholar] [CrossRef] [PubMed]
- Pan, H.; Pan, Z.; Guo, F.; Meng, F.; Zu, L.; Fan, Y.; Li, Y.; Li, M.; Du, X.; Zhang, X.; et al. MicroRNA-1915-3p inhibits cell migration and invasion by targeting SET in non-small-cell lung cancer. BMC Cancer 2021, 21, 1218. [Google Scholar] [CrossRef] [PubMed]
- Guo, J.; Liu, C.; Wang, W.; Liu, Y.; He, H.; Chen, C.; Xiang, R.; Luo, Y. Identification of serum miR-1915-3p and miR-455-3p as biomarkers for breast cancer. PLoS ONE 2018, 13, e0200716. [Google Scholar] [CrossRef] [PubMed]
- Liu, J.; Li, C.; Jiang, Y.; Wan, Y.; Zhou, S.; Cheng, W. Tumor-suppressor role of miR-139-5p in endometrial cancer. Cancer Cell Int. 2018, 18, 51. [Google Scholar] [CrossRef]
- Li, X.R.; Chu, H.J.; Lv, T.; Wang, L.; Kong, S.F.; Dai, S.Z. miR-342-3p suppresses proliferation, migration and invasion by targeting FOXM1 in human cervical cancer. FEBS Lett. 2014, 588, 3298–3307. [Google Scholar] [CrossRef]
- Liu, W.; Kang, L.; Han, J.; Wang, Y.; Shen, C.; Yan, Z.; Tai, Y.; Zhao, C. miR-342-3p suppresses hepatocellular carcinoma proliferation through inhibition of IGF-1R-mediated Warburg effect. OncoTargets Ther. 2018, 11, 1643–1653. [Google Scholar] [CrossRef]
- Guo, Q.; Wang, H.; Xu, Y.; Wang, M.; Tian, Z. miR-374a-5p inhibits non-small cell lung cancer cell proliferation and migration via targeting NCK1. Exp. Ther. Med. 2021, 22, 943. [Google Scholar] [CrossRef]
- Karaayvaz, M.; Zhang, C.; Liang, S.; Shroyer, K.R.; Ju, J. Prognostic Significance of miR-205 in Endometrial Cancer. PLoS ONE 2012, 7, e35158. [Google Scholar] [CrossRef]
- Su, N.; Qiu, H.; Chen, Y.; Yang, T.; Yan, Q.; Wan, X. miR-205 promotes tumor proliferation and invasion through targeting ESRRG in endometrial carcinoma. Oncol. Rep. 2013, 29, 2297–2302. [Google Scholar] [CrossRef] [PubMed]
- Lu, Z.; Xu, Y.; Yao, Y.; Jiang, S. miR-205-5p contributes to paclitaxel resistance and progression of endometrial cancer by downregulating FOXO1. Oncol. Res. 2019. [Google Scholar] [CrossRef]
- Shi, C.; Yang, Y.; Zhang, L.; Yu, J.; Qin, S.; Xu, H.; Gao, Y. MiR-200a-3p promoted the malignant behaviors of ovarian cancer cells through regulating PCDH9. OncoTargets Ther. 2019, 12, 8329–8338. [Google Scholar] [CrossRef] [PubMed]
- Wan, P.; Chen, Z.; Huang, M.; Jiang, H.; Wu, H.; Zhong, K.; Ding, G.; Wang, B. miR-200a-3p facilitates bladder cancer cell proliferation by targeting the A20 gene. Transl. Androl. Urol. 2021, 10, 4262–4274. [Google Scholar] [CrossRef] [PubMed]
- Wu, X.; Liu, H.; Zhang, M.; Ma, J.; Qi, S.; Tan, Q.; Jiang, Y.; Hong, Y.; Yan, L. miR-200a-3p promoted cell proliferation and metastasis by downregulating SOX17 in non-small cell lung cancer cells. J. Biochem. Mol. Toxicol. 2022, 36, e23037. [Google Scholar] [CrossRef]
- Zang, Y.; Tai, Y.; Wan, B.; Jia, X. miR-200a-3p promotes the proliferation of human esophageal cancer cells by post-transcriptionally regulating cytoplasmic collapsin response mediator protein-1. Int. J. Mol. Med. 2016, 38, 1558–1564. [Google Scholar] [CrossRef]
- Pidíková, P.; Herichová, I. miRNA Clusters with Up-Regulated Expression in Colorectal Cancer. Cancers 2021, 13, 2979. [Google Scholar] [CrossRef]
- Chen, L.; Gao, H.; Liang, J.; Qiao, J.; Duan, J.; Shi, H.; Zhen, T.; Li, H.; Zhang, F.; Zhu, Z.; et al. miR-203a-3p promotes colorectal cancer proliferation and migration by targeting PDE4D. Am. J. Cancer Res. 2018, 8, 2387–2401. [Google Scholar]
- Jing, L.; Hua, X.; Yuanna, D.; Rukun, Z.; Junjun, M. Exosomal miR-499a-5p Inhibits Endometrial Cancer Growth and Metastasis via Targeting VAV3. Cancer Manag. Res. 2020, 12, 13541–13552. [Google Scholar] [CrossRef]
- Zhao, L.; Jiang, P.; Zheng, H.; Chen, P.; Yang, M. Downregulation of miR-499a-5p Predicts a Poor Prognosis of Patients With Non-Small Cell Lung Cancer and Restrains the Tumorigenesis by Targeting Fibroblast Growth Factor 9. Technol. Cancer Res. Treat. 2020, 19. [Google Scholar] [CrossRef]
- Chen, Z.; Zhu, Y.; Fan, X.; Liu, Y.; Feng, Q. Decreased expression of miR-184 restrains the growth and invasion of endometrial carcinoma cells through CDC25A-dependent Notch signaling pathway. Am. J. Transl. Res. 2019, 11, 755–764. [Google Scholar] [PubMed]
- Su, Z.; Chen, D.; Li, Y.; Zhang, E.; Yu, Z.; Chen, T.; Jiang, Z.; Ni, L.; Yang, S.; Gui, Y.; et al. microRNA-184 functions as tumor suppressor in renal cell carcinoma. Exp. Ther. Med. 2015, 9, 961–966. [Google Scholar] [CrossRef] [PubMed]
- Zhang, K.; Li, H.; Yan, Y.; Zang, Y.; Li, K.; Wang, Y.; Xue, F. Identification of key genes and pathways between type I and type II endometrial cancer using bioinformatics analysis. Oncol. Lett. 2019, 18, 2464–2476. [Google Scholar] [CrossRef] [PubMed]
- Zhu, Y.; Shi, L.; Chen, P.; Zhang, Y.; Zhu, T. Identification of six candidate genes for endometrial carcinoma by bioinformatics analysis. World J. Surg. Oncol. 2020, 18, 161. [Google Scholar] [CrossRef] [PubMed]
- Zhang, Q.; Xia, T.; Qi, C.; Du, J.; Ye, C. High expression of S100A2 predicts poor prognosis in patients with endometrial carcinoma. BMC Cancer 2022, 22, 77. [Google Scholar] [CrossRef]
- Widodo; Djati, M.S.; Rifa, I.M. Role of MicroRNAs in carcinogenesis with potential as biomarkers for endometrial cancer. Ann. Med. Surg. 2016, 26, 9–13. [Google Scholar] [CrossRef]
- Liu, Z.; Yi, L.; Du, M.; Gong, G.; Zhu, Y. Overexpression of TGF-β enhances the migration and invasive ability of ectopic endometrial cells via ERK/MAPK signaling pathway. Exp. Ther. Med. 2019, 17, 4457–4464. [Google Scholar] [CrossRef]
- Xiong, S.; Cheng, J.C.; Klausen, C.; Zhao, J.; Leung, P.C. TGF-β1 stimulates migration of type II endometrial cancer cells by down-regulating PTEN via activation of SMAD and ERK1/2 signaling pathways. Oncotarget 2016, 7, 61262–61272. [Google Scholar] [CrossRef]
- Zakrzewski, P.K. Canonical TGFβ Signaling and Its Contribution to Endometrial Cancer Development and Progression—Underestimated Target of Anticancer Strategies. J. Clin. Med. 2021, 10, 3900. [Google Scholar] [CrossRef]
- Giannone, G.; Attademo, L.; Scotto, G.; Genta, S.; Ghisoni, E.; Tuninetti, V.; Aglietta, M.; Pignata, S.; Valabrega, G. Endometrial Cancer Stem Cells: Role, Characterization, and Therapeutic Implications. Cancers 2019, 11, 1820. [Google Scholar] [CrossRef]
- Banz-Jansen, C.; Helweg, L.P.; Kaltschmidt, B. Endometrial Cancer Stem Cells: Where Do We Stand and Where Should We Go? Int. J. Mol. Sci. 2022, 23, 3412. [Google Scholar] [CrossRef] [PubMed]
- Pizer, E.S.; Lax, S.F.; Kuhajda, F.P.; Pasternack, G.R.; Kurman, R.J. Fatty acid synthase expression in endometrial carcinoma: Correlation with cell proliferation and hormone receptors. Cancer 1998, 83, 528–537. [Google Scholar] [CrossRef]
- Tsuji, T.; Yoshinaga, M.; Togami, S.; Douchi, T.; Nagata, Y. Fatty acid synthase expression and clinicopathological findings in endometrial cancer. Acta Obstet. Gynecol. Scand. 2004, 83, 586–590. [Google Scholar] [CrossRef] [PubMed]
- Lupu, R.; Menendez, J.A. Targeting fatty acid synthase in breast and endometrial cancer: An alternative to selective estrogen receptor modulators? Endocrinology 2006, 147, 4056–4066. [Google Scholar] [CrossRef]


| Inclusion Criteria | Exclusion Criteria |
|---|---|
|
|
| Tumor Type | (n) |
|---|---|
| Endometrioid carcinoma | 89 |
| 33 |
| 33 |
| 23 |
| Serous carcinoma | 8 |
| Clear cell carcinoma | 13 |
| De-differentiated carcinoma | 9 |
| Tumor Type | (n) |
|---|---|
| Endometrioid carcinoma | 82 |
| 30 |
| 29 |
| 23 |
| Serous carcinoma | 5 |
| Clear cell carcinoma | 7 |
| De-differentiated carcinoma | 8 |
| Molecular Subtype | (n) |
|---|---|
| MMR-deficient | 48 |
| POLE-mutated | 8 |
| P53 wild type (copy number low) | 35 |
| P53 mutated (copy number high) | 11 |
| Tumor Type | (n) |
|---|---|
| Endometrioid carcinoma | 17 (23.3%) |
| 9 (33.3%) |
| 3 (12.5%) |
| 5 (22.7%) |
| Serous carcinoma | 0 (0%) |
| Clear cell carcinoma | 1 (16.7%) |
| De-differentiated carcinoma | 1 (12.5%) |
| Differential Expression of Micro-RNAs between Histological Subtypes (Fold Change) | |||||||
|---|---|---|---|---|---|---|---|
| Endometrioid | Serous | Clear Cell | De-Differentiated | ||||
| Increased | Increased | Increased | Increased | ||||
| miR-449a miR-449b-5p miR-449c-5p miR-375 miR-34c-5p miR-187-3p miR-190b miR-184 miR-34c-3p miR-17-3p miR-342-5p miR-363-3p miR-568 miR-195-5p miR-147a miR-146a-5p miR-34b-3p miR-163 miR-145-5p miR-526b-5p miR-504-5p | (14.9) (13.5) (7.87) (4.76) (3.42) (3.20) (2.31) (2.13) (2.11) (1.88) (1.81) (1.80) (1.73) (1.72) (1.72) (1.70) (1.70) (1.66) (1.62) (1.52) (1.51) | miR-9-3p miR-125b-5p | (4.26) (1.67) | miR-375 miR-638 miR-1915-3p miR-663a miR-1246 miR-608 miR-612 miR-363-5p miR-765 miR-1290 | (4.05) (2.39) (2.43) (1.99) (1.70) (1.69) (1.68) (1.59) (1.58) (1.53) | miR-449a miR-449b-5p miR-449c-5p miR-205-5p miR-10a-5p miR-96-5p miR-182-5p miR-335-5p | (9.68) (8.30) (5.28) (2.99) (2.16) (2.00) (1.83) (1.62) |
| Decreased | Decreased | Decreased | Decreased | ||||
| miR-519a-3p miR-301b-3p miR-31-5p miR-590-5p miR-18a-5p miR-18b-5p miR-301a-3p | (0.33) (0.33) (0.34) (0.36) (0.38) (0.49) (0.49) | miR-638 | (0.47) | miR-135b-5p miR-30a-3p miR-135a-5p | (0.37) (0.43) (0.44) | miR-638 miR-612 miR-663a | (0.45) (0.45) (0.47) |
| Differential Expression of Micro-RNAs between Molecular Subtypes (Fold Change) | |||||||
|---|---|---|---|---|---|---|---|
| MMR-D | POLE-Ultra-Mutated | Copy Number High | NSMP (No Specific Molecular Profile) | ||||
| Increased | Increased | Increased | Increased | ||||
| miR-483-3p miR-885-5p miR-1915-3p miR-564 miR-196a-5p miR-16-5p | (1.34) (1.37) (1.37) (1.32) (1.29) (1.24) | miR-139-5p miR-342-3p miR-374b-5p | (1.60) (1.44) (1.36) | miR-34c-5p miR-133b miR-497-5p miR-143-3p miR-145-5p | (2.04) (1.53) (1.43) (1.43) (1.43) | miR-205-5p miR-200a-3p miR-497-5p miR-141-3p miR195-5p | (2.07) (1.51) (1.47) (1.45) (1.35) |
| Decreased | Decreased | Decreased | Decreased | ||||
| miR-142-5p miR-301a-3p | (0.73) (0.77) | miR-515-5p miR-210-3p miR-885-3p miR-612 miR-613 | (0.31) (0.49) (0.55) (0.55) (0.55) | miR-31-5p miR-31-3p miR-592 | (0.30) (0.40) (0.58) | miR-31-5p miR-592 miR-1246 | (0.34) (0.52) (0.68) |
| CTNNB1 |
|---|
| miRNAs increased |
| miR-203a-3p (1.71) |
| miR-15a-5p (1.29) |
| miR-16-5p (1.25) |
| miRNAs decreased |
| miR-499a-5p (0.47) |
| miR-184 (0.56) |
| miR-342-5p (0.58) |
| miR-135a-5p (0.58) |
Disclaimer/Publisher’s Note: The statements, opinions and data contained in all publications are solely those of the individual author(s) and contributor(s) and not of MDPI and/or the editor(s). MDPI and/or the editor(s) disclaim responsibility for any injury to people or property resulting from any ideas, methods, instructions or products referred to in the content. |
© 2023 by the authors. Licensee MDPI, Basel, Switzerland. This article is an open access article distributed under the terms and conditions of the Creative Commons Attribution (CC BY) license (https://creativecommons.org/licenses/by/4.0/).
Share and Cite
Tan, G.Z.L.; Leong, S.M.; Jin, Y.; Kuick, C.H.; Chee, J.J.K.; Low, S.Z.; Ding, L.-W.; Cheng, H.; Lim, D.; Hue, S.S.-S. MicroRNA Landscape in Endometrial Carcinomas in an Asian population: Unraveling Subtype-Specific Signatures. Cancers 2023, 15, 5260. https://0-doi-org.brum.beds.ac.uk/10.3390/cancers15215260
Tan GZL, Leong SM, Jin Y, Kuick CH, Chee JJK, Low SZ, Ding L-W, Cheng H, Lim D, Hue SS-S. MicroRNA Landscape in Endometrial Carcinomas in an Asian population: Unraveling Subtype-Specific Signatures. Cancers. 2023; 15(21):5260. https://0-doi-org.brum.beds.ac.uk/10.3390/cancers15215260
Chicago/Turabian StyleTan, Gideon Ze Lin, Sai Mun Leong, Yu Jin, Chik Hong Kuick, Jeremy Joon Keat Chee, San Zeng Low, Ling-Wen Ding, He Cheng, Diana Lim, and Susan Swee-Shan Hue. 2023. "MicroRNA Landscape in Endometrial Carcinomas in an Asian population: Unraveling Subtype-Specific Signatures" Cancers 15, no. 21: 5260. https://0-doi-org.brum.beds.ac.uk/10.3390/cancers15215260