
An Integrated Mobile Augmented Reality Digital Twin Monitoring System


1
NUS Graduate School for Integrative Sciences and Engineering, National University of Singapore, Singapore 119077, Singapore
2
Mechanical Engineering Department, National University of Singapore, 9 Engineering Drive 1, Singapore 117576, Singapore
*
Author to whom correspondence should be addressed.
Computers 2021, 10(8), 99; https://0-doi-org.brum.beds.ac.uk/10.3390/computers10080099
Submission received: 26 June 2021
/
Revised: 3 August 2021
/
Accepted: 9 August 2021
/
Published: 12 August 2021
(This article belongs to the Special Issue Advances in Augmented and Mixed Reality to the Industry 4.0)
Abstract
:The increasing digitalization and advancement in information communication technologies has greatly changed how humans interact with digital information. Nowadays, it is not sufficient to only display relevant data in production activities, as the enormous amount of data generated from smart devices can overwhelm operators without being fully utilized. Operators often require extensive knowledge of the machines in use to make informed decisions during processes such as maintenance and production. To enable novice operators to access such knowledge, it is important to reinvent the way of interacting with digitally enhanced smart devices. In this research, a mobile augmented reality remote monitoring system is proposed to help operators with low knowledge and experience level comprehend digital twin data of a device and interact with the device. It analyses both historic logs as well as real-time data through a cloud server and enriches 2D data with 3D models and animations in the 3D physical space. A cloud-based machine learning algorithm is applied to transform learned knowledge into live presentations on a mobile device for users to interact with. A scaled-down case study is conducted using a tower crane model to demonstrate the potential benefits as well as implications when the system is deployed in industrial environments. This user study verifies that the proposed solution yields consistent measurable improvements for novice users in human-device interaction that is statistically significant.
1. Introduction
Digitalization has transformed traditional physical devices into smart connected devices across all industries. Intelligent systems assembled from these smart devices are transforming home, city, and factory into smart home, smart city, and smart factory. Technologies, such as Internet of Things (IoT), machine learning, and cloud computing endow devices with communication capabilities and own intelligence. For a smart device, embedded IoT sensors collect massive amount of data that can be used for advanced analytics to extract hidden knowledge [1,2]. However, as the human computer interaction (HCI) scheme remains outdated in most circumstances, human operators can experience an increased complexity and difficulty in comprehending and interacting with the digital data. For example, in the manufacturing industry, manufacturing data from sensors and production lines is often displayed as out-of-context digital numerals on inbuilt displays or centralized terminals. This is difficult for novice users without sufficient training to understand and can hinder the overall productivity. Thus, it is important to innovate on the ways that users interact with device data to improve information visibility.
Digital twin (DT) is an emerging technology that has drawn great attention in the industry. It associates a digital entity to a physical asset to mirror or simulate physical characteristics and behaviors in real-time [3]. Inspired by the creation of DT for the manufacturing environment, it is possible to transform any smart device into a DT for virtualization. Meanwhile, augmented reality (AR) is seen as an efficient interface to enhance physical interaction by overlaying physical devices with digital information. The rapid progress in mobile devices has made it possible to achieve online tracking and recognition without the need to be tethered to a computer. In addition, the rise of internet-based cloud computing has greatly enhanced the computation power available to a mobile device that is connected to the Internet.
This research presents an integrated mobile AR DT monitoring system (ARDTMS) that can help users better visualize and interact with the data produced using smart devices. Through a personal mobile device, live data as well as executable knowledge based on DT data can be received and interacted with remotely through the same interface. Commercially available hardware and software solutions are utilized in the case study to ensure that the system is implementable for any smart device. ARDTMS is novel as the AR UI allows the users to select and visualize the types of data and simulations of the DT of the respective physical twin that they are working on, as well as operate this physical twin through controlling its virtual twin via the AR UI. In addition, ARDTMS allows ubiquitous retrieval of information of and intuition interaction with the twinned system to achieve both on-site and teleoperation of the twinned system based on analysis and simulations from the DT system. A prototype for remote monitoring of a tower crane is implemented. A user study is conducted to evaluate the performance of novice users in a fault identification task when using the proposed system in comparison with using a traditional data dashboard.
2. Related Works
Interacting with smart devices is not a new topic. Embedded interactions have been implemented as efficient ways initially [4], while the mobile-based approach becomes increasingly more popular since it can be used ubiquitously. Heun et al. [5] demonstrated a system that integrates graphical user interface and tangible user interface to program everyday objects into smarter objects with high flexibility. Mayer et al. [6] presented a model-based interface description scheme to control a smart device with a mobile phone. Yew et al. [7] designed a novel paradigm for interacting with smart objects via AR interface. Most of the current work focuses on controlling smart devices and smart objects. However, the enormous amount of data amassed creates a new challenge on HCI as it cannot be read and understood easily by novice, sometimes even experienced, users. The interaction between human and data associated with smart devices has a gap that needs to be filled.
DT is a powerful tool for extracting, analyzing, and displaying knowledge from device data. The concept of DT can be dated back to NASA’s Apollo project in the late 1960s, during which two identical space vehicles were created and the one on Earth (called ‘the twin’) could mirror the operating condition for simulating the real-time behavior of the one performing the mission. Later, the emergence of computer-aided design (CAD) tools contributed to the rise of virtual design and simulation. Advancements in computer technology has made real-time simulation a reality and the conceptual model of “a virtual, digital representation equivalent to a physical product” or a “digital twin” was introduced in 2003, which is regarded as the origin of DT [3]. Since then, DT has attracted more attention along with the development of new information technologies, such as cloud and edge computing, the IoT, big data, and artificial intelligence. It shows great potential in the field of product design, manufacturing, production management and control, etc. [8,9]. With the increasing virtualization of resources and adoption of cloud services, DT is seen as a pragmatic way for cyber–physical fusion. This creates new opportunity of enhancing the HCI with human-in-the-loop considerations [10]. However, the current research on the creation of DT has been focused primarily on technical features and lacks attention to end user experience [11].
AR on the other hand has proven successful in improving the understanding of digital information via natural interaction. AR systems have been researched and applied extensively in engineering analysis and simulation [12], as well as supporting robot control [13], assembly [14,15,16], and manufacturing applications [17]. In addition to engineering, it has good applications in medical, education, and entertainment [18]. Multiple modalities can be implemented for improving the AR experience [19]. However, the lack of suitable hardware and software usually constrains AR applications to fixed 2D screens or requires the use of intrusive markers [20]. In recent years, AR research has seen a drastic improvement due to four main developments [21]:
- The pervasiveness of low-cost visual sensors, such as smartphone cameras, created the foundation for AR consumerism.
- The availability of consumer-level AR displays based on advances in optics and mobile processors.
Even though many conceptual frameworks for DT systems have been proposed, few were implemented. This is mainly due to the challenges in high-fidelity modelling and simulation, life-cycle data integration and fusion, connection and interconnection [26]. Simulating real-time behavior on a high-fidelity virtual model is computationally costly. A few researches have been reported the integration of DT with AR [27,28,29,30]. Schroeder et al. [27] developed an AR user interface (UI) for data visualization of a DT system. Rabah et al. [28] used DT and AR for predictive maintenance. Zhu et al. [29] reported the use of AR for customizable visualization of DT data depending on the virtual objects selected. Liu et al. [30] used AR to provide real-time monitoring of the machining processes on a CNC machine to the users, with data and simulation from the DT machining system. AR has been used mainly as a visualization tool for monitoring the physical twins in these reported work. When integrating DT with AR, the rendering of visual content adds load to the computation resource. This makes it even harder to integrate AR and DT on a mobile device. To work around these technical limitations, in this research, DT data processing is offloaded to a cloud server, and only AR rendering of the computed result is performed on the mobile device. Utilizing DT data, AR can help users understand the operating conditions more efficiently. When used remotely, it can reduce cost and time of physical travel on-site for diagnosis. For a smart device that is malfunctioning, AR can provide an intuitive alternative to traditional digital numerals on the screen. Overall, the integrated system should allow ubiquitous retrieval of information and intuitive interaction with the smart devices.
3. System Framework
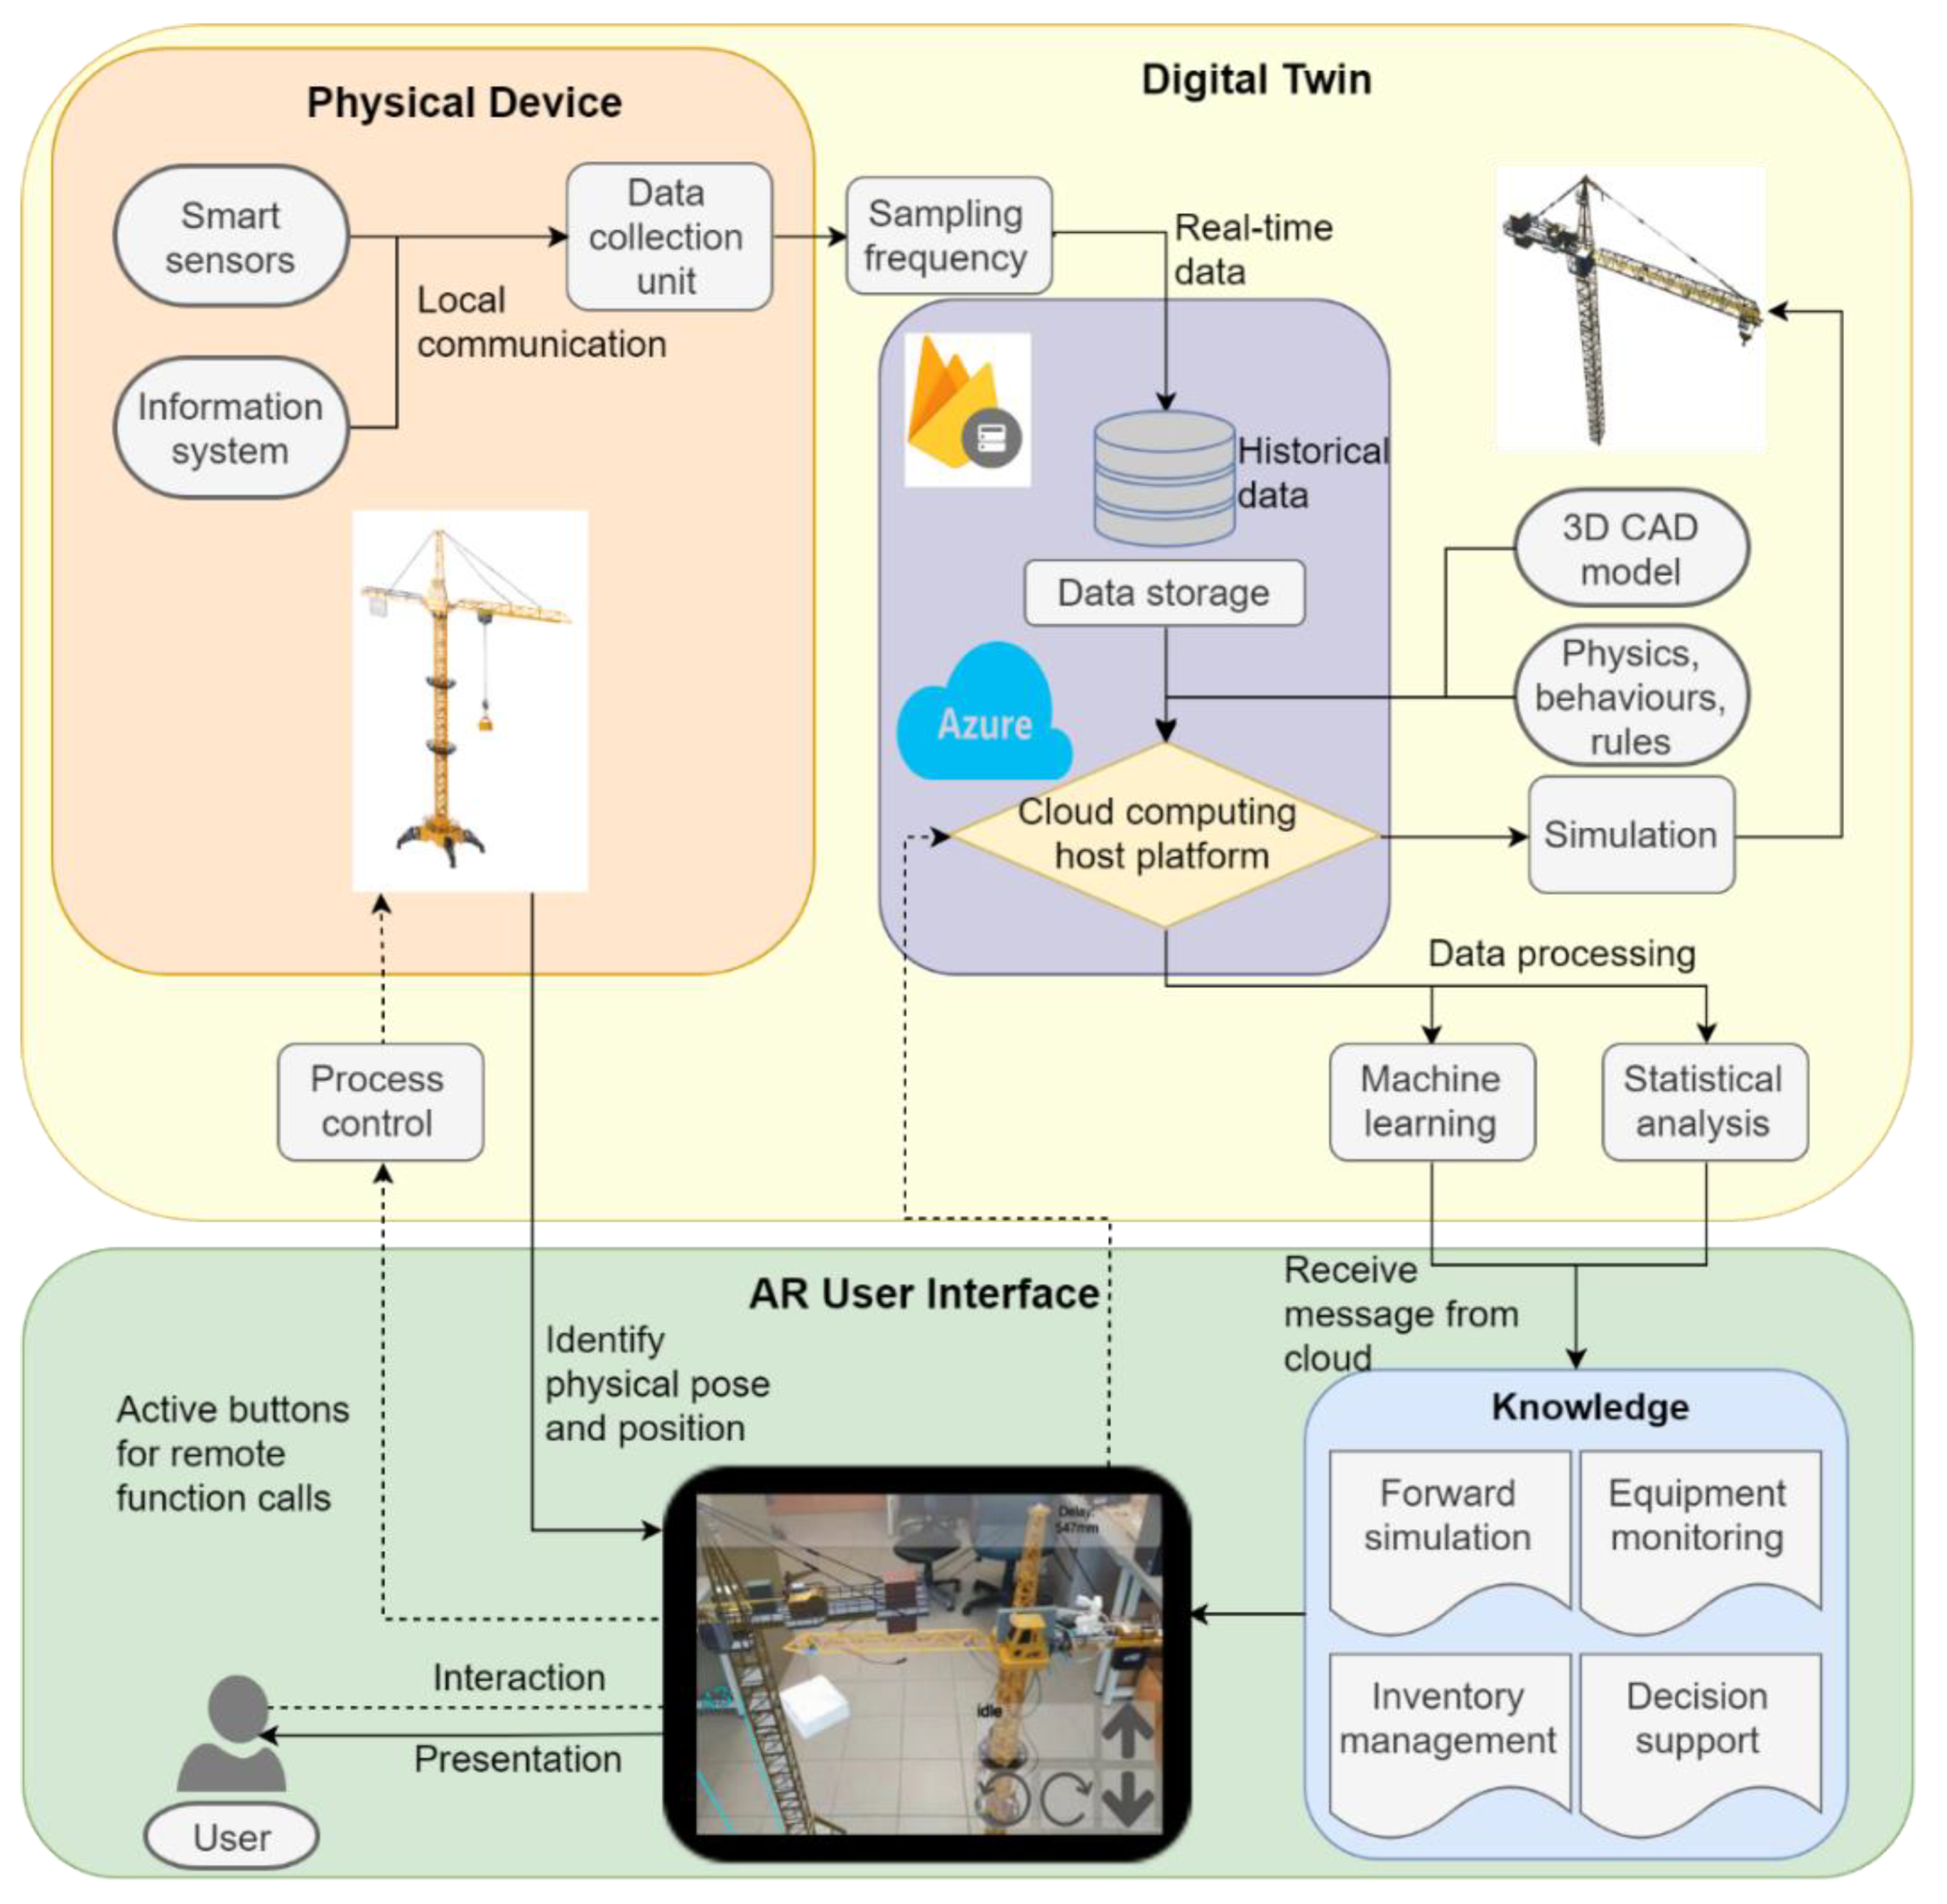
Figure 1 presents the system architecture for ARDTMS, where a user interacts with the DT through an AR user interface; the solid lines are data and information flows, and the dashed lines are interaction and visualization via the AR interface. As the programming of both DT and AR applications presumes a deep knowledge of the underlying technology, the goal of such a framework is to simplify the development of the integrated system and focus on defining the interfaces across each module. As shown in Figure 1, the DT passes the learned knowledge onto the AR device, which will present the information, and a user interacts through the same AR interface to control the physical operation and virtual simulation. The framework is formulated based on the implementation of a model tower crane case study, but it can be adapted for an industrial machine by replacing the input data, digital model, as well as the computing engines.
The physical device exists in the physical space and has embedded sensors with networking capabilities through Wi-Fi or Ethernet connection. In addition, devices generally have built-in information systems that keep record of the usage information (logs). Collecting data from both sensors and built-in information systems provides the basic infrastructure required to apply DT to the physical device.
Next, the collected data is filtered and stored in a cloud-based storage. The Firebase Real-time Database and Microsoft Azure are used in the case study to provide cloud storage and computing service, respectively. In addition to the physical data, the DT requires a CAD model reflecting the geometry, physics, and behavior of the physical device. The fidelity of the model can vary based on the level-of-details required by the use case. With data collected from the physical device, the static virtual device becomes “live” and can mirror its status in the virtual space to display the real-time changes of the equipment under monitoring. The “live” model can also help users comprehend operating conditions based on knowledge acquired from the historical data. Various computation processes can be implemented in the virtual space to integrate advanced functions, such as energy consumption analysis and inventory management. The computed results will be used for decision support and event identification that can be visualized using the AR user interface.
The AR user interface is a software application installed on a mobile device, such as a smartphone, tablet, or head-mounted display. The mobility of the device ensures that the application can aid a user ubiquitously. The learned knowledge from the DT will be presented to the user by augmenting or placing a complete digital model at the user’s current location. In the case study, the AR interface enables remote process control to help the user respond to disruptions in time. In the following sections, the method to apply the elements in the ARDTMS framework for general smart devices will be discussed in detail.
3.1. Prerequisite of the Physical Device
Data is the enabler for smart devices, and the data in a smart environment can come from different sources, including the device, human, as well as the environment. In the scope of this work, the DT data comes from the physical device itself, and is collected using wired and wireless sensors and inbuilt information system that records the operating status and the interaction with users. Some examples of useful DT data include energy usage, machine settings, temperatures, error codes or alerts, log files, etc. The data collected is divided into two categories, namely, real-time data and historical data.
3.1.1. Real-Time Data Collection
Real-time data relating to a specific device makes it possible to continuously measure, monitor, and report the current operating status. It provides the user with the ability to gain visibility of the machine, so that it is possible to assess whether an asset is operational and tracks the basic performance metrics. Remote monitoring using IoT enhances this ability even when a user is not physically located close to the machine, or the condition of the machine is not easily understood even if the user is located right next to the machine. Traditionally, the data is presented through comprehensive real-time dashboards. This information can improve equipment uptime, reduce service visits, and improve on first time fix rate.
The real-time data comes from different sources, including smart sensors communicating to a networking gateway through wired connection, such as RS485, Ethernet, as well as wireless connections, such as radio frequency identification (RFID), Bluetooth, 4G, 5G, etc. [31]. Essentially the IoT technology with different protocols allows real-time data to be passed to smart terminals, such as PCs (personal computers) and tablets easily through SDKs (software development kits) or APIs (application programming interfaces).
Modern device manufacturers have implemented the necessary tools to support the infrastructure of smart initiatives. However, users often find that the data is only accessible through the inbuilt LED (laser emitting diode) or LCD (liquid crystal display) displays, or dedicated software. The digital numerals show limited information, and the more comprehensive dashboard requires greater cognitive attention. The non-standard nature of these media can be hard to navigate and confusing for a novice user to grasp the essence of the data. By identifying user and device condition, it is envisaged that visualizing contextual real-time data with ARDTMS can reduce the cognitive load and assist the user remotely.
3.1.2. Historical Data Logging
Historical data generally refers to system features and functionalities used by end-users along with the associated metadata, such as time and data input [32]. Device information systems record and store this data in the form of data logs to understand the end-user interaction with the device. Real-time sensory data are also recorded over a longer time-stamp to enable analytics to identify operating events. The sampling frequency is usually kept low and each data type is allocated a fixed amount of storage space. Once the number of data entries exceed the limit, older data will be deleted or summarized into a single document with reduced granularity so that it can be compressed for long-term storage [33].
Historical data can be structured (digits, symbols, and tables, etc.), semi-structured (trees, graphs, etc.), and unstructured (logs, audios, videos, etc.) [34]. Currently, there are no effective ways to analyze unstructured data. Semi-structured data does not conform to strict standards. Extensible Markup Language (XML) is a typical example that contains user-defined data tags, which make them machine readable. In this work, the historical data are structured tabular data found in spreadsheets or relational databases. The data needs to be filtered to fill missing values, remove duplicates and garbage, and format data entries. This is the prerequisite that comprehensive knowledge can be derived from a large quantity of dynamic and ambiguous raw data.
3.2. Building the Virtual Device
The DT of a physical product acts as its virtual representation. The virtual model includes the geometric entities and the rules and behaviors, such as material properties and machine functions [26]. Various computation engines can be integrated in the digital space to support simulation, evaluation, and prediction.
3.2.1. Digital Model of the Device
The geometric model is the fundamental of a DT and is commonly built with CAD software, such as SolidWorks, 3D MAX, AutoCAD, CATIA, etc. The three-dimensional (3D) model defines the shape, size, position, and assembly relations of the machine components. As modern equipment manufacturers constructed the CAD model before manufacturing the equipment, the CAD model is generally available upon request by the end-users.
The fidelity of the model can be improved by adding physical properties (hardness, surface roughness, tolerance, density, etc.). This can be useful for analyzing the physical phenomena, such as deformation, cracking, and corrosion, according to the use case of the DT. A product designer may require the full knowledge of the physical properties of the material and the capabilities of the machine tool, while the end-user may only be interested in the finished product and less so about the properties of the machine. A higher fidelity will demand higher computation cost. The level of details of the digital model is also limited by the bandwidth of the wireless communication to the user interface for ARDTMS. The user should assess the most critical metrics for the application to reduce computation cost.
3.2.2. Computation Engine
Engineering simulation and big data analytics can be highly demanding on computation resource. With the emergence of cloud and edge computing, analytics and simulation on the virtual model can be offloaded to a cloud or edge server instead of being tethered to a local server. The greater storage capacity and higher computing power along with advances in fast algorithms make real-time analysis possible and accessible to more users than ever before. Finite element analysis (FEA) can be performed for variation simulation to understand bending and deformation of products [35]. Predictive analytics can be applied on greater datasets with regression and machine learning techniques, instead of deriving statistical significance from small samples conventionally [34]. Combining both real-time and historical data, the system can provide diagnostic scenarios that yield various levels of performance. By identifying fields that best explain the outcome, the system can continuously improve the predictive internal logic of the model for further optimization.
3.3. The AR User Interface
The AR user interface is a software application installed on a mobile device to ensure that the application can aid a user ubiquitously. The AR interface presents the learned knowledge from the DT to the user by augmenting or placing a complete digital model at the user’s current location. This AR interface enables remote process control to help the user respond to disruptions in time.
3.3.1. AR Interface Development
The rapid advancement in both hardware and software has enabled building AR applications on mobile and wearable devices. HMDs like Microsoft HoloLens and Vuzix provide AR experience while freeing up the hands of a user, which is favorable for maintenance and assembly operations. Smartphones or tablets, on the other hand, provide a cheaper alternative and is more comfortable to a user, and it is more conducive for prolonged monitoring and assistive tasks. Development tools, such as ARKit, ARCore, and Vuforia, are most popular due to the growing number of Android and iOS developers [36]. Although only available on iOS platform, ARKit supports marker-less plane tracking, 3D object tracking, as well as multiuser sharable experience. Its tracking capability is also more reliable due to better software-hardware calibration for the iOS devices, which are more standardized than the vast variety of Android devices. Thus, ARKit is chosen for the prototype of ARDTMS.
3.3.2. Interacting through AR Interface
The networking capability of the system allows real-time two-way interaction between a user and the device through the AR interface. On one hand, real-time data and derived knowledge from the virtual device could be presented through the AR interface as requested. Since the analysis is computed in the cloud, only outputs such as utility consumption, production statistics, and forward simulation will be presented for higher relevancy and less distraction. On the other hand, the user can input commands to control the device. As the system is implemented on a smartphone with ARKit, the system adopts a point-and-click mechanism. Virtual buttons allow for remote device controls. Live data is linked to corresponding sensor locations and the user can move the data visualization to find optimum view to observe relevant information.
ARDTMS supports the monitoring of a physical device both locally and remotely. When a user is physically located next to the device, the system overlays the virtual model of the device onto the physical device partially to highlight regions of interest or prompt assistive information. Since the user can interact with the device through the physical interface, ARDTMS mainly complements the physical functionalities through the AR interface in this situation. When the user is located remotely from the physical device, the system can mirror the current status of the physical device by augmenting the full virtual model in the user’s current physical space. This intuitive representation helps the user to interpret data as if he/she is interacting with the physical device.
4. Case Study
ARDTMS is demonstrated through the monitoring of the operating status of a scaled-down industrial prototype of a tower crane model. The implementation process helps to investigate the benefits, challenges, and limitations of the proposed system in detail. A user study is conducted to evaluate the advantages and effectiveness of the proposed system against the live data dashboard. The user study aims to verify whether the integrated system yields measurable improvement during the HCI process for users who are unfamiliar with a particular process.
One of the greatest challenges in industrial tower crane operations is to understand the wind load. In the prototype, the tower crane will operate in a laboratory environment under different simulated wind conditions. This aims to simulate the situation that a crane operator often faces. Although there are general safety guidelines based on measured wind speed from anemometers, the varying characteristics of the load, the boom, and even the site can be hard to gauge. In addition, nonlinearity exists in the system as well as the dynamics coupled in the random movement caused by gust of winds making it difficult to develop a precise model to describe the system. This makes the model-based approach, which requires structural parameters including elastic modulus, density, cross-sectional area, mass, etc., of all parts of the tower crane, difficult to achieve. Although no precise mathematical model is available, a data-driven method can help with the operation monitoring process.
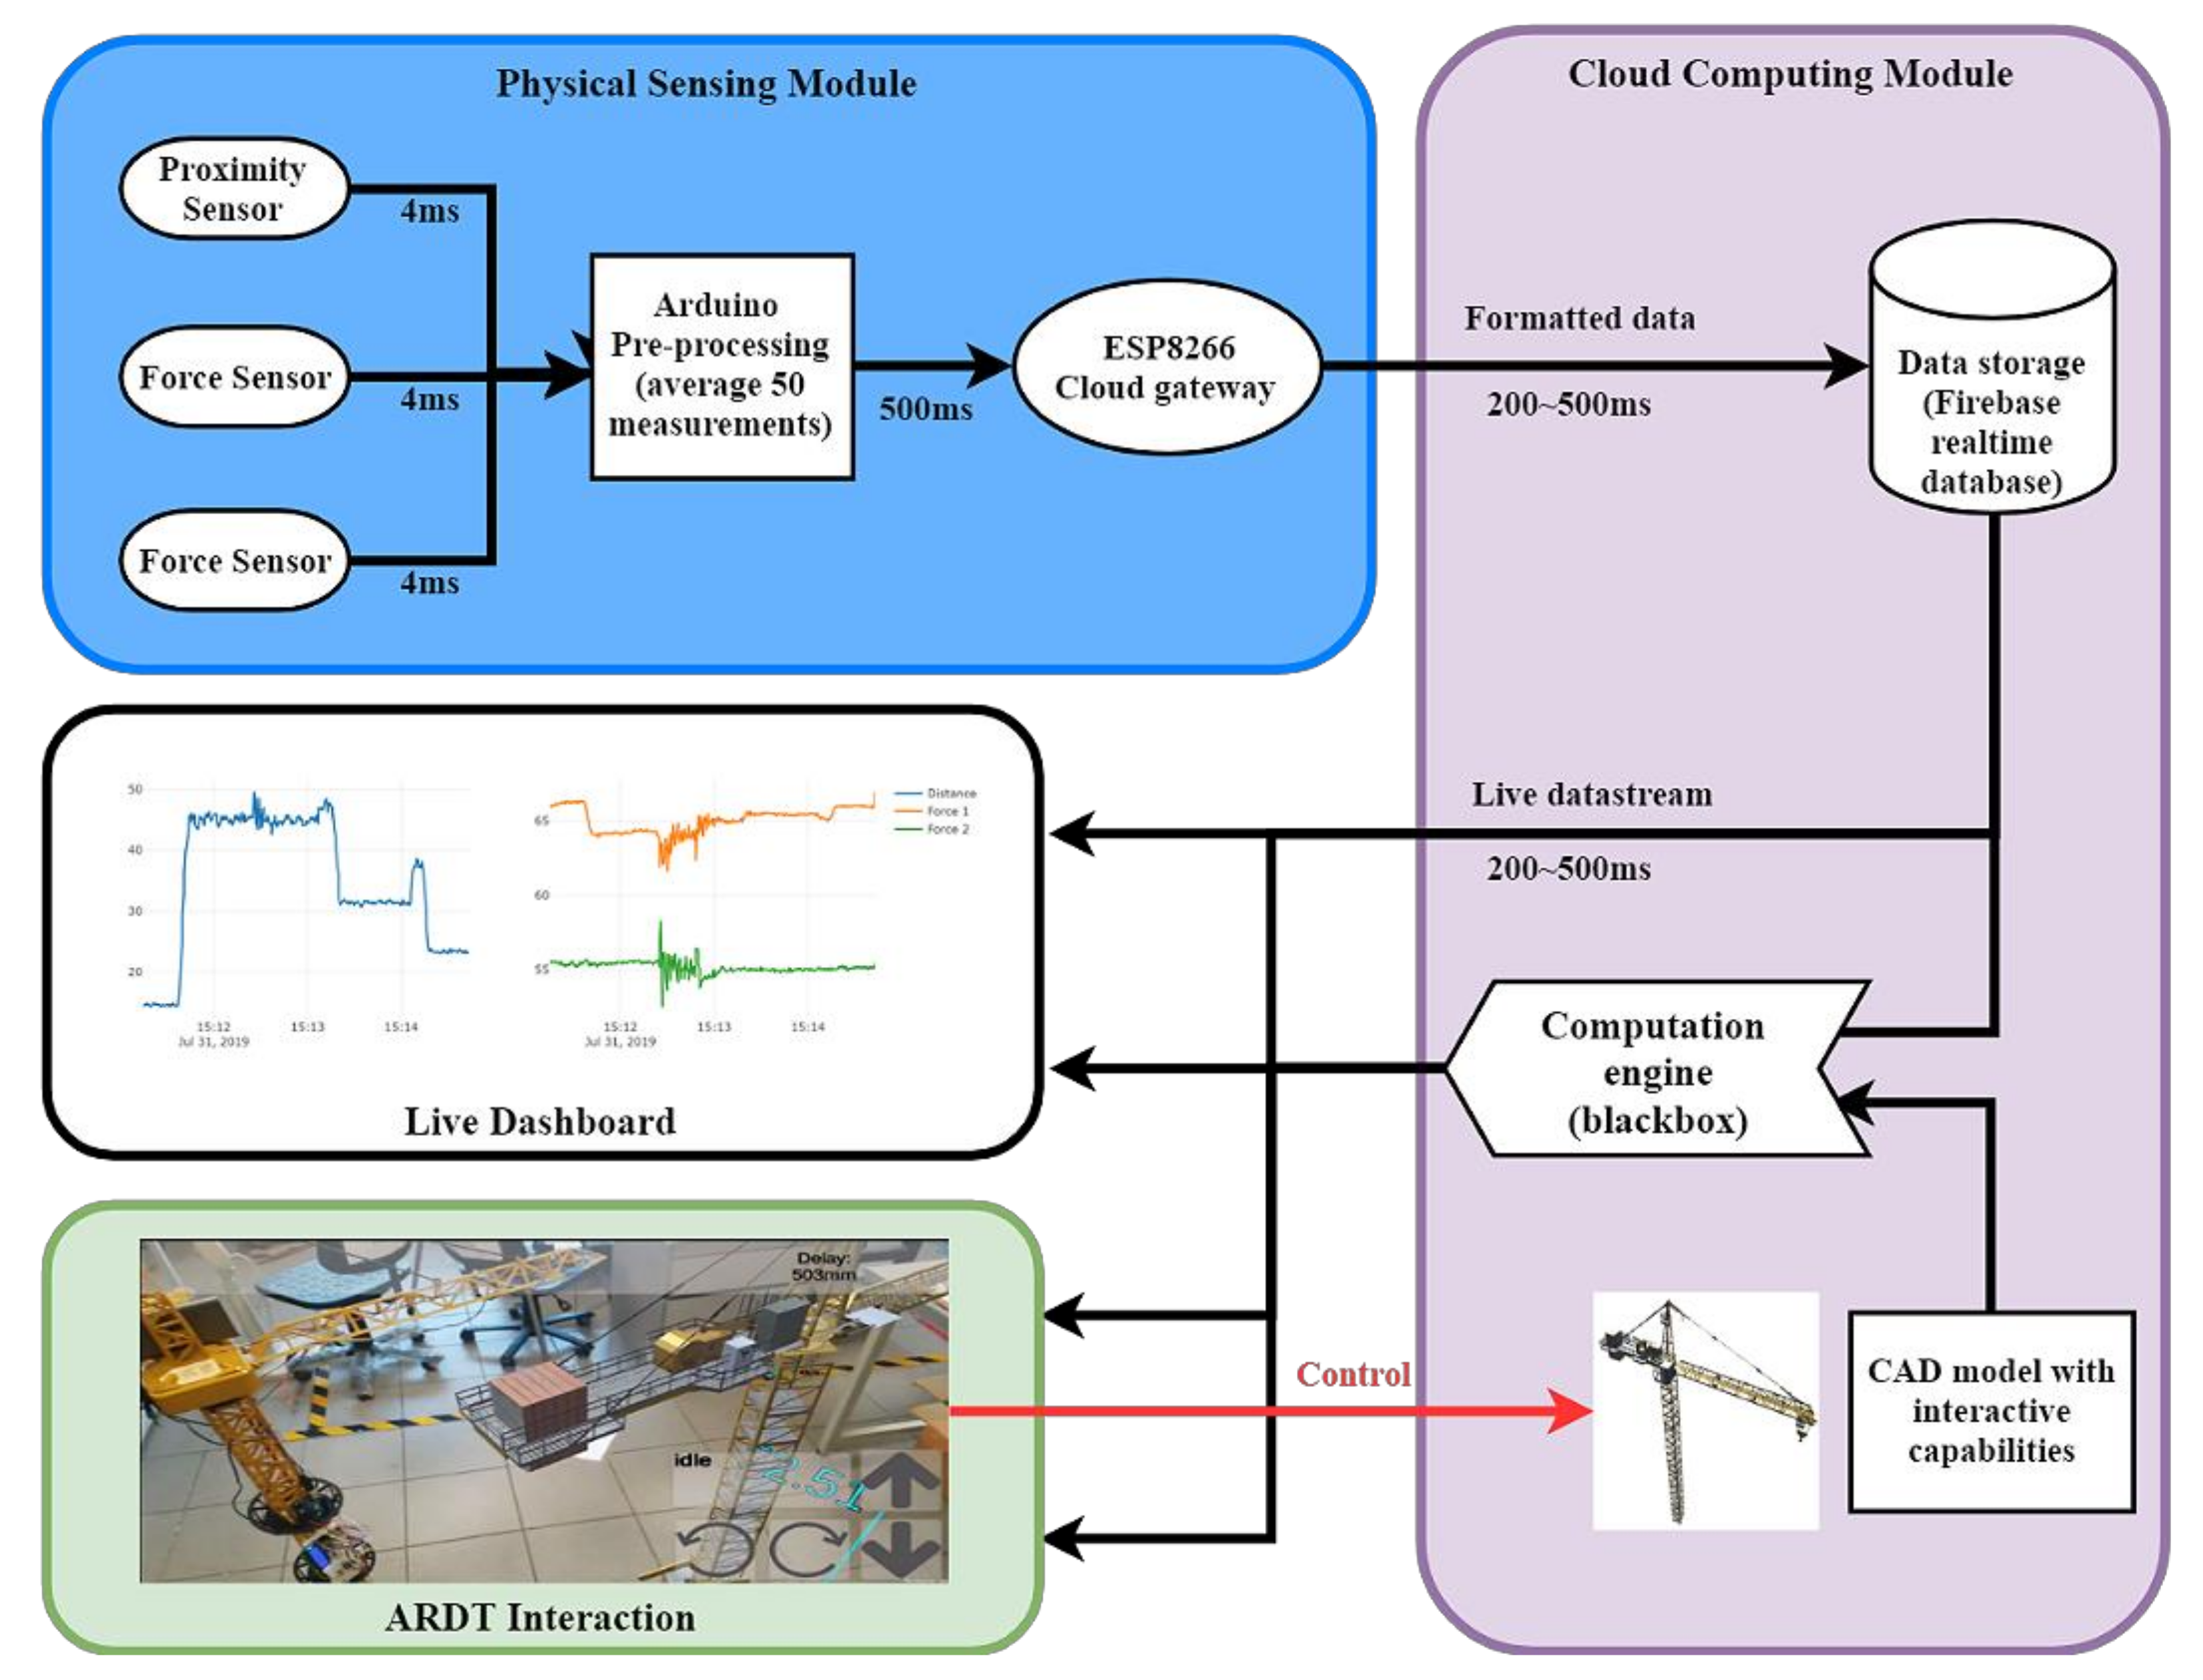
Normally, a crane operator will need to judge whether the lifting task can be proceeded or not based on his/her own experience and knowledge. Comprehensive live data dashboard is used, from which operating trends can be read to identify anomalies. However, this can be difficult for novice operators, which could result in fatal accidents. To help novice operators, this case study aims to assist operators to understand the current operating conditions and avoid dangerous operations with real-time data, and knowledge learned from historical data as well as previous operators, presented through the AR interface. Figure 2 shows the overview of the implementation of the monitoring system.
4.1. Physical Asset Hardware Setup
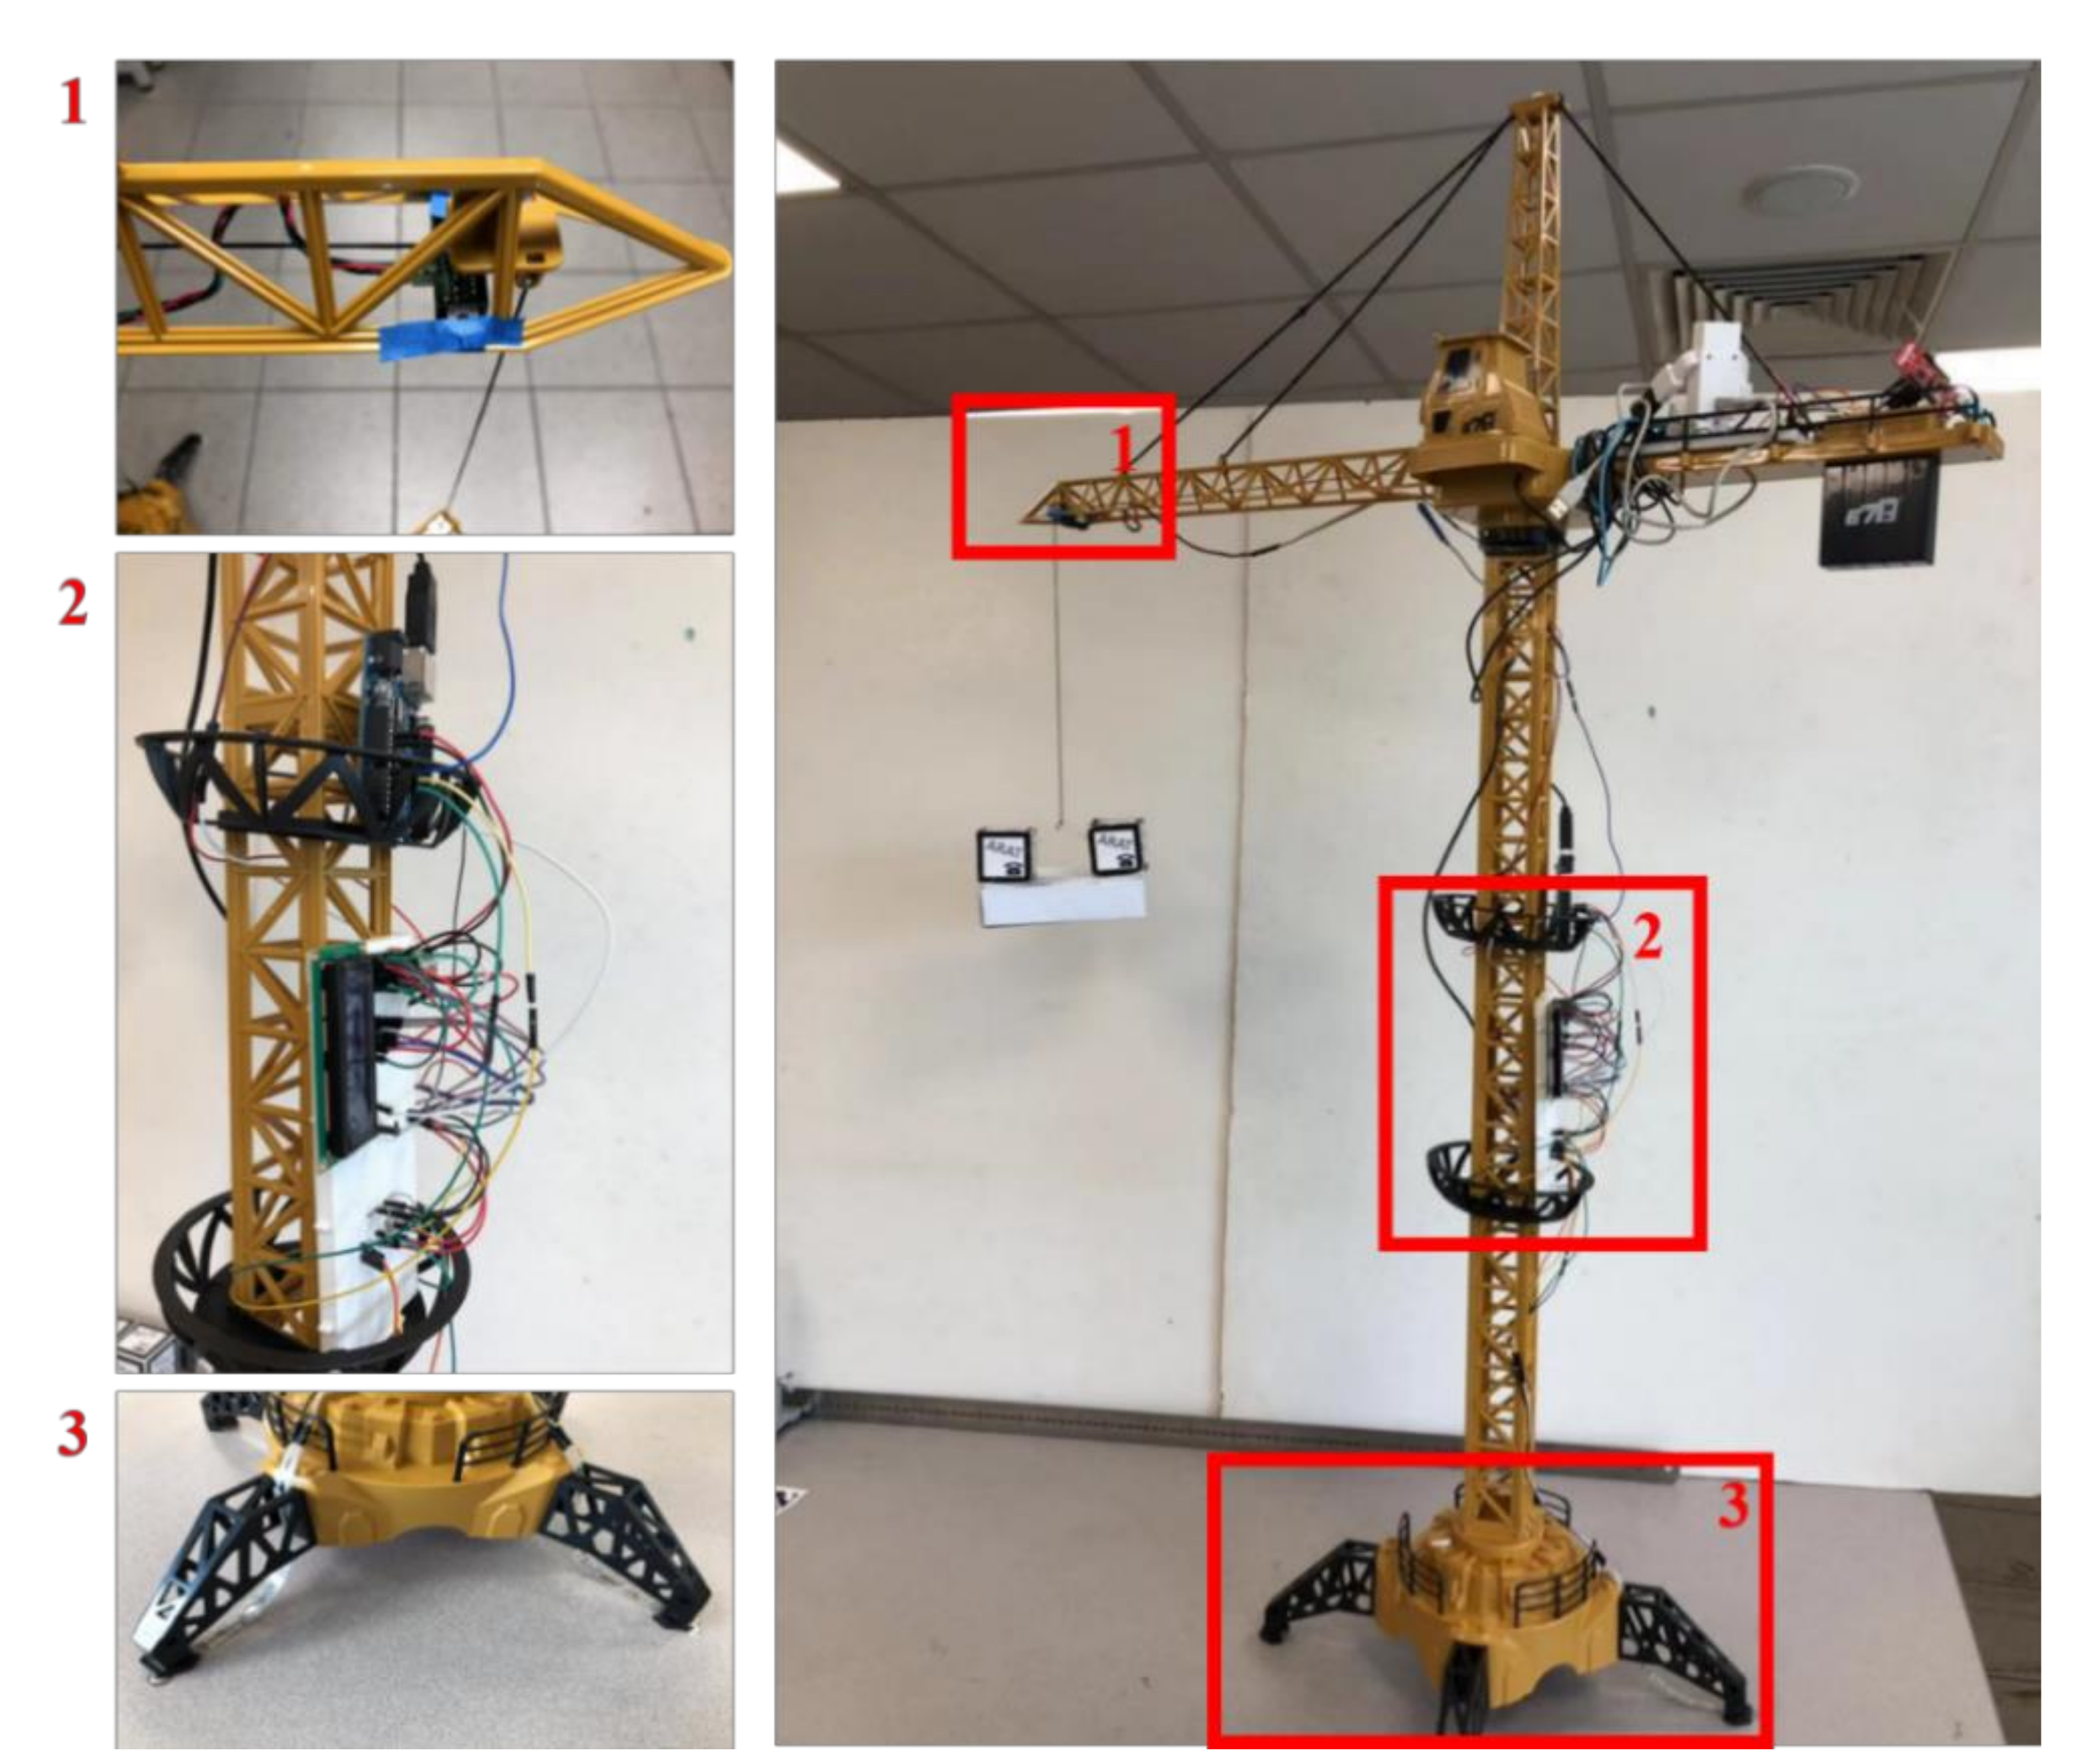
The tower crane used in prototyping the application has two inbuilt DC (direct current) motors, allowing horizontal rotation and hoisting of loads. To transform it into a smart device, it is enhanced with additional sensors as shown in Figure 3, including infrared proximity sensors attached to the end of the jib to measure the load distance, and two Flexiforce pressure sensors placed under the base to measure the pressure distribution under different conditions. An Arduino Uno connected with the ESP8266 thing development board is attached to the mast as the sensing module. For the case study, a second ESP8226 thing development board as the control module is attached to replace the wired controller in order to achieve remote and automated control of the tower crane operations. It “listens” to a control code from the cloud database to trigger reaction of the physical tower crane.
4.1.1. Data Collection Module
The proximity sensor and two load sensors are connected to an Arduino Uno analog input pin for data collection and pre-processing. The raw data is measured as voltage level between 0 to 5 volts at 250 Hz frequency. This is converted using a 10-bit analog to digital converter into integer values between 0 and 1023. Next, each sensory data is smoothed by taking the average of 50 measurements to reduce noise. Finally, the smoothed data is multiplied by a pre-determined conversion factor to calculate the measurements in distance (cm) and pressure (Pa).
4.1.2. Transmission Cloud Gateway
The Arduino sends the collected sensory data to an ESP8266 thing development board through the serial port. As measured, the serial communication takes 37 ms. For the case of monitoring of tower crane status while maintaining moderate communication bandwidth, the average measurements are programmed to be transmitted every 0.5 s. This ensures a reliable data transmission rate between the sensors and the cloud gateway. Every time an averaged measurement is taken, the cloud gateway will convert the readings into JSON (JavaScript Object Notation) format and add in the timestamp. A sample data entry has the following fields as shown in Table 1.
4.2. Cyber Space Development
The cyber space mainly handles data storage and processing. It also relays user command in the form of control code to manipulate the physical tower crane. The cloud database is tasked to notify and sync changes to any subscribed clients. The computation engine is for learning from historical data and use the learned knowledge to assist the user in comprehending real-time operating condition.
4.2.1. Syncing through Database
The ESP8266 units serving as the cloud gateway as well as the one as control module are both connected to the cloud database. Data is synced across all clients, including both the dashboard as well as ARDTMS system in real-time. This is achieved through WebSockets on both the server and the client side. It opens a two-way interactive communication session so that clients can send messages to the server and receive event-driven responses without having to poll the server for a reply. In the case study, the solution provided using the Firebase Real-time Database is implemented for hosting the sensory data and control code.
In the case of the Firebase Real-time Database, clients are connected to the database and will maintain an open bidirectional connection via WebSockets. Next, if any client pushes data to the database, it will be triggered to inform all the connected clients that it has been changed by sending them the newly saved data. In the prototype, the cloud gateway will push formatted data to the real-time database every 0.5 s. Upon receiving the update, the database will notify connected clients (live dashboard and AR devices) about the change and send them the new data. The network latency from database to client is between 200 ms to 500 ms under tested conditions (all device connected to internet via Wi-Fi). This latency can be higher or lower depending on the network condition. Overall, the live data is collected at 2 Hz frequency with a latency of around 1 s.
4.2.2. Historical Data Hosting
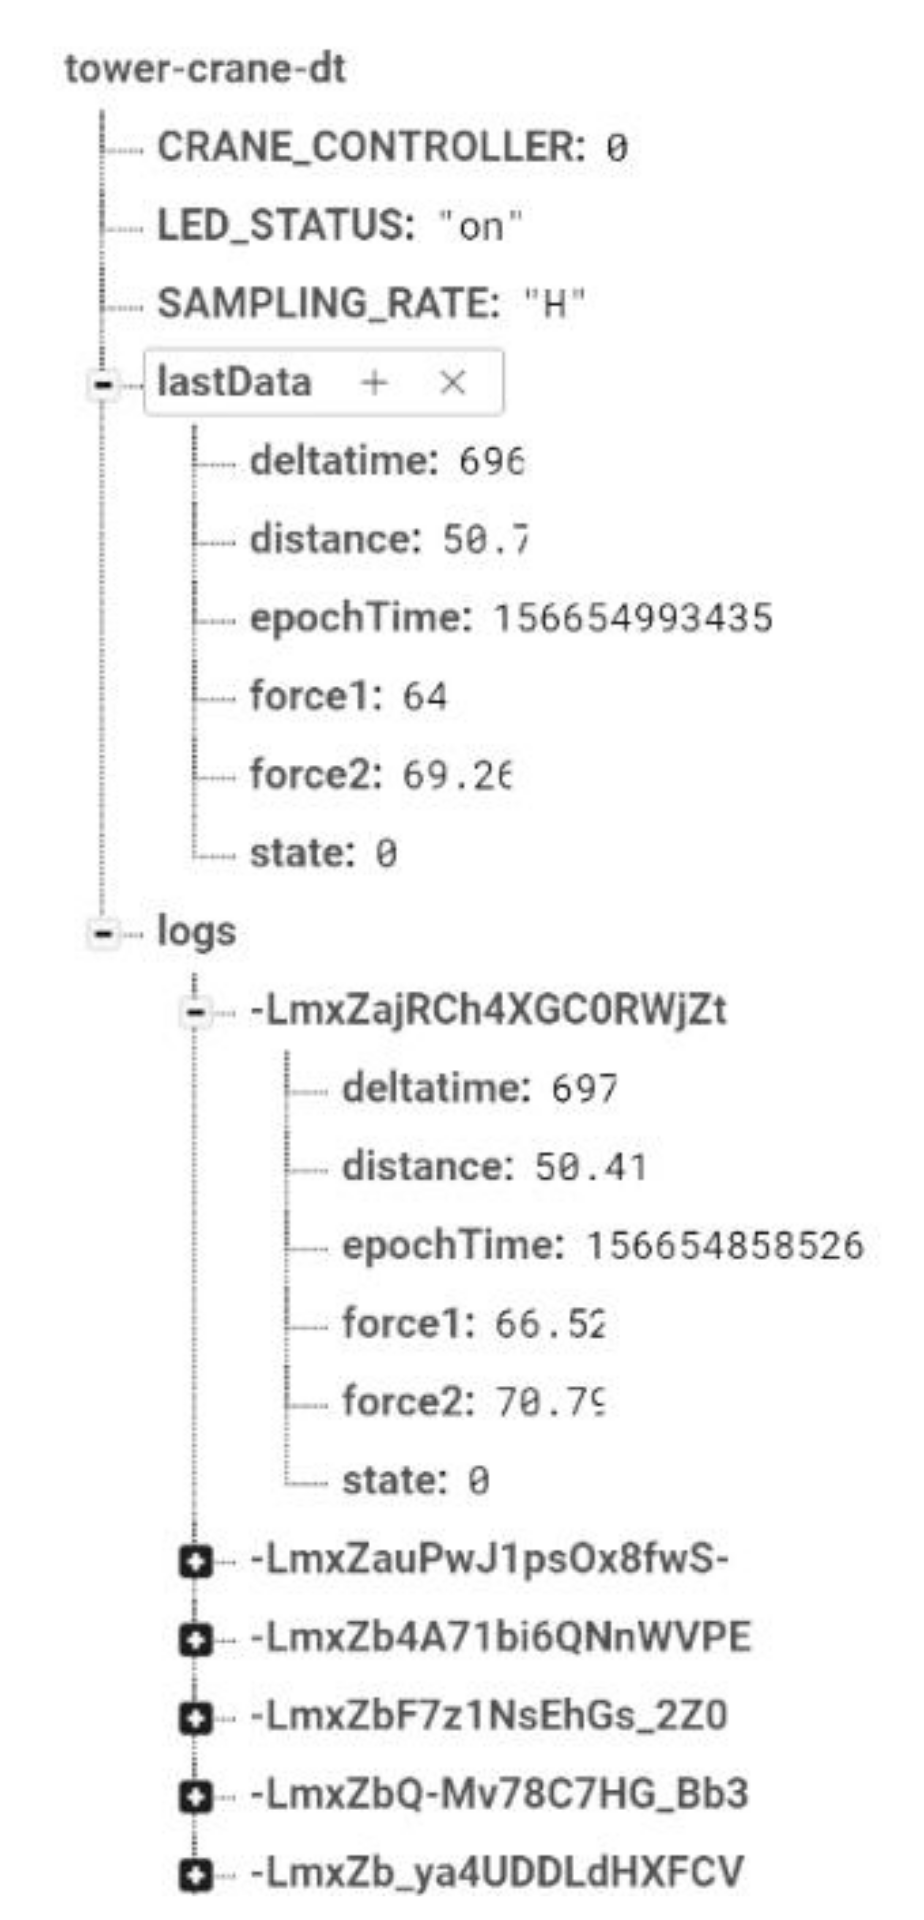
Each simulated value will be stored in the historical database to allow backward checking to understand how the issue arises and help technician drill down the analysis. The Firebase Real-time Database implements a NoSQL (Not Only Structured Query Language) database, which is non-relational. This makes it superior in frequently updating and processing high-volume, real-time data at great speed. As shown in Figure 4, there are five first level nodes for the JSON object. The CRANE_CONTROLLER is the control code, which is updated by the client and read by the physical tower crane control module. The value ranges from 0–4, representing idle, anti-clockwise rotation, clockwise rotation, lifting, and dropping motions. The LED_STATUS is a string value that represents if the sensing module is turned “on” or “off”. The SAMPLING_RATE is a debugging parameter that has two states, “H” and “L” for high and low sample rates. The high rate is 2 Hz and the low rate is 0.5 Hz, which is predefined while programming the sensing module. The “lastData” field is the most recently read data information that is immediately passed on to the clients. Note that a “state” field is added which value is taken from the CRANE_CONTROLLER. This is helpful in training the machine learning module as the sensor data have distinct characteristics over different operating states. A new entry is added at the same time the “lastData” is updated to the “logs”, which contains all the historical data that has been recorded. A unique ID (random string) is automatically added in Firebase for efficient data retrieval.
4.2.3. Building Computation Engine
Based on initial observations, the external wind condition will cause irregular fluctuations in the sensory data time series. Although a direct relationship between the load, the wind, and the operating state is difficult to obtain, a machine learning-based classification engine can make use of the historical knowledge in a more efficient way. The learning and testing are based on data in the idle state since the operation should not be started if the idle state is already in a dangerous condition.
First, the raw sensory data is preprocessed by grouping all values between every five seconds (9–10 data entries due to networking latency). A rolling standard deviation is calculated for each sensor data to construct new features for machine learning. The latest time-stamp is used as the only time-stamp for the new congregated data. The state with the highest number of counts is chosen as the congregated state. The “deltatime” is neglected as it does not contribute to the learning engine. After the preprocessing, the training data has 301 rows of data operating at the healthy state.
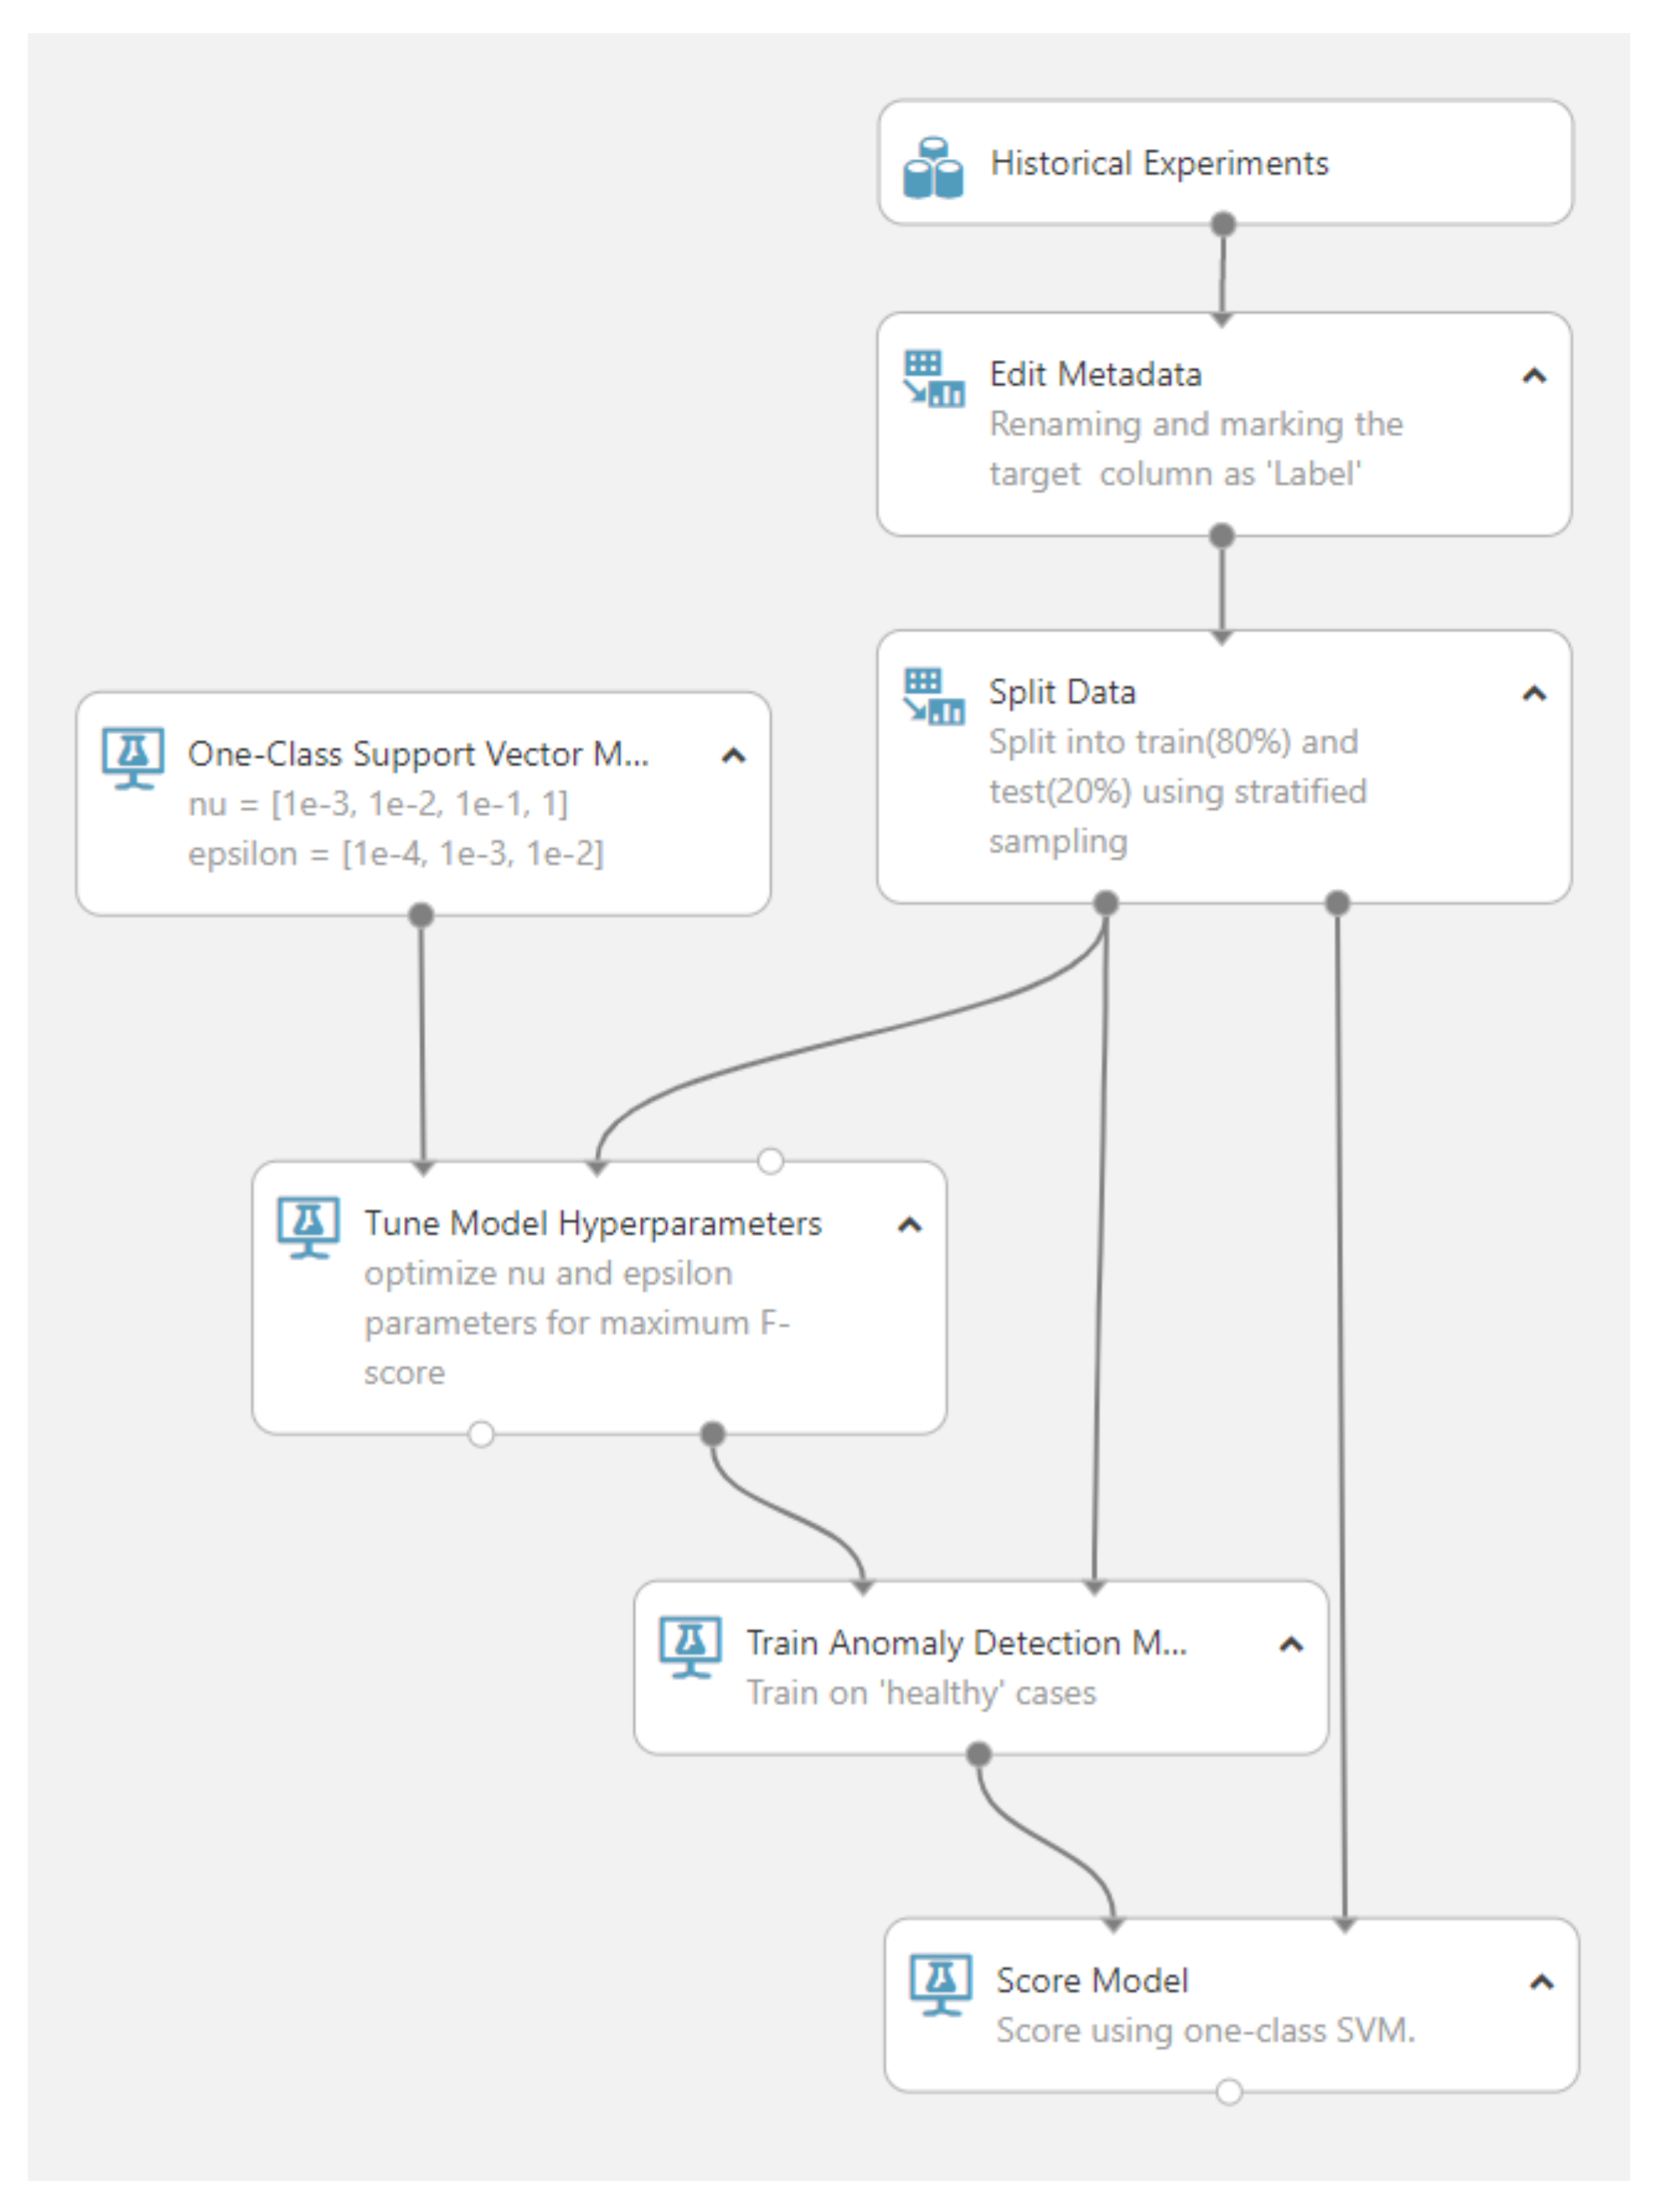
Next, a similarity-based one-class classification approach is implemented in this study [37]. Training historical data consists of 301 rows of filtered data from the three sensors. The tower crane was operated without any external wind load to generate historical data. The historical data is fed into a One-Class Support Vector Machine model for anomaly detection. The model infers the properties of normal cases and predicts if the new input is unlike the normal examples. It uses a radial basis kernel and has two parameters, namely η and ε. η corresponds to the nu-property that represents the upper bound on the fraction of outliers. ε defines the stopping tolerance, which leads the trainer to stop iteration when the value is exceeded. A Tune Model Hyperparameters module is then connected to sweep the parameters to find the optimal setting. The solution reaches optima when η = 0.1 and ε = 0.01.
Figure 5 shows the implementation of the computation black box. The data-driven approach provides a probabilistic estimation of the fault condition rather than a deterministic result. In fact, the lack of validation dataset makes it difficult to assess the precision as the model may cause false negatives. In addition, the model should be refined continuously with new additional data from real life use cases for better accuracy. Nevertheless, the computation engine serves as an illustration tool to showcase the use of the proposed system. It outputs a confidence score between 0 and 1, which can be regarded as the operating risk.
4.3. User Interaction
The AR visualization is one of the main contributions of the proposed system; the AR user interface provides visualization of the analyzed data and states directly on a physical twin. As compared with commonly used live data dashboards, AR visualization of device data is more intuitive and effective in assisting novice users. This section will demonstrate how the integrated system can be used to assist the human–device interaction (HDI) during a remote monitoring scenario. A live data dashboard is also developed as a benchmark in the user study to evaluate the performance of the proposed system so as to determine whether ARDTMS is superior to the live data dashboard.
4.3.1. Dashboard View
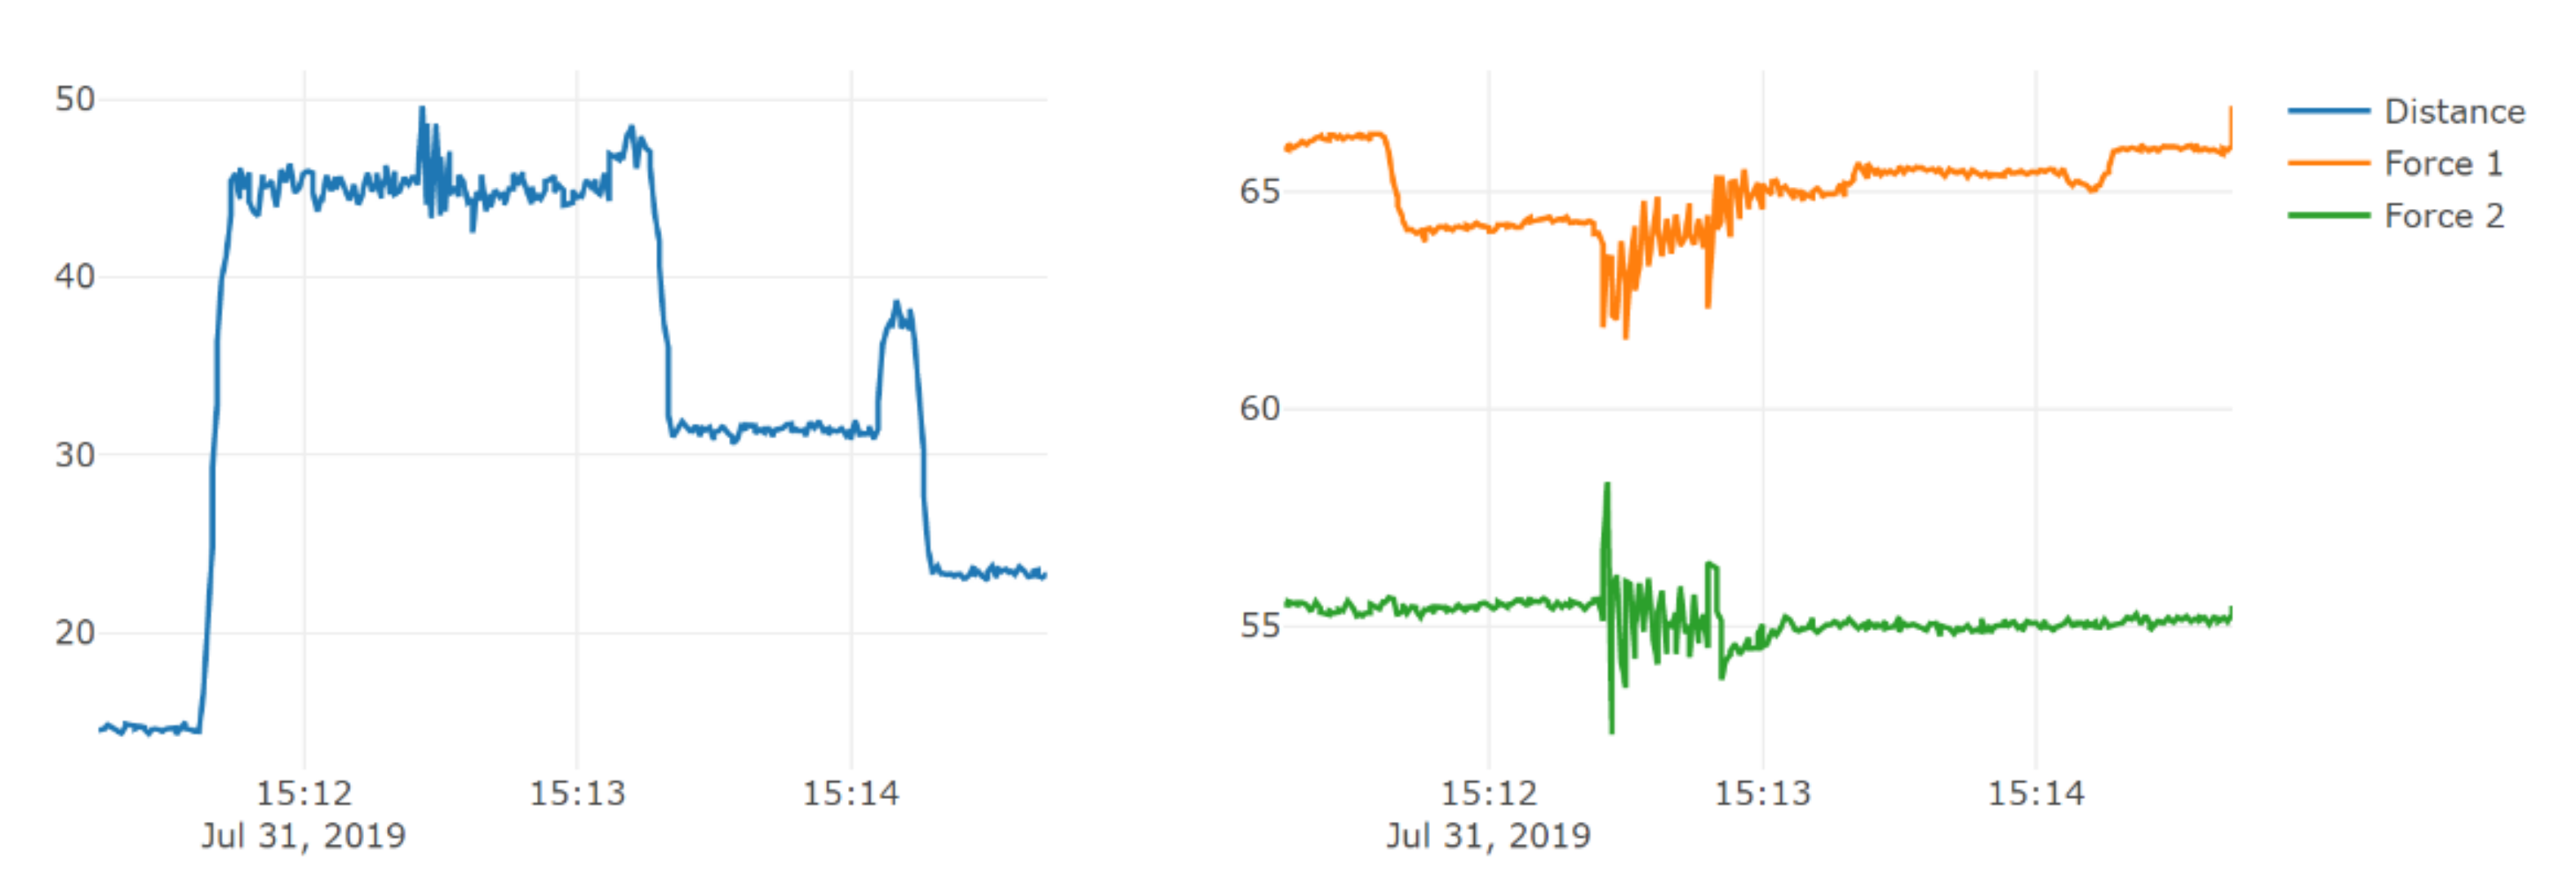
The live data dashboard is a web-based application that plots the historical data in the last 3 min, as shown in Figure 6. It can be accessed from multiple devices simultaneously. The blue line on the left is the reading from the proximity sensor. The orange and green lines are plotted in the same graph to show the comparison of the two pressure sensors. The lifting and dropping operations can be read from the distance graph. Some disturbances can be seen between 15:12 and 15:13. A level drop of Force1 can also be observed immediately after 15:14. An expert may try to assess the operating condition from the live data graph. However, it is difficult for users with no experience to determine whether the fluctuation is abnormal or not.
4.3.2. Mobile AR Client
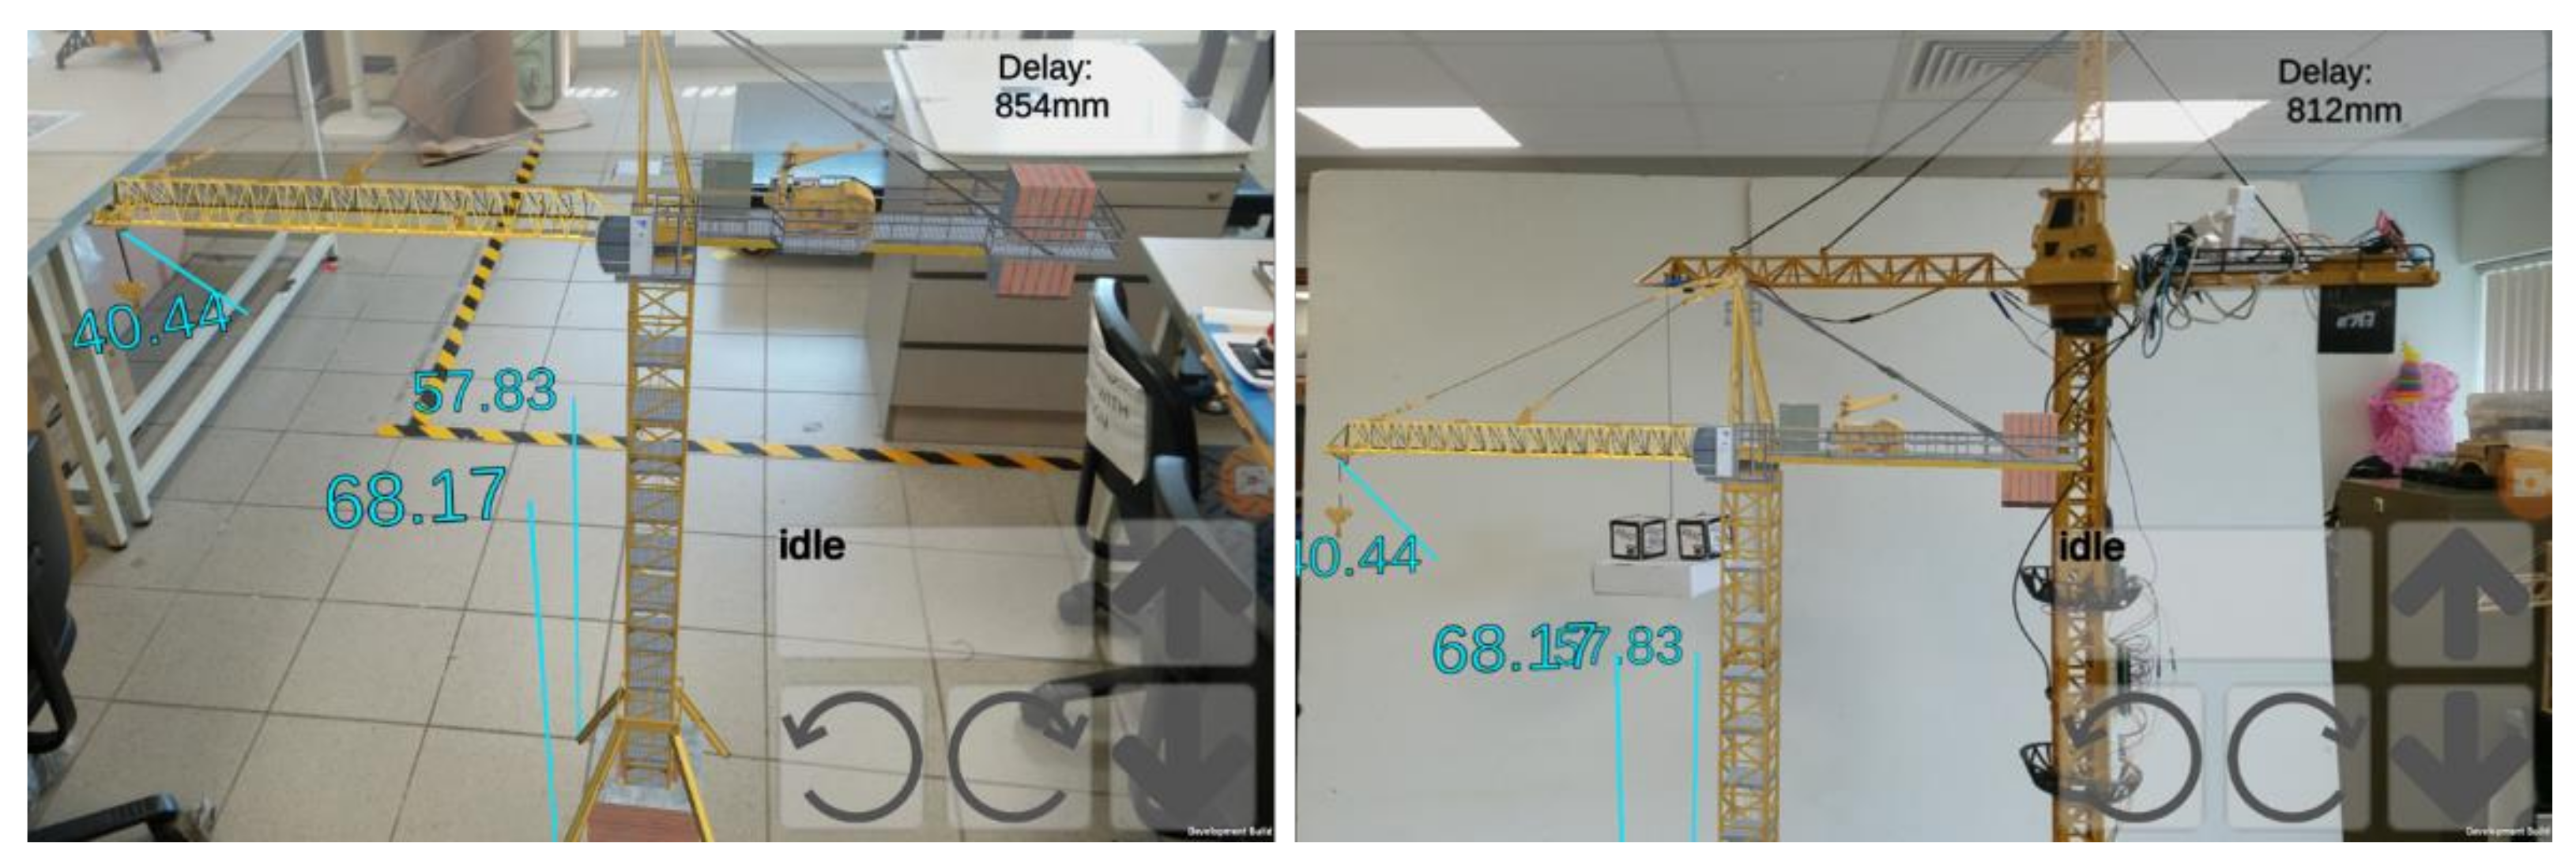
The UI of the mobile client is shown in Figure 7. Since the system has to maintain continuous networking connection to retrieve live data, the UI design follows the principle to minimize active elements to reduce loading of the mobile client, which has limited computing and battery resource. The top right corner displays the current latency of passing sensory data from the cloud gateway to the client device. At bottom right corner, there are four buttons that allow for the remote control of the physical tower crane, and a panel indicates the current operating mode. In the main view, the DT model can rotate and move the hook as the physical device does. The rotating and hoisting speed are calibrated to be the same as that of the physical tower crane. The sensor node annotations are added to indicate the readings with links to the embedded positions. They are linked to the database URL (Uniform Resource Locator) where real-time data is updated constantly.
Using the proposed system, when the user is in a remote location, he/she can access the DT model in his/her current environment to help diagnose remotely before on-site action is taken. When the computation engine receives a set of sensor readings that produces a risk score higher than 50%, a warning alert is sent to the technician’s personal device. The risk level is shown through the UI panel, and the system continues to process the incoming data. If the risk increases and exceeds 70%, the system determines that the condition is dangerous and will suspend all control functions to prevent any potential damage.
5. User Study
A user study was conducted to validate whether the integrated system yields measurable improvement during the human–device interaction process for users that are unfamiliar with a particular process. This is achieved through a qualitative and quantitative evaluation of the advantages and effectiveness when providing assistance to the users through the proposed system against the traditional live data dashboard. In the current procedure, a remote operator would monitor the tower crane operation via the variation of data displayed in the live data dashboard. However, it is difficult for a novice user without extensive knowledge on the tower crane operation to identify anomaly by looking at the data. To eliminate this difficulty, ARDTMS takes over the data comprehension based on the historical knowledge. A total of 20 students from mechanical and civil engineering disciplines are invited to participate in the study. They are divided evenly into the control group (A) and the experimental group (B). Each individual from the control group is paired with another from the experimental group. The former will monitor through the live data dashboard while the latter will monitor through the AR interface simultaneously. A disruptive event will be introduced during the monitoring process and the users are expected to respond to the event.
The following hypotheses are made prior to conducting the study:
- Users using ARDTMS will respond faster to events as compared to users using the live data dashboard users as they have assistance from a holistic and single view that focuses on user attention;
- Users using ARDTMS will perform more consistently at a similar level than users using the live data dashboard as they are assisted by intuitive AR stimuli;
- The ARDTMS system can reduce user errors as the historical knowledge that is taken into account to provide AR assistance is more reliable than the primitive personal judgement.
5.1. Experiment Design
The user study is conducted through a pre-test and post-test evaluation of usability measures rated by the users, and performance measure recorded by the researcher [38]. As shown in the appendix, before the test, all participants were asked to rate their knowledge of the tower crane and its operation. Their own subject rating is complemented with objective assessment by asking them to fill in the name of the main parts of the tower crane. This is to verify that all participants are novice users with similar expertise level. Next, they were briefed on the UI of respective monitoring systems. Without training, the two users, one each from the control group and the experimental group, will start monitor the data stream on their own at a remote location without direct view of the physical tower crane. They were asked to signal once they observe any anomaly. Meanwhile, a swinging standing fan is turned on to generate wind towards the tower crane. The response time of each participant is recorded as the key benchmark for evaluation. In the post-test session, the participants are first asked to describe the anomaly that is observed during the experiment. The correctness of their answers is used to as supplementary measures to assess the effectiveness of the system. Next, they filled up a questionnaire including a set of five-point Likert questions. This aims to provide a qualitative feedback on each system in terms of its mobility of interactive medium, intuitiveness of the UI, efficiency of interaction, and overall satisfaction. In the end, the questionnaire requires the user to provide comments and suggestions on the respective systems.
5.2. Sample Selection
As the user study aims to evaluate a novice user learning process, participants should have basic awareness of the use case, but not the expert level experience. The selected participants are university students with mechanical or civil engineering background. All the participants have basic understanding of the tower crane structure but have no hands-on experience or in-depth understanding of tower crane operations. This is evaluated in the pre-test questionnaires to make sure the participants are indeed novice users.
The sample size of 20 students (10 paired groups) is determined through an iterative process [39]. The null hypothesis for the quantitative performance test is that the true mean difference of a user’s response time to critical event when using the proposed system comparing with using traditional dashboard is zero. For this paired t-test, a confidence level of 95% is targeted. The test began with five test groups based on the five-user assumption, which assumes that five participants suffice for usability testing, and will increase by five groups until p-value is below 0.001 to show statistical significance, or the null hypothesis is proven true [40]. Extreme outliers will be treated separately so that the sample data for calculation will follow an approximate normal distribution [39].
5.3. Usability Measures
The common usability measures in HDI research include effectiveness, efficiency, and satisfaction [38]. In this study, the recorded response time provides objective assessment of the effectiveness aspect of the usability, while the efficiency and satisfaction measures are assessed subjectively based on user ratings. In addition, the users were asked to rate the mobility and intuitiveness of the systems as these two measures are targeted in the system design. The subjective rating is scored between 1–5, where 5 means “most positive” and 1 means “most negative”. The mean value of the ratings is used to compare each aspect of the proposed solution to the traditional dashboard.
5.4. Result Discussion
The pre-test questions show that all participants have minimum knowledge of the tower crane (none or beginner). The ratings and response time are summarized in Table 2. In the first five groups, the response time for group 5A is an invalid extreme value, thus the user study is continued with an additional five user groups.
5.4.1. Response Time Evaluation
The goal of response time evaluation is to determine which monitoring system allows users to react better and quicker to abnormal operating conditions. By measuring the response time, the evaluation aims to validate experimentally that the ARDTMS system produces a faster reaction time that is statistically significant through a paired t-test.
In the response time test, almost all participants using ARDTMS (B) outperformed the users who used the live data dashboard (A), except for one live data dashboard user in group 9, who responded immediately at first sight of a signal level change. The response time data for this user is marked as an outlier and excluded in the following statistics since this user reacted based on a wrong criterion. In addition, three live data dashboard users did not report any anomaly as they perceived the disturbance as “is not significant”. They are excluded so that a meaningful average improvement in response time can be analyzed in a paired t-test.
In all other groups, the response of the users of ARDTMS to the anomaly is 38.8% faster on average. The mean absolute improvement in response time is d = 3.1 s with a standard deviation (SD) of s_d = 1.03. Using paired t-test, t(5) = 7.4, p = 0.0004. These data show that there is a significant statistical difference between the response time of users these two interfaces despite the small sample size. Thus, it is sufficient to prove that the ARDTMS system yields benefits in improving the user response time to abnormal operating conditions for the novice users. It is worth noting that although groups 5, 6, and 7 are not included in the quantitative evaluation, the reaction time from these users proves the hypothesis that the users of ARDTMS systems react quicker to anomaly as the live data dashboard users do not react at all.
In addition to a shorter reaction time, the ARDTMS users have a lower variation in the response time (SD = 0.77 s) comparing to the dashboard users (SD = 1.14 s). This is because for the dashboard users, they can have vastly different individual opinions regarding the definition of anomaly when observing the live data plot. As for the ARDTMS users, the system uses historical data to compute and trigger the alert to notify users. The cognitive process of identifying anomaly is offloaded to the computation engine. As a result, ARDTMS monitoring yields a more consistent improvement regardless of the individual differences among the users.
5.4.2. Error Analysis
Novice users are more prone to errors due to lack of experience. The empirical user study is designed to be an identification task, and the aim is to determine the correctness of the users’ interpretation of the operating conditions. Errors in this experiment are defined as instances when a user reports an anomaly before the disturbance is introduced (group 9A) or does not react long after the disturbance has been introduced (groups 5A, 6A, and 7A). For group 9A, this is caused by overreaction to incorrect stimuli. In industrial scenario such as on the manufacturing shop floor, overreaction from operators can lead to unwanted increase of downtime and reduction in productivity. For the rest of the error cases, the novice users’ non-reaction indicates the inability to identify stimuli that relate to the anomaly. In industrial production scenario, this can result in hazardous conditions to both the equipment and operators.
There are more error cases in the dashboard group. Despite the limited sample size, 4 out of 10 user errors are observed, including both over-reaction and non-reaction. On the other hand, all ARDTMS users are able to respond when anomaly occurs. Since the AR alert is sufficiently intuitive to draw immediate attention from the users, the accuracy of user reaction is a direct reflection of the computation model accuracy, which is trained and can be improved continuously with historical data. The users should be aware that the computation backend is a built with a statistical model. In case of anomaly identification, generally the threshold should be lowered to increase recall and minimize false negatives because an actual fault can result in severe damage to production activities, while the interruption by false positive cases is more recoverable. Ideally, the model should capture all error cases with as little false positive cases as possible.
5.4.3. Qualitative Ratings Analysis
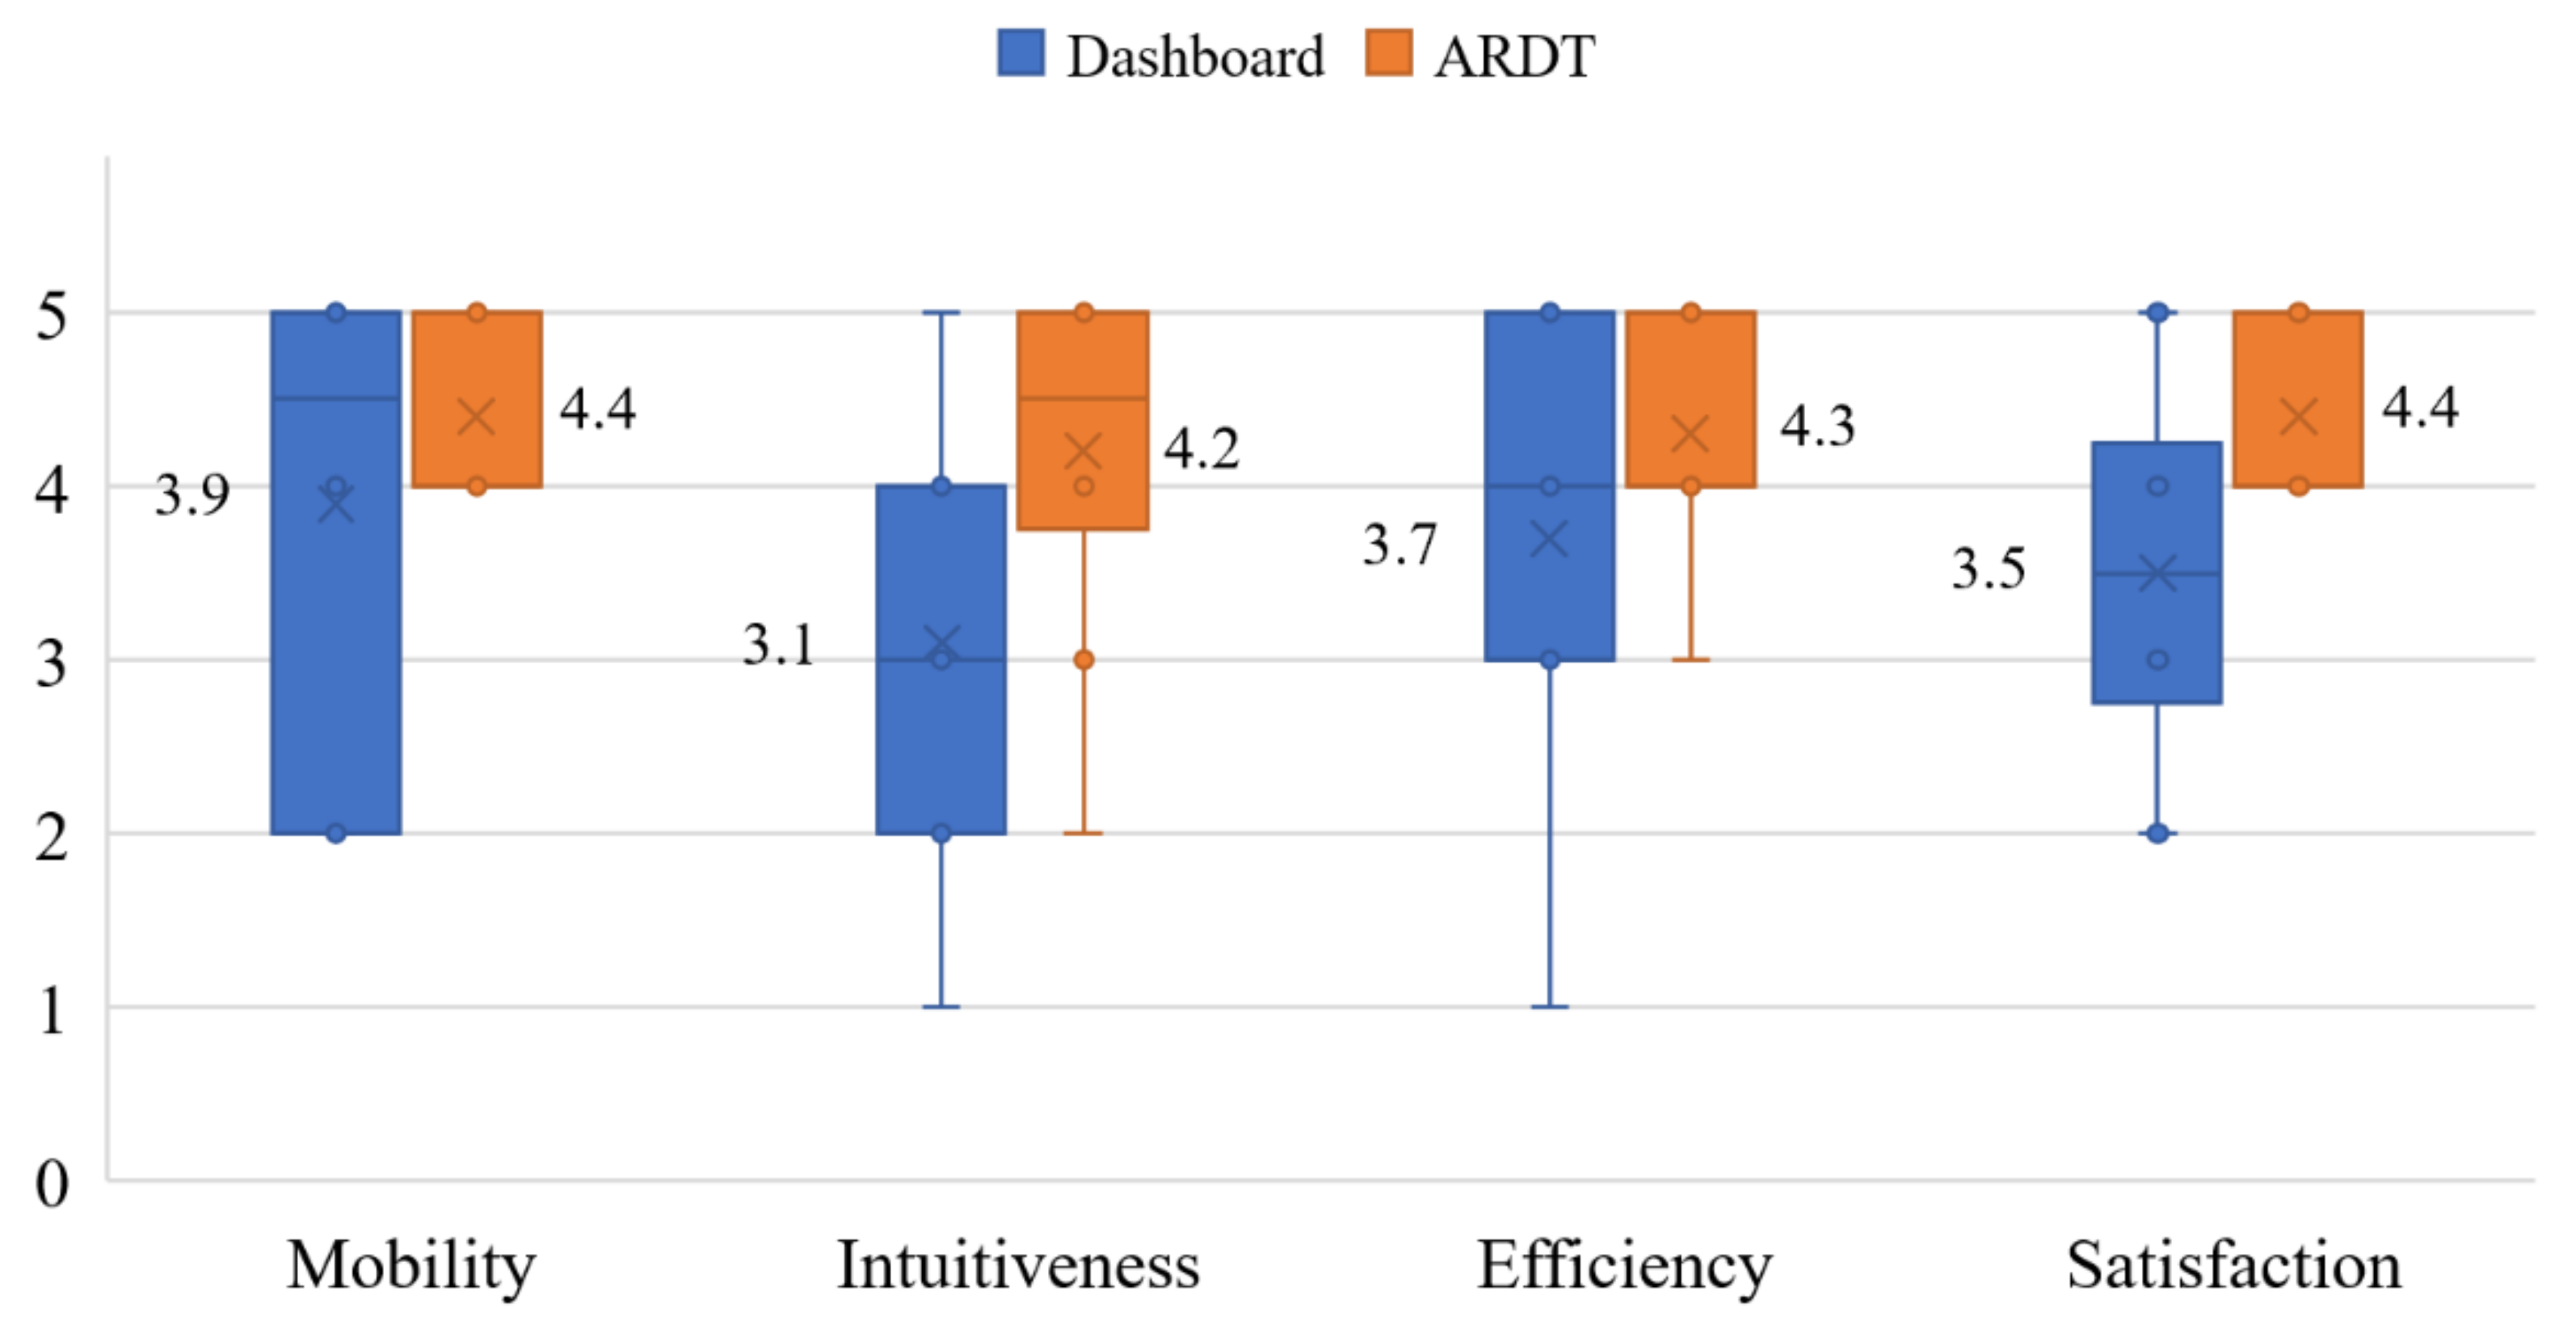
The qualitative Likert ratings was conducted for the users to evaluate their experience with the monitoring systems. Positive feedback has been observed as the ARDTMS users have a higher rating in the qualitative test than the dashboard users, as shown in Figure 8. Additionally, the interquartile range of the ratings is smaller for the ARDTMS group, showing that novice users are generally very receptive to this monitoring approach. Regardless of the individual differences between users, ARDTMS users tend to give ratings at a similar level because their experiences when using the system is similar. This shows that ARDTMS has an equalization effect on not only the user performance in terms of smaller variation in response time, but also the user experience among different users consistently. It proves that the ARDTMS can bring more novice users to an acceptable performance, thus it is more generalizable than dashboard monitoring among novice users.
The following agree-disagree questions required the users to provide opinions on their own performance during the anomaly detection. First, all ARDTMS users strongly agreed or agreed that the system can help them understand the operating condition without expert help, while only 60% of the dashboard users are similarly confident. This is aligned with users’ quantitative ratings result. Next, three users agreed and four strongly agreed that the ARDTMS system provides just enough information. As for the dashboard users, the numbers are 6 and 1 for agreed and strongly agreed, respectively. This is because UI of ARDTMS was carefully designed with minimum assistive content due to limited computation and battery resource on the mobile device. On the other hand, the dashboard plots the live data continuously and requires a user’s constant attention. In prolonged usage, this can result in fatigue and loss of focus, while 3D AR visualization can engage users better as compared with numerals and abstract illustrations.
Lastly, the ARDTMS users were asked to rate the remote control function via the mobile interface using the same four dimensions. Through ARDTMS, users were able to control the tower crane operation in real-time from their mobile device; they could also view the motion through the AR model, which fully reflects the operation of the physical tower crane. The ratings show positive scores (above 3) in all aspects, including mobility, intuitiveness, mobility, and satisfaction for the remote control function. This is because the immersive visualization provides immediate feedback that can help users take appropriate actions based on the monitoring result.
5.4.4. User Comments and Suggestions
The user survey concluded with open-ended comments and suggestions. In the comments and suggestions, three dashboard users believed that the dashboard was not intuitive and lacks reference for dangerous operating conditions. The lack of reference for dangerous operating conditions is because there is no definitive simulation approach nor single level of reference that can be used to determine anomaly. This shows that some novice users have difficulty in understanding the dashboard monitoring system and would take significant cognitive load during the anomaly identification task.
Two ARDTMS users commented that the control function was not smooth due to network delay. This is caused by the communication to the cloud services as well as the processing speed of the Arduino unit. The latency issue can be improved by using industrial grade microprocessors and using dedicated server from the cloud service provider. However, further research is necessary to understand the optimum content-to-bandwidth ratio based on the use case so that the users will not be overloaded with redundant information.
One ARDTMS user argued that the live data display was not helpful as he only responded to the risk level alert and DT model color change. This shows a gap between the design and utilization of user-created annotation and the monitoring system. Other users agreed that the annotation helps them to understand which part of the system has the most likelihood of causing the issue. This contradiction shows that the usefulness of raw sensory data could be depended on the expertise level of the user receiving the data.
One user suggested further improving the ARDTMS by adding in an external view of the tower crane surroundings. This can be achieved via additional image capturing device mounted on the tower crane. However, this would greatly increase the networking load. In an industrial application, additional sensory device needs to be justified with a cost-benefit analysis. Another user noted the dashboard and ARDTMS could complement each other as one gives a direct feedback based on learned knowledge, while the other is better at presenting historical trends for further detailed analysis. To merge the dashboard into ARDTMS, a sophisticated adaptive UI design is necessary so that an embedded dashboard can be integrated into ARDTMS. The dashboard should only emerge during diagnostics so that it will not distract user attention most of the time.
Lastly, one ARDTMS user commented that the system “is pretty cool”. This indicates that the system has the potential of attracting users who are unfamiliar with traditional operations to join the workforce by gamifying the operating process. This is another benefit that is worthy of further study.
6. Conclusions
This paper has described a framework for integrating AR and DT to improve HCI with smart devices by allowing remote monitoring and control, extracting knowledge from data, and presenting in AR. The prototype ARDTMS shows a preliminary case study on a tower crane. Through the user study, all three hypotheses were verified. Additionally, it is encouraging to observe the significant statistical separation between the mean response time for users of both systems. The qualitative result shows a preference for novice users in selecting ARDTMS as the monitoring system. The study highlights some capabilities which can be translated into HCI with other smart devices:
- Utilize real-time data and historical data to provide assistive knowledge to improve performance of novice users;
- Visualizing real-time results in AR format, which is intuitive and easy to understand;
- Implementable with commercially available hardware (mobile phones) and software (Unity3D, Microsoft Azure, ARKit) to ensure the system can be built for every user cost-effectively.
In the case study, the machine learning model showcases one possible way of using DT data. The framework is compatible with more advanced algorithms. As an example, if structural analysis is available for the DT, a finite element model can be integrated. As a conceptual example, ARFEA presented a real-time simulation method based on the quasi–static approximation to update the FEA result only on the region where the load is added based on the data from the force sensor [41]. To integrate into ARDTMS, the same computation algorithm can be preserved and transferred from a local computer to a cloud server. Only the rendered result is needed to be transferred to the mobile device, and the interaction scheme should be redesigned to fit the point-and-click interaction of a smart phone.
The scope of the case study is limited by the availability of data. In this work, only one device is studied, while multi-device interaction will have more complex effects in an actual application. Further development can be performed by incorporating data from a production shop floor. Nevertheless, the approach of utilizing real-time and historical data to simulate and visualize device data using AR and DT is applicable for various smart devices.
Data security is another issue overlooked in this study. Currently the data transmitted is not encrypted. Additionally, as the XML data and JSON database are shared by multiple users, there is a higher risk of losing proprietary information if any of the personal device is lost or stolen. This can endanger the safety of operation and business performance if falling into wrong hands. It is suggested that an in-house or outsourced information security officer be involved when implementing the system for any business entity.
Ultimately, the framework of ARDTMS allows customized utilization and visualization of DT data to improve a user’s decision-making process and take further actions. The user or the service professional can investigate and decide what insight is important and which analytics technique to integrate based on the application. In this way, ARDTMS opens new opportunities to harness the power of DT data and AR interface to enhance HCI for users to work smarter, more efficiently, and more effectively.
Author Contributions
Conceptualization, F.H., S.K.O. and A.Y.C.N.; methodology, F.H.; software, F.H.; writing—original draft preparation, F.H.; writing—review and editing, F.H., S.K.O. and A.Y.C.N.; supervision, S.K.O. and A.Y.C.N. All authors have read and agreed to the published version of the manuscript.
Funding
This research received no external funding.
Institutional Review Board Statement
Not applicable.
Informed Consent Statement
Not applicable.
Data Availability Statement
Data is contained within the article.
Conflicts of Interest
The authors declare no conflict of interest.
References
- Brown, M.; Coughlan, T.; Lawson, G.; Goulden, M.; Houghton, R.J.; Mortier, R. Exploring Interpretations of Data from the Internet of Things in the Home. Interact. Comput. 2013, 25, 204–217. [Google Scholar] [CrossRef]
- Kang, H.S.; Lee, J.Y.; Choi, S.; Kim, H.; Park, J.H.; Son, J.Y.; Kim, B.H.; Noh, S.D. Smart manufacturing: Past research, present findings, and future directions. Int. J. Precis. Eng. Manuf. Green Technol. 2016, 3, 111–128. [Google Scholar] [CrossRef]
- Grieves, M. Digital Twin: Manufacturing Excellence through Virtual Factory Replication. 2014. Available online: http://www.themanufacturinginstitute.org/~/media/E323C4D8F75A470E8C96D7A07F0A14FB/DI_2018_Deloitte_MFI_skills_gap_FoW_study (accessed on 25 June 2021).
- Kranz, M.; Holleis, P.; Schmidt, A. Embedded interaction: Interacting with the internet of things. IEEE Internet Comput. 2009, 2, 46–53. [Google Scholar] [CrossRef]
- Heun, V.; Kasahara, S.; Maes, P. Smarter objects: Using AR technology to program physical objects and their interactions. In Proceedings of the CHI’13 Extended Abstracts on Human Factors in Computing Systems, Paris, France, 27 April–2 May 2013; pp. 961–966. [Google Scholar]
- Mayer, S.; Tschofen, A.; Dey, A.K.; Mattern, F. User interfaces for smart things—A generative approach with semantic interaction descriptions. ACM Trans. Comput. Hum. Interact. 2014, 21, 12. [Google Scholar] [CrossRef]
- Yew, A.W.W.; Ong, S.K.; Nee, A.Y.C. Augmented Reality Interfaces for Smart Objects in Ubiquitous Computing Environments. In Human-Computer Interfaces and Interactivity: Emergent Research and Applications; Isaias, P., Blashki, K., Eds.; Information Science Reference: Hershey, PA, USA, 2014; pp. 208–229. [Google Scholar]
- Tao, F.; Cheng, J.; Qi, Q.; Zhang, M.; Zhang, H.; Sui, F. Digital twin-driven product design, manufacturing and service with big data. Int. J. Adv. Manuf. Technol. 2018, 94, 3563–3576. [Google Scholar] [CrossRef]
- Zhuang, C.; Liu, J.; Xiong, H. Digital twin-based smart production management and control framework for the complex product assembly shop-floor. Int. J. Adv. Manuf. Technol. 2018, 96, 1149–1163. [Google Scholar] [CrossRef]
- Schirner, G.; Erdogmus, D.; Chowdhury, K.; Padir, T. The future of human-in-the-loop cyber-physical systems. Computer 2013, 1, 36–45. [Google Scholar] [CrossRef]
- Ardito, C.; Buono, P.; Desolda, G.; Matera, M. From smart objects to smart experiences: An end-user development approach. Int. J. Hum. Comput. Stud. 2018, 114, 51–68. [Google Scholar] [CrossRef]
- Li, W.; Nee, A.Y.C.; Ong, S.K. A state-of-the-art review of augmented reality in engineering analysis and simulation. Multimodal Technol. Interact. 2017, 1, 17. [Google Scholar] [CrossRef]
- Novak-Marcincin, J.; Barna, J.; Janak, M.; Novakova-Marcincinova, L. Augmented reality aided manufacturing. Procedia Comput. Sci. 2013, 25, 23–31. [Google Scholar] [CrossRef] [Green Version]
- Radkowski, R.; Herrema, J.; Oliver, J. Augmented reality-based manual assembly support with visual features for different degrees of difficulty. Int. J. Hum. Comput. Interact. 2015, 31, 337–349. [Google Scholar] [CrossRef]
- Radkowski, R. Object tracking with a range camera for augmented reality assembly assistance. J. Comput. Inf. Sci. Eng. 2016, 16, 011004. [Google Scholar] [CrossRef]
- Wang, X.; Ong, S.K.; Nee, A.Y.C. A comprehensive survey of augmented reality assembly research. Adv. Manuf. 2016, 4, 1–22. [Google Scholar] [CrossRef]
- Nee, A.Y.C.; Ong, S.K.; Chryssolouris, G.; Mourtzis, D. Augmented reality applications in design and manufacturing. CIRP Ann. 2012, 61, 657–679. [Google Scholar] [CrossRef]
- Van Krevelen, D.W.F.; Poelman, R. A survey of augmented reality technologies, applications and limitations. Int. J. Virtual Real. 2010, 9, 1–20. [Google Scholar] [CrossRef] [Green Version]
- Vazquez-Alvarez, Y.; Aylett, M.P.; Brewster, S.A.; Jungenfeld, R.V.; Virolainen, A. Designing interactions with multilevel auditory displays in mobile audio-augmented reality. ACM Trans. Comput. Hum. Interact. 2016, 23, 3. [Google Scholar] [CrossRef] [Green Version]
- Fiorentino, M.; Uva, A.E.; Gattullo, M.; Debernardis, S.; Monno, G. Augmented reality on large screen for interactive maintenance instructions. Comput. Ind. 2014, 65, 270–278. [Google Scholar] [CrossRef]
- Ling, H. Augmented reality in reality. IEEE MultiMedia 2017, 24, 10–15. [Google Scholar] [CrossRef]
- Li, P.; Qin, T.; Hu, B.; Zhu, F.; Shen, S. Monocular visual-inertial state estimation for mobile augmented reality. In Proceedings of the 2017 IEEE International Symposium on Mixed and Augmented Reality (ISMAR), Nantes, France, 9–13 October 2017; pp. 11–21. [Google Scholar]
- Mur-Artal, R.; Montiel, J.M.M.; Tardos, J.D. ORB-SLAM: A versatile and accurate monocular SLAM system. IEEE Trans. Robot. 2015, 31, 1147–1163. [Google Scholar] [CrossRef] [Green Version]
- He, F.; Ong, S.K.; Nee, A.Y.C. A Mobile Solution for Augmenting a Manufacturing Environment with User-Generated Annotations. Information 2019, 10, 60. [Google Scholar] [CrossRef] [Green Version]
- Özacar, K.; Hincapié-Ramos, J.D.; Takashima, K.; Kitamura, Y. 3D Selection Techniques for Mobile Augmented Reality Head-Mounted Displays. Interact. Comput. 2016, 29, 579–591. [Google Scholar] [CrossRef]
- Tao, F.; Zhang, M.; Nee, A.Y.C. Digital Twin Driven Smart Manufacturing; Academic Press: Cambridge, MA, USA, 2019. [Google Scholar]
- Schroeder, G.; Steinmetz, C.; Pereira, C.E.; Muller, I.; Garcia, N.; Espindola, D.; Rodrigues, R. Visualising the digital twin using web services and augmented reality. In Proceedings of the 2016 IEEE 14th International Conference on Industrial Informatics, Poitiers, France, 19–21 July 2016; pp. 522–527. [Google Scholar]
- Rabah, S.; Assila, A.; Khouri, E.; Maier, F.; Ababsa, F.; Bourny, V.; Maier, P.; Merienne, F. Towards improving the future of manufacturing through digital twin and augmented reality technologies. Procedia Manuf. 2018, 17, 460–467. [Google Scholar] [CrossRef]
- Zhu, Z.; Liu, C.; Xu, X. Visualisation of the Digital Twin data in manufacturing by using Augmented Reality. Procedia CIRP 2019, 81, 898–903. [Google Scholar] [CrossRef]
- Liu, S.; Lu, S.; Li, J.; Sun, X.; Lu, Y.; Bao, J. Machining process-oriented monitoring method based on digital twin via augmented reality. Int. J. Adv. Manuf. Technol. 2021, 113, 3491–3508. [Google Scholar] [CrossRef]
- Gaj, P.; Jasperneite, J.; Felser, M. Computer communication within industrial distributed environment—A survey. IEEE Trans. Ind. Inform. 2013, 9, 182–189. [Google Scholar] [CrossRef]
- Varsaluoma, J.; Väätäjä, H.; Heimonen, T.; Tiitinen, K.; Hakulinen, J.; Turunen, M.; Nieminen, H. Usage Data Analytics for Human-Machine Interactions with Flexible Manufacturing Systems: Opportunities and Challenges. In Proceedings of the 2017 21st International Conference Information Visualisation (IV), London, UK, 11–14 July 2017; pp. 427–434. [Google Scholar]
- Salomon, D. Data Compression: The Complete Reference; Springer: London, UK, 2004. [Google Scholar]
- Gandomi, A.; Haider, M. Beyond the hype: Big data concepts, methods, and analytics. Int. J. Inf. Manag. 2015, 35, 137–144. [Google Scholar] [CrossRef] [Green Version]
- Söderberg, R.; Wärmefjord, K.; Carlson, J.S.; Lindkvist, L. Towards a Digital Twin for real-time geometry assurance in individualized production. CIRP Ann. 2017, 66, 137–140. [Google Scholar] [CrossRef]
- Linowes, J.; Babilinski, K. Augmented Reality for Developers: Build Practical Augmented Reality Applications with Unity, ARCore, ARKit, and Vuforia. 2014. Available online: https://www.packtpub.com/web-development/augmented-reality-developers (accessed on 25 June 2021).
- Chen, Y.; Garcia, E.K.; Gupta, M.R.; Rahimi, A.; Cazzanti, L. Similarity-based classification: Concepts and algorithms. J. Mach. Learn. Res. 2009, 10, 747–776. [Google Scholar]
- Hornbæk, K. Current practice in measuring usability: Challenges to usability studies and research. Int. J. Hum. Comput. Stud. 2006, 64, 79–102. [Google Scholar] [CrossRef]
- Sauro, J.; Lewis, J.R. Quantifying the User Experience: Practical Statistics for User Research; Morgan Kaufmann: Cambridge, MA, USA, 2016. [Google Scholar]
- Nielsen, J. Usability Engineering; Morgan Kaufmann: San Francisco, CA, USA, 1994. [Google Scholar]
- Huang, J.M.; Ong, S.K.; Nee, A.Y.C. Real-time finite element structural analysis in augmented reality. Adv. Eng. Softw. 2015, 87, 43–56. [Google Scholar] [CrossRef]
Figure 1.
The system architecture of ARDTMS.

Figure 2.
The implemented ARDTMS framework for tower crane monitoring.

Figure 3.
Hardware setup of the tower crane prototype.

Figure 4.
Database entries and values.

Figure 5.
The training workflow for fault detection.

Figure 6.
Real-time dashboard showing data over last 3 min; (left): proximity sensor readings, (right): pressure sensors readings.
Figure 6.
Real-time dashboard showing data over last 3 min; (left): proximity sensor readings, (right): pressure sensors readings.

Figure 7.
The mobile user interface and side-by-side comparison of DT and the physical tower crane.

Figure 8.
Results of the qualitative evaluation.


Table 1.
Sample formatted data fields.
| Fields | Sample Value | Description |
|---|---|---|
| Distance | 57.7 | Distance from load to the jib |
| force1 | 31.17 | Pressure at first foot of the base |
| force2 | 31.65 | Pressure at second foot of the base |
| epochTime | 1562900362608 | Unix time in milliseconds, synced from Network Time Protocol (NTP) and recorded as timestamp for the current reading |
| deltatime | 697 | Milliseconds passed since the last updated reading. Recorded from the Arduino’s inbuilt clock |
Table 2.
Sample formatted data fields.
| Group | Mobility | Intuitiveness | Efficiency | Satisfaction | Response Time (s) | |||||
|---|---|---|---|---|---|---|---|---|---|---|
| A | B | A | B | A | B | A | B | A | B | |
| 1 | 2 | 5 | 1 | 5 | 3 | 4 | 2 | 5 | 6.6 | 4.1 |
| 2 | 5 | 4 | 2 | 4 | 4 | 5 | 3 | 4 | 8.6 | 4.8 |
| 3 | 5 | 5 | 4 | 2 | 4 | 4 | 4 | 4 | 9.0 | 5.0 |
| 4 | 5 | 4 | 3 | 4 | 3 | 4 | 3 | 4 | 7.38 | 5.2 |
| 5 | 2 | 4 | 3 | 5 | 3 | 4 | 4 | 4 | Inf | 7.0 |
| 6 | 2 | 4 | 2 | 4 | 1 | 3 | 2 | 4 | Inf | 5.0 |
| 7 | 4 | 5 | 4 | 5 | 5 | 5 | 4 | 5 | Inf | 5.5 |
| 8 | 5 | 5 | 5 | 5 | 5 | 5 | 5 | 5 | 6.6 | 4.7 |
| 9 | 4 | 4 | 3 | 5 | 4 | 5 | 3 | 4 | 2.0 | 4.7 |
| 10 | 5 | 4 | 4 | 3 | 5 | 4 | 5 | 5 | 9.0 | 4.7 |
Publisher’s Note: MDPI stays neutral with regard to jurisdictional claims in published maps and institutional affiliations. |
© 2021 by the authors. Licensee MDPI, Basel, Switzerland. This article is an open access article distributed under the terms and conditions of the Creative Commons Attribution (CC BY) license (https://creativecommons.org/licenses/by/4.0/).
Share and Cite
MDPI and ACS Style
He, F.; Ong, S.K.; Nee, A.Y.C. An Integrated Mobile Augmented Reality Digital Twin Monitoring System. Computers 2021, 10, 99. https://0-doi-org.brum.beds.ac.uk/10.3390/computers10080099
AMA Style
He F, Ong SK, Nee AYC. An Integrated Mobile Augmented Reality Digital Twin Monitoring System. Computers. 2021; 10(8):99. https://0-doi-org.brum.beds.ac.uk/10.3390/computers10080099
Chicago/Turabian StyleHe, F., S. K. Ong, and A. Y. C. Nee. 2021. "An Integrated Mobile Augmented Reality Digital Twin Monitoring System" Computers 10, no. 8: 99. https://0-doi-org.brum.beds.ac.uk/10.3390/computers10080099
Note that from the first issue of 2016, this journal uses article numbers instead of page numbers. See further details here.