
Deep Learning (CNN, RNN) Applications for Smart Homes: A Systematic Review


1
Madrid HCI Lab, Research Group on Human-Computer Interaction and Advanced Interactive Systems, Universidad Politécnica de Madrid (UPM), 28660 Boadilla del Monte, Spain
2
Centre for Biomedical Technology (CTB), Universidad Politécnica de Madrid (UPM), 28223 Pozuelo de Alarcon, Spain
3
Centro de Investigación Biomédica en Red en Bioingeniería, Biomateriales y Nanomedicina (CIBER-BBN), 28029 Madrid, Spain
*
Author to whom correspondence should be addressed.
Computers 2022, 11(2), 26; https://0-doi-org.brum.beds.ac.uk/10.3390/computers11020026
Submission received: 22 December 2021
/
Revised: 8 February 2022
/
Accepted: 9 February 2022
/
Published: 16 February 2022
(This article belongs to the Special Issue Survey in Deep Learning for IoT Applications)
Abstract
:In recent years, research on convolutional neural networks (CNN) and recurrent neural networks (RNN) in deep learning has been actively conducted. In order to provide more personalized and advanced functions in smart home services, studies on deep learning applications are becoming more frequent, and deep learning is acknowledged as an efficient method for recognizing the voices and activities of users. In this context, this study aims to systematically review the smart home studies that apply CNN and RNN/LSTM as their main solution. Of the 632 studies retrieved from the Web of Science, Scopus, IEEE Explore, and PubMed databases, 43 studies were selected and analyzed according to the Preferred Reporting Items for Systematic Reviews and Meta-Analyses (PRISMA) methodology. In this paper, we examine which smart home applications CNN and RNN/LSTM are applied to and compare how they were implemented and evaluated. The selected studies dealt with a total of 15 application areas for smart homes, where activity recognition was covered the most. This study provides essential data for all researchers who want to apply deep learning for smart homes, identifies the main trends, and can help to guide design and evaluation decisions for particular smart home services.
1. Introduction
This study aims to establish a basic reference resource for researchers investigating deep learning (DL) for smart homes. In recent years, development efforts to apply DL to smart homes have been continuously increasing. This is because DL can learn users’ daily data from smart home devices and then help provide the most appropriate functions for the users’ needs [1]. Since this is a technology that will be actively researched in the future of smart home services, we considered that an updated systematic analysis of the use of DL for smart homes was, and continues to be, necessary. Particularly, within DL, convolutional neural network (CNN), recurrent neural network (RNN), and long short-term memory (LSTM), which have been the most extensively researched solutions for smart homes, will be the focus for comparison and analysis. Through this, a comprehensive view will be presented of how the different smart home application areas have been covered by these models in recent years, the implementation methods, the data used, and the applied evaluation methods.
1.1. Deep Learning: CNN, RNN, and LSTM
DL algorithms use neural networks that are deeply built up by a layering of base layers. It is a branch of machine learning (ML) that learns relationships from data in order to make decisions, and DL is used synonymously with the term Deep Neural Networks (DNN). This is a promising field of artificial intelligence that is able to provide increasingly satisfactory results as more data are collected [2].
CNN is one of the most widely used DL algorithms. This model was reported by LeCun et al. [3] in 1989 and showed successful performance in the field of computer vision. Not only academia, but also companies such as Google, Microsoft, and Facebook are constantly researching and applying CNN to their services [4]. The CNN model consists of three layers: convolutional layer, subsampling layer (pooling layer), and fully connected layer. The convolutional and sub-sampling layers apply local receptive fields and shared weights. They can be stacked in multiple layers and perform the task of classification through a fully connected layer in the last stage. CNN is excellent for feature extraction and classification. It has become dominant in image recognition, classification, and video recognition [2,5].
RNN, one of the promising DL models, is a suitable learning model for processing sequential data such asf speech recognition and language processing. It learns features for time-series data through the memory of previous inputs in the neural network’s internal state. Furthermore, RNN can predict future information based on past and present data. However, in the RNN structure, it is difficult to learn stored data for a long time because of the gradient vanishing issue or gradient exploding issue [5].
A model that fundamentally solved this problem of RNN is LSTM, proposed in 1997 [6]. LSTM cells can collect and maintain selective information by using multiple gate elements to retrieve information, remember information, or remove stored information that is no longer needed. As mentioned above, this is a model that improves the issues of RNN and has the same characteristics as RNN. It can be used in fields that require the analysis of sequential data and the prediction of future events using the present data. In other words, LSTM is one of the most advanced networks that handle time sequences [7].
1.2. Smart Home Technology
Smart home technology is also a field that has recently been developed extensively. Smart home refers to the technology that automatically controls home systems and environments, including temperature, lighting, security systems, appliances, and sensing devices, through network communication [8]. Alaa et al. [9] analyzed Internet of Things (IoT)-based smart home applications and presented a variety of service categories such as security and privacy applications, network architecture applications, monitoring applications, and automated transportation for smart homes. Research on smart home systems has emphasized the importance of context-aware environments along with big data, IoT, and extendable wireless sensor-networks [10]. Mshali et al. [11] addressed health monitoring systems (HMS) in smart homes as an efficient solution to complement traditional healthcare institutions and to reduce the burden of healthcare costs. Furthermore, the authors reviewed various studies in the field of HMS and described the monitoring functions by classifying them into three categories: activity recognition, abnormal behavior detection, and behavior prediction. For these functions, many studies applied ML algorithms [12,13,14]. This shows that smart home technology goes beyond remote home control, and it is now gradually developing into a technology that learns user data and provides customized functions and services using ML and DL [15]. As smart home services become more personalized, it is necessary to analyze daily data and provide appropriate functions. To this end, various solutions from traditional ML algorithms to DL are being proposed. We will examine how CNN and RNN/LSTM, which are leading the research on DL, are being applied to smart home research through a systematic review.
While research applying DL for activity recognition has been conducted for many years [16,17], research on its application to smart homes has been more actively conducted in recent years. Recent studies show that CNN and RNN/LSTM have improved performance based on raw data, as compared to existing ML techniques such as SVM, Naive Bayes, HMM, HSMM, and CRF [18,19,20,21,22,23]. This shows that the application of DL technology in smart home services has considerable potential in the future.
1.3. Related Works and Contribution
The purpose of this study is to perform a systematic review that allows us to compare and analyze studies conducted on smart home technology employing CNN and RNN/LSTM.
In a previous systematic review of DL applications in speaker recognition [24], the datasets used, classification methods, and evaluation methods were compared and analyzed, identifying the main trends. It is a useful reference for researchers working on speaker identification with DL. In another systematic review of the Internet of Things applied to smart homes [25], the latest technologies were presented and the considerations for smart home systems were discussed through bibliographic analysis, content analysis, and data mining. However, it focused only on energy management among the various smart home services, while the technology was broadly set as artificial intelligence. The goal was to suggest ways to design smart homes with a higher level of thermal comfort while saving energy. In a study reviewing the applications of artificial intelligence to smart homes [26], literature and products were reviewed to define artificial intelligence’s functions in smart homes. It led to the discovery and discussion of gaps between literature and products. Djamel et al. [27] studied the application of ML for smart building. They divided ML applications into the resident aspect and the energy aspect. Applications related to the resident aspect included user authentication and activity recognition, and in the energy aspect, we dealt with apps that classify appliances and predict energy demand or load. In the study examining energy forecasting in smart microgrids [28], they reviewed studies applying DL for power load prediction and power prediction of wind turbines and solar panels. This can be an important solution for the efficient use of renewable energy resources in terms of energy management.
Compared with previous reviews such as [25,28] that focused on energy management, [24] that focused on the security area, and [26,27] that focused on activity recognition and energy management, we do not restrict our analysis to specific application areas but aim to acquire a comprehensive picture of all the areas and the variety of smart home services. Besides, we aim to focus on the emerging deep learning technologies (CNN and RNN/LSTM more specifically) for a more in-depth analysis into the latest trends in the field (see Table 1). Thus, our practical contributions are (1) trend analysis of how DL is being applied to smart home services; (2) reference material for future research planning and evaluation.
2. Methods
For the selection of qualified studies for review, this study applied the Preferred Reporting Items for Systematic Reviews and Meta-Analyses (PRISMA) methodology, which is a framework to guide systematic reviews and meta-analyses [29]. The study’s scope was determined by the PICO (Population/Intervention/Comparison/Outcomes) model [30].
2.1. Research Questions
Most of the studies on DL delve into the network structure, the configuration of the data set used, the training and testing process, and the evaluation. To analyze the contents of each study, five research questions were designed. Research objectives, application fields, data, and evaluation methods in each study are compared and analyzed through these research questions:
RQ1.
How is the distribution of the studies according to publication time and contents (as reflected by keywords)?
- The overall distribution of the studies is analyzed by year and by DL type.
- CNN-related keywords and RNN/LSTM-related keywords are compared to understand the overall research contents.
RQ2.
What are the smart home services where CNN or RNN/LSTM are employed?
- Smart home services to which DL techniques are applied are analyzed. It is possible to derive information on the fields most frequently dealt with and the fields with potential for development.
- The purpose and the network composition of each study are compared. This can help researchers establish their research direction and strategy.
RQ3.
How is the dataset collected, analyzed, and used by each study?
- The datasets used in each study are identified and analyzed. The results show the datasets that are most commonly used in smart home research according to the research topic.
- The way of dividing the dataset for training and testing is compared.
RQ4.
How is the result of each applied DL evaluated?
- The evaluation metrics for each study are analyzed.
- The differences in evaluation methods for each DL type are compared.
RQ5.
Is there any study on a specific population target? Who is the target, and what is the field of application?
- The studies that mention a specific population target are identified.
- The objectives and detailed functions of these studies are compared.
2.2. Search
The PICO model was applied to determine the specific research scope and extract the search strings:
- Population: Specific studies on CNN or RNN/LSTM applied to smart homes.
- Intervention: Research to apply CNN or RNN/LSTM as major solutions for improvement and the development of smart home services.
- Comparison
- ◦
- Applied DL algorithms and their application.
- ◦
- The methods to collect and use dataset.
- ◦
- Metrics and evaluation methods.
- ◦
- Research considering specific subjects.
- Outcomes
- ◦
- Research trends in DL for smart homes.
- ◦
- Development potential in DL research for smart homes.
- ◦
- Limitations.
The search strings were defined with consideration for PICO and the research questions, including the words “smart homes”, “smart home”, and “assisted living”, which represent the smart home-related fields. In particular, “ambient assisted living” and “assisted living environment” are words that are used repeatedly to represent smart homes in many studies. Moreover, those words have been suggested as keywords in many smart home studies. To include these words, the string “assisted living” was selected. Concurrently, the abbreviations and full names of applied technologies such as “CNN”, “RNN”, and “LSTM” were also searched as key strings.
The search scope was designated as article title, abstract, and keywords. The major databases used include Web of Science, Scopus, IEEE, and PubMed. The review was conducted for conference papers or journal articles published between 1 January 2016 and 31 March 2020 (Table 2).
2.3. Study SELECTION
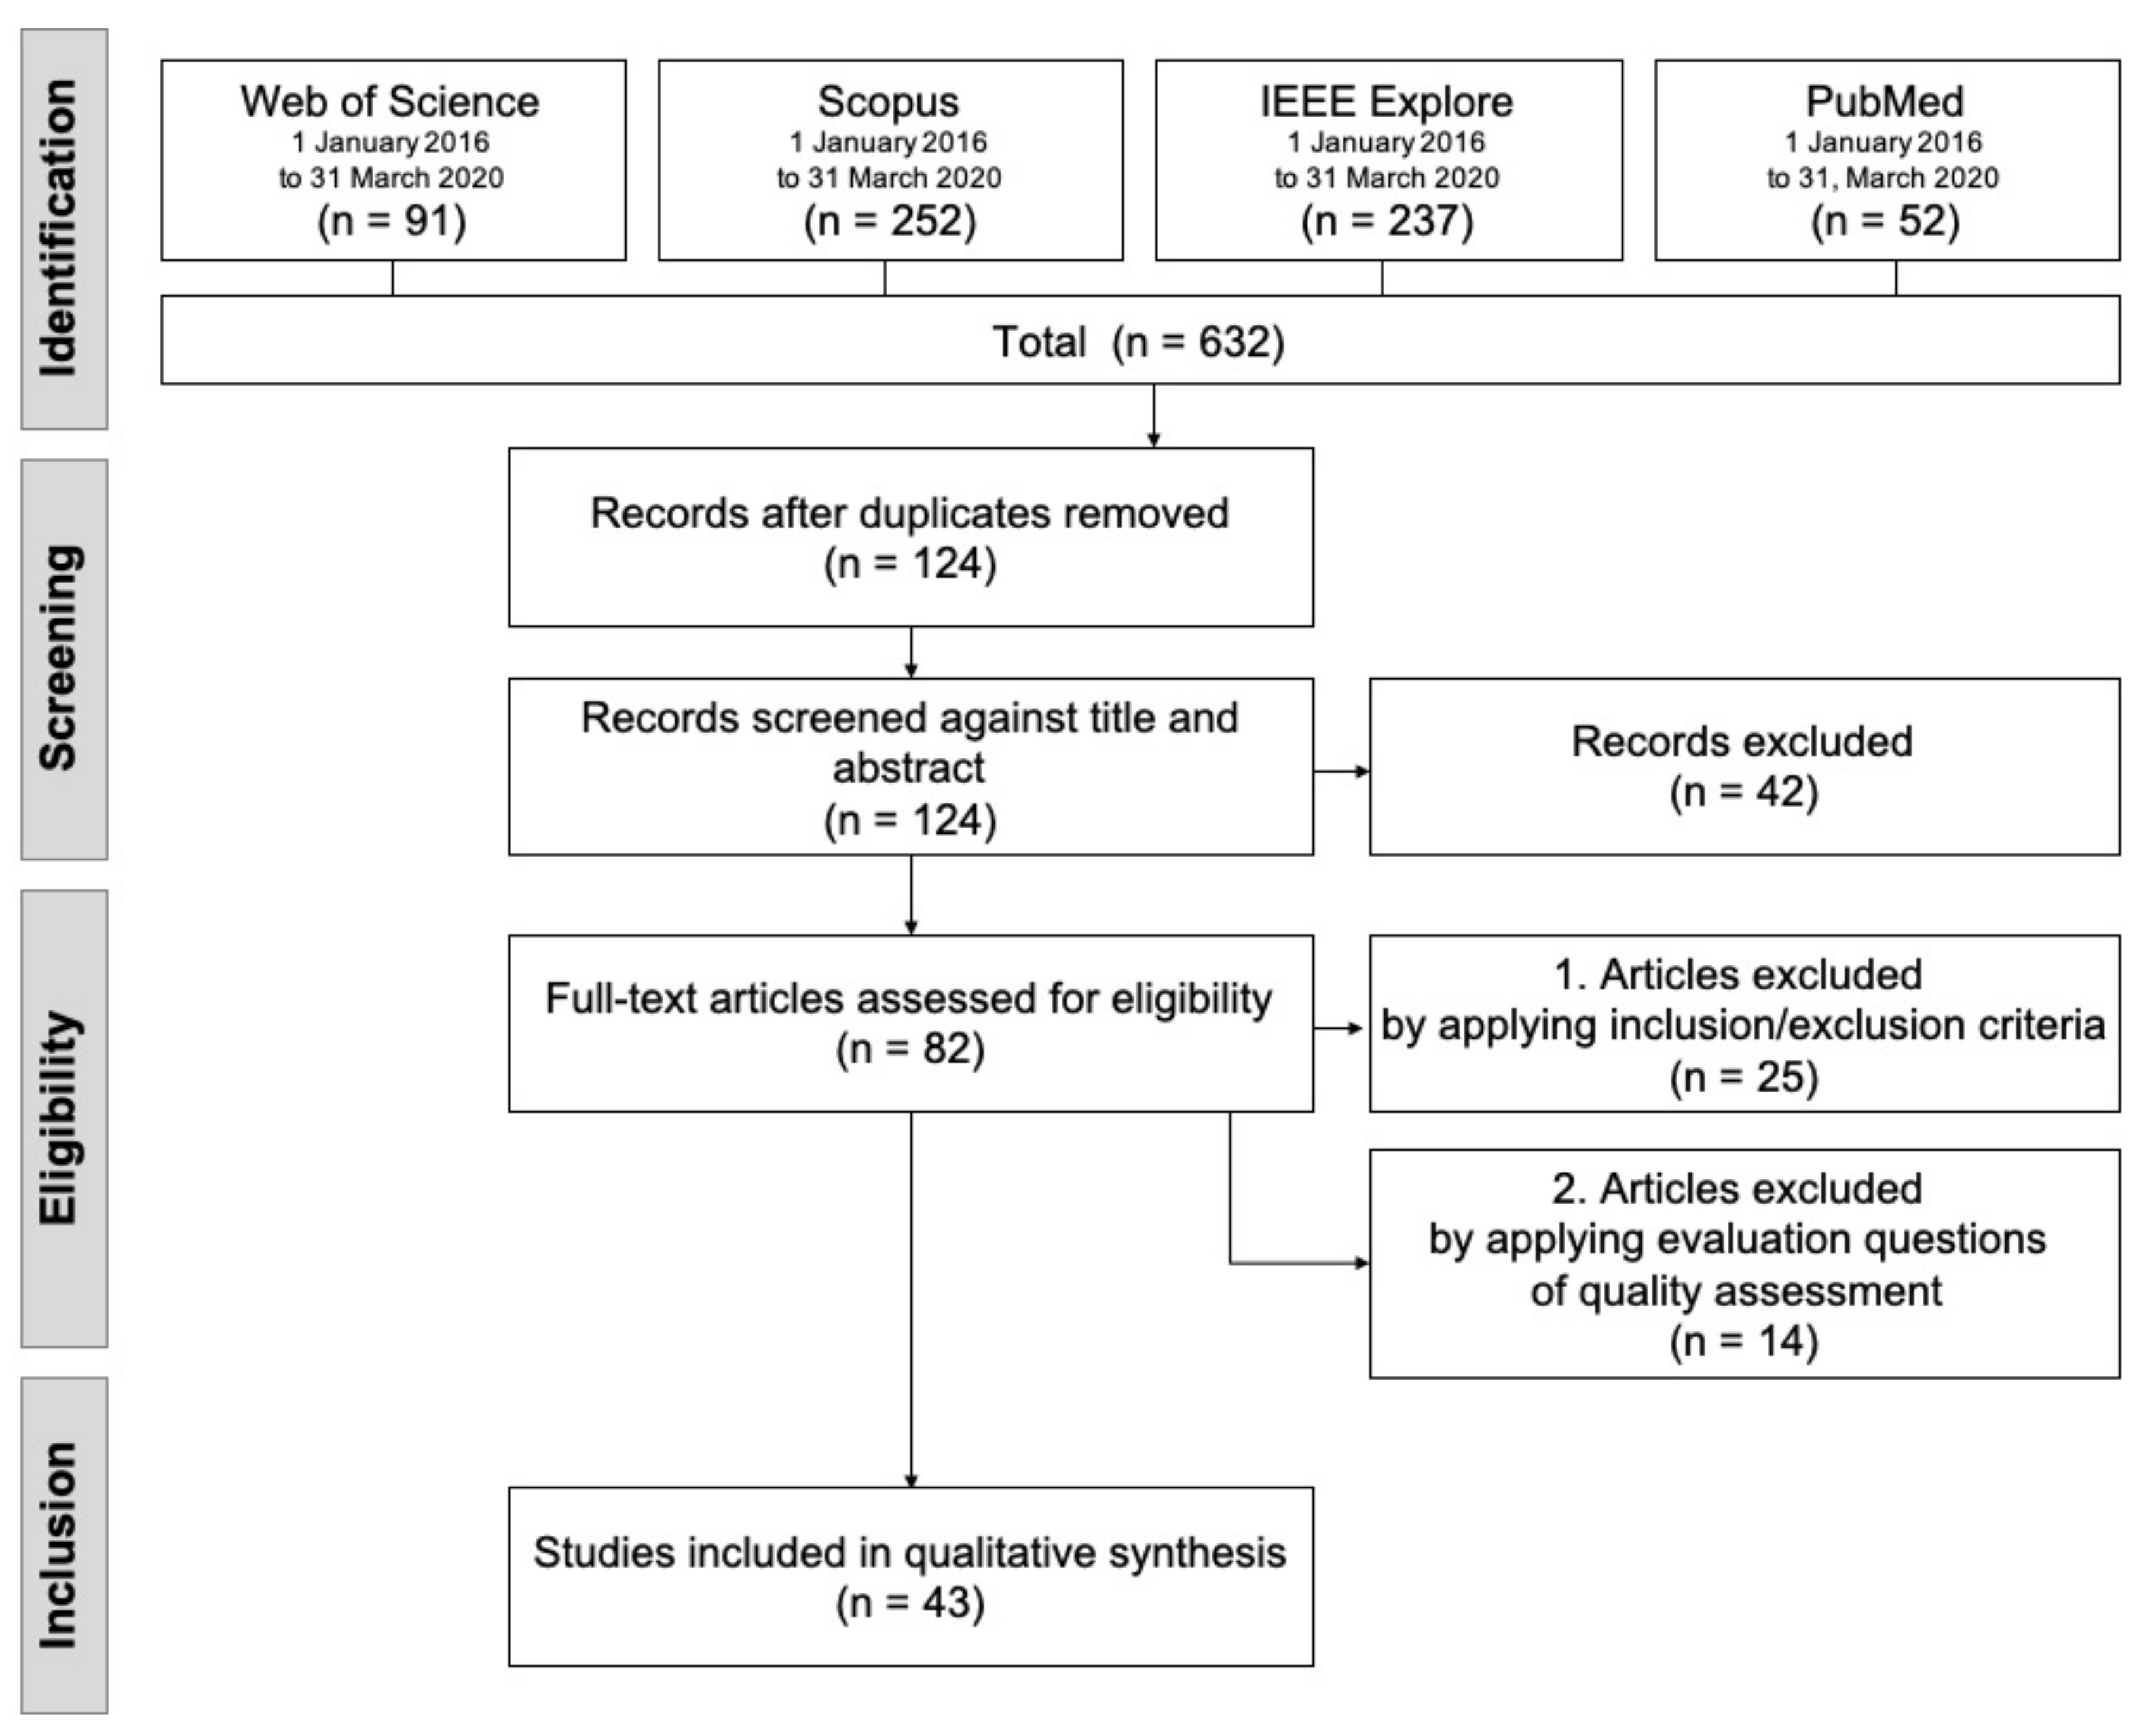
According to PRISMA, among the 632 studies found in the databases, after excluding duplicates, 124 studies passed on to the screening phase. Title and abstract screening yielded 42 studies that were considered irrelevant and excluded. A total of 82 results were reviewed in full-text during the eligibility phase, and 43 studies were finally selected by applying exclusion criteria and four evaluation questions. The evaluation questions (EQ) for quality assessment used in this phase are shown in Table 3.
Inclusion
- Studies of CNN or RNN/LSTM based on smart home data;
- Studies in the field of software engineering, applications, networks, sensors, and technology;
- Studies published between 1 January 2016 and 31 March 2020;
- Conference papers or Journal articles;
- Studies on smart home services.
Exclusion
- Studies not written in English;
- Studies not accessible in full-text;
- Studies with a similar conclusion to a more recent paper from the same author.
Figure 1 shows the PRISMA flowchart of the study selection process where 43 articles were finally selected. All 43 final studies are on smart homes, the main solutions are CNN, RNN/LSTM, and they are composed of enough content to extract data for comparison. Furthermore, the process and results are clearly written. Data for the five RQs were collected and compared for the 43 studies.
2.4. Data Extraction
Before extracting data, the data items and the value items were defined, corresponding to each RQ, as shown in Table 4. When extracting data, if the primary studies do not have corresponding data, the item is filled in with “-”. All authors reviewed and extracted data from each study as reviewers.
3. Results
3.1. RQ1: How Is the Distribution of the Studies According to Publication Time and Contents?
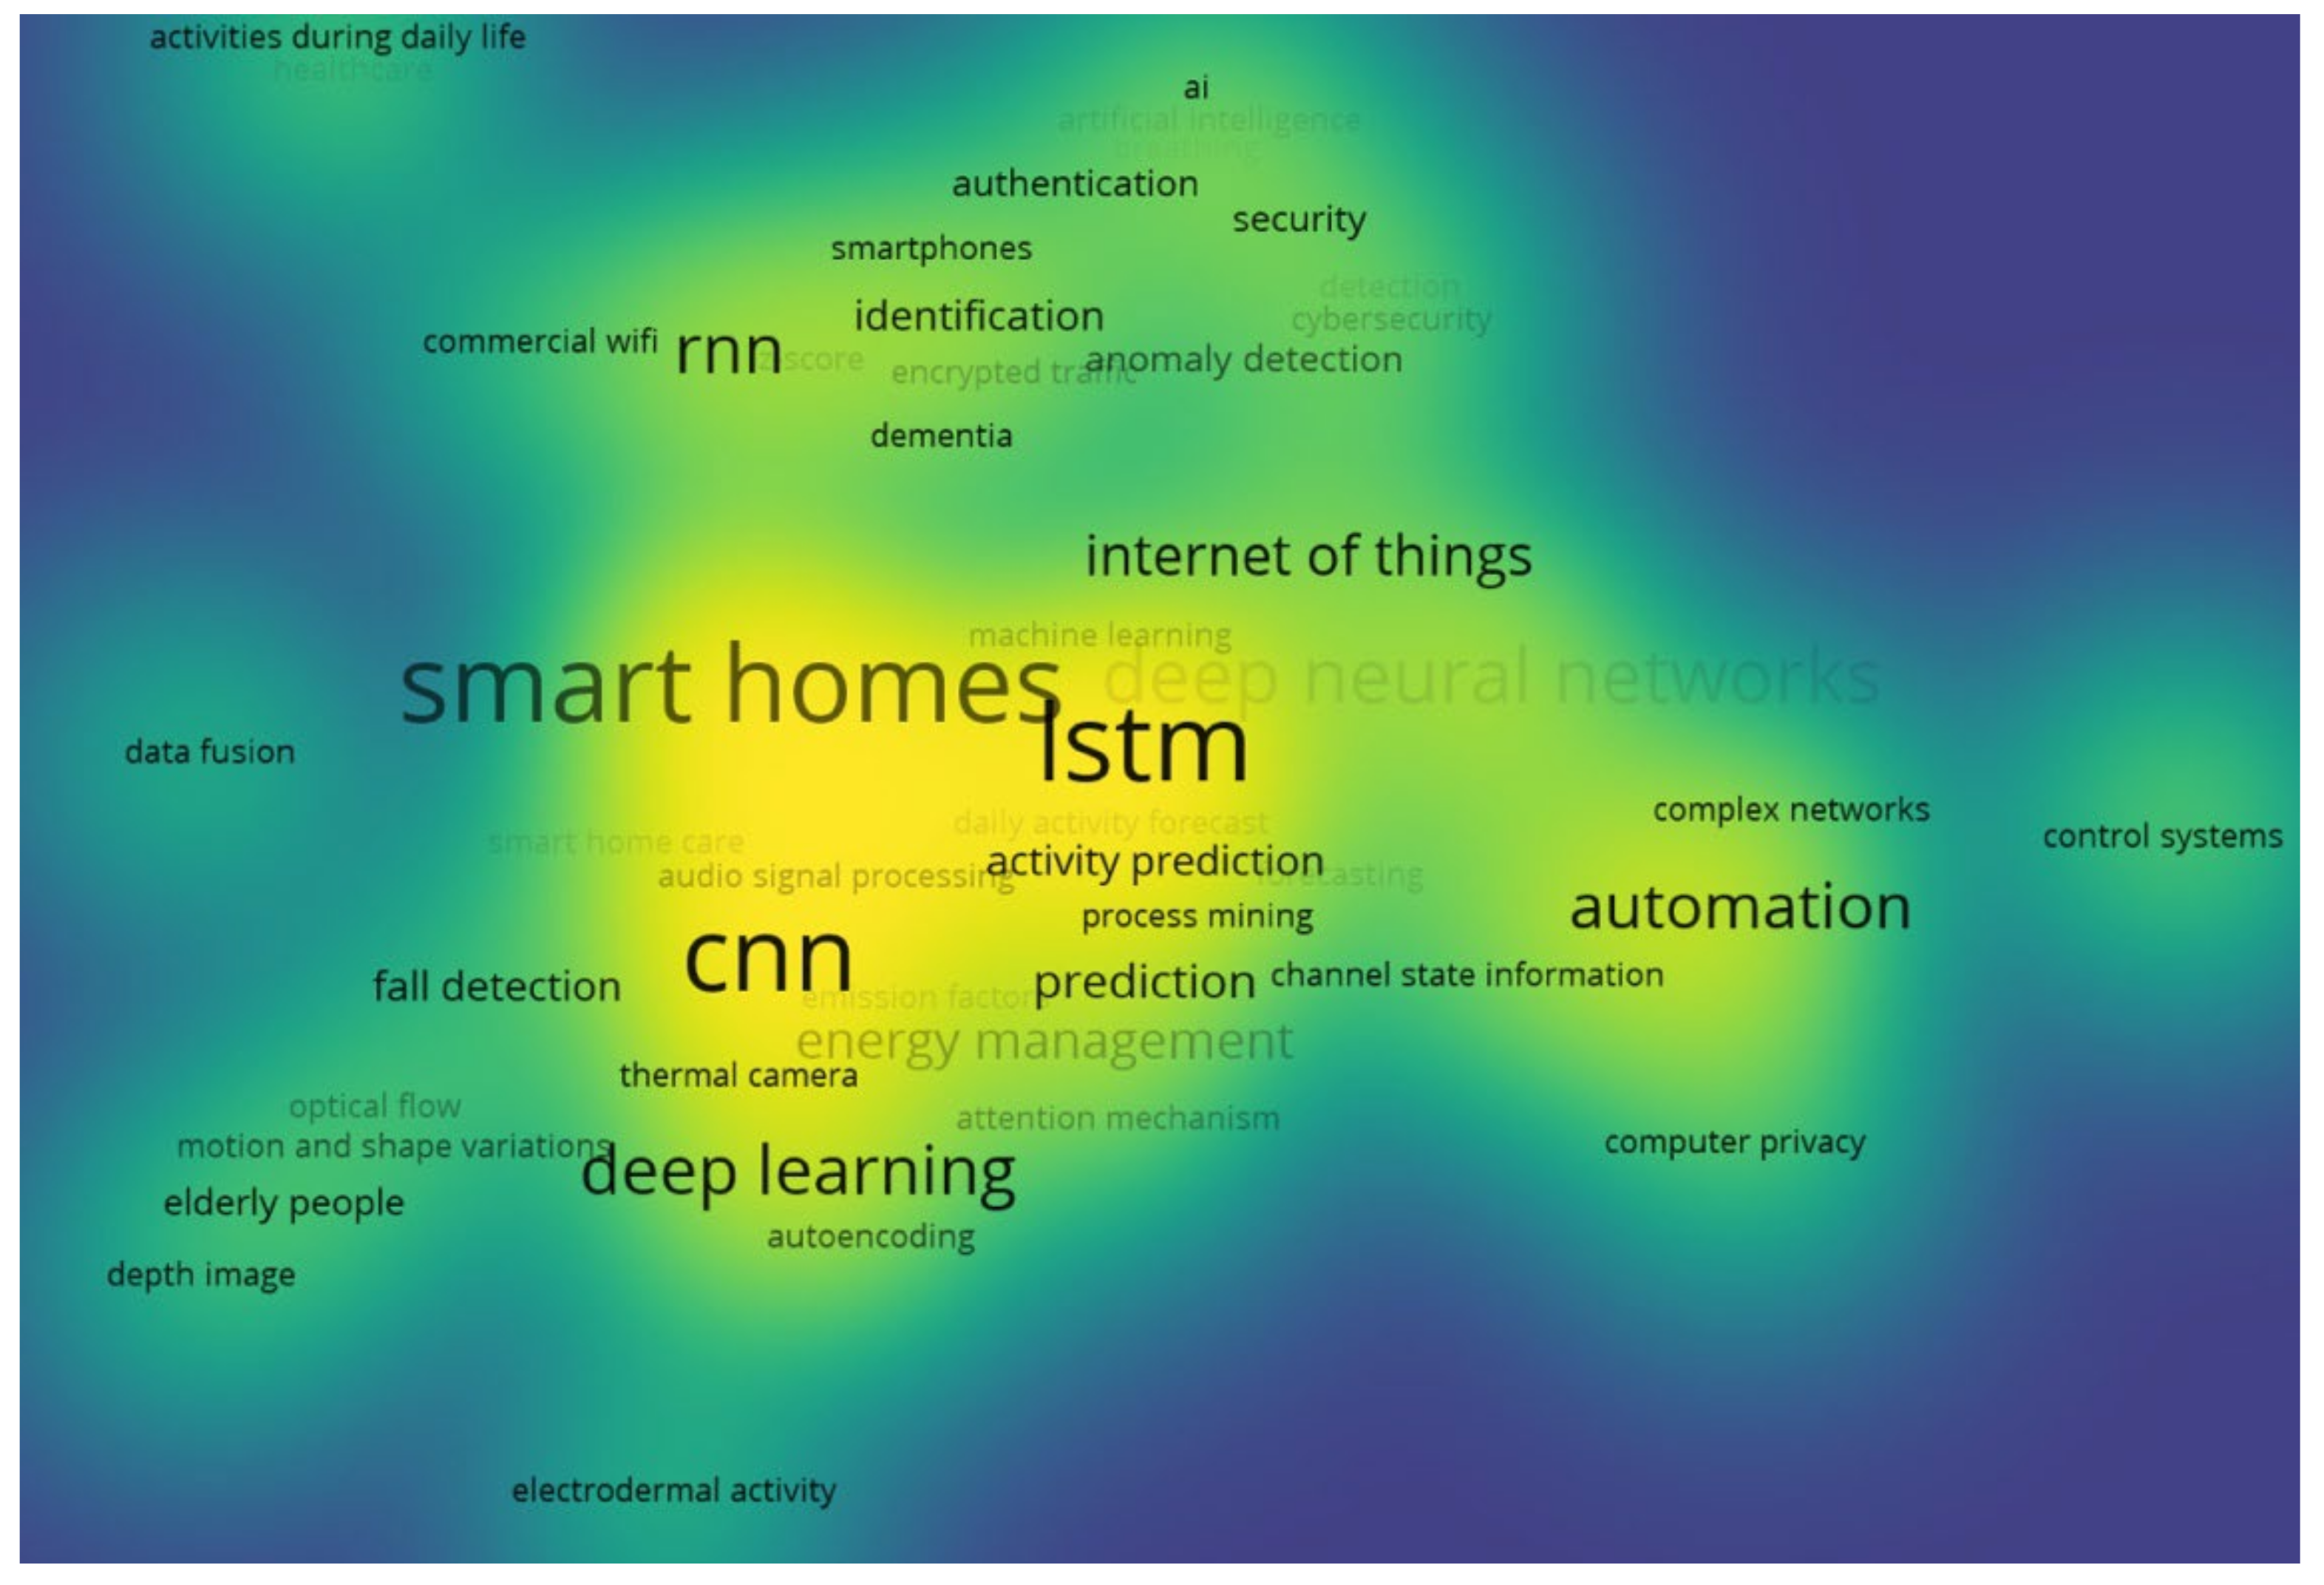
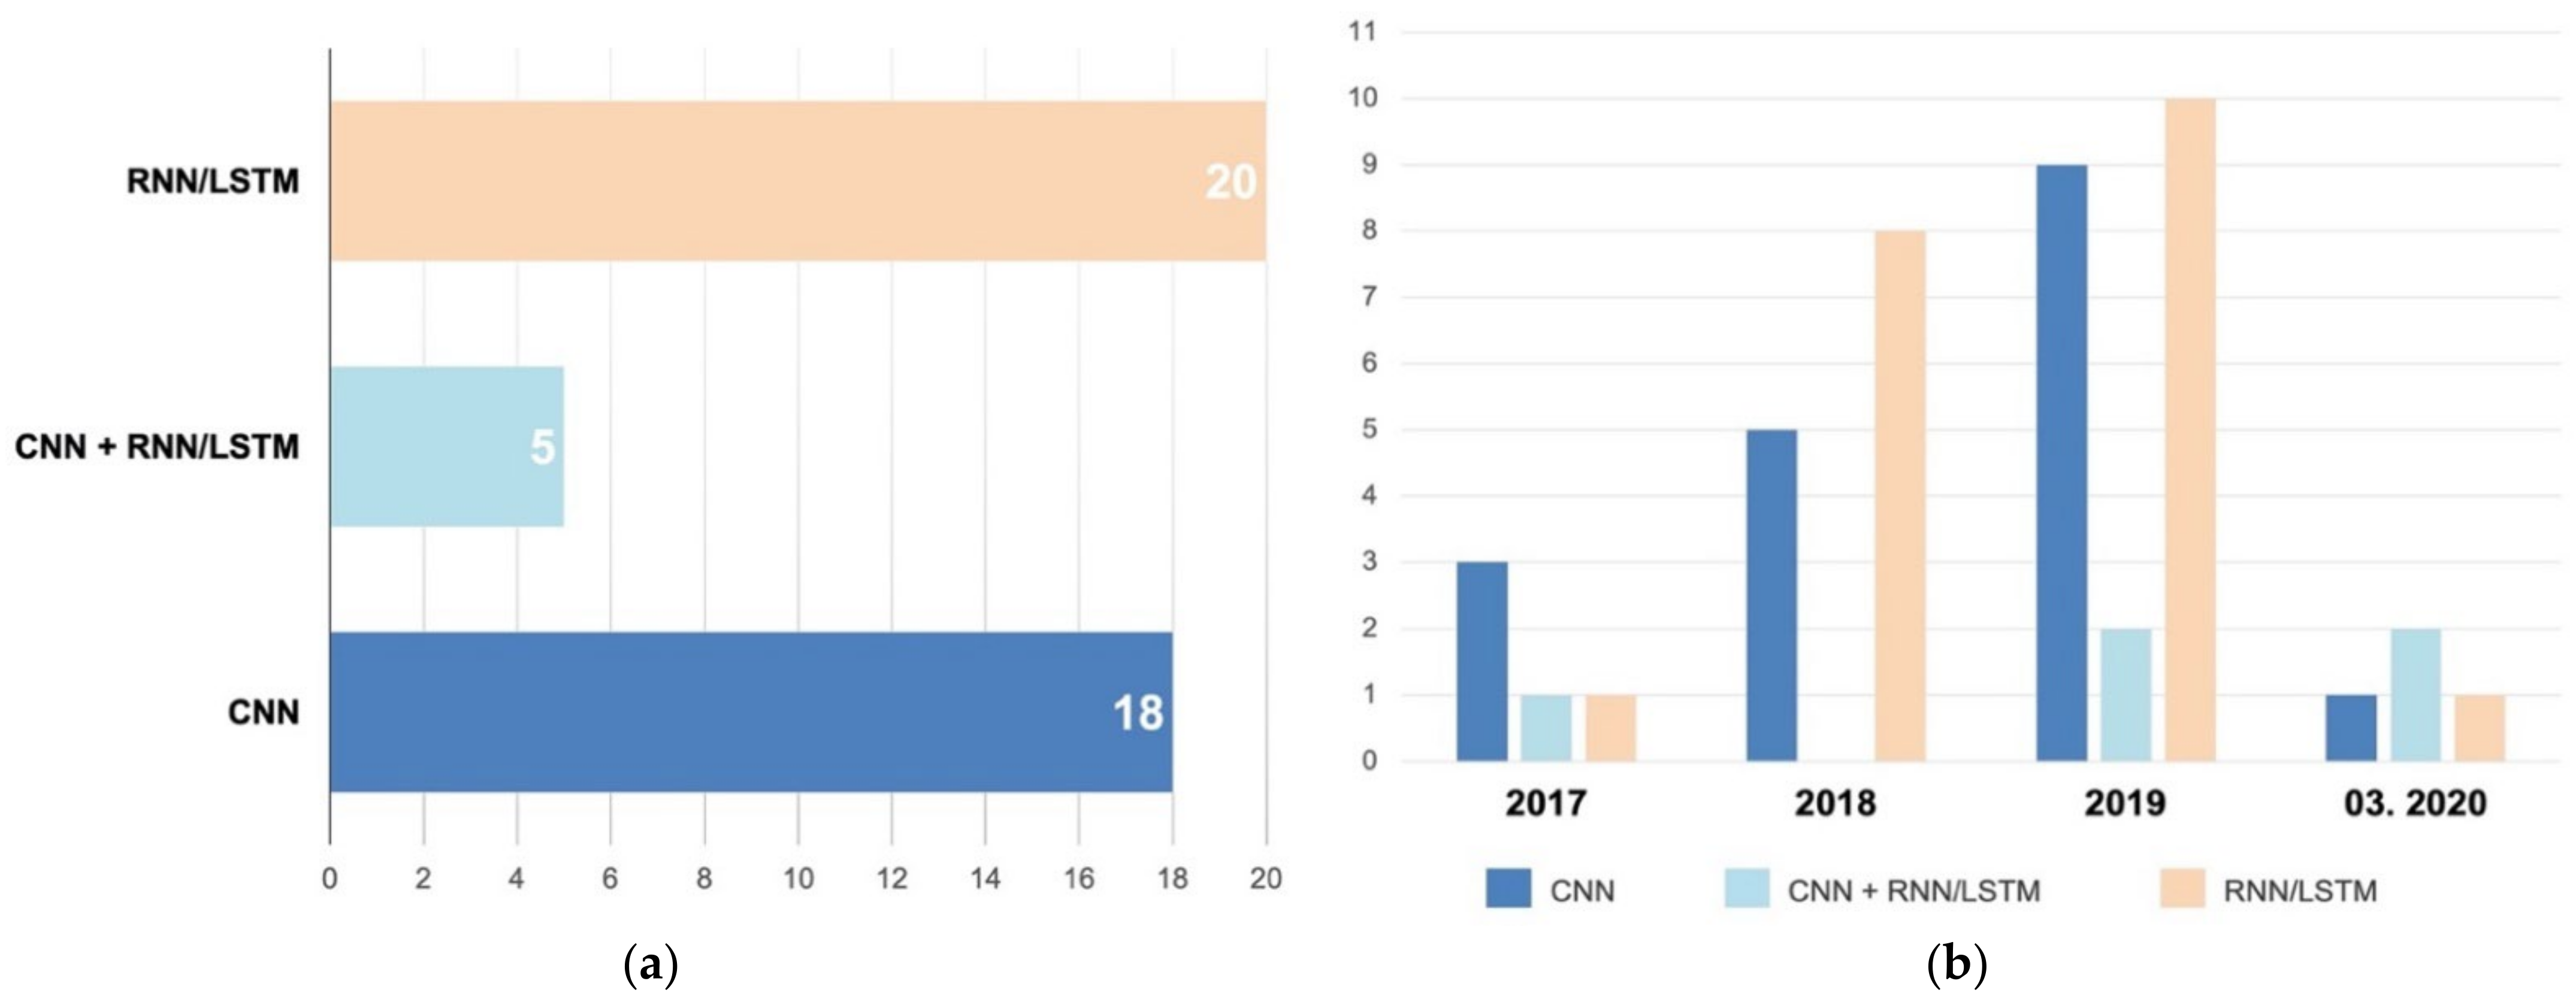
First, keyword analysis was performed. All 43 studies were found to have keywords. In this process, the full names of CNN, RNN, and LSTM were modified to their acronyms to prevent the dispersion of keywords and then analyzed. The keyword map was created based on keyword data using the VOS viewer program. First, the density of keywords is shown in Figure 2. In addition to the terms of CNN, RNN, LSTM, and Smart homes, the keywords related to the functions of smart homes such as activity recognition, energy management, automation, identification, fall detection, security, and sensors appear repeatedly.
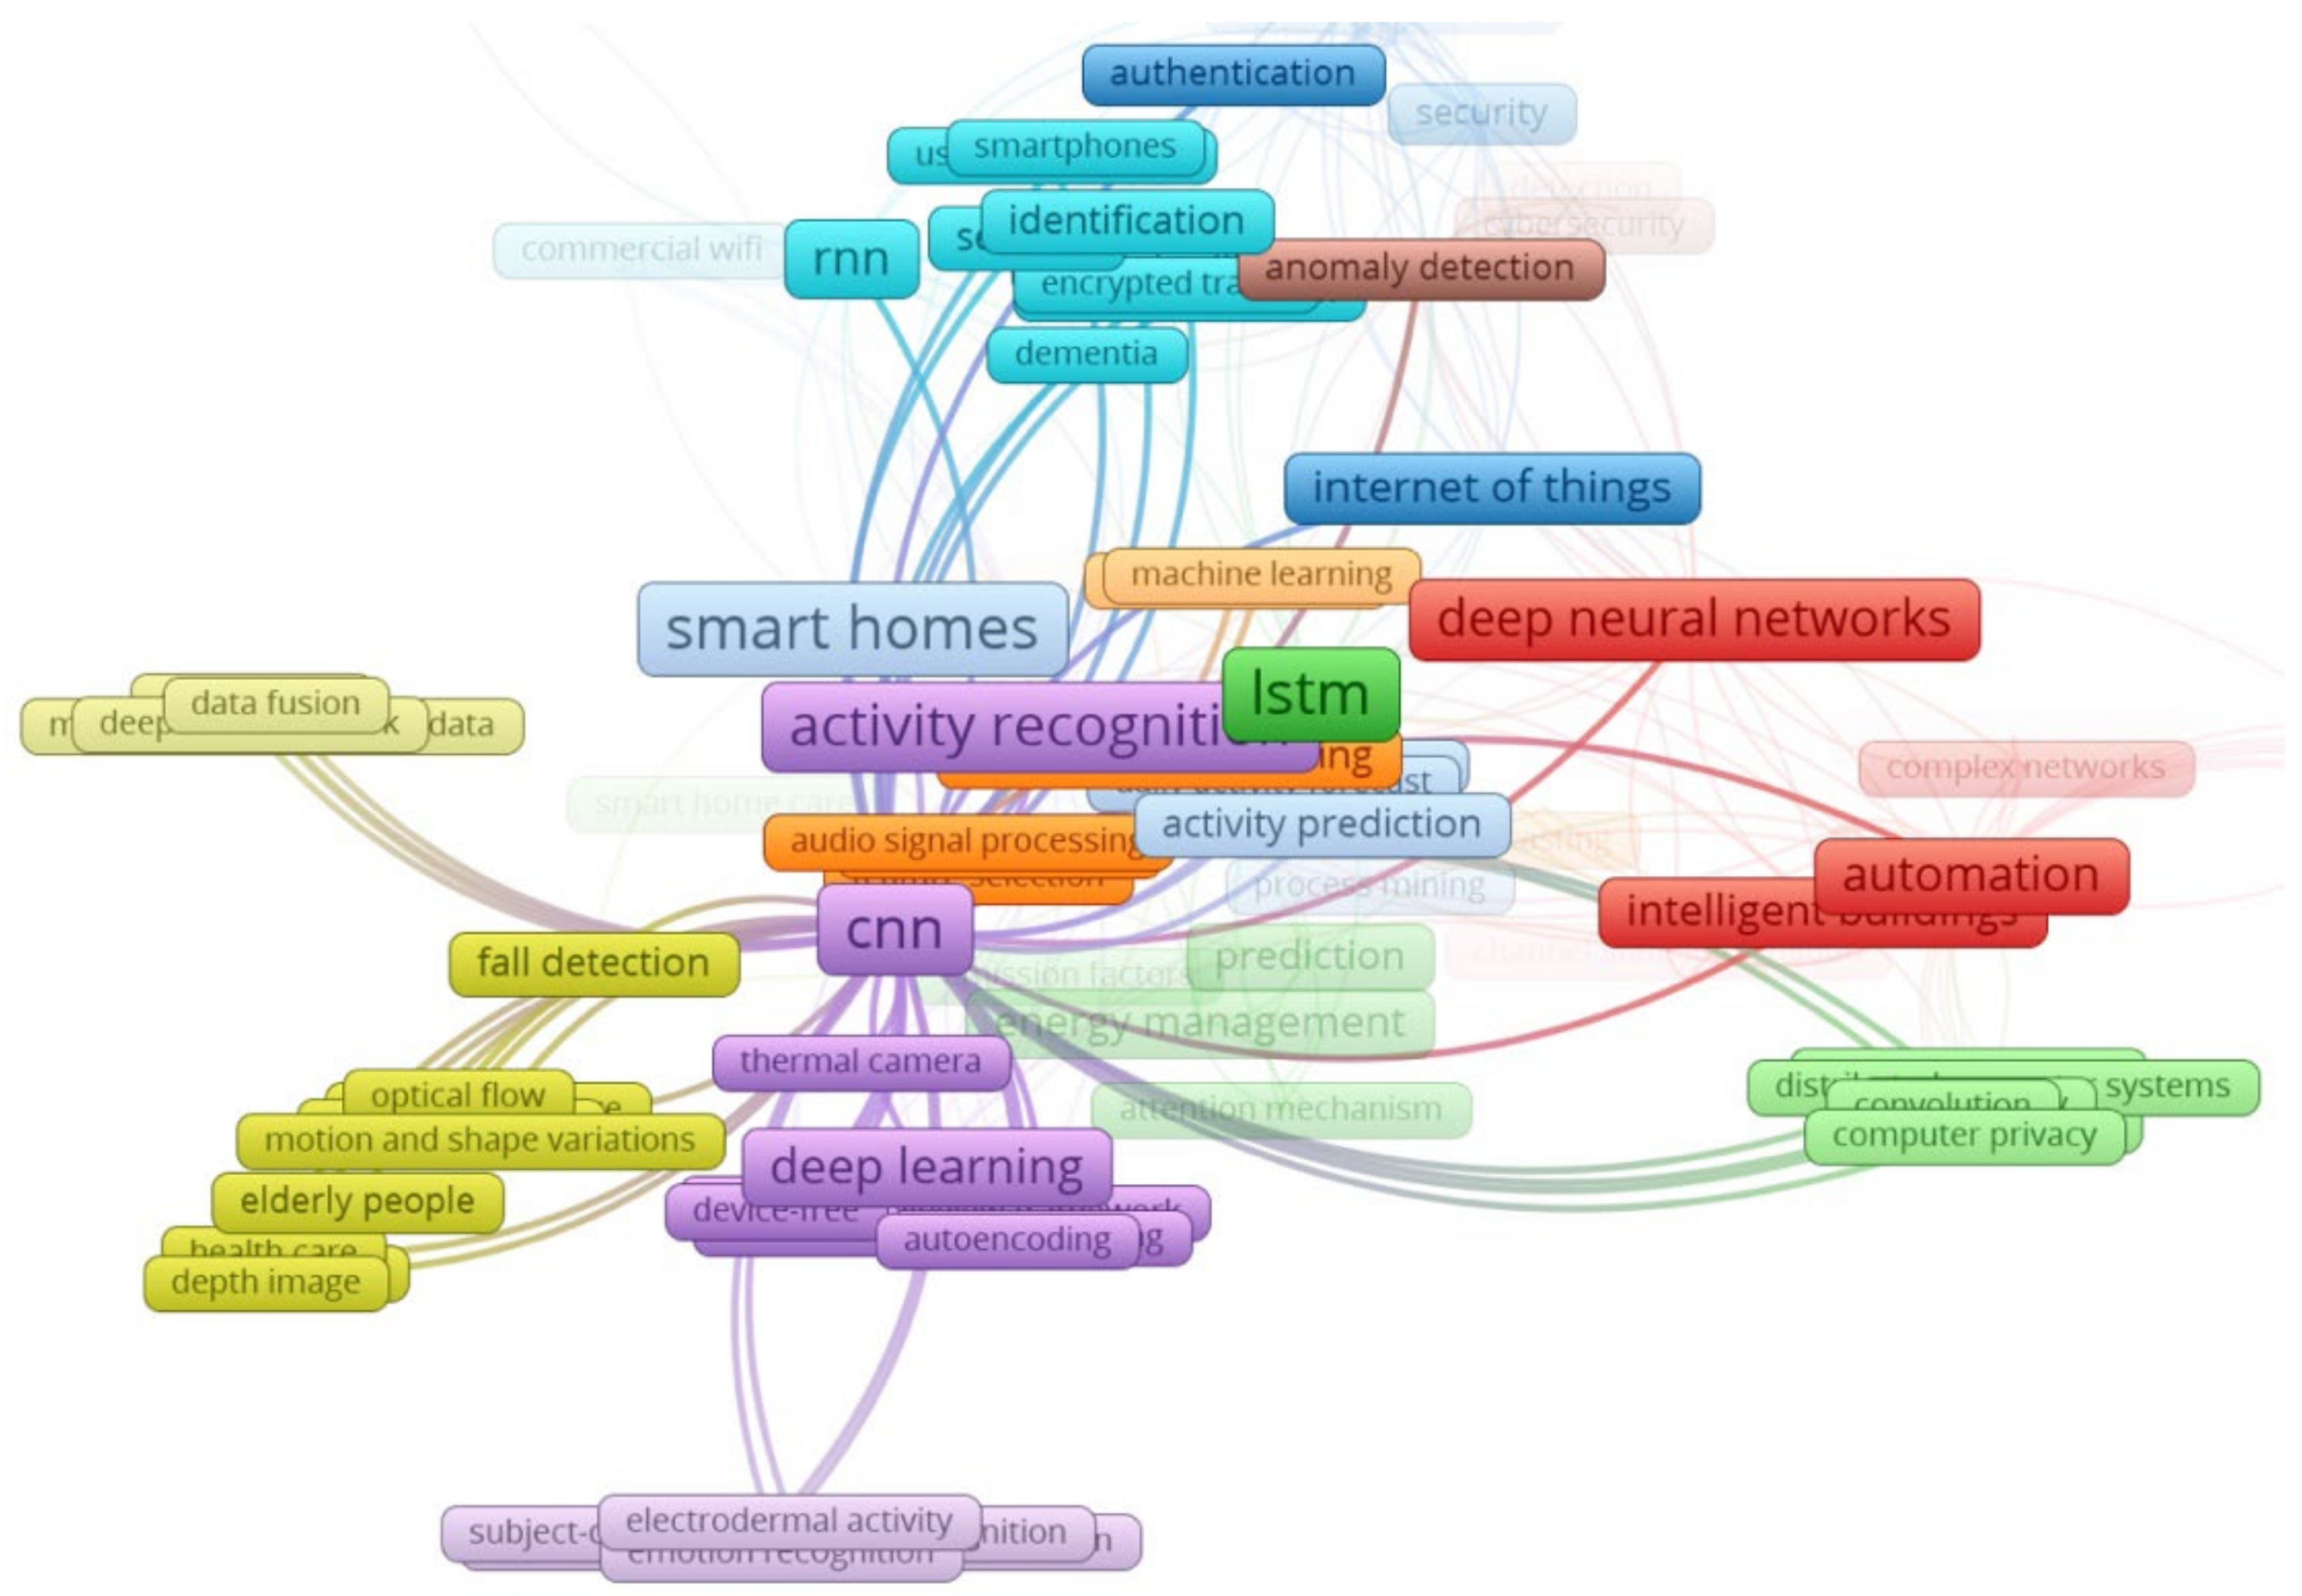
Figure 3, Figure 4 and Figure 5 show the network of keywords for each DL type. The most diverse associations are shown by CNN-related keywords, which include the following terms: Activity recognition, Fall detection, Automation, Hand detection, Elderly people, and Identification.
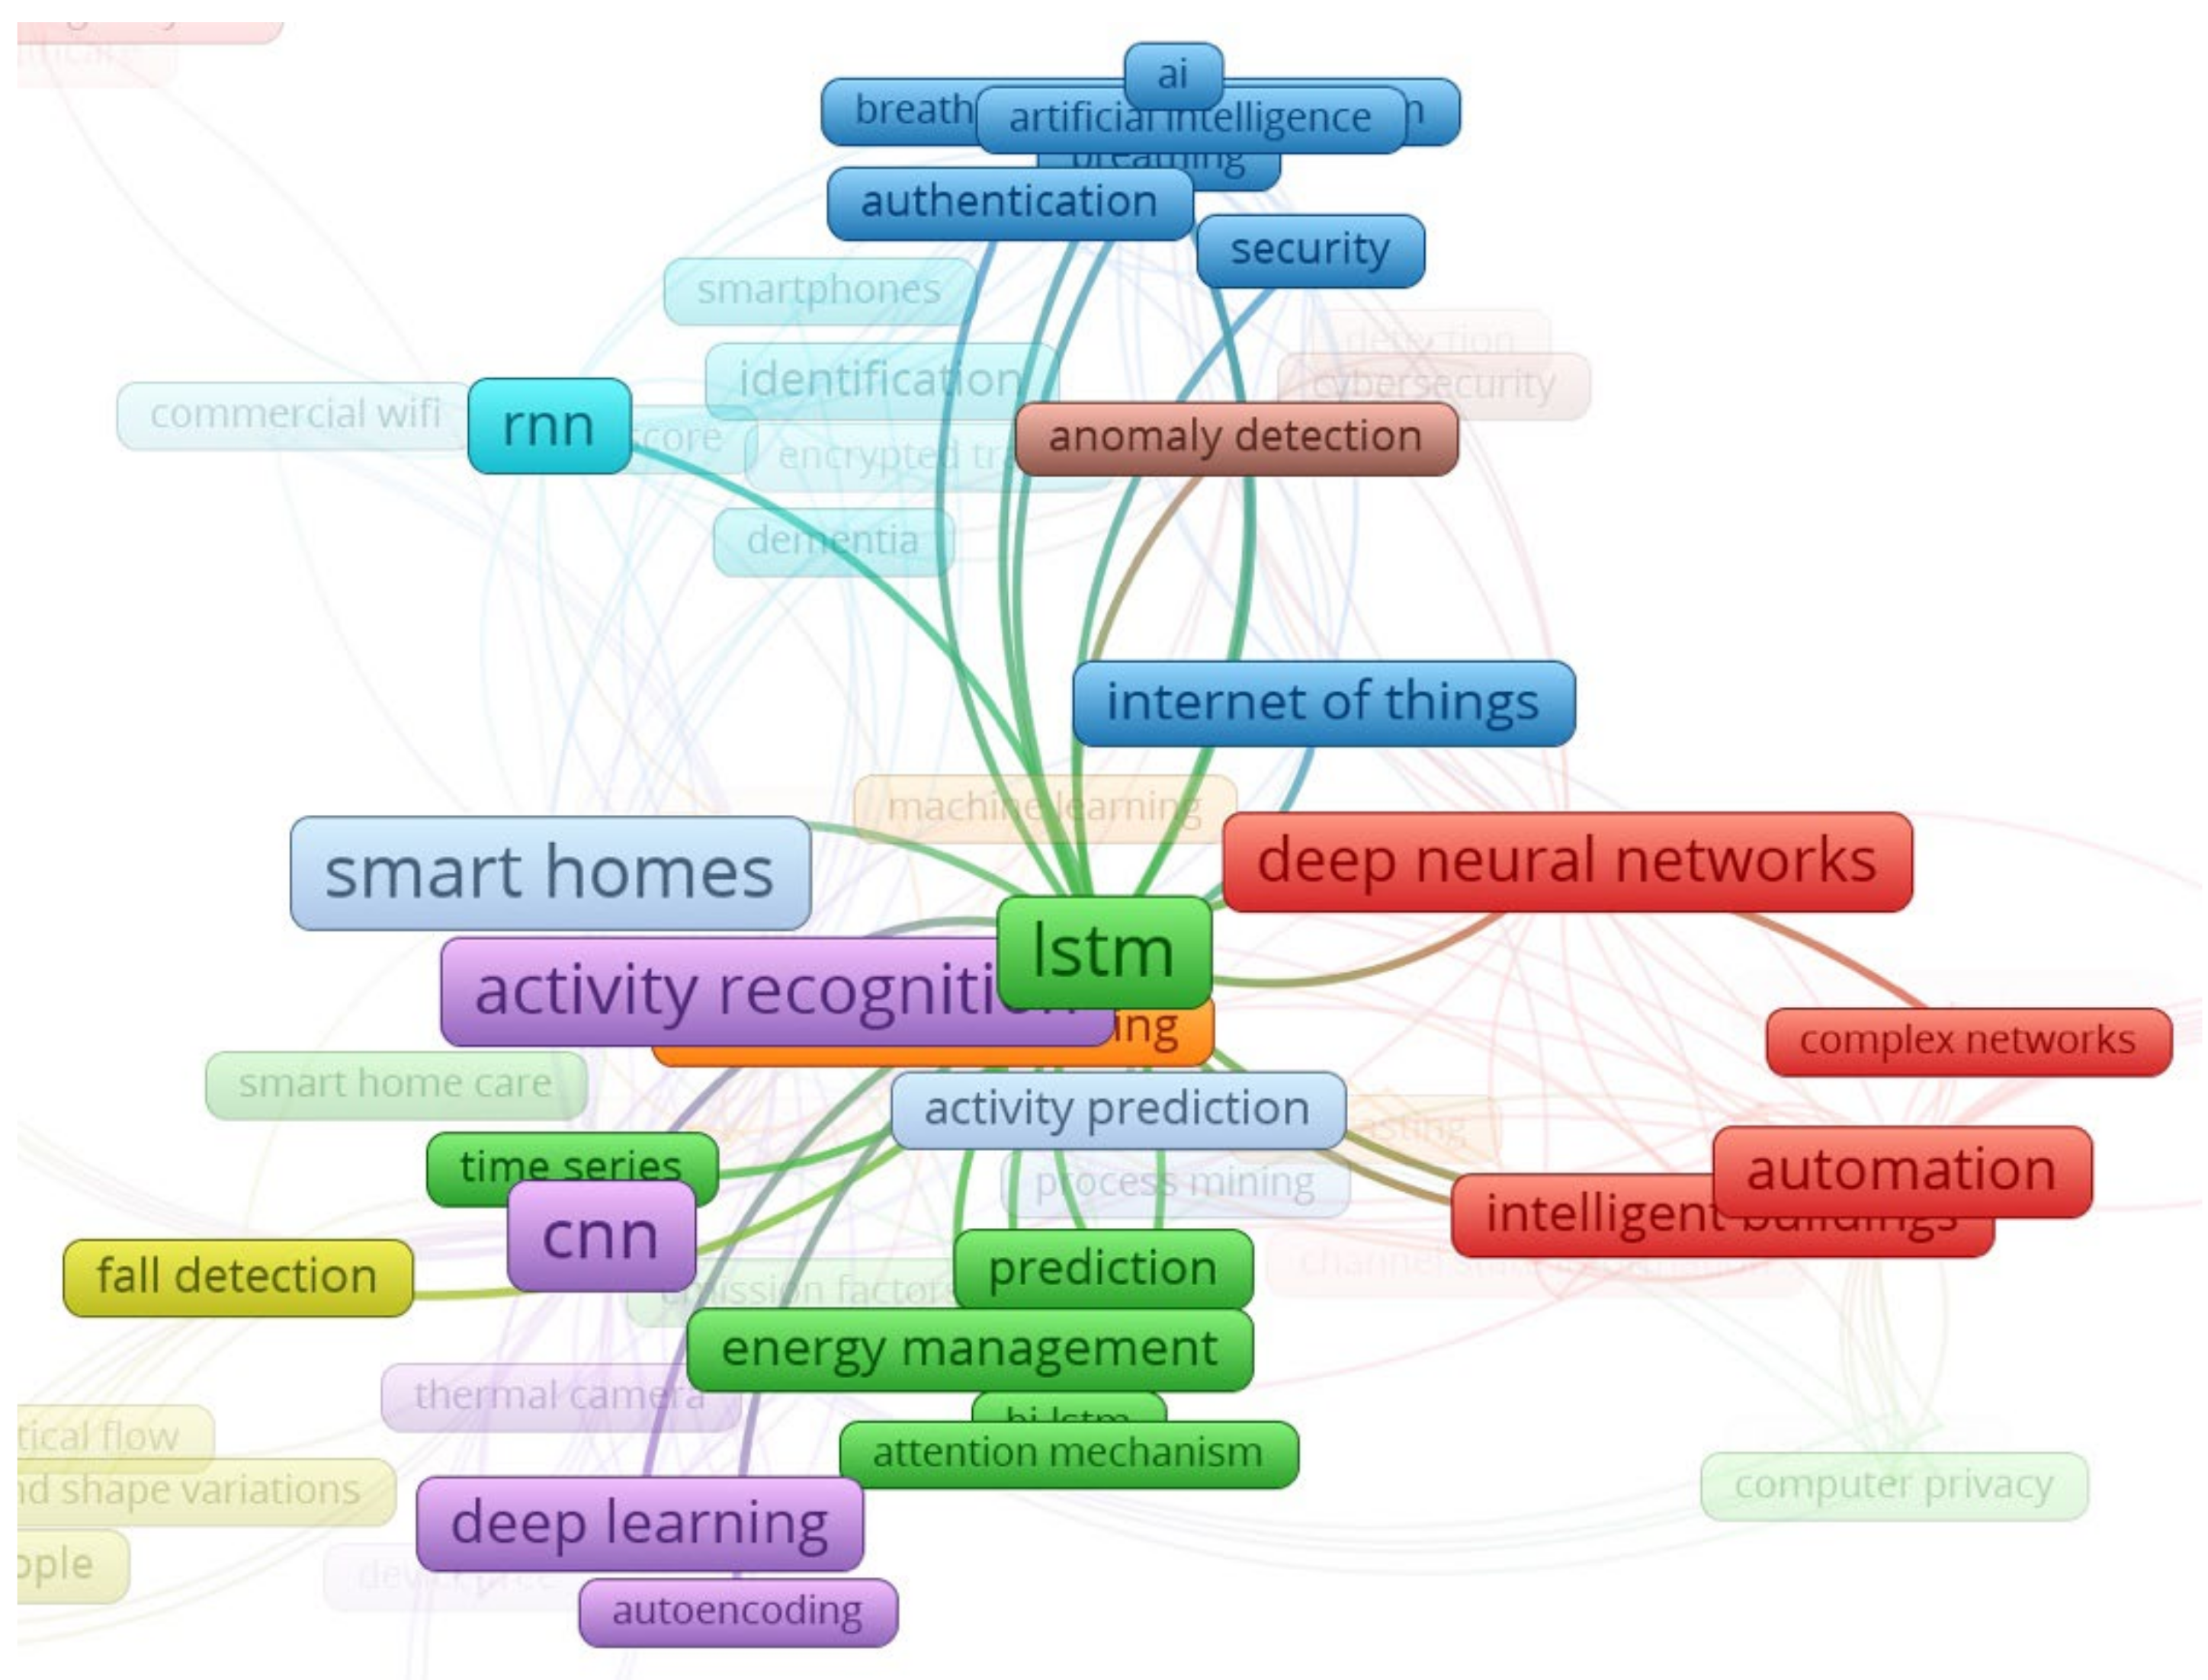
The keywords related to RNN include LSTM, Authentication, Activity recognition, and Anomaly detection, and the keywords related to LSTM include Energy management, Activity recognition, Authentication, and Automation. It can be seen that each of the models’ keywords is slightly different.
Sherstinsky [31] stated in March 2020 that RNN includes the LSTM network as a special case. Thus, from now on, we used, as a unit for analysis, RNN/LSTM instead of dealing with them separately, except when specifically mentioning the models.
Second, the distribution of research by year and the distribution by DL type were examined (Figure 6). There have been some search results from 2016, although few studies were conducted in 2016 and none of the 2016 studies were included in the final 43 studies. The number of studies related to this topic has been growing every year since 2017. Moreover, it can be observed that RNN/LSTM research related to smart homes has been more actively conducted in recent years.
3.2. RQ2: What Are the Smart Home Services Where CNN or RNN/LSTM Are Employed?
This section presents the purpose of primary studies, the applied DL model, category, and developed application (Table 5). The column ML/DL model shows the applied DL and ML models, and whenever functions in DL algorithms were mentioned, the functions are also detailed: Loss function (L), Activation function (A), Optimizer (O). The scope of its contents is shown in the Category column. Specific smart home services considered can be seen in the Application column, and the research goal is described in the Objective column.
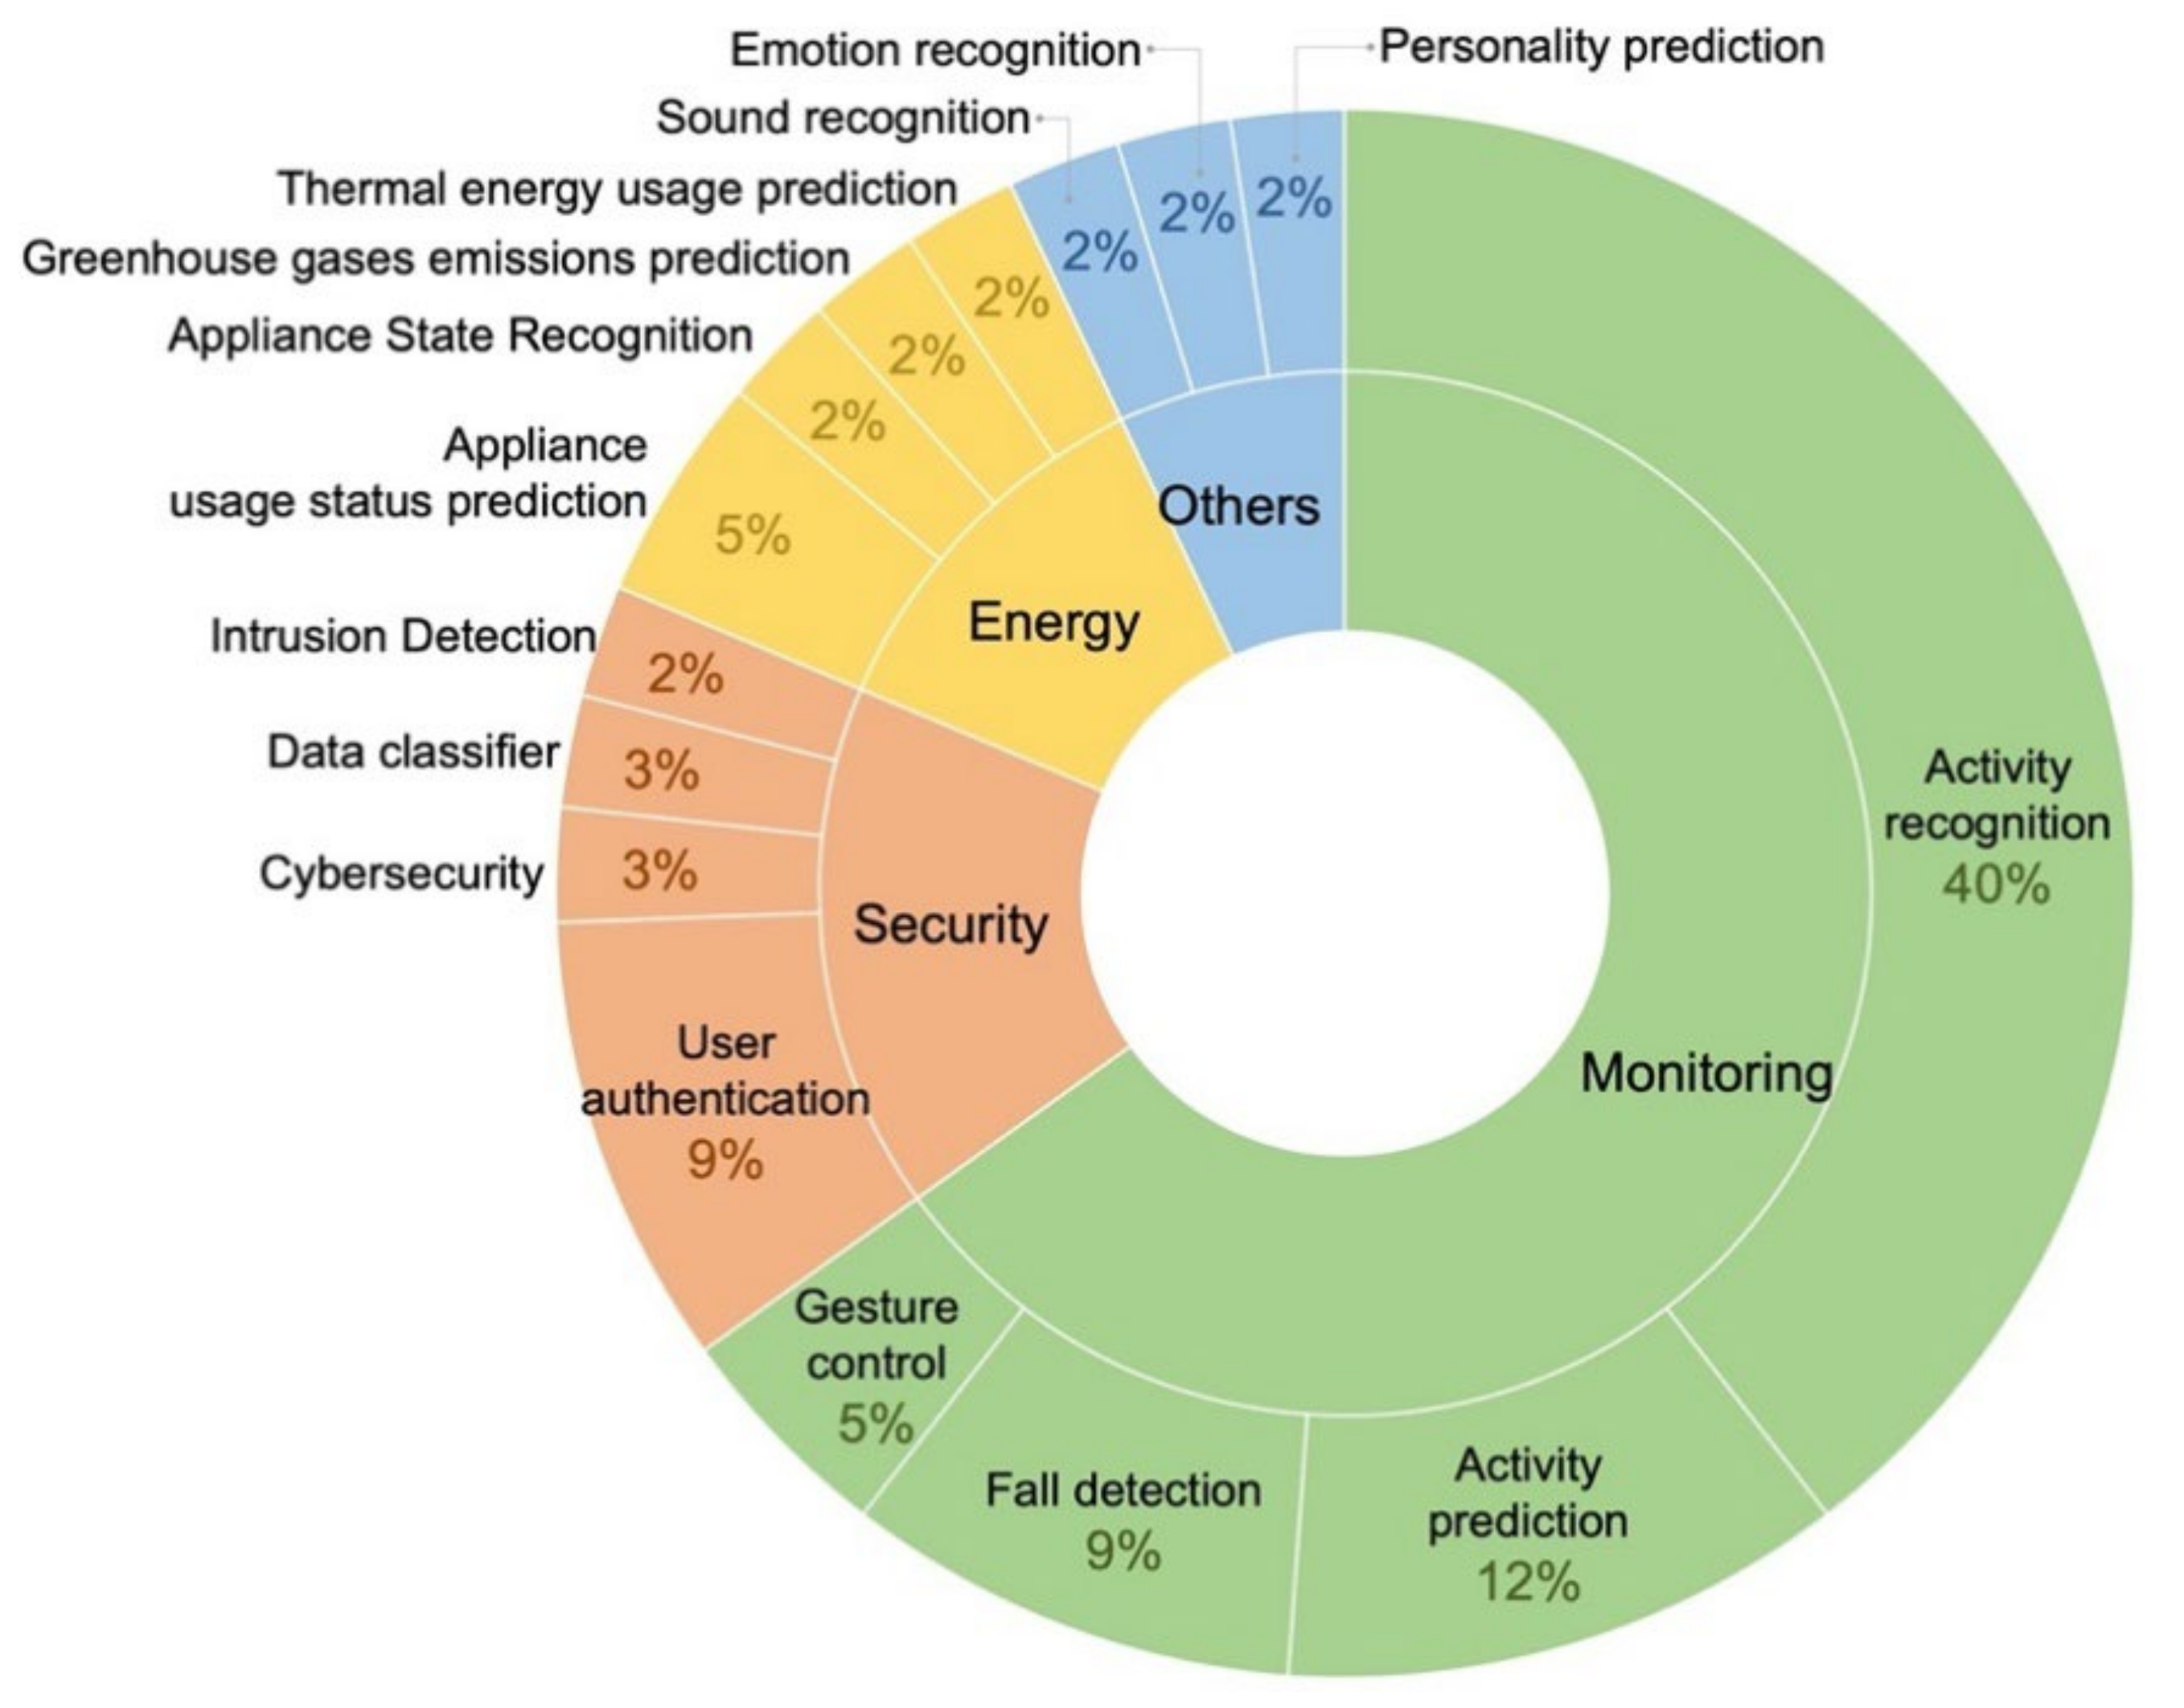
The analysis of smart home services shows that the monitoring category, made up of activity recognition, activity prediction, fall detection, and gesture control, accounted for the largest percentage of the total (66%), followed by the security category with 17% and the energy management category with 11%, as shown in Figure 7.
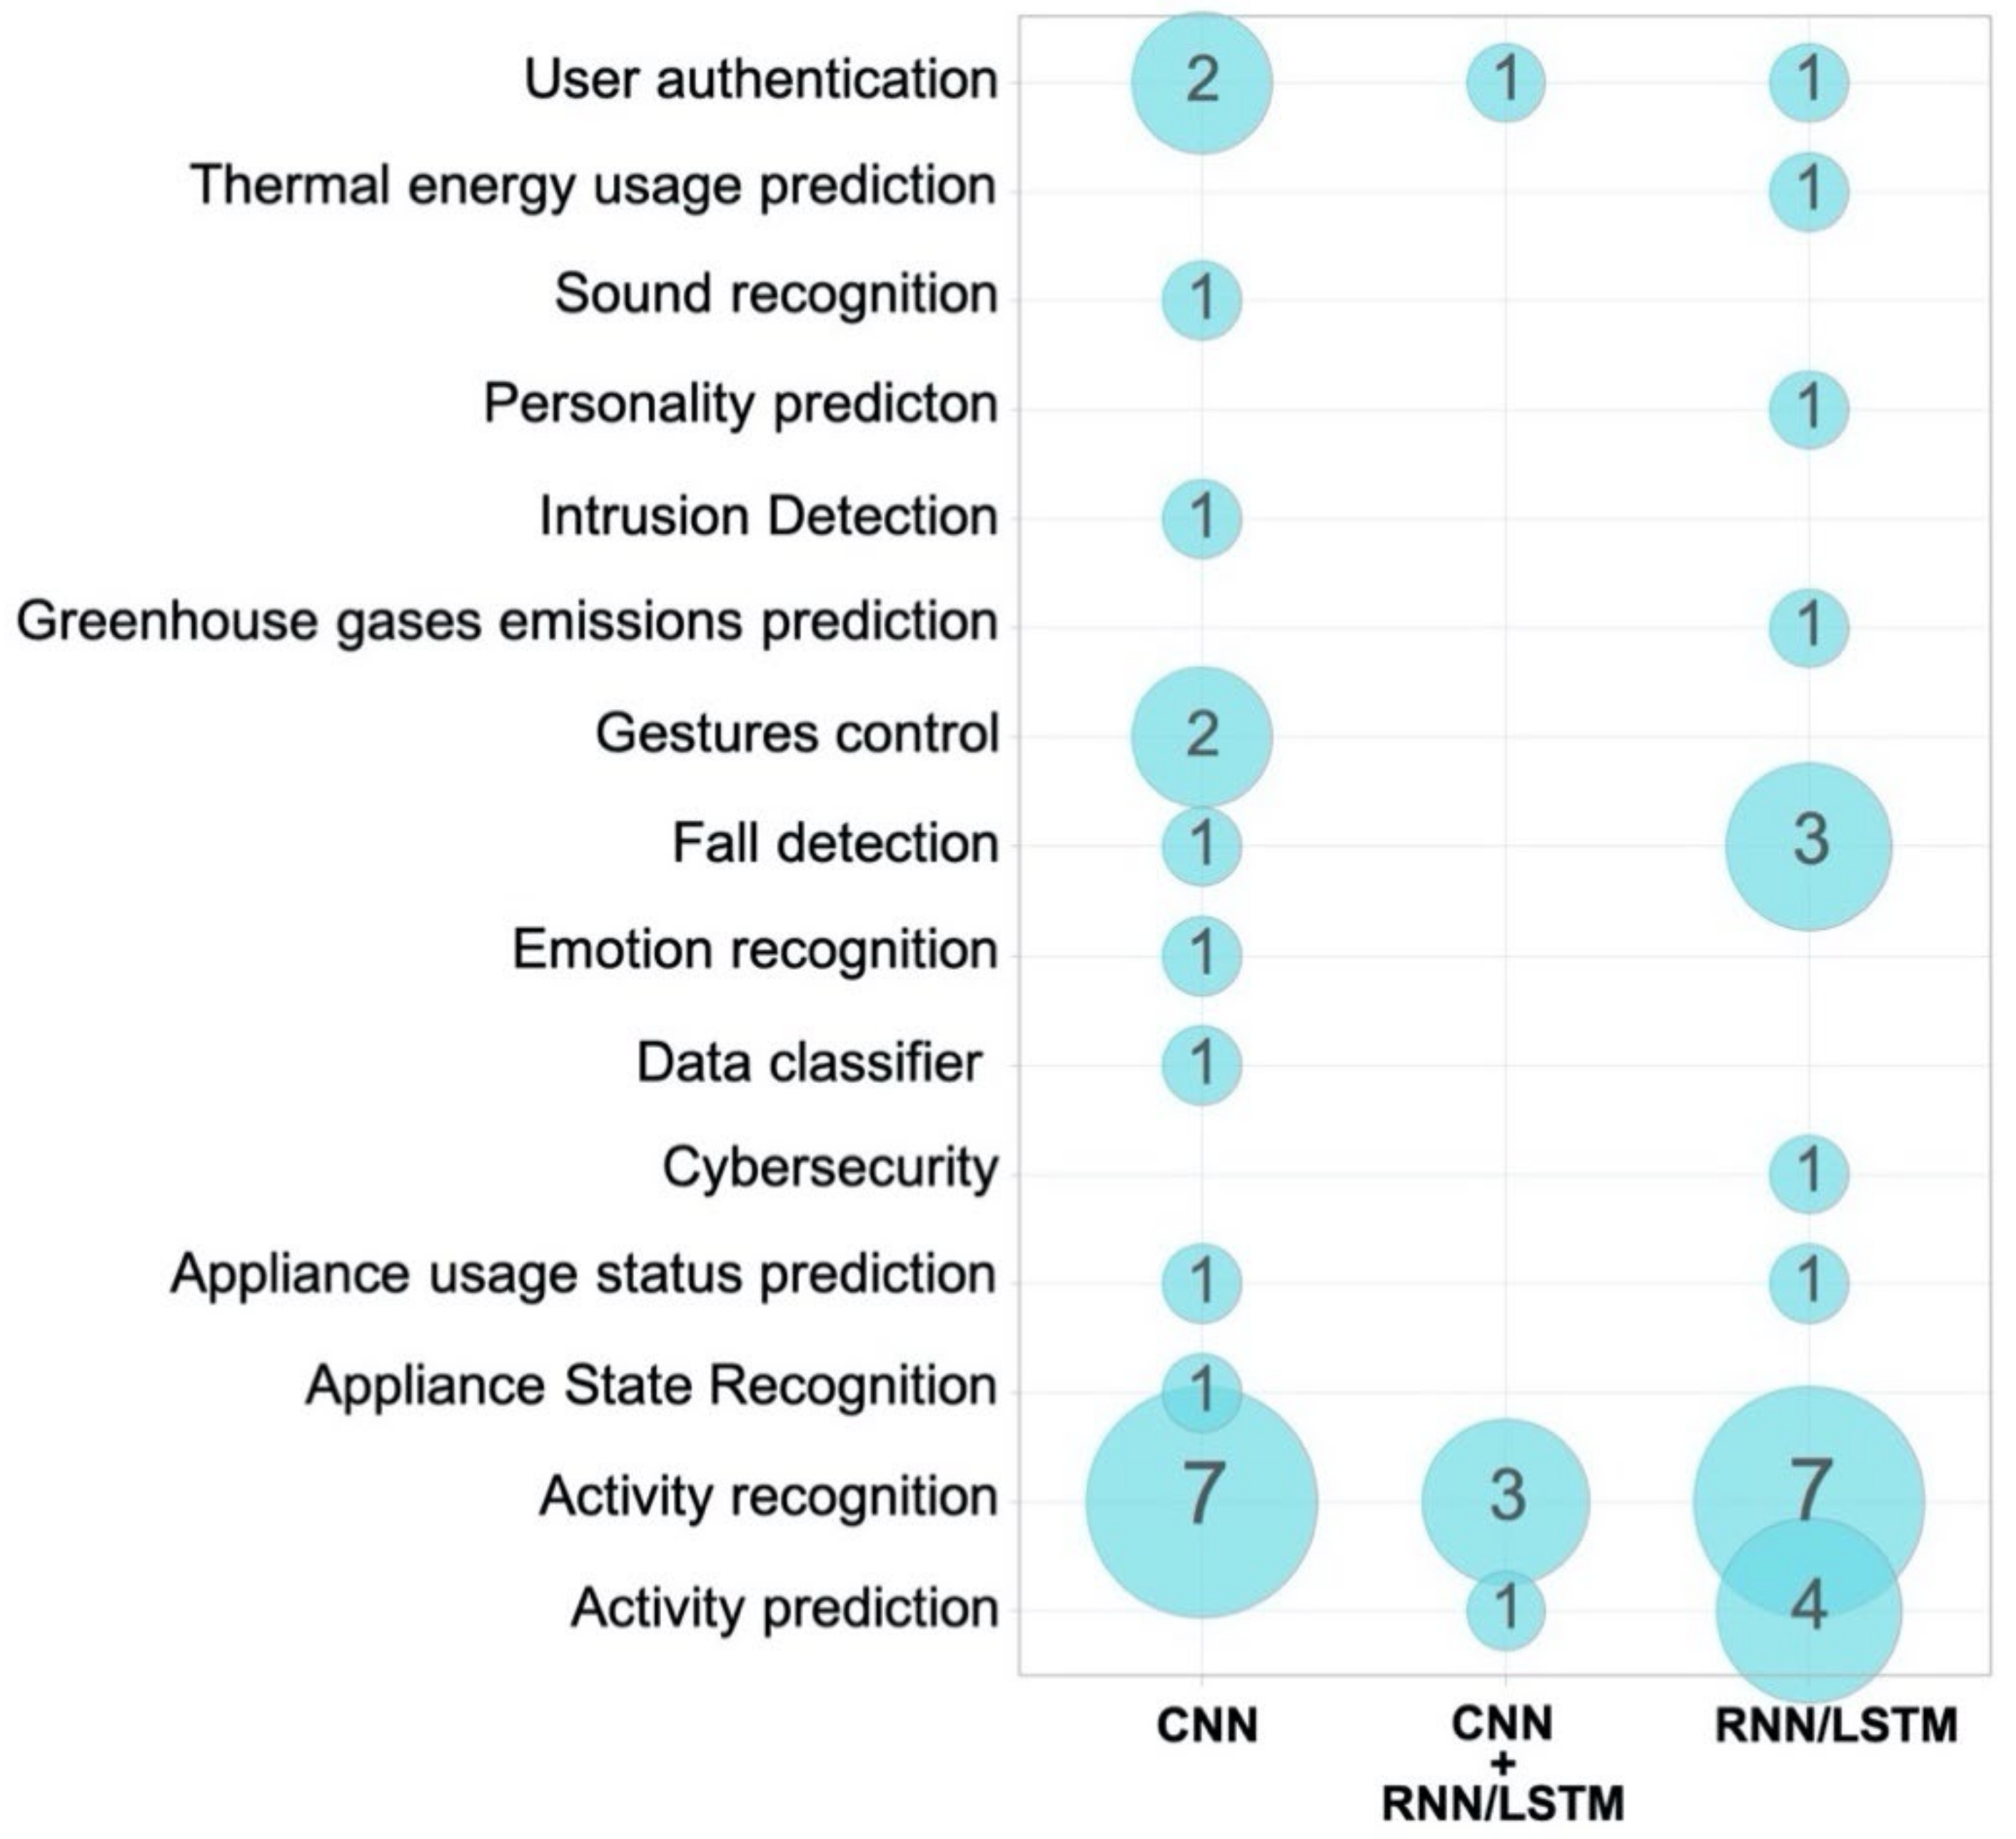
Figure 8 details the smart home services in which each DL model has been applied. Activity recognition is the most frequently studied field where smart home research has been conducted with CNN and RNN/LSTM. In some cases, CNN has been applied for gesture control and user authentication. On the other hand, since RNN and LSTM treat sequential data, they have been applied in a number of activity prediction studies based on current behavior. There have also been specific studies for fall detection, thermal energy usage prediction, and green gasses emission prediction with RNN/LSTM.
The most studied application is activity recognition. Since activity recognition learns and classifies images or patterns, it is important to consider the method of collecting images or data. Sometimes the data were collected with a depth camera consisting of RGB-D sensors [18]; another study employed a thermal camera capable of recognizing actions regardless of day or night [35]; in a study that implemented gesture recognition for smart home automation [41], they used Channel State Information (CSI) time-series data generated by performing gestures in front of a Wi-Fi router instead of a camera. The techniques for activity recognition are mainly based on supervised learning that matches and classifies data and designates labels of activities. However, in the case of the study of Hsueh et al. [45], they first generated labels with a stacked convolutional autoencoder and automatically classified the generated labels with K-means, and then the activity recognition classification was implemented with CNN and LSTM. Applying unsupervised learning techniques such as autoencoder and K-means for auto labeling was different from other studies. Arifoglu and Bouchachia [22] tested the performance of convolutions with different dimensions and architectures (1D Convolution/2D Convolution/2D CNN + LSTM) to detect abnormal behavior for dementia. From their study, they concluded that LSTM is more suited for detecting abnormal signs because it can relate current inputs to next ones and that CNN is better at detecting “confusion-related activities”.
Because RNN/LSTM can deal with sequential data, it has been used not only to recognize and classify the current behavior but also to predict the next behavior or the time at which the next behavior occurs. In particular, in the case of the study of Kim et al. [55], they used LSTM to recognize 23 activities of 7 participants and predict their next behavior in a multi-user smart space. Understanding the domain of smart homes and considering a multi-user environment was different from other studies.
3.3. RQ3: How Is Dataset Collected, Analyzed, and Used by Each Study?
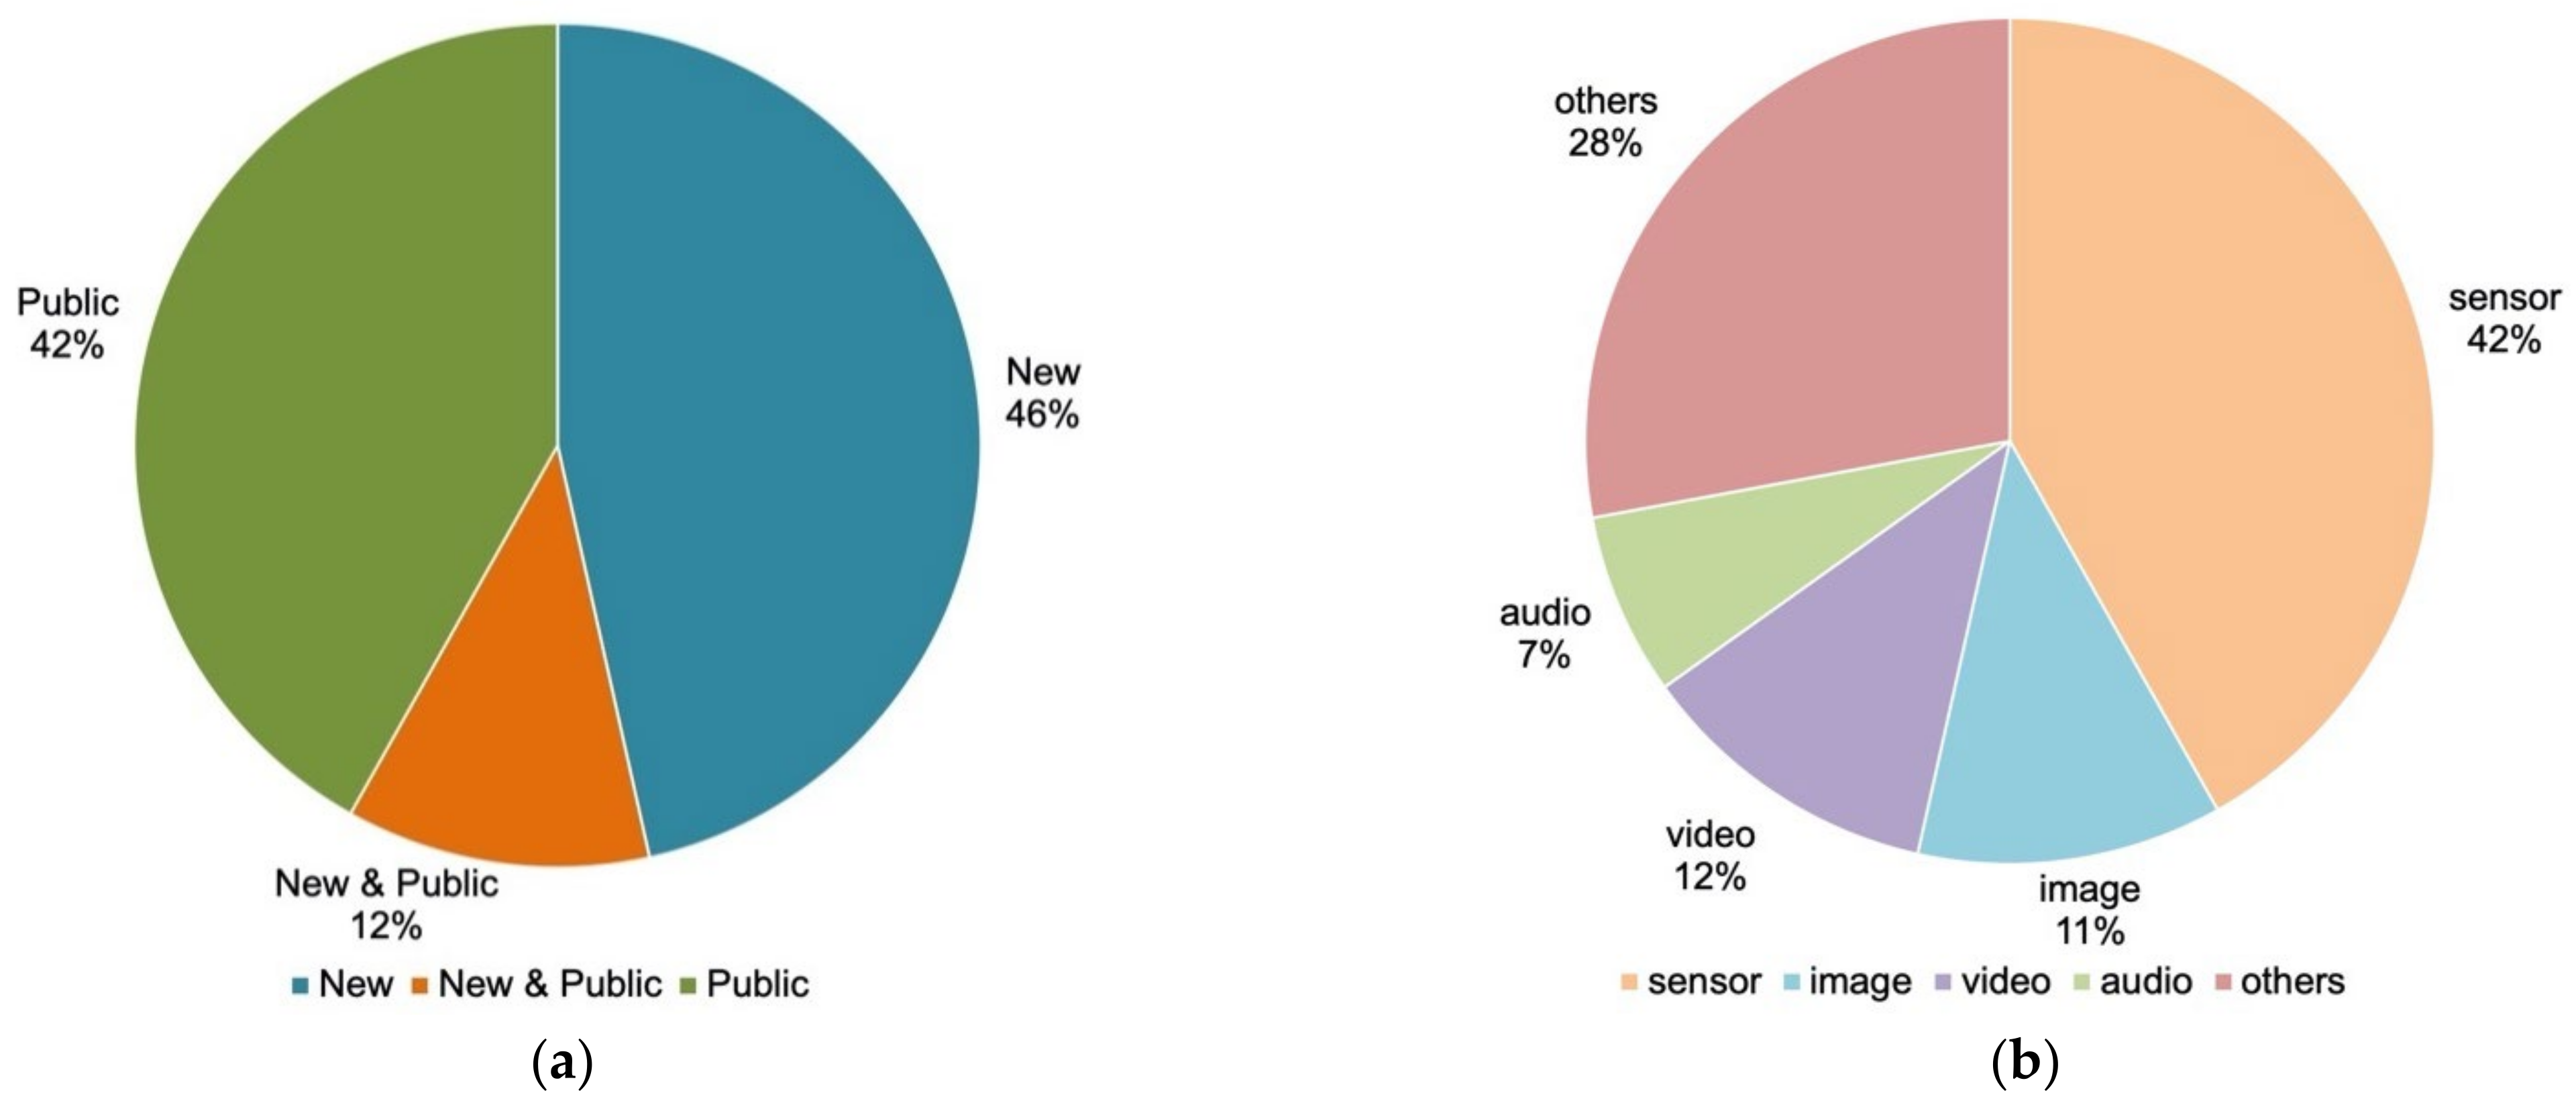
For research question three, the type and composition of data used in each study were compared and analyzed. As shown in Figure 9, 42% of research utilized public datasets, and 46% directly generated data for research. A total of 12% of the studies used the method of testing with public data after training with the data created by themselves or testing the data created by themselves after training with public data. In the public datasets, sensor data are the most common, while the newly created data have various data formats such as videos, images, and sensors.
In particular, many studies of human activity recognition have been conducted using sensor data. PIR sensors, wearable sensors, smartphone internal sensors, etc., were utilized for motion detection. The studies using sensor data can be seen in Table 6.
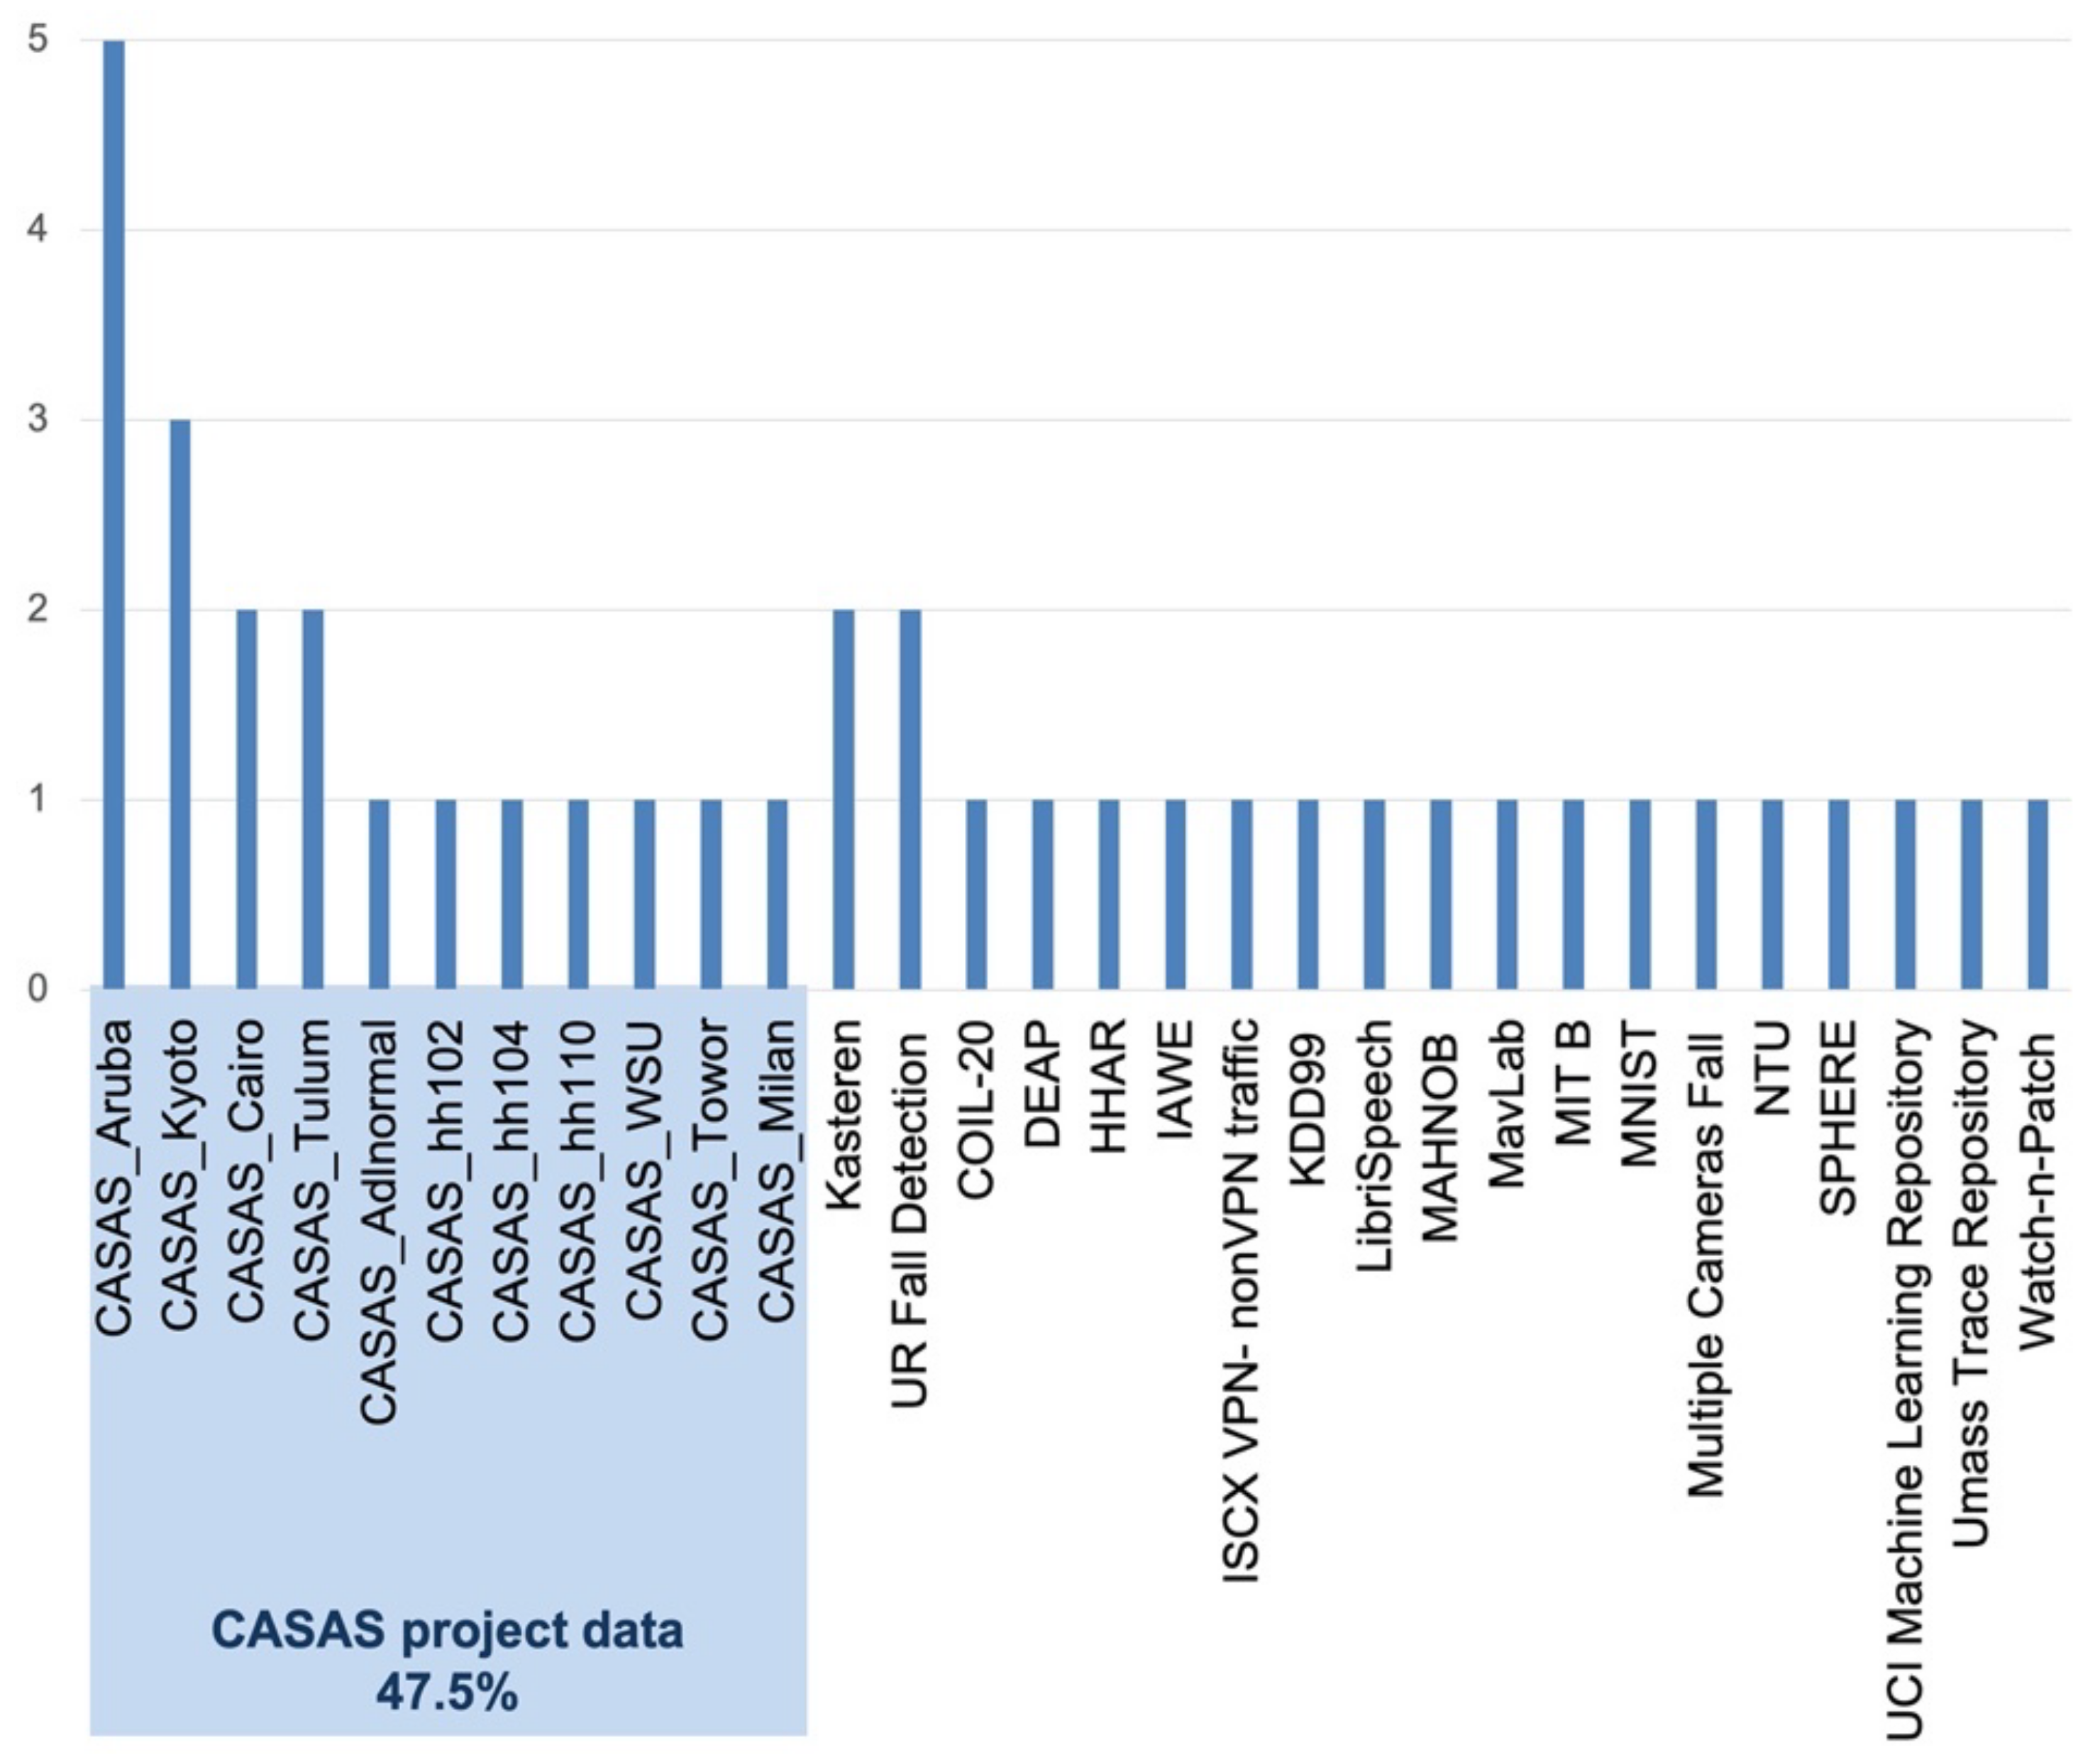
Figure 10 shows the analysis of the public datasets used in the studies using public datasets. In total, 47.5% of the studies used the CASAS project dataset. The most used dataset, Aruba, consists of sensor data collected in a smart home environment with a single older woman. The CASAS project was conducted by Washington State University. Data from 32 smart home testbeds are provided as datasets for various residents, and these sensor data from smart home technology were shared for anyone to use [69]. Moreover, van Kasteren, SPHERE, MNIST, COIL-20, UCI, and Watch-n-Patch were used as public data for activity recognition research.
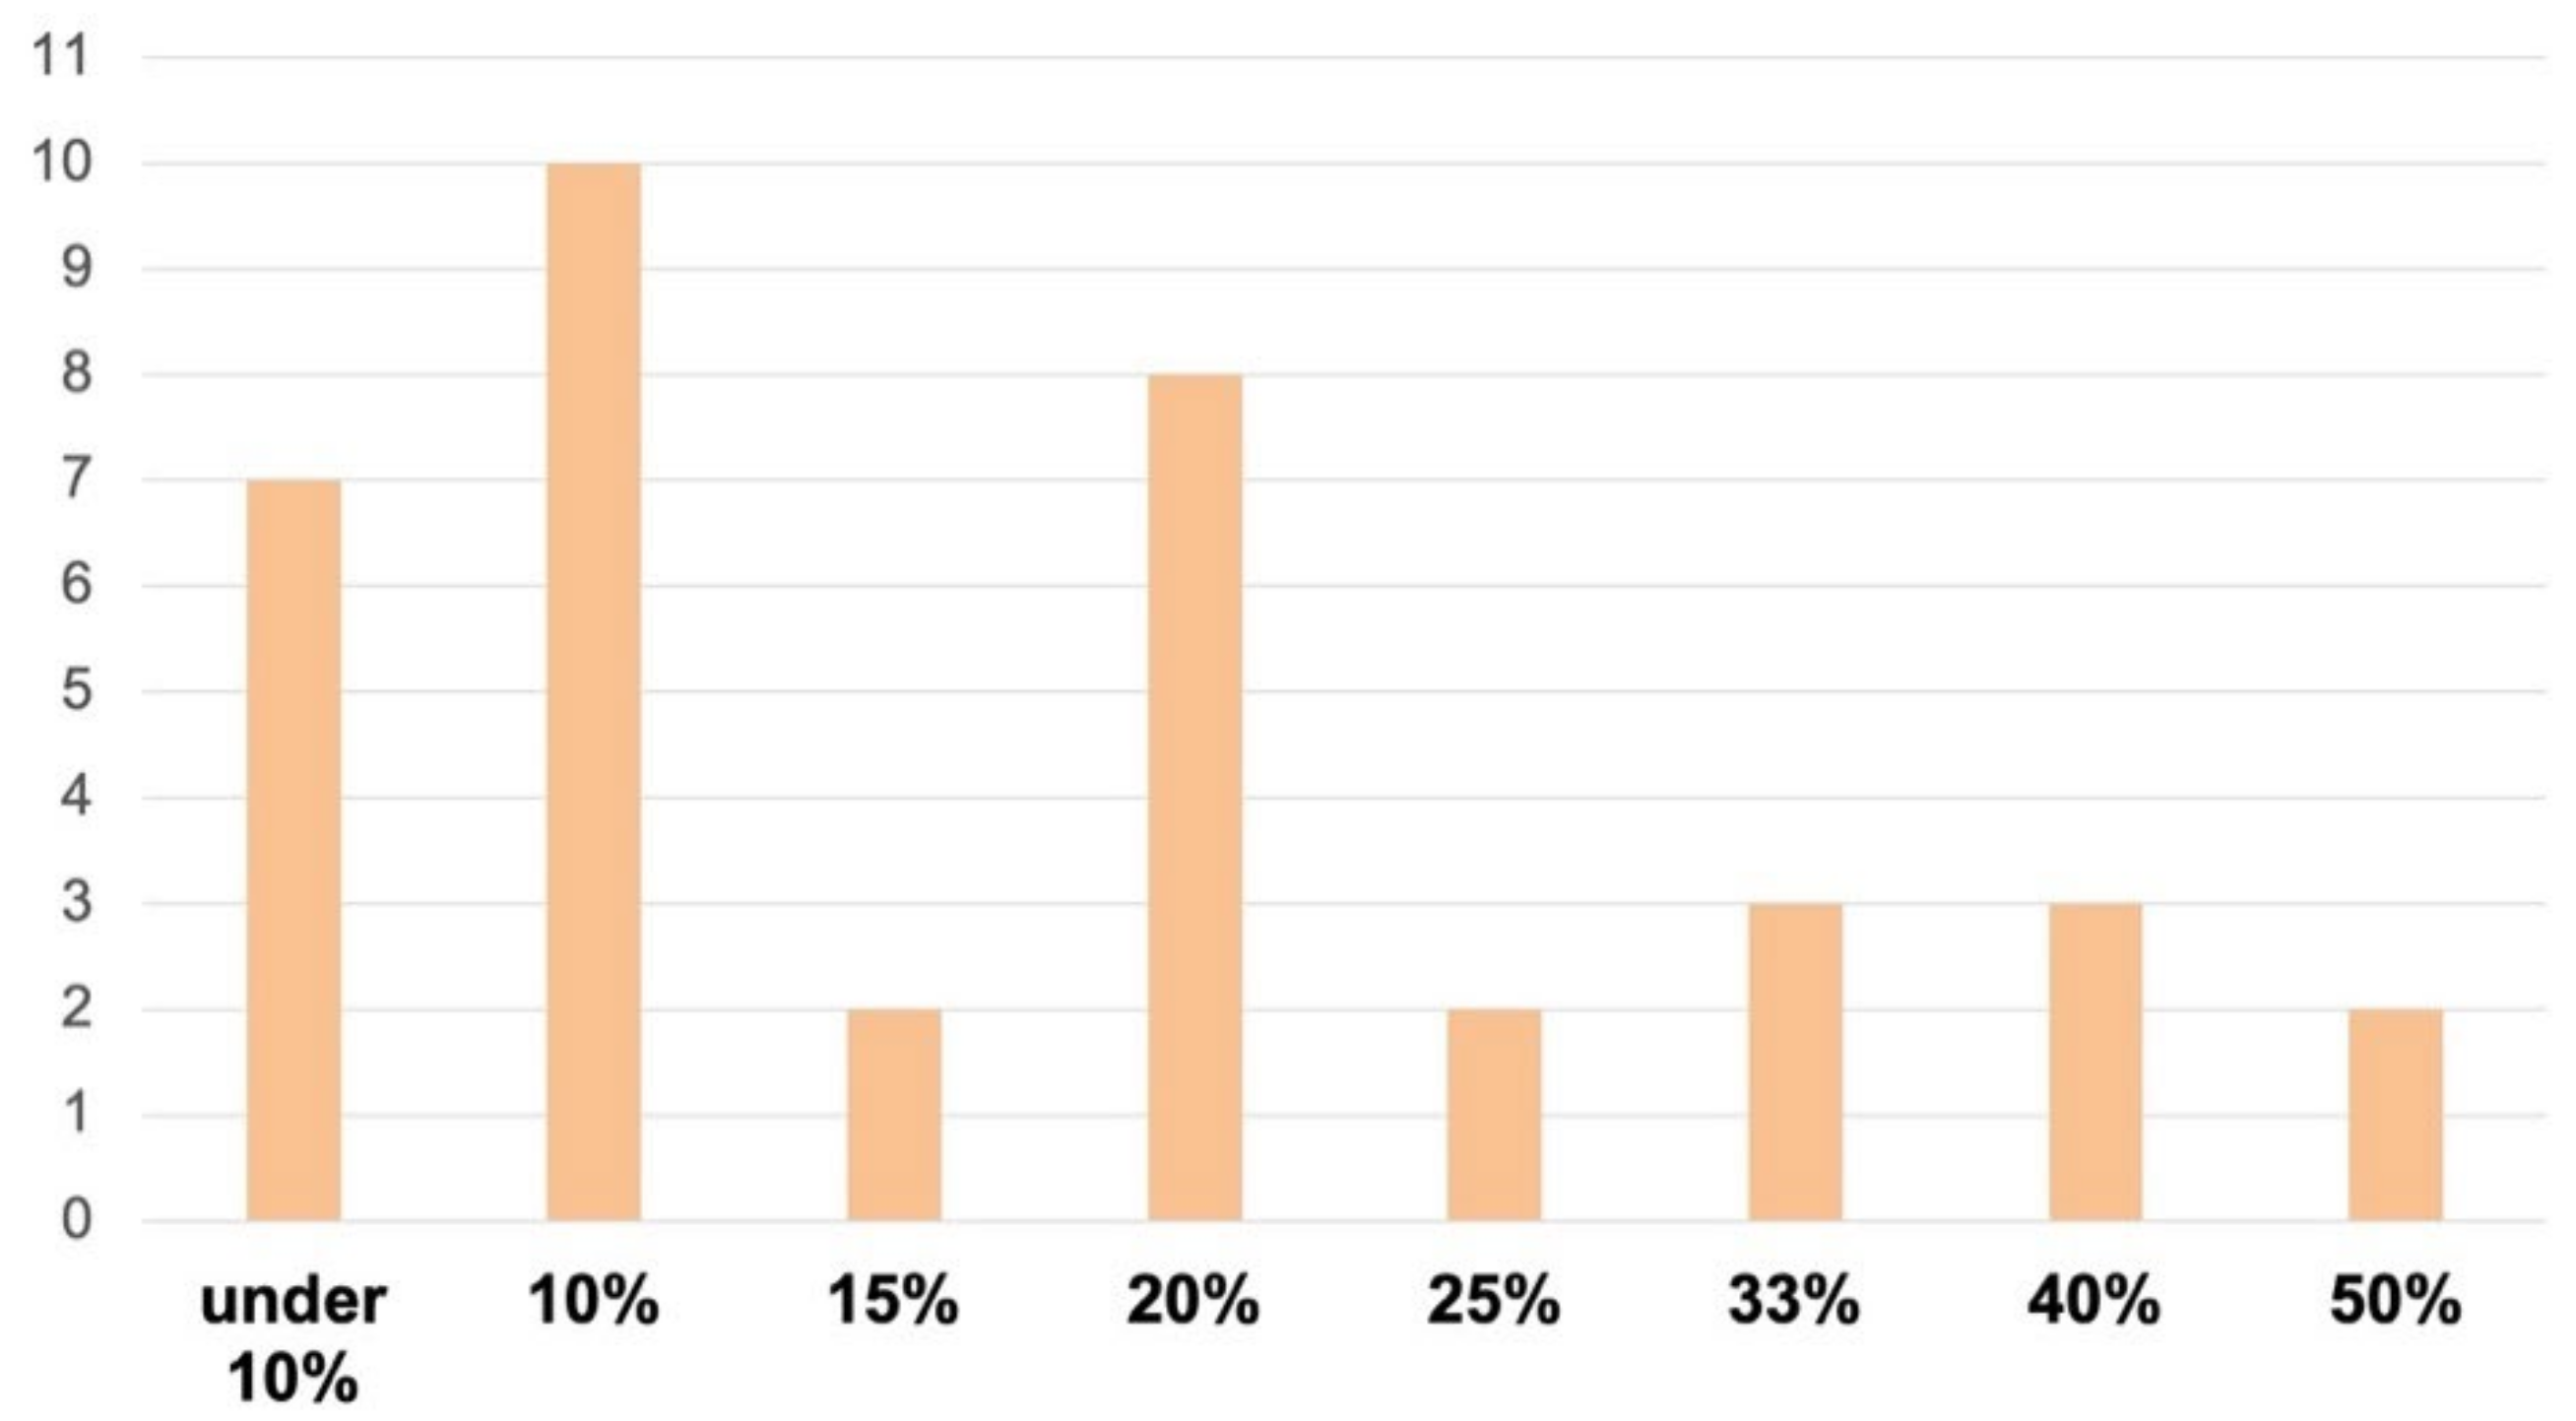
In Figure 11, the distribution of the testing/training data ratio is displayed. Most of the studies consisted of a training set and a test set, and the partitioning ratio was mentioned. The most used testing rate was 10% for 90% of training, and the second most common rate was 20%, while testing rates of less than 10% were also frequently used.
3.4. RQ4: How Is the Result of Each Applied DL Evaluated?
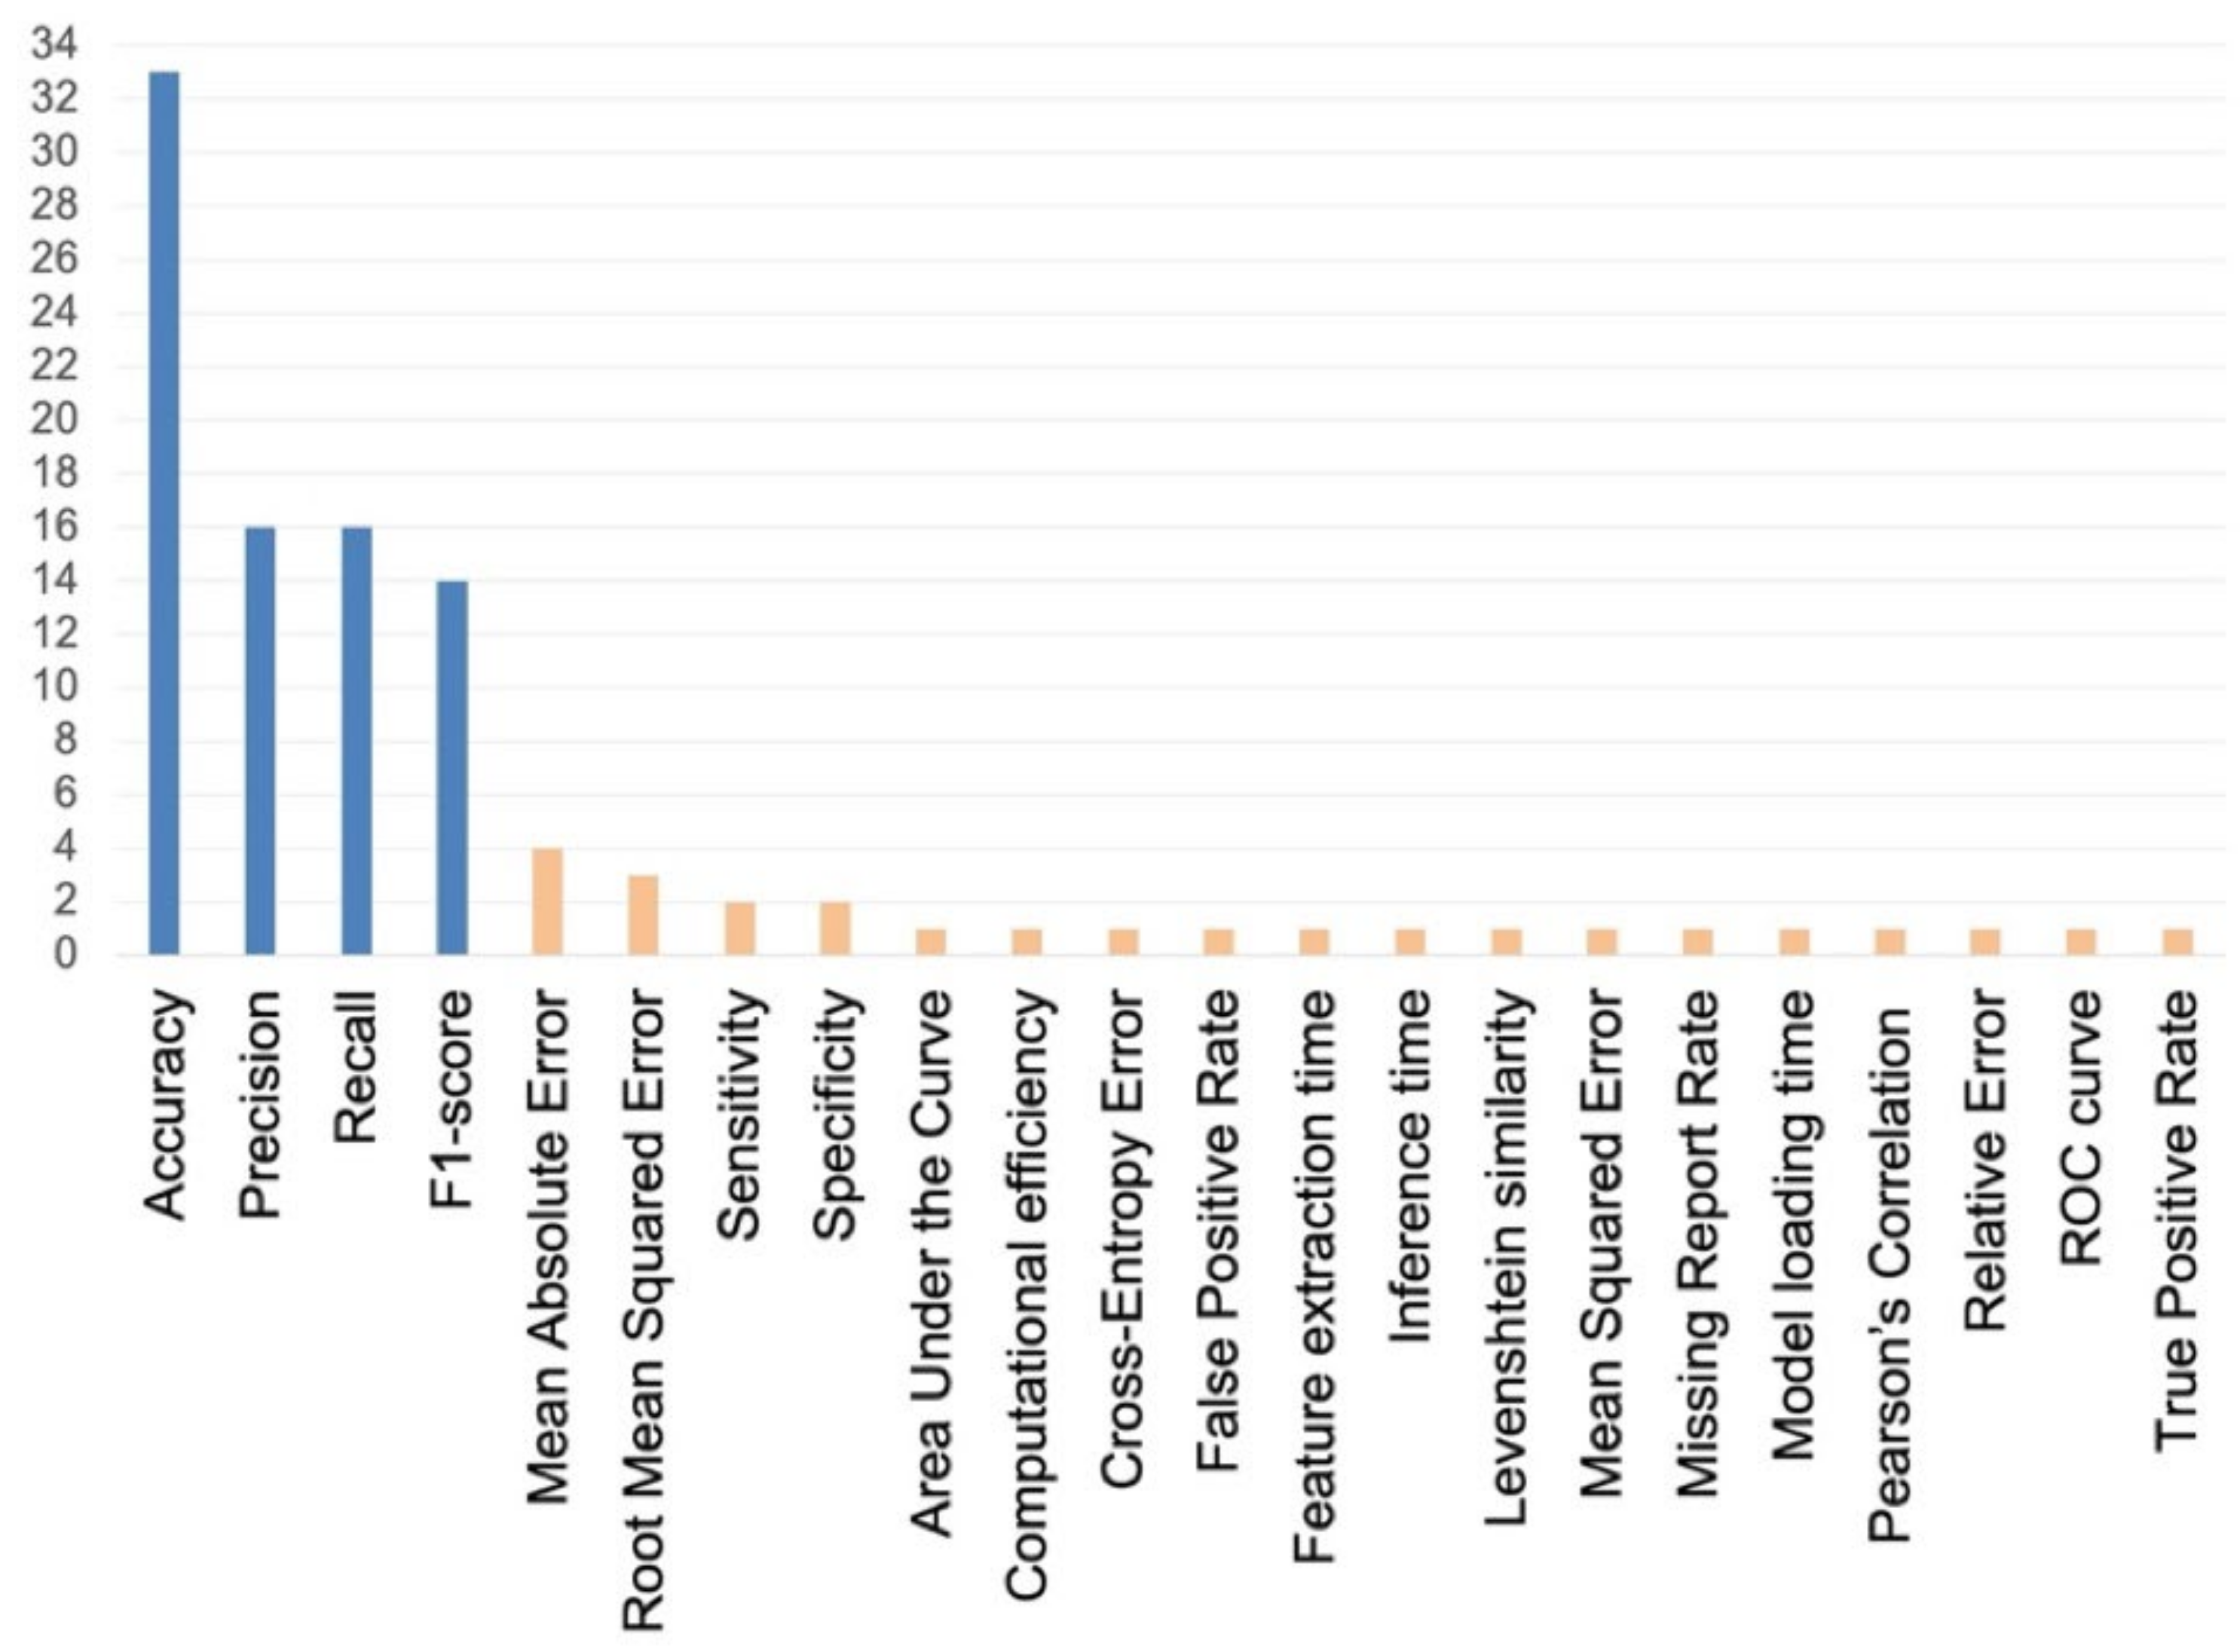
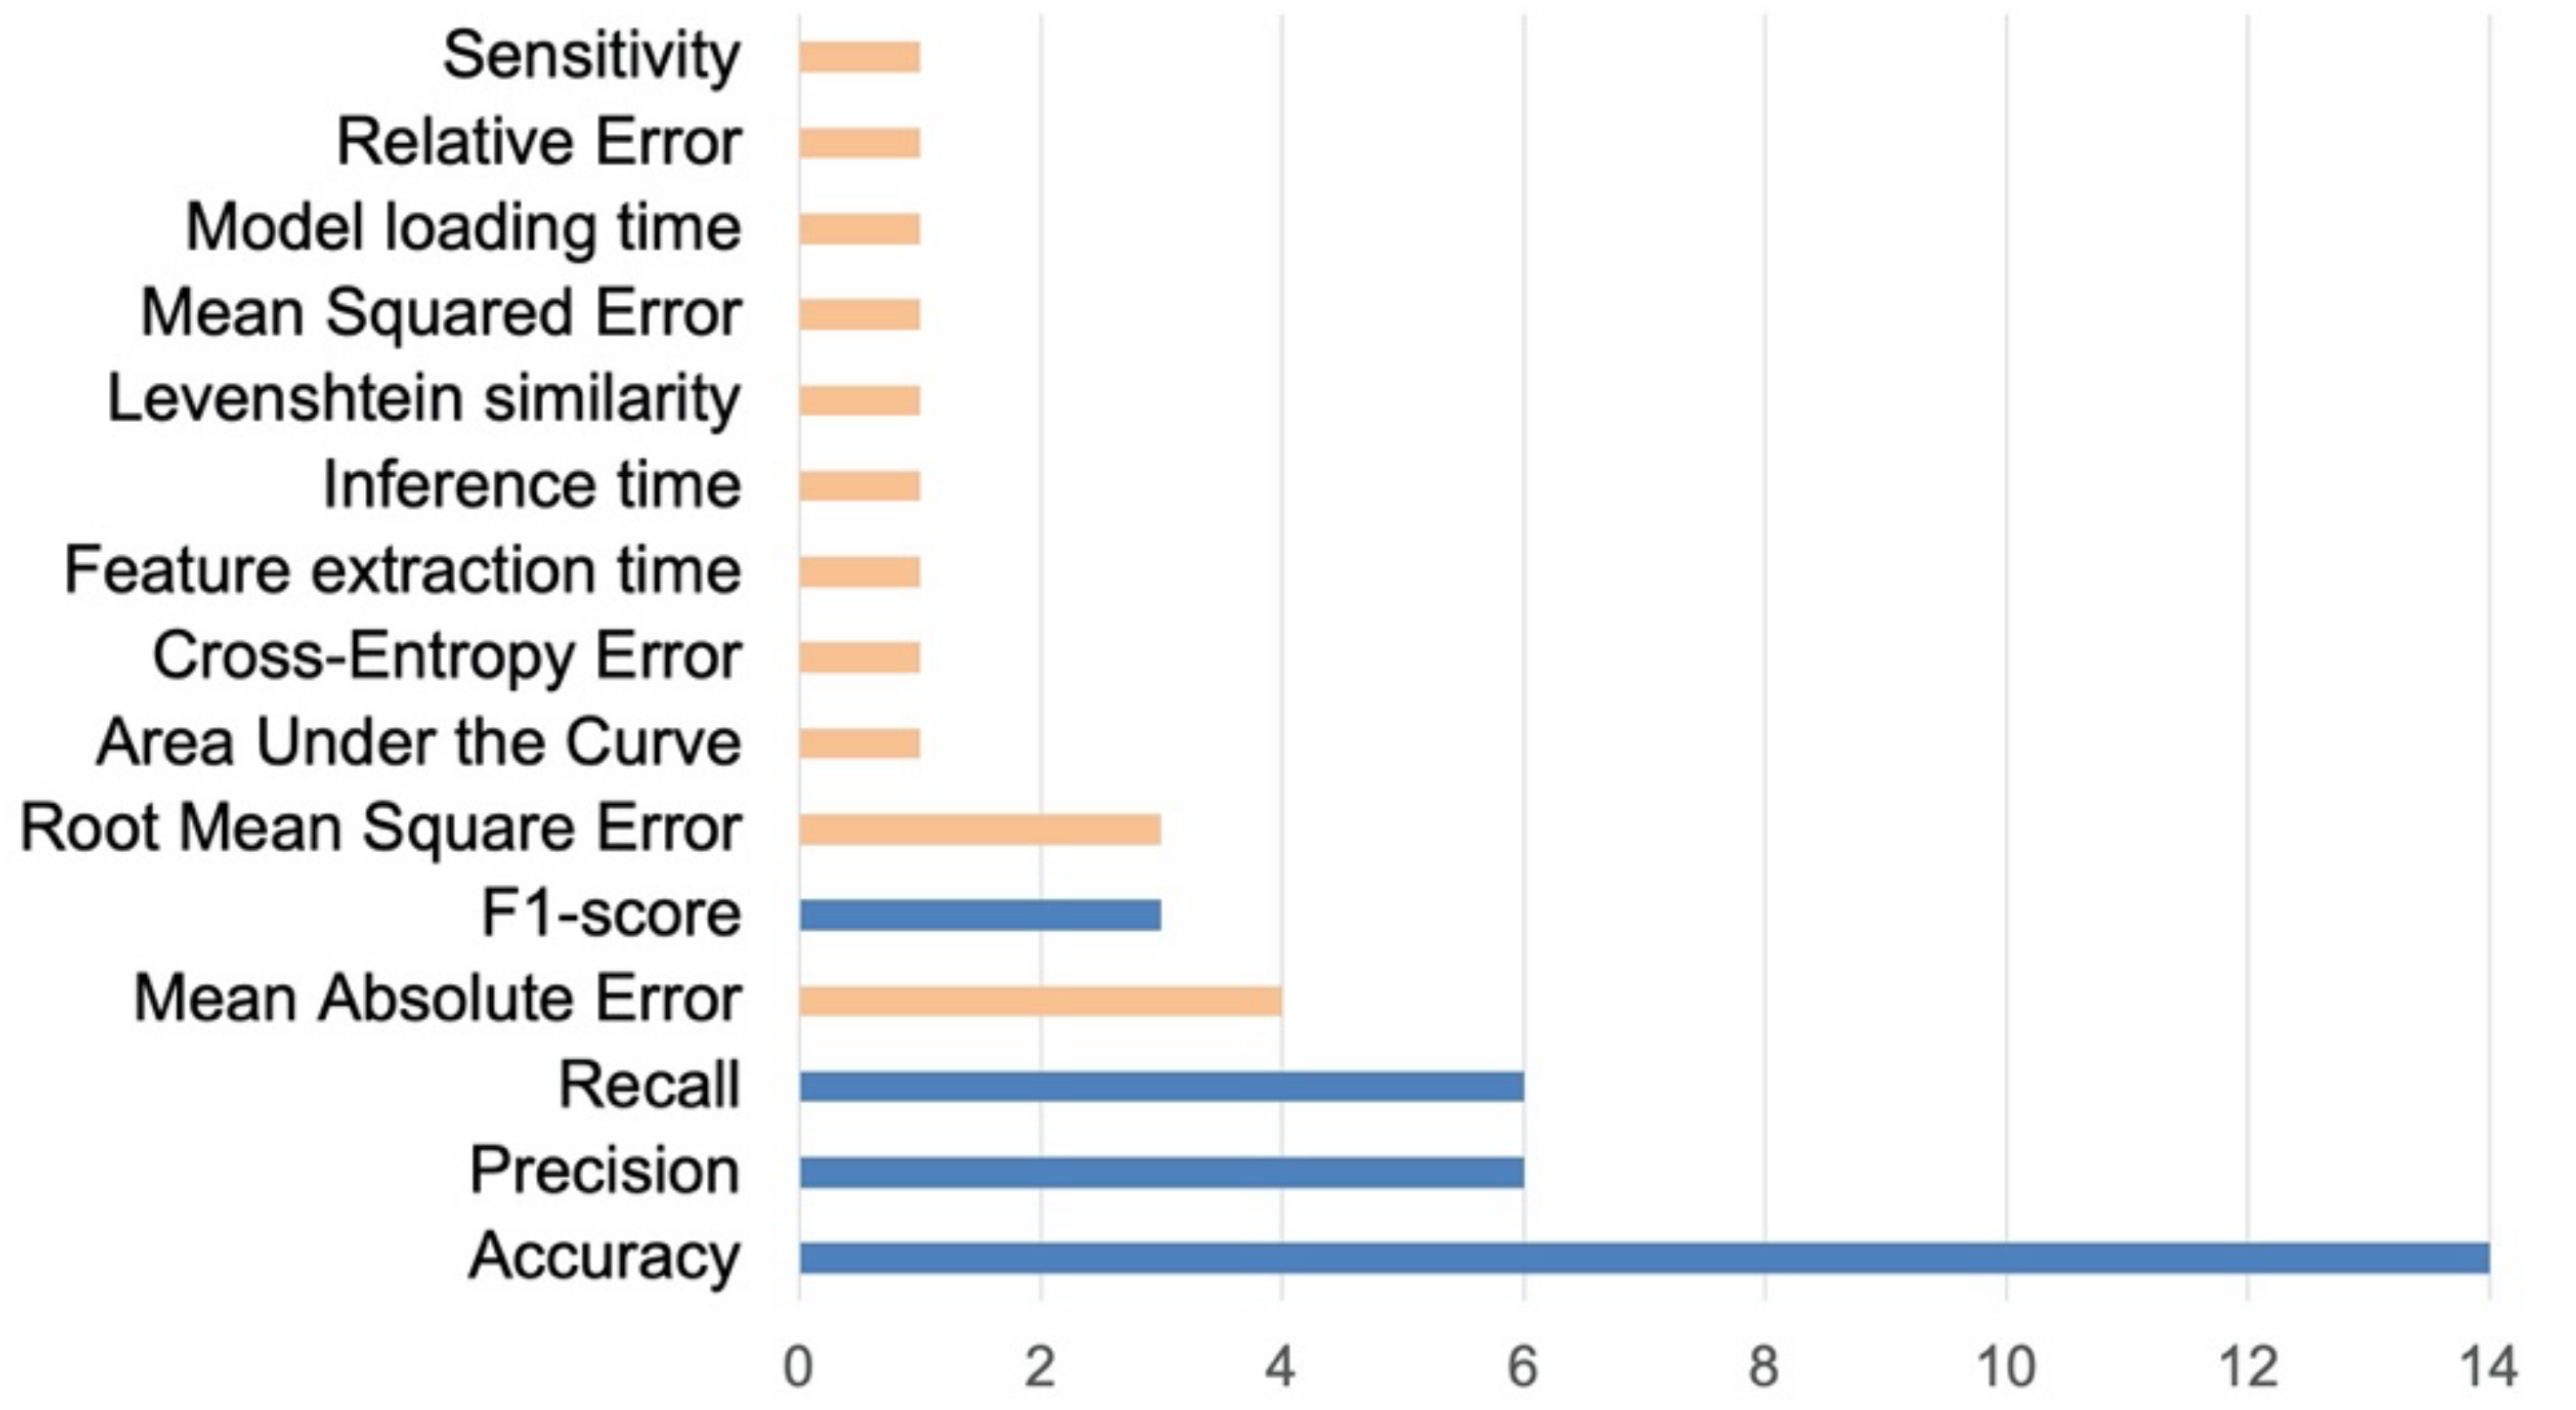
Research question four focuses on the evaluation metrics, the evaluation method, and the results of each study. The frequency of metrics used by each study was calculated. When the study’s category is classification, Accuracy is the most used metric. In many studies, Accuracy, Precision, Recall, and F1-score were used simultaneously as evaluation scales (Figure 12).
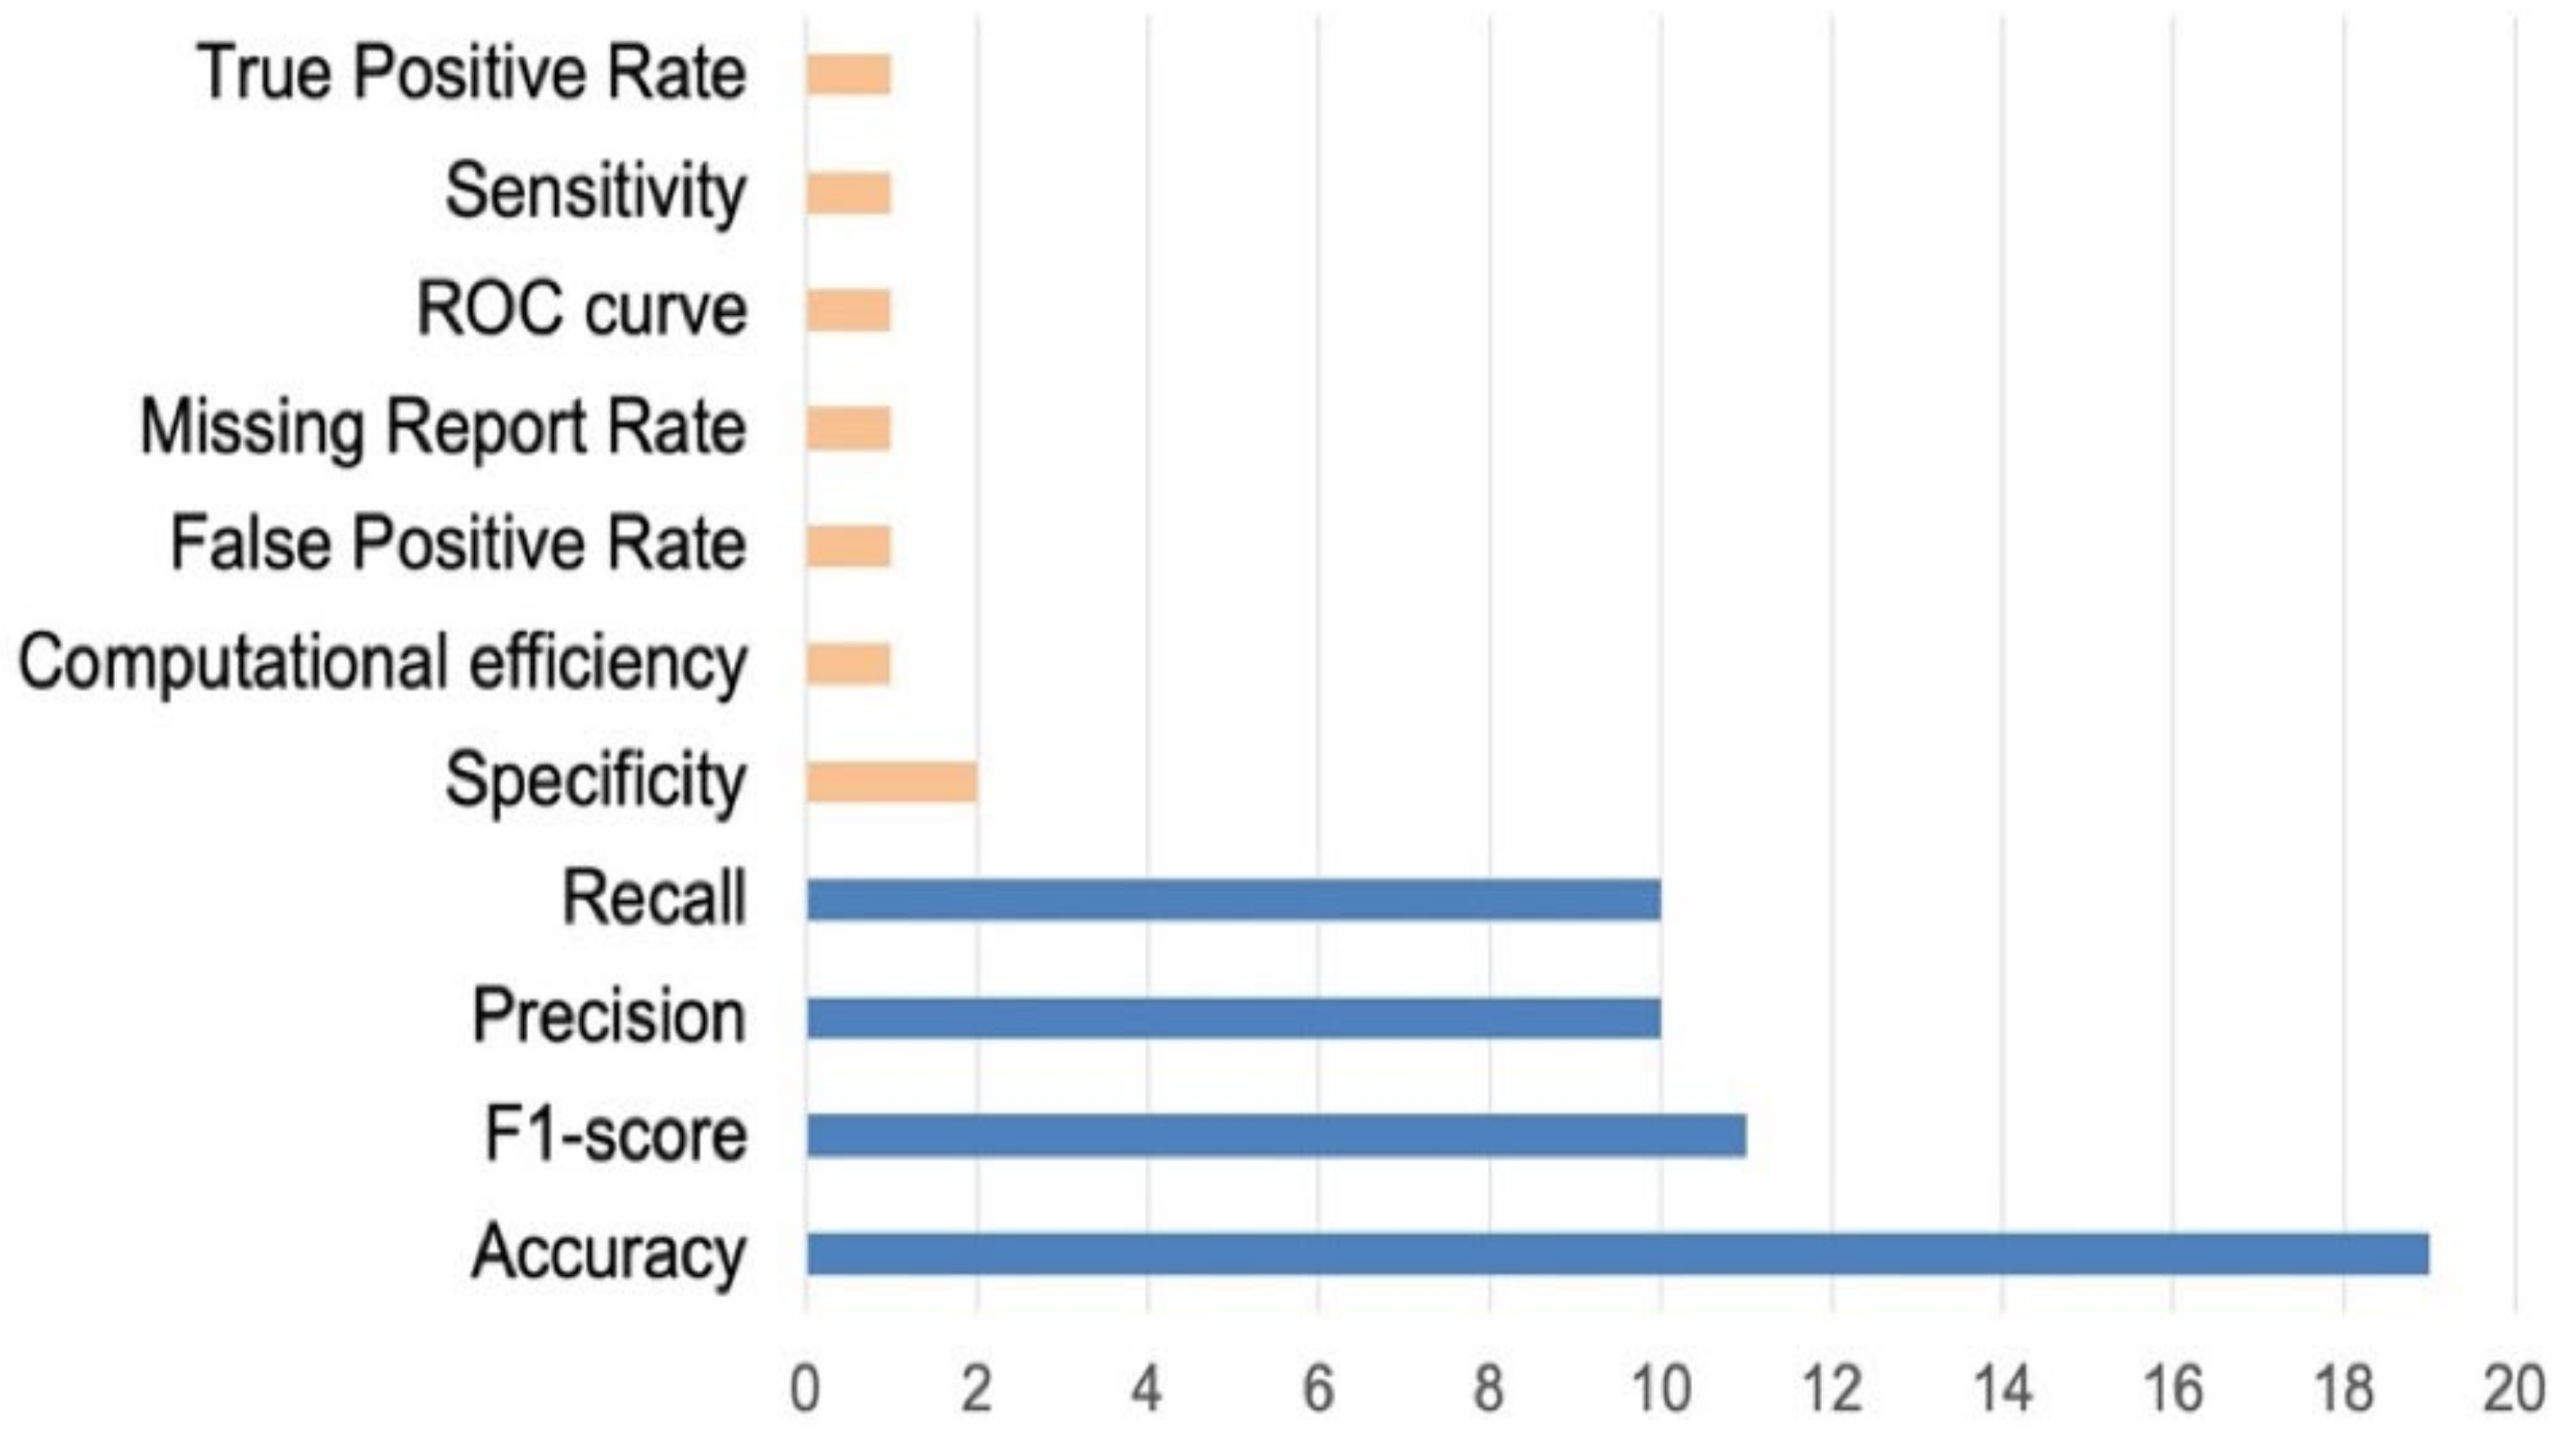
RNN-related research used more diverse metrics than CNN. In particular, in the evaluation of prediction performance, mean absolute error and Root mean square error were frequently used to compare actual data and predicted data (Figure 13 and Figure 14).
In ten CNN-related studies, Accuracy, Precision, Recall, and F1-score were simultaneously used as evaluation metrics. The four metrics are mainly used to measure the classification performance, and each is expressed as equations with True Positives (TP), True Negatives (TN), False Positives (FP), and False Negatives (FN) as shown in (1)–(4) [70]. Table 7 shows the evaluation results obtained in studies based on Accuracy, Precision, Recall, and F1-score.
In addition, in 33 out of 43 studies, comparative experiments were conducted to compare the performance of their proposed model and other ML models. Detailed comparison models and evaluation results for each study can be found in Table A1.
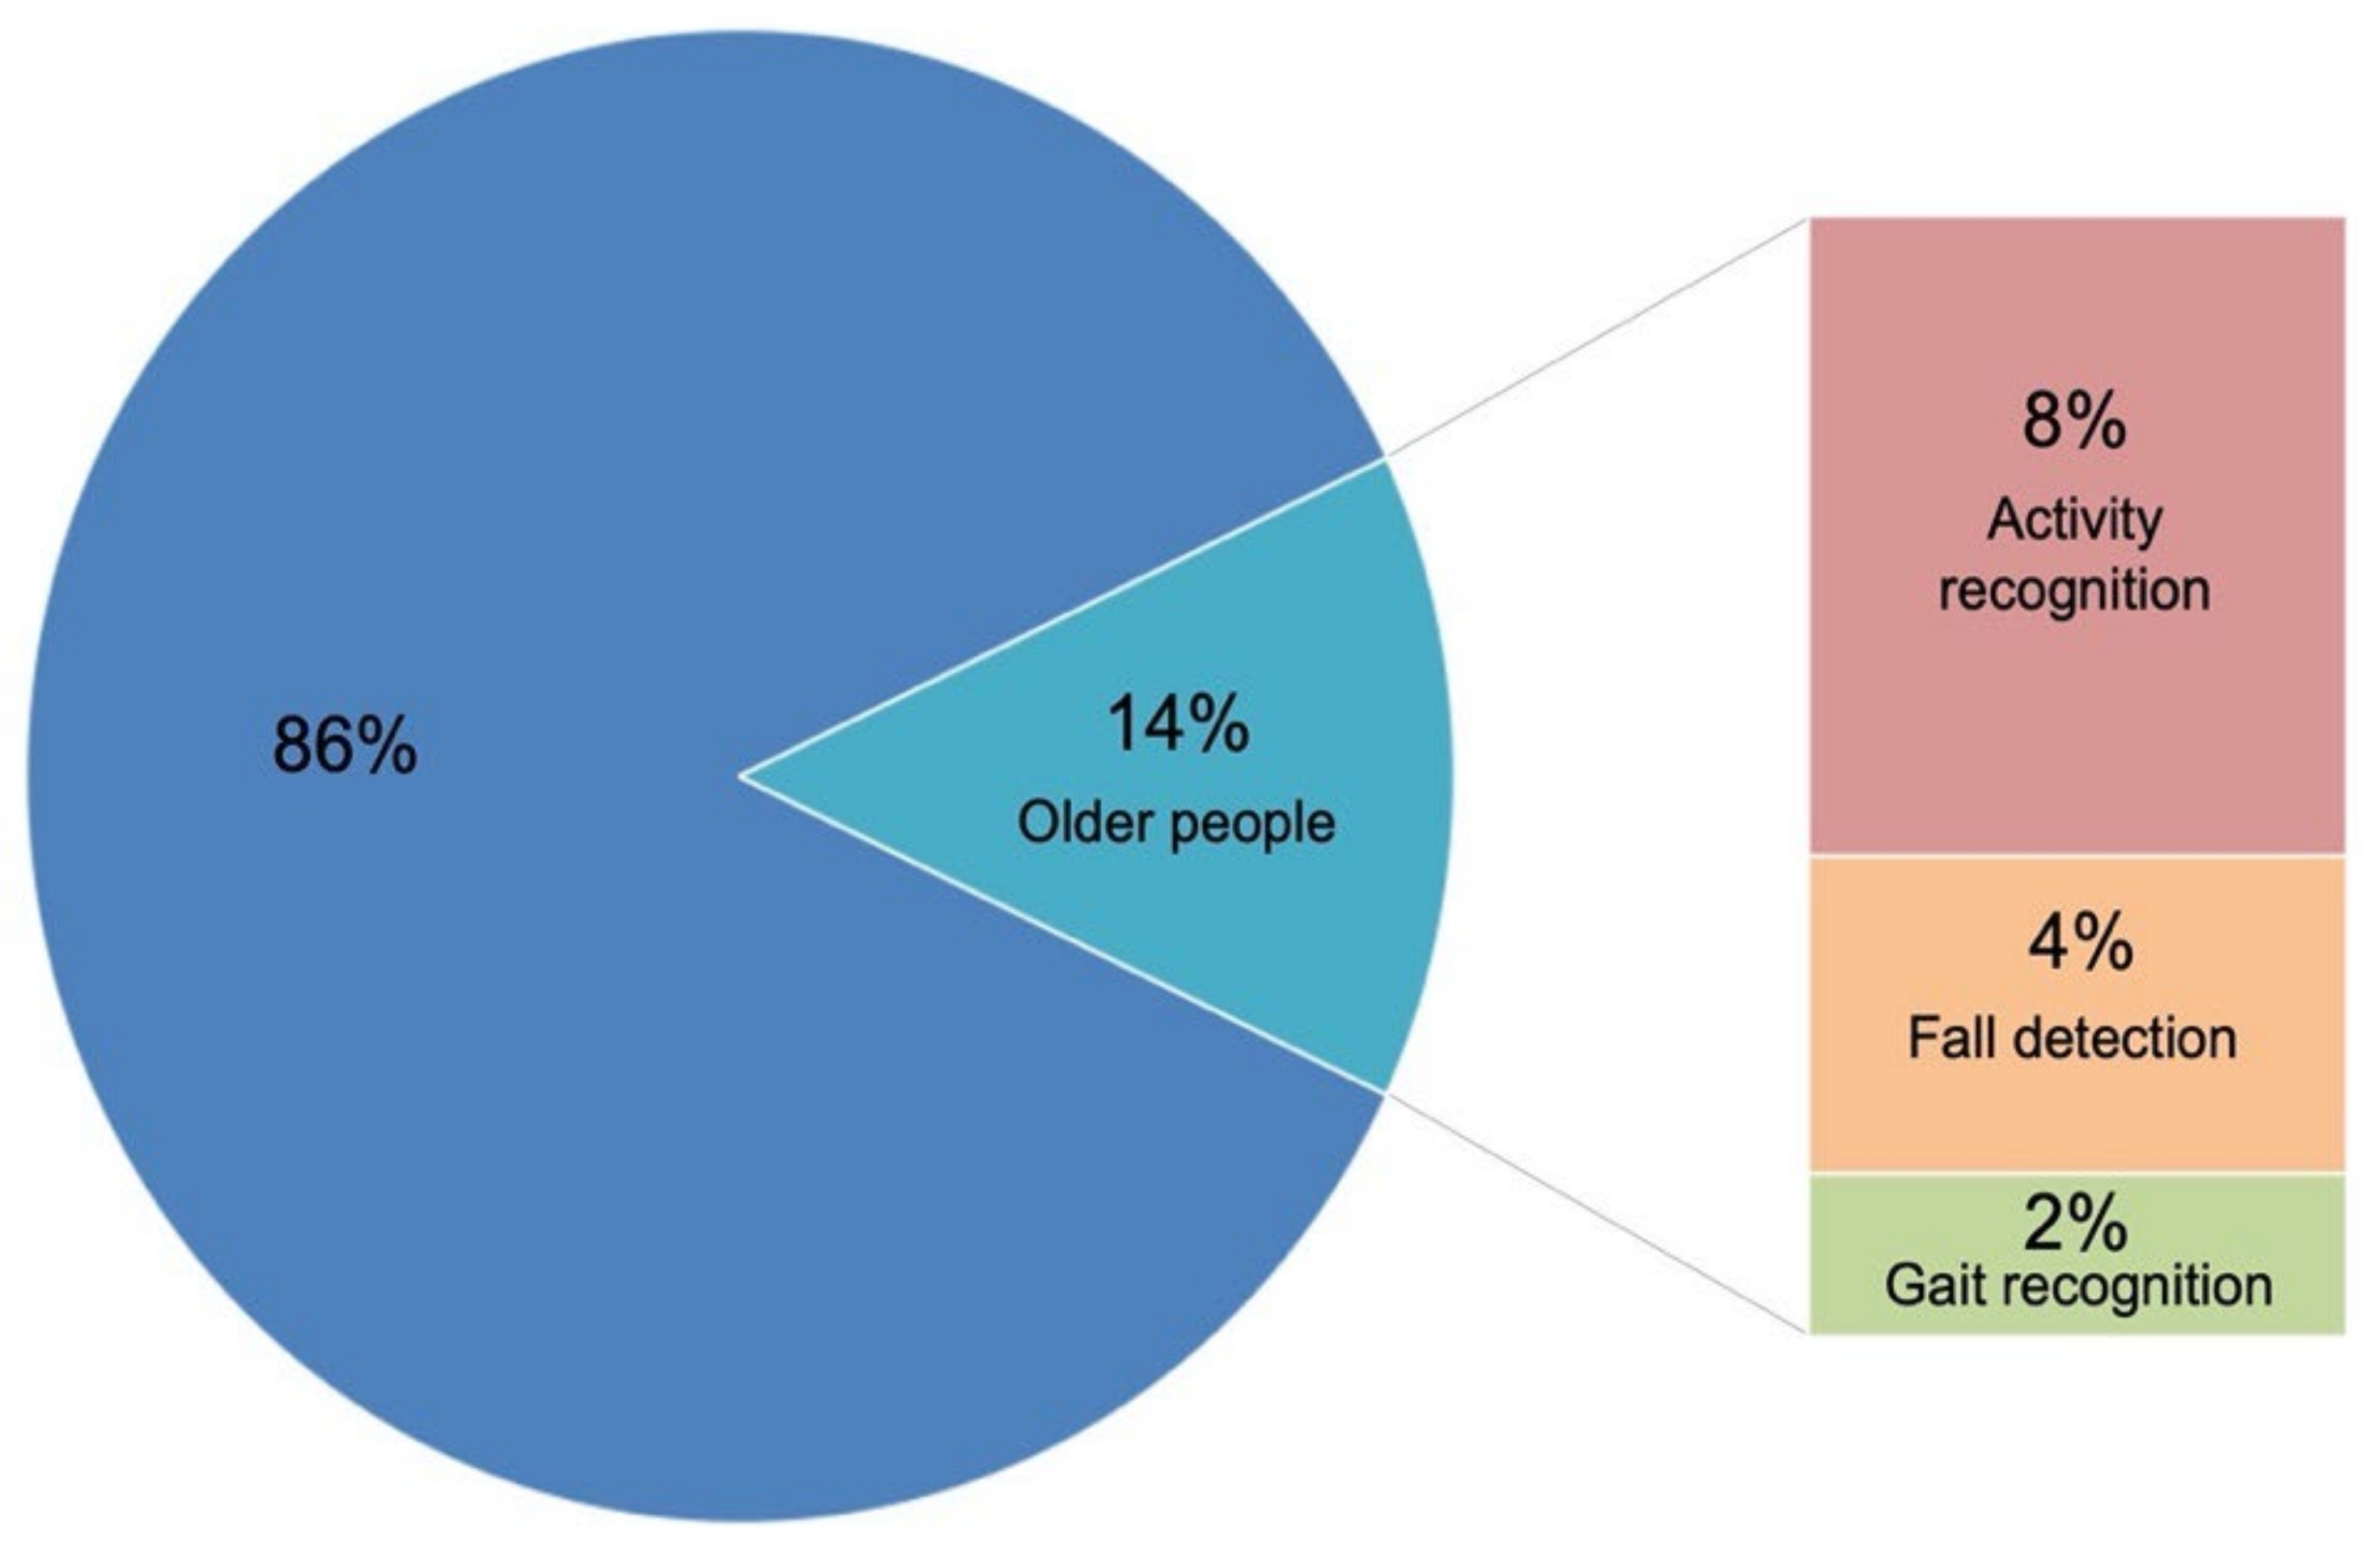
3.5. RQ5: Is There Any Study on a Specific Population Target? Who Is the Target, and What Is the Field of Application?
Only 7 of the 43 studies referred to a specific population target, and this target is older people. Figure 15 shows the proportion of research related to the elderly in the selected studies. In total, four of the seven studies were conducted for activity recognition, two for fall detection, and one for gait recognition, as shown in Table 8.
Uddin et al. [18] studied recognizing a depth video-based gait. It extracts Local Directional Pattern (LDP) features from depth silhouettes and creates robust spatiotemporal features based on them. Moreover, CNN was applied to distinguish between normal and abnormal gait. Recognizing abnormal gait is a critical point for the health monitoring of older adults.
Khraief et al. [34] conducted a study for fall detection in the elderly. It is based on two-stream CNNs: human shape and motion. Ahamed et al. [60] also researched a fall detection study for the elderly, and it is an accelerometer-based fall detection via wearable devices. Feed Forward Neural Network (FFNN) and Long Short-Term Memory (LSTM) were applied.
Gochoo et al. [42] showed an unobtrusive CNN activity recognition model for older adults living alone. They used Aruba data by monitoring a single older woman for eight months to classify ten activities: Eating, Bed to Toilet, Relaxation, Meal Preparation, Sleeping, Work, Housekeeping, Wash Dishes, Enter Home and Leave Home.
Arifoglu and Bouchachia [22] aimed to detect abnormal behavior related to dementia in old age. It is a binary classification that distinguishes between normal and abnormal. For this, 1D CNN, 2D CNN, and a combination of LSTM and CNN were compared and evaluated.
MacHot et al. [51] also conducted an activity recognition study for the elderly, and RNN was applied to verify both newly created data and public data.
Zhao et al. [52] directly collected sensor data for old age activity recognition and compared RNN, LSTM, and GRU models.
The evidence from these studies shows that activity recognition and fall detection are priorities in smart home technology for older people, and we can expect that the technology using DL will continue to be researched and developed in this health monitoring field.
4. Discussion
4.1. Threats to Validity
To ensure the validity of this systematic review, three threats have been considered:
- Selection bias: There is a threat that individual bias will be reflected in the study selection process. To minimize this, it was clearly reviewed whether the specified technologies (CNN, RNN/LSTM) were used as the main solution of the study and whether this study contributed to the development of smart home services. In addition, to reduce the threat to the selection process, we followed the PRISMA process. The research was collected through well-known scientific databases to minimize publication bias. During the study selection process, Covidence (www.covidence.org, last accessed on 20 December 2021) was used to screen each study to ensure that they were not selected based on biased individual opinions. This is a suitable tool for multiple researchers to review and share their opinions simultaneously.
- Threats to data analysis: There is a potential threat to the accuracy of data extraction, recording, and description. Since Covidence is an automated tool, it has limitations in data extraction depending on the study’s purpose. Therefore, to extract and collect the data, we used an Excel spreadsheet; moreover, we have thoroughly defined the data for extraction (Table 4).
- Threats to representativeness: This mapping study has been able to find search results from each database since 2016. Given the number of studies in this field has increased rapidly since 2017 and many related studies are still being published, it cannot be claimed that this review is all-inclusive. However, the objective search strings through PICO guarantee a good coverage of the studies within the period.
4.2. Findings and Lessons Learned
For future research in this field, the following issues were analyzed: (RQ1) keywords and distribution of the research; (RQ2) research goals, DL type, and applications; (RQ3) composition and use of the data in each study; (RQ4) evaluation methods, evaluation metrics, and results; (RQ5) studies considering specific population targets.
RQ1. CNN or RNN/LSTM research applied to smart homes has been rapidly increasing since 2017. Though research on applying DL to activity recognition has existed for many years, research on the application of this function to smart home services has been more active recently. The main keywords related to CNN in smart homes are Activity recognition, Fall detection, Automation, Hand detection, Elderly people, and Identification. The keyword network shows that CNN is closely related to the monitoring and classifying functions. The RNN keyword network includes LSTM, Authentication, Activity recognition, and Anomaly detection, while the keywords related to LSTM include Energy management, Activity recognition, Authentication, and Automation. This shows that the keywords are slightly different, while each DL model becomes a keyword of each other because there are studies that applied two or more models together. These studies suggest that better performance results can be obtained from the combined models than from using a single model. Through the keyword networks, we get an overview of the field.
RQ2. The analysis of the purpose of each study, the services considered, and the specific model applied reveals that CNNs are excellent in image recognition, and they are the best option to perform classification tasks on the image, video, and sensor data. RNN/LSTM can analyze sequential data and implement a solution process for activity recognition different from CNN. In addition, RNN/LSTM are used to predict the next action through time-series data or to predict power consumption for energy management. Overall, the monitoring category, made up of activity recognition, activity prediction, fall detection, and gesture control, accounted for the largest percentage (66%) of the studies, followed by the security category (17%) and the energy management category (11%). In particular, we are interested in activity recognition that applied unsupervised learning. Unsupervised learning can reduce human intervention because the algorithms learn from input data without the need to be manually tagged. In the future, DL should be developed with more efficient algorithms by developing reinforcement learning and unsupervised learning or combining these learning approaches with other DLs. This section can help researchers who study DL usage in smart homes to design a concrete research strategy.
RQ3. In this section, the data types, the data formats used, and the distribution of public vs. ad-hoc databases were analyzed. In total, 42% of the studies used only public data, 46% relied on newly created data, and 12% combined newly created data and public data. The most used data format was sensor data, and we analyzed which sensors are applied to which application (Table 6). Deng [71] emphasized the importance of multimodal learning using cross-domain information. It is necessary to effectively utilize the voices, images, and sensors of each device as multimodal data. Furthermore, since smart homes are aware of various contexts and operate through various IoT devices, an infrastructure should be provided that enables the easy integration of various data collected from devices of different manufacturers. This section also shows what percentages of data were used for training and testing in each study. The 10% testing and 90% training ratio was the most common. Data used for each study can be found in Table A1. This section also provides information about public data available for DL research, and information about the composition of new data created by researchers. In total, 47.5% of the studies that employed public data used the CASAS project datasets.
RQ4. This section shows how the models developed were evaluated. Accuracy is the most important metric in classification, and many studies have simultaneously evaluated Accuracy, Precision, Recall, and F1-score. In addition, 77% of the studies conducted a comparative experiment to evaluate the performance of the proposed model, as compared to other models’ performance. CNN, RNN, and LSTM have been compared to existing machine learning classification models, or to other DL models based on the same data from other studies. We provided the details of evaluation metrics, compared models, and the results for each study in Table A1. The analysis reveals that the evaluation method and the comparison targets are different, according to DL type and category. It is as important to evaluate performance as model development. This section will help researchers to find suitable assessment methods and comparisons.
RQ5. This section is an analysis of the studies addressing a specific population target. In total, 14% of the selected studies considered older people. This shows that when studying the application of DL to smart homes, old age is an essential target that should be considered. However, older people are generally afraid of advanced technology and may not be comfortable with systems being automated. For this, we can discuss explainability, which is an important challenge for DL. Technology should be able to explain decisions and actions to users while providing the intelligence to automatically operate when needed. If users can understand interactions and interfaces and they feel in control of the DL’s automation, even users who are reluctant to advanced technology will be able to accept the technology more easily. Regarding DL applications for the elderly, activity recognition and fall detection services that can monitor older people’s lives and help them in an emergency were being treated as important. Monitoring their lives has the advantage of being able to help them immediately if threats to health or the environment are detected. However, there are also issues such as the invasion of privacy. Applying edge computing to store and process sensitive information on edge devices can solve this problem, so researchers need to think about it along with DL development. For this, more in-depth research on the privacy of smart homes is needed.
5. Conclusions and Future Directions
This paper presents the findings of a systematic review that the academy and industry can use to understand trends in smart homes that employ DL. In this investigation, 43 studies were compared and analyzed. We specifically focused on DL and examined how these technologies were applied to smart home applications. In addition, we reviewed the details of how each study was prepared, realized, and evaluated.
Because it is an emerging and rapidly evolving area where many research efforts are being devoted, an up-to-date systematic review was considered necessary. This comparative analysis was based on data published between 1 January 2016 and 31 March 2020. Among the studies for smart homes, 43 studies providing CNN and RNN/LSTM as the main solutions were selected for analysis. However, many related studies are still being published, so this research cannot claim to be all-encompassing. Nonetheless, the main trends in this field of research were identified and the core elements that make up the studies were analyzed.
Several future development directions have been identified for DL applications in smart homes. First, the development of reinforcement learning and unsupervised learning is important because it is inefficient to manually label data that can vary enormously according to users and contexts in smart homes. Furthermore, cross-domain data extraction and utilization should be strengthened. Since a smart home is a space where users live, there are a lot of data that can be collected, but there will be biased data as well. In order to refine this, it will be helpful to synthetically interpret multimodal data and analyze the situation. Furthermore, multiple DL applications that make up a smart home can collaborate in collecting information and completing tasks. By learning from others, they can further improve their algorithms.
Author Contributions
Conceptualization, J.Y., A.d.A. and E.V.-M.; methodology, J.Y., A.d.A. and E.V.-M.; validation, J.Y., A.d.A. and E.V.-M.; formal analysis, J.Y., A.d.A. and E.V.-M.; investigation, J.Y., A.d.A. and E.V.-M.; data curation, J.Y., A.d.A. and E.V.-M.; writing—original draft preparation, J.Y.; writing—review and editing, J.Y., A.d.A. and E.V.-M.; visualization, J.Y.; supervision, A.d.A.; project administration, A.d.A.; funding acquisition, A.d.A. and E.V.-M. All authors have read and agreed to the published version of the manuscript.
Funding
This research was partially funded by the Spanish Ministry of Science and Innovation research grant PID2019-108408RB-C21—Active aging with Unobtrusive Personalized monitoring project. The authors would like to thank the Fondo Europeo de Desarrollo Regional (European Regional Development Fund) funds for cofinancing our home institution.
Institutional Review Board Statement
Not applicable.
Informed Consent Statement
Not applicable.
Conflicts of Interest
The authors declare no conflict of interest.
Appendix A

Table A1.
Data and Evaluation of each study.
| Study | DL | Data Type | Dataset | Composition of Training and Testing | Evaluation Metrics | Comparative Evaluation with Other Methods |
| [32] | CNN | Public | ISCX VPN- nonVPN traffic dataset | service level: training (11,312 pieces): testing (100 tests), application level: training (11,312 pieces): testing (100 tests) | Accuracy, Computational efficiency | N/A |
| [18] | CNN | New | Dataset consisting of 200 normal gait images and 200 abnormal images | training:testing = 200:200 (images) | Accuracy | PCA, ICA, LBP, DBN, HMM |
| [33] | CNN | New | 800 images for each 6 hand gesture | training:testing = 4800:300 (images) | Accuracy | N/A |
| [19] | CNN | New | 1995 audio signals from different activities in the three kitchen environments * data augmentation: each class to 855 | training:testing = 80%:20% | Accuracy, Precision, Recall, F1-score | k-NN (5 nearest neighbors), SVM (linear kernel), SVM (RBF kernel), Extra Trees, Random Forest, Gradient Boosting |
| [34] | CNN | Public | Multiple Cameras Fall dataset: 24 falls and normal activities, UR Fall Detection dataset: 30 falls and 40 normal activities | - | Sensitivity Specificity | CNN by Adrian et al. [72], LBP, Histograms of Oriented Gradients and Caffe neural network, PCAnet + SVM |
| [35] | CNN | New | 2101 images with six different people and topics in different environments * data augmentation: 2101 to 42,020 | training:testing = 42,020:2101 (images) | Accuracy | Fourier descriptor based method, GEI based method |
| [36] | CNN | Public | KDD99 dataset * data augmentation: minority categories | training:testing = 488,021:300,000 (entries) | Accuracy, Average MRR | N/A |
| [37] | CNN | New | 15 people, 6 motions : punching, crawling, creeping, jumping, running, walking | training:testing = 135,000:45,000 (spectrograms) | Accuracy | Misra et al. [73], Chen et al. [74], Long et al. [75] |
| [38] | CNN | New | 1,118,307 data samples: Time use diary, Energy consumption of appliances | training:testing = 80%:20% | F1-score | k-NN |
| [39] | CNN | New | 720 times of image shooting of 6 people, 10 attitudes | - | Accuracy | N/A |
| [40] | CNN | New and Public | New: Voice data of four speakers 1200 audio files, Public: LibriSpeech Dataset | training:validation:testing = 70%:15%:15% | Precision, Recall, F1-score | The 2-layered CNN model, Modified 3-layered CNN model, SqueezeNet model |
| [41] | CNN | New | 120 samples × 2 days × 6 gestures push, pull, moving right, left up and down | training:validation = 120:120 | True Positive Rate, False Positive Rate | WiAG(PCA+KNN) and WiG(SVM)_CSI-based gesture recognition methods |
| [20] | CNN | Public | MAHNOB, DEAP datasets, Different physiological signals | training:testing = 9:1 | Precision, Recall, F1-score, Accuracy | SVM, Random Forest, NB, k-NN |
| [42] | CNN | Public | Aruba_CASAS | training:testing = 9:1 | Recall, Precision, F1-score, Specificity, Accuracy, Error, Latency | AR-CbC, MkRENN, SVM |
| [43] | CNN + LSTM | Public | MavLab_University of Texas, Adlnormal_CASAS, Cairo_CASAS, Tulum2009_CASAS, Aruba_CASAS | training:validation:testing = 60%:20%:20% | 1. classification: Accuracy, Recall, Precision, F1-score | CNN + Bi-LSTM SPADE, LSTM |
| 2. regression: MAE, RMSE, R-squared | ||||||
| [44] | CNN | Public | SPHERE dataset 20 activities | training:testing = 14,503:1601(samples) | Accuracy | DBN |
| [21] | CNN, LSTM | Public | Kasteren_3 homes: house A (25 days, 14 sensors, 10 activities), house B (14 days, 23 sensors, 13 activities), house C (19 days, 21 sensors, 16 activities) | house A training:testing = 24:1 | Accuracy | LSTM + 1D-CNN, NB, HMM, HSMM, CRFs |
| house B training:testing = 13:1 | ||||||
| house C training:testing = 18:1(daily data) | ||||||
| [22] | CNN, LSTM, CNN + LSTM | Public | Aruba_CASAS, WSU_CASAS | 1. Aruba training:validation:testing = 139:70:15 2. WSU training:testing = normal behaviors:abnormal activity | Precision, Recall, F1-score, Accuracy | NB, HMM, HSMM, CRFs |
| [45] | CNN, CNN + LSTM | New and Public | New: 30,000 body silhouette images walking, falling, lying down, climbing up, bending, sitting down. Public: MNIST, COIL-20 | training:validation:testing = 80%:10%:10% | Precision, Recall, F1-score, Accuracy | Single-view long-term recurrent convolutional networks (LRCN), Single-view 3D CNN, Multiview LRCN, Multiview 3D CNN |
| [46] | CNN + GRU | New | Virtual state data of 7 appliances: electric fan, table lamp, air purifier, computer display1, 2, humidifier, laptop | training:validation:testing = 60%:20%:20% | Precision, Recall, F1-score, Accuracy | N/A |
| [47] | CNN | New and Public | New: dataset of 9 activities Public: dataset from UCI Machine Learning Repository of 6 activities | Scenario 1 training:testing = 60%:40% Scenario 2 training:testing = 10:5 (users) Scenario 3 training:testing = 6:3 (repetitions) | Precision, Recall, F1-score, Accuracy | 13 other machine learning models on UCI dataset : 7 other machine learning models on datasets acquired in an AAL environment |
| [48] | CNN + RNN | New and Public | New: ShakeLogin dataset sensor data of shaking action. | 1. ShakeLogin training:testing = 0.8:0.2 | Precision, Recall, F1-score, Accuracy, ROC | Multilayer Perceptron, J48, N-gram language model, SVM, Nearest neighbor distance, DTW |
| Public: HHAR dataset sensor data: biking, sitting, standing, walking, stair-up/down | 2. HHAR training:testing = 0.9:0.1 | |||||
| [49] | CNN | New | Spatial location information of 6 actions using three ultrawide band | training:testing = 20,711:1953 | Accuracy | RBM, DNN, the stand-alone CNN model |
| [50] | LSTM | New | 561 features from a smartphone accelerometer and gyroscope sensor | training:testing = 7767:3162 (samples) | Recall, Accuracy | ANN, SVM |
| [51] | RNN | New and Public | New: Dataset of 15 participants: sleeping, preparing meal, toileting, activities Public: Aruba_CASAS Tower_CASAS | training:testing = 9:1 | Precision, Recall | N/A |
| [52] | RNN, LSTM, GRU | New | Sensor data for the activities: drinking, washing, eating, opening the refrigerator, turning on the light, opening the door, using computer, watching TV, cooking | - | Accuracy | LSTM, GRU, RNN |
| [53] | RNN + LSTM | New | Wi-Fi CSI data of 6 activities: running, walking, standing, sitting, crouching, lying | three non-overlapping datasets: training, validation, and testing dataset | Accuracy | E-eyes, CARM |
| [23] | LSTM | Public | CASAS project: Milan, Cairo, Kyoto2, Kyoto3, Kyoto4 | training:validation = 80%:20% | Precision, Recall, F1-score, Accuracy | Comparison with CNN, Comparison with other ML approaches: HMM, CRF, and NB |
| [54] | LSTM | Public | Umass Trace Repository dataset: electrical data, environmental data, operational data. Weather data of Davis Weather Station | training:testing = 50:1 (days) | RMSE | BP neural network, LSTM, Bi-LSTM |
| [55] | LSTM | New | Multi-user activity data: 23 activities | training:testing = 9:1 | Accuracy | N/A |
| [56] | LSTM | New | 1. Behavior: video data of 46 people, 6 tasks, 3 daily activity types | 1. cross-participant training:testing = 90%:10% | F1-score, Recall, Cross-Entropy Error | LSTM combined with clustering and basic LSTM framework |
| 2. Personality: Survey the short version of the Big Five Inventory | 2. per-participant training:testing = All participant-1 person:1 person data | |||||
| [57] | LSTM | New | The breathing acoustics dataset: deep breathing, normal breathing, sniffing | training:validation = 80%:20% | Accuracy, Feature extraction time, Model loading time, Inference time | SVM, LSTM, quantized LSTM |
| [58] | LSTM | New | Raw and Network flows traffic dataset, Application layer network protocols dataset, Smart-devices and Sensors dataset | training:testing = more than 100 “normal” days:mix of “normal” and “abnormal” days | MSE | N/A |
| [59] | LSTM | New | 536 times 30s time slots Lidar data for 2 human mobile hosts, 17 daily kitchen activities | training:testing = 436:100 (times) | Accuracy | N/A |
| [60] | LSTM | Public | UR Fall detection dataset 30 fall events and 40 ADL events, video recordings of the fall, accelerator of the fall event | FFNN training:validation:testing = 70%:15%:15%, LSTM training:testing = 70:10 | Accuracy, Precision | FFNN, LSTM |
| [61] | LSTM | Public | CASAS project: Aruba, Tulum | training:testing = 9:1 | Precision, F1-score, Accuracy. | LSTM, bi-LSTM, GRU, MkENN-SWMI, MkRENN-SWMIex, MkENN-SWLS, MkRENN-SWLS |
| [62] | LSTM | Public | IAWE dataset | training:test= from 8th of June to 2nd of August:from 3rd to 5th of August | MAE, Relative Error Measures, Accuracy | LSTM model by Kelly & Knottenbelt [76] |
| [63] | LSTM | New | 206 samples: 121 falling down and 85 standing up | training:testing = 2:1 | Accuracy, Precision, Sensitivity | KNN, SVM, DTW |
| [64] | LSTM | New | The ADL data 5 people, 3 nights in smart home of Nara Institute of Science and Technology using sensors | Leave-One-Day-Out cross validation training:testing = the other days:one day | Accuracy, Recall | N/A |
| [65] | LSTM | Public | Watch-n-Patch 458 videos of human complex activity RGB-D, 21 types of activities | - | Accuracy: a frame-level accuracy and a segment-level accuracy | HMM, LDA, CaTM, WBTM |
| [66] | LSTM | Public | Hourly average emission factors in PJM (USA), Ontario (Canada) and France | training:testing = 9:1 | MAPE, Pearson’s Correlation | LSTM with TBATS (Trigonometric, Box-Cox transform, ARMA errors, Trend, and Seasonal components), SVR |
| [67] | LSTM | Public | NTU RGB+D Action Recognition Dataset 44,372 video samples | training:testing = 75%:25% | AUC, Precision, Recall | Rougier et al. [77], Plannic et al. [78] |
| [68] | LSTM | Public | Sensor-level: MIT B, hh104_CASAS, van Kasteren | training:testing = 2:1 | Next activity prediction: Accuracy, Time of next event: MAE and RMSE, Activity window: Levenshtein similarity | GRU by Cho et al. [79] |
| Activity-level: hh102_CASAS, hh104_CASAS, hh110_CASAS, van Kasteren |
References
- Nweke, H.F.; Teh, Y.W.; Al-garadi, M.A.; Alo, U.R. Deep Learning Algorithms for Human Activity Recognition Using Mobile and Wearable Sensor Networks: State of the Art and Research Challenges. Expert Syst. Appl. 2018, 105, 233–261. [Google Scholar] [CrossRef]
- LeCun, Y.; Bengio, Y.; Hinton, G. Deep Learning. Nature 2015, 521, 436–444. [Google Scholar] [CrossRef]
- LeCun, Y.; Boser, B.; Denker, J.S.; Henderson, D.; Howard, R.E.; Hubbard, W.; Jackel, L.D. Backpropagation Applied to Handwritten Zip Code Recognition. Neural Comput. 1989, 1, 541–551. [Google Scholar] [CrossRef]
- Khan, A.; Sohail, A.; Zahoora, U.; Qureshi, A.S. A Survey of the Recent Architectures of Deep Convolutional Neural Networks. Artif. Intell. Rev. 2020, 53, 5455–5516. [Google Scholar] [CrossRef] [Green Version]
- Zhang, Q.; Yang, L.T.; Chen, Z.; Li, P. A Survey on Deep Learning for Big Data. Inf. Fusion 2018, 42, 146–157. [Google Scholar] [CrossRef]
- Hochreiter, S.; Schmidhuber, J. Long Short-Term Memory. Neural Comput. 1997, 9, 1735–1780. [Google Scholar] [CrossRef]
- Van Houdt, G.; Mosquera, C.; Nápoles, G. A Review on the Long Short-Term Memory Model. Artif. Intell. Rev. 2020, 53, 5929–5955. [Google Scholar] [CrossRef]
- Zaidan, A.A.; Zaidan, B.B. A Review on Intelligent Process for Smart Home Applications Based on IoT: Coherent Taxonomy, Motivation, Open Challenges, and Recommendations. Artif. Intell. Rev. 2020, 53, 141–165. [Google Scholar] [CrossRef]
- Alaa, M.; Zaidan, A.A.; Zaidan, B.B.; Talal, M.; Kiah, M.L.M. A Review of Smart Home Applications Based on Internet of Things. J. Netw. Comput. Appl. 2017, 97, 48–65. [Google Scholar] [CrossRef]
- Sultan, M.; Nabil, K. Smart to Smarter: Smart Home Systems History, Future and Challenges. In Proceedings of the 34th Annual ACM Conference on Human Factors in Computing Systems, Future of Human-Building Interaction Workshop, San Jose, CA, USA, 7–12 May 2016. [Google Scholar]
- Mshali, H.; Lemlouma, T.; Moloney, M.; Magoni, D. A Survey on Health Monitoring Systems for Health Smart Homes. Int. J. Ind. Ergon. 2018, 66, 26–56. [Google Scholar] [CrossRef] [Green Version]
- Dawadi, P.N.; Cook, D.J.; Schmitter-Edgecombe, M. Automated Cognitive Health Assessment Using Smart Home Monitoring of Complex Tasks. IEEE Trans. Syst. Man Cybern. Syst. 2013, 43, 1302–1313. [Google Scholar] [CrossRef] [Green Version]
- Nef, T.; Urwyler, P.; Büchler, M.; Tarnanas, I.; Stucki, R.; Cazzoli, D.; Müri, R.; Mosimann, U. Evaluation of Three State-of-the-Art Classifiers for Recognition of Activities of Daily Living from Smart Home Ambient Data. Sensors 2015, 15, 11725–11740. [Google Scholar] [CrossRef] [PubMed] [Green Version]
- Fleury, A.; Vacher, M.; Noury, N. SVM-Based Multimodal Classification of Activities of Daily Living in Health Smart Homes: Sensors, Algorithms, and First Experimental Results. IEEE Trans. Inf. Technol. Biomed. 2010, 14, 274–283. [Google Scholar] [CrossRef] [PubMed] [Green Version]
- Antić, M.; Papp, I.; Ivanović, S.; Matić, M. Learning From Smart Home Data: Methods and Challenges of Data Acquisition and Analysis in Smart Home Solutions. IEEE Consum. Electron. Mag. 2020, 9, 64–71. [Google Scholar] [CrossRef]
- Zeng, M.; Nguyen, L.T.; Yu, B.; Mengshoel, O.J.; Zhu, J.; Wu, P.; Zhang, J. Convolutional Neural Networks for Human Activity Recognition Using Mobile Sensors. In Proceedings of the 6th International Conference on Mobile Computing, Applications and Services, Austin, TX, USA, 6–7 November 2014; pp. 197–205. [Google Scholar] [CrossRef] [Green Version]
- Chen, Y.; Xue, Y. A Deep Learning Approach to Human Activity Recognition Based on Single Accelerometer. In Proceedings of the 2015 IEEE International Conference on Systems, Man, and Cybernetics, Hong Kong, China, 9–12 October 2015; pp. 1488–1492. [Google Scholar] [CrossRef]
- Uddin, M.Z.; Khaksar, W.; Torresen, J. A Robust Gait Recognition System Using Spatiotemporal Features and Deep Learning. In Proceedings of the 2017 IEEE International Conference on Multisensor Fusion and Integration for Intelligent Systems (MFI), Daegu, Korea, 16–18 November 2017; pp. 156–161. [Google Scholar] [CrossRef]
- Vafeiadis, A.; Votis, K.; Giakoumis, D.; Tzovaras, D.; Chen, L.; Hamzaoui, R. Audio Content Analysis for Unobtrusive Event Detection in Smart Homes. Eng. Appl. Artif. Intell. 2020, 89, 103226. [Google Scholar] [CrossRef] [Green Version]
- Al Machot, F.; Elmachot, A.; Ali, M.; Al Machot, E.; Kyamakya, K. A Deep-Learning Model for Subject-Independent Human Emotion Recognition Using Electrodermal Activity Sensors. Sensors 2019, 19, 1659. [Google Scholar] [CrossRef] [PubMed] [Green Version]
- Singh, D.; Merdivan, E.; Hanke, S.; Kropf, J.; Geist, M.; Holzinger, A. Convolutional and Recurrent Neural Networks for Activity Recognition in Smart Environment. In Towards Integrative Machine Learning and Knowledge Extraction; Springer: Cham, Switzerland, 2017; pp. 194–205. [Google Scholar] [CrossRef]
- Arifoglu, D.; Bouchachia, A. Detection of Abnormal Behaviour for Dementia Sufferers Using Convolutional Neural Networks. Artif. Intell. Med. 2019, 94, 88–95. [Google Scholar] [CrossRef]
- Liciotti, D.; Bernardini, M.; Romeo, L.; Frontoni, E. A Sequential Deep Learning Application for Recognising Human Activities in Smart Homes. Neuro Comput. 2019, 396, 501–513. [Google Scholar] [CrossRef]
- Nugroho, K.; Rustad, S.; Shidik, G.F.; Noersasongko, E.; Purwanto; Muljono; Setiadi, D.R.I.M. A Systematic Review of Speaker Recognition Using Deep Learning on Research Trends, Datasets, and Methods. Technol. Reports Kansai Univ. 2020, 62, 663–683. [Google Scholar]
- Sepasgozar, S.; Karimi, R.; Farahzadi, L.; Moezzi, F.; Shirowzhan, S.; Ebrahimzadeh, S.M.; Hui, F.; Aye, L. A Systematic Content Review of Artificial Intelligence and the Internet of Things Applications in Smart Home. Appl. Sci. 2020, 10, 3074. [Google Scholar] [CrossRef]
- Xiao, G.; Shen, Z.; Zhang, Y.; Wu, T. Review on the Application of Artificial Intelligence in Smart Homes. Smart Cities 2019, 2, 402–420. [Google Scholar] [CrossRef] [Green Version]
- Djenouri, D.; Laidi, R.; Djenouri, Y.; Balasingham, I. Machine Learning for Smart Building Applications: Review and Taxonomy. ACM Comput. Surv. 2019, 52, 1–36. [Google Scholar] [CrossRef]
- Aslam, S.; Herodotou, H.; Mohsin, S.M.; Javaid, N.; Ashraf, N.; Aslam, S. A Survey on Deep Learning Methods for Power Load and Renewable Energy Forecasting in Smart Microgrids. Renew. Sustain. Energy Rev. 2021, 144, 110992. [Google Scholar] [CrossRef]
- Moher, D.; Liberati, A.; Tetzlaff, J.; Altman, D.G.; Altman, D.; Antes, G.; Atkins, D.; Barbour, V.; Barrowman, N.; Berlin, J.A.; et al. Preferred Reporting Items for Systematic Reviews and Meta-Analyses: The PRISMA Statement. PLoS Med. 2009, 6, e1000097. [Google Scholar] [CrossRef] [Green Version]
- Miller, S.A.; Forrest, J.L. Enhancing Your Practice through Evidence-Based Decision Making: PICO, Learning How to Ask Good Questions. J. Evidenced-Based Dent. Pract. 2001, 1, 136–141. [Google Scholar] [CrossRef]
- Sherstinsky, A. Fundamentals of Recurrent Neural Network (RNN) and Long Short-Term Memory (LSTM) Network. Phys. D Nonlinear Phenom. 2020, 404, 132306. [Google Scholar] [CrossRef] [Green Version]
- Chen, X.; Yu, J.; Ye, F.; Wang, P. A Hierarchical Approach to Encrypted Data Packet Classification in Smart Home Gateways. In Proceedings of the 2018 IEEE 16th Intl Conf on Dependable, Autonomic and Secure Computing, 16th Intl Conf on Pervasive Intelligence and Computing, 4th Intl Conf on Big Data Intelligence and Computing and Cyber Science and Technology Congress (DASC/PiCom/DataCo), Athens, Greece, 12–15 August 2018; pp. 46–53. [Google Scholar] [CrossRef] [Green Version]
- Chung, H.Y.; Chung, Y.L.; Tsai, W.F. An Efficient Hand Gesture Recognition System Based on Deep CNN. In Proceedings of the 2019 IEEE International Conference on Industrial Technology (ICIT), Melbourne, Australia, 13–15 February 2019; pp. 853–858. [Google Scholar] [CrossRef]
- Khraief, C.; Benzarti, F.; Amiri, H. Convolutional Neural Network Based on Dynamic Motion and Shape Variations for Elderly Fall Detection. Int. J. Mach. Learn. Comput. 2019, 9, 814–820. [Google Scholar] [CrossRef]
- Kim, H.; Lee, S.; Jung, H. Human Activity Recognition by Using Convolutional Neural Network. Int. J. Electr. Comput. Eng. 2019, 9, 5270–5276. [Google Scholar] [CrossRef]
- Liu, K.; Fan, Z.; Liu, M.; Zhang, S. Hybrid Intrusion Detection Method Based on K-Means and CNN for Smart Home. In Proceedings of the 2018 IEEE 8th Annual International Conference on CYBER Technology in Automation, Control, and Intelligent Systems (CYBER), Tianjin, China, 19–23 July 2018; pp. 312–317. [Google Scholar] [CrossRef]
- Lang, Y.; Wang, Q.; Yang, Y.; Hou, C.; Liu, H.; He, Y. Joint Motion Classification and Person Identification via Multitask Learning for Smart Homes. IEEE Internet Things J. 2019, 6, 9596–9605. [Google Scholar] [CrossRef]
- Jiang, J.; Hoogendoorn, M.; Kong, Q.; Roijers, D.M.; Gilbert, N. Predicting Appliance Usage Status in Home Like Environments. In Proceedings of the 23rd IEEE International Conference on Digital Signal Processing, Shanghai, China, 19–21 November 2018; pp. 1–5. [Google Scholar] [CrossRef]
- Peng, Y.; Peng, J.; Li, J.; Yu, L. Smart Home System Based on Deep Learning Algorithm. In Journal of Physics: Conference Series; Institute of Physics Publishing: Bristol, UK, 1 April 2019; Volume 1187. [Google Scholar] [CrossRef]
- Wang, M.; Sirlapu, T.; Kwasniewska, A.; Szankin, M.; Bartscherer, M.; Nicolas, R. Speaker Recognition Using Convolutional Neural Network with Minimal Training Data for Smart Home Solutions. In Proceedings of the 11th International Conference on Human System Interaction (HSI), Gdansk, Poland, 4–6 July 2018; pp. 139–145. [Google Scholar]
- Zou, H.; Zhou, Y.; Yang, J.; Jiang, H.; Xie, L.; Spanos, C.J. WiFi-Enabled Device-Free Gesture Recognition for Smart Home Automation. In Proceedings of the 2018 IEEE 14th International Conference on Control and Automation (ICCA), Anchorage, AK, USA, 12–15 June 2018; pp. 476–481. [Google Scholar] [CrossRef]
- Gochoo, M.; Tan, T.H.; Liu, S.H.; Jean, F.R.; Alnajjar, F.S.; Huang, S.C. Unobtrusive Activity Recognition of Elderly People Living Alone Using Anonymous Binary Sensors and DCNN. IEEE J. Biomed. Health Informatics 2019, 23, 693–702. [Google Scholar] [CrossRef] [PubMed]
- Yang, H.; Gong, S.; Liu, Y.; Lin, Z.; Qu, Y. A Multi-Task Learning Model for Daily Activity Forecast in Smart Home. Sensors 2020, 20, 1933. [Google Scholar] [CrossRef] [Green Version]
- Taherkhani, A.; Cosma, G.; Alani, A.A.; McGinnity, T.M. Activity Recognition from Multi-Modal Sensor Data Using a Deep Convolutional Neural Network. In Advances in Intelligent Systems and Computing, Proceedings of Computing Conference; Arai, K., Kapoor, S., Bhatia, R., Eds.; Springer: Cham, Switzerland; London, UK, 2019; Volume 857, pp. 203–218. [Google Scholar] [CrossRef]
- Hsueh, Y.L.; Lie, W.N.; Guo, G.Y. Human Behavior Recognition from Multiview Videos. Inf. Sci. 2020, 517, 275–296. [Google Scholar] [CrossRef]
- Zhang, X.; Wang, Y.; Chao, L.; Li, C.; Wu, L.; Peng, X.; Xu, Z. IEHouse: A Non-Intrusive Household Appliance State Recognition System. In Proceedings of the 2017 IEEE SmartWorld, Ubiquitous Intelligence & Computing, Advanced & Trusted Computed, Scalable Computing & Communications, Cloud & Big Data Computing, Internet of People and Smart City Innovation (SmartWorld/SCALCOM/UIC/ATC/CBDCom/IOP/SCI, San Francisco, CA, USA, 4–8 August 2017; pp. 1–8. [Google Scholar] [CrossRef]
- Bianchi, V.; Bassoli, M.; Lombardo, G.; Fornacciari, P.; Mordonini, M.; De Munari, I. IoT Wearable Sensor and Deep Learning: An Integrated Approach for Personalized Human Activity Recognition in a Smart Home Environment. IEEE Internet Things J. 2019, 6, 8553–8562. [Google Scholar] [CrossRef]
- Qin, Z.; Hu, L.; Zhang, N.; Chen, D.; Zhang, K.; Qin, Z.; Choo, K.K.R. Learning-Aided User Identification Using Smartphone Sensors for Smart Homes. IEEE Internet Things J. 2019, 6, 7760–7772. [Google Scholar] [CrossRef]
- Li, J.; Zhao, J.; Li, J.; Ma, Y. Using Convolutional Layer Features for Indoor Human Activity Recognition Based on Spatial Location Information. Int. Conf. Comput. Sci. Appl. Eng. 2017, 759–766. [Google Scholar] [CrossRef] [Green Version]
- Uddin, M.Z.; Torresen, J. Activity Recognition Using Smartphone Sensors, Robust Features, and Recurrent Neural Network. In Proceedings of the 2019 13th International Symposium on Medical Information and Communication Technology (ISMICT), Oslo, Norway, 8–10 May 2019; pp. 1–6. [Google Scholar] [CrossRef]
- Al MacHot, F.; Ranasinghe, S.; Plattner, J.; Jnoub, N. Human Activity Recognition Based on Real Life Scenarios. In Proceedings of the 2018 IEEE International Conference on Pervasive Computing and Communications Workshops (PerCom Workshops), Athens, Greece, 19–23 March 2018; pp. 3–8. [Google Scholar] [CrossRef]
- Zhao, Y.; Li, Q.; Farha, F.; Zhu, T.; Chen, L.; Ning, H. Indoor Activity Recognition by Using Recurrent Neural Networks. In Communications in Computer and Information Science, Proceedings of the 3rd International Conference on Cyberspace Data and Intelligence, Cyber DI 2019, and the International Conference on Cyber-Living, Cyber-Syndrome, and Cyber-Health, CyberLife 2019, Beijing, China, 16–18 December 2019; Springer: Singapore, 2019; Volume 1138, pp. 205–215. [Google Scholar] [CrossRef]
- Ding, J.; Wang, Y. WiFi CSI-Based Human Activity Recognition Using Deep Recurrent Neural Network. IEEE Access 2019, 7, 174257–174269. [Google Scholar] [CrossRef]
- Zi-Hao, W.; Jing, W.; Ling, Z.; Shu-Juan, J. A Thermal Energy Usage Prediction Method for Electric Thermal Storage Heaters Based on Deep Learning. In Proceedings of the 2019 IEEE 4th International Conference on Cloud Computing and Big Data Analytics, ICCCBDA 2019, Chengdu, China, 12–15 April 2019; pp. 149–154. [Google Scholar] [CrossRef]
- Kim, Y.; An, J.; Lee, M.; Lee, Y. An Activity-Embedding Approach for Next-Activity Prediction in a Multi-User Smart Space. In Proceedings of the 2017 IEEE International Conference on Smart Computing (SMARTCOMP), Hong Kong, China, 29–31 May 2017; pp. 1–6. [Google Scholar] [CrossRef]
- Dotti, D.; Popa, M.; Asteriadis, S. Behavior and Personality Analysis in a Nonsocial Context Dataset. In Proceedings of the 2018 IEEE/CVF Conference on Computer Vision and Pattern Recognition Workshops (CVPRW), Salt Lake City, UT, USA, 18–22 June 2018; pp. 2417–2425. [Google Scholar] [CrossRef]
- Chauhan, J.; Seneviratne, S.; Hu, Y.; Misra, A.; Seneviratne, A.; Lee, Y. Breathing-Based Authentication on Resource-Constrained IoT Devices Using Recurrent Neural Networks. Computer 2018, 51, 60–67. [Google Scholar] [CrossRef]
- Vakakis, N.; Nikolis, O.; Ioannidis, D.; Votis, K.; Tzovaras, D. Cybersecurity in SMEs: The Smart-Home/Office Use Case. In Proceedings of the 2019 IEEE 24th International Workshop on Computer Aided Modeling and Design of Communication Links and Networks (CAMAD), Limassol, Cyprus, 11–13 September 2019; pp. 1–7. [Google Scholar] [CrossRef]
- Ma, Z.; Bigham, J.; Poslad, S.; Wu, B.; Zhang, X.; Bodanese, E. Device-Free, Activity during Daily Life, Recognition Using a Low-Cost Lidar. In Proceedings of the 2018 IEEE Global Communications Conference (GLOBECOM), Abu Dhabi, United Arab Emirates, 9–13 December 2018; pp. 1–6. [Google Scholar] [CrossRef]
- Ahamed, F.; Shahrestani, S.R.; Cheung, H. Intelligent Fall Detection with Wearable IoT. In Advances in Intelligent Systems and Computing, Proceedings of the 13th International Conference on Complex, Intelligent, and Software Intensive Systems, Sydney, Australia, 3–5 July 2019; Springer: Sydney, Australia, 2019; pp. 391–401. [Google Scholar] [CrossRef]
- Sarma, N.; Chakraborty, S.; Banerjee, D.S. Learning and Annotating Activities for Home Automation Using LSTM. In Proceedings of the 2019 11th International Conference on Communication Systems & Networks (COMSNETS), Bengaluru, India, 7–11 January 2019; Volume 2061, pp. 631–636. [Google Scholar] [CrossRef]
- Mobasher-Kashani, M.; Li, J.; Luo, S. Light-Weight Recurrent Deep Learning Algorithm for Non-Intrusive Load Monitoring. In Proceedings of the 2019 IEEE 2nd International Conference on Electronic Information and Communication Technology (ICEICT), Harbin, China, 20–22 January 2019; pp. 572–575. [Google Scholar] [CrossRef]
- Sadreazami, H.; Bolic, M.; Rajan, S. On the Use of Ultra Wideband Radar and Stacked Lstm-Rnn for at Home Fall Detection. In Proceedings of the 2018 IEEE Life Sciences Conference (LSC), Montreal, QC, Canada, 28–30 October 2018; pp. 255–258. [Google Scholar] [CrossRef]
- Sasaki, W.; Fujiwara, M.; Fujimoto, M.; Suwa, H.; Arakawa, Y.; Yasumoto, K. Predicting Occurrence Time of Daily Living Activities Through Time Series Analysis of Smart Home Data. In Proceedings of the 2019 IEEE International Conference on Pervasive Computing and Communications Workshops (PerCom Workshops), Kyoto, Japan, 11–15 March 2019; pp. 233–238. [Google Scholar] [CrossRef]
- Devanne, M.; Papadakis, P.; Nguyen, S.M. Recognition of Activities of Daily Living via Hierarchical Long-Short Term Memory Networks. In Proceedings of the 2019 IEEE International Conference on Systems, Man and Cybernetics (SMC), Bari, Italy, 6–9 October 2019; pp. 3318–3324. [Google Scholar] [CrossRef] [Green Version]
- Riekstin, A.C.; Langevin, A.; Dandres, T.; Gagnon, G.; Cheriet, M. Time Series-Based GHG Emissions Prediction for Smart Homes. IEEE Trans. Sustain. Comput. 2018, 5, 134–146. [Google Scholar] [CrossRef]
- Shojaei-Hashemi, A.; Nasiopoulos, P.; Little, J.J.; Pourazad, M.T. Video-Based Human Fall Detection in Smart Homes Using Deep Learning. In Proceedings of the 2018 IEEE International Symposium on Circuits and Systems (ISCAS), Florence, Italy, 27–30 May 2018. [Google Scholar] [CrossRef]
- Tax, N. Human Activity Prediction in Smart Home Environments with LSTM Neural Networks. In Proceedings of the 2018 14th International Conference on Intelligent Environments (IE), Rome, Italy, 25–28 June 2018; pp. 40–47. [Google Scholar] [CrossRef]
- Cook, D.J.; Crandall, A.S.; Thomas, B.L.; Krishnan, N.C. CASAS: A Smart Home in a Box Diane. Computer 2012, 46, 62–69. [Google Scholar] [CrossRef] [PubMed] [Green Version]
- Powers, D.M.W. Evaluation: From Precision, Recall and F-Factor to ROC, Informedness, Markedness & Correlation. J. Mach. Learn. Technol. 2007, 2, 37–63. [Google Scholar]
- Deng, L. Artificial Intelligence in the Rising Wave of Deep Learning: The Historical Path and Future Outlook. IEEE Signal Process. Mag. 2018, 35, 177–180. [Google Scholar] [CrossRef]
- Núñez-Marcos, A.; Azkune, G.; Arganda-Carreras, I. Vision-Based Fall Detection with Convolutional Neural Networks. Wirel. Commun. Mob. Comput. 2017, 2017, 9474806. [Google Scholar] [CrossRef] [Green Version]
- Misra, I.; Shrivastava, A.; Gupta, A.; Hebert, M. Cross-Stitch Networks for Multi-Task Learning. In Proceedings of the 2016 IEEE Conference on Computer Vision and Pattern Recognition (CVPR), Las Vegas, NV, USA, 27–30 June 2016; pp. 3994–4003. [Google Scholar] [CrossRef] [Green Version]
- Chen, Z.; Li, G.; Fioranelli, F.; Griffiths, H. Personnel Recognition and Gait Classification Based on Multistatic Micro-Doppler Signatures Using Deep Convolutional Neural Networks. IEEE Geosci. Remote Sens. Lett. 2018, 15, 669–673. [Google Scholar] [CrossRef] [Green Version]
- Long, M.; Cao, Z.; Wang, J.; Yu, P.S. Learning Multiple Tasks with Multilinear Relationship Networks. In Advances in Neural Information Processing Systems, Proceedings of 31st Annual Conference on Neural Information Processing Systems, Long Beach, CA, USA, 4–9 December 2017; Curran Associates Inc.: Red Hook, NY, USA, 2017; pp. 1593–1602. [Google Scholar]
- Kelly, J.; Knottenbelt, W. Neural NILM: Deep Neural Networks Applied to Energy Disaggregation. In Proceedings of the 2nd ACM International Conference on Embedded Systems for Energy-Efficient Built, Seoul, Korea, 4–5 November 2015; Association for Computing Machinery: New York, NY, USA, 2015; pp. 55–64. [Google Scholar] [CrossRef] [Green Version]
- Rougier, C.; Auvinet, E.; Rousseau, J.; Mignotte, M.; Meunier, J. Fall Detection from Depth Map Video Sequences; Abdulrazak, B., Giroux, S., Bouchard, B., Pigot, H., Mokhtari, M., Eds.; Springer: Berlin/Heidelberg, Germany, 2011; Volume 6719. [Google Scholar] [CrossRef] [Green Version]
- Planinc, R.; Kampel, M. Introducing the Use of Depth Data for Fall Detection. Pers. Ubiquitous Comput. 2013, 17, 1063–1072. [Google Scholar] [CrossRef]
- Cho, K.; Van Merriënboer, B.; Gulcehre, C.; Bahdanau, D.; Bougares, F.; Schwenk, H.; Bengio, Y. Learning Phrase Representations Using RNN Encoder-Decoder for Statistical Machine Translation. In Proceedings of the 2014 Conference on Empirical Methods in Natural Language Processing, Doha, Qatar, 25–29 October 2014; pp. 1724–1734. [Google Scholar] [CrossRef]
Figure 1.
PRISMA flowchart for study selection.

Figure 2.
Density visualization of keywords.

Figure 3.
Network visualization of CNN keywords.

Figure 4.
Network visualization of RNN keywords.

Figure 5.
Network visualization of LSTM keywords.

Figure 6.
(a) Distribution by DL type; (b) Distribution by year.

Figure 7.
Smart home applications using DL.

Figure 8.
Smart home applications according to DL type.

Figure 9.
(a) Data type; (b) Data format.

Figure 10.
Used public dataset.

Figure 11.
Testing/training data ratio for validation.

Figure 12.
Frequency of used metrics.

Figure 13.
Frequency of used metrics in CNN studies.

Figure 14.
Frequency of used metrics in RNN/LSTM studies.

Figure 15.
Study rate for the elderly.

Table 1.
Comparison with previous studies.
| Ref. | Year | Duration | Technology | Smart Home Services | |
|---|---|---|---|---|---|
| [24] | 2020 | 2011–2019 | GMM, SVM, HMM, DNN, CNN | Sound recognition, User authentication | |
| [25] | 2020 | 2010–2019 | AI | Energy management | |
| [26] | 2019 | 2011–2019 | AI | Activity recognition, Activity prediction, Data classifier, Sound recognition, Energy management | |
| [27] | 2019 | 2010–2017 | ML | Activity recognition, User authentication, Energy management | |
| [28] | 2021 | Upto 2020 | ANN, DNN, CNN, AutoEncoder, DBN, RNN, LSTM | Energy management | |
| Our review | - | 2016–2020 | CNN, RNN, LSTM | All services | |
GMM: Gaussian mixture model, SVM: Support vector machine, HMM: Hidden markov model, DNN: Deep neural network, CNN: Convolutional neural network, ANN: Artificial neural network, DBN: Deep belief network, LSTM: Long-short term memory, RNN: Recurrent neural network, AI: Artificial intelligence.
Table 2.
Database and search results.
| Database | Search | Years | Results |
|---|---|---|---|
| Web of Science | (CNN or “convolutional neural network” or RNN or “recurrent neural network” or LSTM or “long short-term memory”) AND (“smart homes” or “smart home” or “assisted living”) | From 1 January 2016 to 31 March 2020 | CNN: 43 |
| RNN: 21 | |||
| LSTM: 27 | |||
| Scopus | CNN: 111 | ||
| RNN: 72 | |||
| LSTM: 69 | |||
| IEEE Explore | CNN: 111 | ||
| RNN: 75 | |||
| LSTM: 51 | |||
| PubMed | CNN: 27 | ||
| RNN: 10 | |||
| LSTM: 15 | |||
| Total | 632 | CNN: 292 | |
| RNN: 178 | |||
| LSTM: 162 |
Table 3.
Database and search results.
| No. | Evaluation Questions |
|---|---|
| EQ1 | Is it a study on smart homes or a study to improve smart home services? |
| EQ2 | Is its main solution CNN or RNN/LSTM? |
| EQ3 | Are there enough data for data extraction? |
| EQ4 | Is the result of the study clear? |
Table 4.
Data for extraction.
| Data Item | Description | RQ |
|---|---|---|
| {Keywords} | Relevance and importance between keywords | RQ1 |
| {Date of publication} | Research distribution by year | RQ1 |
| {DL, DL category} | DL distribution by year, DL type | RQ1, RQ2 |
| {Objective of study} | The purpose of the study and its results | RQ2, RQ4 |
| {Applications} | DL application in the study | RQ2, RQ4 |
| {Dataset, Data type, Data format} | Dataset used in the study and its composition | RQ3 |
| {Metrics, Results} | Metrics used to evaluate the study and the results | RQ4 |
| {Comparative evaluation} | Comparison with other methods to evaluate research | RQ4 |
| Population target | Targets for research | RQ5 |
Table 5.
DL applied, Objective, and Application of each study.
| Study | ML/DL Model | Category | Application | Objective |
|---|---|---|---|---|
| [32] | CNN L: Cross entropy A: ReLU | Classification Services: chat, video, 5 chat apps. | Data classifier in smart home gateway | The encrypted packet classifier using CNN to improve user experience and to protect user privacy in smart home |
| [18] | CNN A: ReLU | Classification _ binary normal or abnormal gait | Gait recognition | Depth video-based gait recognition method using CNN for health care |
| [33] | CNN modified from AlexNet, VGGNet | Classification 6 gesture categories | Hand gestures control | Multiple hand gesture recognition using CNN for home appliance control |
| [19] | CNN L: categorical cross-entropy A: ELU O: Adam | Classification 7 classes: kitchen faucet, boiling, frying, dishwasher, mixer, doing dishes, cutting bread | Sound recognition | Audio content analysis for event detection in real-world environments |
| [34] | CNN modified from VGG-16 net A: ReLU, Softmax | Classification _ binary fall or not fall | Fall detection | Elderly person fall detection based on new two stream CNN: Shape stream HBMI, Motion stream AOOF |
| [35] | CNN modified from VGG-16 net A: ReLU, Softmax | Classification 8 classes: hand waving, punching, kicking, walking, running, sitting, standing, laying down | Activity recognition | Human activity recognition using thermal imaging cameras to improve the accuracy of motion recognition |
| [36] | CNN A: sigmoid, SoftMax k-means, PCA | Classification _ binary normal or abnormal | Intrusion detection | Hybrid intrusion detection method based on CNN and k-means |
| [37] | CNN L: MSE, Softmax loss, Center loss A: Sigmoid, ReLU O: Adam | Classification 1. 6 motions: punch, crawl, creep, jump, run, walk 2. 15 subjects | Person identification, Motion recognition | Joint motion classification and person identification using CNN |
| [38] | CNN L: Binary cross-entropy A: ReLU, Sigmoid | Classification _ binary on or off | Appliance usage status prediction | Prediction of appliance status on the total energy consumption |
| [39] | CNN L: Softmax loss A: Softmax | Classification 10 attitudes | Body gesture control | Smart home control system using human body point cloud data |
| [40] | CNN 1. 2 layered CNN 2. 3 layered CNN 3. Squeeze Net | Classification 6 classes: 4 speakers, silence, unknown | Speaker recognition and identification | Effectiveness evaluation of speaker recognition using various CNN with limited training data |
| [41] | CNN L: Cross Entropy A: ReLU O: ADAM | Classification 6 gestures: right, left, push, pull, down, up | Gesture recognition | Device-free gesture recognition technology to automatically identify gestures by IoT devices |
| [20] | CNN A: SELU, ReLU | Classification 4 combinations of high and low of valence and arousal | Emotion recognition | Subject-dependent emotion classification using electrodermal activity sensors |
| [42] | CNN | Classification 10 activities: eating, bed to toilet, relax, meal preparation, sleeping, work, housekeeping, wash dishes, enter/leave | Activity recognition | Unobtrusive activity recognition application for older people living alone |
| [43] | CNN + LSTM L: Categorical cross entropy, Huber A: ReLU, Softmax | Classification: Category of daily activity Regression: Occurrence time forecast | Activity prediction | Forecast model to predict category of activity and occurrence time through multi-task learning |
| [44] | DBN CNN A: ReLU | Classification 4 classes: walk, lying down, sitting, standing | Activity recognition | Comparison of two deep neural networks to conduct the activity recognition using the multi-modal data |
| [21] | CNN LSTM A: Sigmoid, tanh | Classification House A: 10 activities/House B: 13 activities/House C: 16 activities | Activity recognition | Activity recognition study from raw sensors using CNN in smart homes |
| [22] | CNN, LSTM 1. 1D CNN 2. 2D CNN 3. 2D CNN + LSTM | Classification _ binary normal or abnormal activity | Activity recognition for dementia | Detection of abnormal behavior related to dementia |
| [45] | Autoencoder CNN, CNN + LSTM 1. Multiview LSTM+CNN 2. Multiview 3D CNN | Classification 6 categories: walking, falling, lying down, climbing up, bending, and sitting down | Activity recognition | Activity autolabeling and human behavior recognition in multiview videos using CNN and LSTM |
| [46] | CNN + GRU | Classification 10 appliance states | Appliance State Recognition | Non-intrusive household appliance state recognition system using CNN and GRU |
| [47] | CNN A: Softmax | Classification 1. UCI dataset: 6 activities 2. New dataset: 9 activities | Activity recognition with wearable sensor | The most common daily activity recognition with prototyped wearable sensor and CNN |
| [48] | CNN + RNN | Classification 1. ShakeLogin: 9 subjects 2. HHAR: 17 subjects | User authentication | User Identification using smartphone sensor for smart home service |
| [49] | CNN + SVM A: ReLU, Softmax | Classification 6 actions: walking, sitting, lying, standing, jogging and jumping. | Activity recognition | Recognition of six ordinary human actions by using spatial information obtained from the ubisense positioning system |
| [50] | LSTM A: tanh | Classification 12 activities | Activity recognition | Human activity recognition using accelerometer and gyroscope sensor data in smartphone |
| [51] | RNN A: Softmax | Classification 1. Tower: 7 classes 2. Aruba: 10 classes 3. HBMS(New): 10 classes | Activity recognition | Activity recognition system using RNN that recognizes human activities with respect to the multi-class classification |
| [52] | RNN, LSTM, GRU | Classification 9 activities: drinking, washing, eating, opening the refrigerator, turning on the light, opening the door, using the computer, watching TV, cooking | Activity recognition | Activity recognition with the sensor data from the smart environment using RNN, LSTM, and GRU model for the elderly |
| [53] | RNN + LSTM L: Cross-entropy A: Sigmoid O: Adam | Classification 6 common daily activities: running, walking, standing, sitting, crouching, lying down | Activity recognition | Activity recognition through the relationship between human activities and Wi-Fi CSI using RNN |
| [23] | LSTM 1. LSTM 2. Bi-LSTM 3. Casc-LSTM 4. Ens2-LSTM 5. CascEns-LSTM | Classification 12 activities: personal hygiene, sleep, bed to toilet, eat, cook, work, leave home, enter home, relax, take medicine, bathe and others | Activity recognition | Human activities recognition in smart homes using various LSTM algorithm architecture |
| [54] | LSTM L: Average absolute error A: tanh, Sigmoid O: Adam | Regression: Thermal energy usage prediction | Thermal energy usage prediction | Thermal energy usage prediction to avoid the energy loss using LSTM based on electric heating and weather data |
| [55] | LSTM : Predict next activity k-means (clustering) : Determine number of next-activity | Classification 23 activities | Activity Prediction | Activity embedding and next-activity prediction algorithm built on LSTM in a Multi-User Smart Space |
| [56] | LSTM L: cross entropy A: sigmoid Autoencoders, Gaussian Mixture Models | Classification 3 major personalities: resilient, undercontrolled, overcontrolled | Personality prediction based on ADL | Mapping nonverbal behavioral features to participants’ personality labels. |
| [57] | LSTM SVM | Classification 10 users | User authentication | Authentication system based on breathing acoustics using SVM and LSTM |
| [58] | LSTM L: MSE O: Adam | Classification _ binary normal or abnormal | Cybersecurity | Security solution using dataset of protocols and network to prevent cybercrime |
| [59] | LSTM | Classification 17 activities | Activity Prediction | Recognize activities using LSTM model based on centimeter level location data |
| [60] | FFNN LSTM O: Adam | Classification _ binary fall or ADL | Fall detection | Accelerometer-based fall detection using FFNN and LSTM |
| [61] | LSTM 1. LSTM 2. bi-LSTM 3. GRU Naive-Bayes | Classification Aruba: 2 unlabeled activities | Activity recognition | Unlabeled activity recognition using LSTM |
| [62] | LSTM A: tanh, ReLU, Linear | Regression: Predict power consumption | Predict individual appliance’s power consumption | LSTM model to disaggregate and predict individual appliance power signals from the overall power consumption |
| [63] | LSTM A: tanh, SoftMax | Classification _ binary fall or non-fall | Fall detection | LSTM fall detection using Ultra wideband radar |
| [64] | LSTM A: SoftMax | Classification 1. 7 time ranges 2. 3 classes: occurrence time | Predicting occurrence time of ADL | Occurrence time prediction of daily activities from sensor data |
| [65] | LSTM A: sigmoid, tanh | Classification 11 activities in the kitchen | Activity recognition | Complex activity recognition using temporal hierarchical model composed of LSTM layers |
| [66] | LSTM A: sigmoid, tanh O: RMSProp | Regression | Predict greenhouse gases emissions | Day-ahead GHG emissions prediction using LSTM 1) decide when to start the dishwasher2) find the optimal time to charge an electric vehicle (EV) |
| [67] | LSTM L: Softmax A: ReLU | Classification _ binary fall or non-fall | Fall detection | Video-based fall detection study in indoor environments |
| [68] | LSTM GRU A: sigmoid, tanh | Regression: Predict next activity | Prediction of future events of human behavior | Prediction performance evaluation on smart home datasets 1. Prediction of the next activity 2. Time until the next event 3. Prediction of a window of next activities |
ML: Machine Learning, DL: Deep Learning, CNN: Convolutional neural network, LSTM: Long-short term memory, RNN: Recurrent neural network, GRU: Gated recurrent unit, ReLU: Rectified Linear Units, tanh: Hyperbolic tangent function, FFNN: Feed Forward Neural Network, RMSProp: Root Mean Square Propagation, SELU: Scaled Exponential Linear Units, ELU: Exponential linear unit, L: Loss function, A: Activation function, O: Optimizer.
Table 6.
Use of sensor data.
| Type | Application | Dataset | Sensors | Study |
|---|---|---|---|---|
| Public data | Activity recognition or Activity prediction | Aruba_CASAS | Motion sensors, Door sensors, Temperature sensors | [22,42,43,51,61] |
| Adlnormal_CASAS | Motion sensors, Temperature sensors, Door sensors, Light sensors | [43] | ||
| Cairo_CASAS | Motion sensors, Temperature sensors, Door sensors, Light sensors | [23,43] | ||
| Tulum_CASAS | Motion sensors, Temperature sensors, Door sensors, Light sensors | [43,61] | ||
| WSU_CASAS | Motion sensors, Door sensors, Temperature sensors | [22] | ||
| Tower_CASAS | Motion sensors, Temperature sensors, Door sensors, Burner sensors, Hot and Cold water sensors, Electric sensors | [51] | ||
| Milan_CASAS | Motion sensors, Door sensors, Temperature sensors | [23] | ||
| Kyoto_CASAS | Motion sensors, Temperature sensors, Door sensors, Burner sensors, Hot and Cold water sensors, Electric sensors | [23] | ||
| hh_CASAS | Motion sensors, Door sensors, Temperature sensors | [68] | ||
| van Kasteren | Motion sensors, Pressure sensors (couch, bed) Door sensors, Toilet usage detectors (float sensors) | [21,68] | ||
| MavLab | Motion sensors, Temperature sensors, Door sensors, Light sensors | [43] | ||
| SPHERE | Wearable accelerometer, Motion sensors | [44] | ||
| UCI | Wearable sensors: accelerometer, gyroscope, and magnetometer | [47] | ||
| MIT B | State-Change Sensor | [68] | ||
| User authentication | HHAR | Smartphone internal sensors: accelerometer, gyroscope, and magnetometer rotation vector | [48] | |
| Emotion recognition | MAHNOB | Physiological signals: Electroencephalogram, Blood volume pressure, Respiration pattern, Skin temperature, Electromyogram, Electrooculogram, Electrocardiogram, and EDA | [20] | |
| DEAP | Physiological signals: Electroencephalogram, Blood volume pressure, Respiration pattern, Skin temperature, Electromyogram, Electrooculogram, Electrocardiogram, and EDA | [20] | ||
| Predict power consumption | IAWE dataset | Ambient sensor, Water sensor, electricity on/off sensor | [62] | |
| New data | Activity recognition or Activity prediction | 9 activity data | Wearable sensors: accelerometer, gyroscope, and magnetometer | [47] |
| Spatial location data | Wearable ultrawide band: right wrist, right waist, and right ankle | [49] | ||
| 561 features data | Smartphone sensors: accelerometer, gyroscope | [50] | ||
| Human behavior modeling dataset | Door sensors, Switches, Temperature and Humidity sensors, Occupancy sensors | [51] | ||
| Sensor data for activities | Touch sensor, Tilt sensor, Height sensor, Weight sensor, Reed switch, Infrared sensor | [52] | ||
| Multi-user activity data | Occupancy sensor, Ambient sensor (temperature, brightness, Humidity, Sound), Screen sensor, Door sensor, Seat occupancy sensor | [55] | ||
| ADL data | Ultrasonic Positioning System (Position), Bluetooth watt checker (power consumption), CT Sensor (power consumption), ECHONET (appliance status), Motion sensor (motion detect) | [64] | ||
| User authentication | ShakeLogin data | Smartphone internal sensors: accelerometer gyroscope, rotation vector | [48] |
Table 7.
Evaluation results by Accuracy, Precision, Recall, and F1-score metrics.
| Study | DL | Application | Accuracy | Precision | Recall | F1-Score |
|---|---|---|---|---|---|---|
| [32] | CNN | Data classifier in smart home gateway | 99% | - | - | - |
| [18] | CNN | Gait recognition | 98.50% | - | - | - |
| [33] | CNN | Hand gestures control | 84.99% | - | - | - |
| [19] | CNN | Sound recognition | 96% | 94.60% | 90.90% | 90.20% |
| [35] | CNN | Human Activity Recognition | 95.90% | - | - | - |
| [36] | CNN | Intrusion Detection | 99.84%, | - | - | - |
| [37] | CNN | Person identification, Motion recognition | Motion: 98.50% | - | - | - |
| Identification: 80.92% | ||||||
| joint: 80.57%. | ||||||
| [38] | CNN | Appliance usage status prediction for energy management | - | - | - | Laundry: 80.6% |
| Entertainment: 45.5% | ||||||
| Preparing food: 82.1% | ||||||
| [39] | CNN | Body gesture control | 93% | - | - | - |
| [40] | CNN | Speaker identification | - | 92% | 92% | 92% |
| [20] | CNN | Emotion recognition | (highest) 85% | (highest) 85% | (highest) 85% | (highest) 85% |
| [42] | CNN | Activity recognition | 10 activities: 98.54% | 10 activities: 81.9% | 10 activities: 79% | 10 activities: 79% |
| 8 activities: 99.23% | 8 activities: 96.1% | 8 activities: 94.9% | 8 activities: 95.1% | |||
| [43] | CNN + LSTM | Activity prediction | Adlnormal: 93.23% | Cairo: 92.03% | Cairo: 90.75% | Cairo: 91.19% |
| MavLab: 86.73% | Tulum: 84.41% | Tulum: 84.01% | Tulum: 84.09% | |||
| Aruba: 89.22% | Aruba: 84.77% | Aruba: 86.69% | ||||
| [44] | CNN | Activity recognition | 75.33% | - | - | - |
| [21] | CNNLSTM | Activity recognition | LSTM: 89.8% | - | - | - |
| CNN: 88.2% | ||||||
| [22] | CNN, LSTM | Activity recognition for dementia | 89.72% | 51.20% | 50.55% | 50.87% |
| [45] | CNN, CNN + LSTM | Activity recognition | CNN + LSTM: 99.9% | CNN + LSTM: 98% | CNN + LSTM: 98% | CNN + LSTM: 98% |
| CNN: 94.99% | CNN: 95% | CNN: 95% | CNN: 95% | |||
| [46] | CNN + GRU | Appliance State Recognition | 92.90% | 93.80% | 91.80% | 92.90% |
| [47] | CNN | Activity recognition with wearable sensor | (global) UCI: 92.5% | (highest) UCI: 99% | (highest) UCI: 99% | (highest) UCI: 98% |
| New: 97% | New: 99% | New: 98% | New: 99% | |||
| [48] | CNN + RNN | User Identification | ShakeLogin: 91.45% | - | - | - |
| HHAR: 96.41% | ||||||
| [49] | CNN + SVM | Activity recognition | 85.7–89.75% | - | - | - |
| [50] | LSTM | Activity recognition | 97% | - | 91% | - |
| [51] | RNN | Activity recognition | - | (highest) 1. Tower: 95.65% | (highest) 1. Tower: 97.18% | - |
| 2. Aruba: 100% | 2. Aruba: 96.47% | |||||
| 3. HBMS: 100% | 3. HBMS: 100% | |||||
| [52] | RNN, LSTM, GRU | Activity recognition | LSTM: 97.84% | - | - | - |
| GRU: 97.75% | ||||||
| RNN: 96.96% | ||||||
| [53] | RNN, LSTM | Activity recognition | 98% | - | - | - |
| [23] | LSTM | Activity recognition | (highest) 94.24% | (highest) 94.33% | (highest) 94.33% | (highest) 94% |
| [55] | LSTM | Activity Prediction | 82% | - | - | - |
| [56] | LSTM | Personality predictor | - | - | 61.16% | 73.95% |
| [57] | LSTM | User authentication | 90% | - | - | - |
| [59] | LSTM | Activity Prediction | 88% | - | - | - |
| [60] | LSTM | Fall detection | 97.10% | 97.10% | - | - |
| [61] | LSTM | Activity recognition | Aruba: 79.5% | (highest) 95.2% | - | (highest) 91.9% |
| Tulum: 91.95% | ||||||
| [62] | LSTM | Predict individual appliance power consumption | 99% | - | - | - |
| [63] | LSTM | Fall detection | 89.80% | 95.04% | - | - |
| [64] | LSTM | Human activity recognition: Predicting occurrence time | (highest) 92.1% | - | (highest) 92.1% | - |
| [65] | LSTM | Activity recognition | Frame: 58–58.9% | - | - | - |
| Segment: 38.8–40.2% | ||||||
| [67] | LSTM | Fall detection | - | 93% | 96% | - |
| [68] | LSTM GRU | Prediction of future events of human behavior | LSTM: 52.9% | - | - | - |
| GRU: 51.2% |
Publisher’s Note: MDPI stays neutral with regard to jurisdictional claims in published maps and institutional affiliations. |
© 2022 by the authors. Licensee MDPI, Basel, Switzerland. This article is an open access article distributed under the terms and conditions of the Creative Commons Attribution (CC BY) license (https://creativecommons.org/licenses/by/4.0/).
Share and Cite
MDPI and ACS Style
Yu, J.; de Antonio, A.; Villalba-Mora, E. Deep Learning (CNN, RNN) Applications for Smart Homes: A Systematic Review. Computers 2022, 11, 26. https://0-doi-org.brum.beds.ac.uk/10.3390/computers11020026
AMA Style
Yu J, de Antonio A, Villalba-Mora E. Deep Learning (CNN, RNN) Applications for Smart Homes: A Systematic Review. Computers. 2022; 11(2):26. https://0-doi-org.brum.beds.ac.uk/10.3390/computers11020026
Chicago/Turabian StyleYu, Jiyeon, Angelica de Antonio, and Elena Villalba-Mora. 2022. "Deep Learning (CNN, RNN) Applications for Smart Homes: A Systematic Review" Computers 11, no. 2: 26. https://0-doi-org.brum.beds.ac.uk/10.3390/computers11020026
Note that from the first issue of 2016, this journal uses article numbers instead of page numbers. See further details here.