Deliberation Enhances the Confirmation Bias in Politics


1
Department of Economics and CERPA, Appalachian State University, Boone, NC 28607, USA
2
IZA Institute of Labor Economics, 53113 Bonn, Germany
3
ESI, Chapman University, Orange, CA 92866, USA
Games 2020, 11(4), 57; https://0-doi-org.brum.beds.ac.uk/10.3390/g11040057
Submission received: 15 October 2020
/
Revised: 17 November 2020
/
Accepted: 24 November 2020
/
Published: 27 November 2020
(This article belongs to the Special Issue Limited Attention)
Abstract
:The confirmation bias, unlike other decision biases, has been shown both empirically and in theory to be enhanced with deliberation. This suggests that limited attention, reduced deliberation, or limited available cognitive resources may moderate this bias. We aimed to test this hypothesis using a validated confirmation bias task in conjunction with a protocol that randomly assigned individuals to one week of at-home sleep restriction (SR) or well-rested (WR) sleep levels. We also used a measure of cognitive reflection as an additional proxy for deliberation in our analysis. We tested the hypotheses that the confirmation bias would be stronger for WR participants and those higher in cognitive reflection on a sample of 197 young adults. Our results replicated previous findings, and both males and females separately displayed the confirmation bias. Regarding our deliberation hypotheses, the confirmation bias results were most precisely estimated for those having thought relatively more about the issue of gun control. Additionally, for the subset of individuals having thought relatively more about gun control, we found evidence that the confirmation bias was stronger for those higher in cognitive reflection and, somewhat less robustly, for those participants who were (objectively) well-rested.
1. Introduction
The confirmation bias has been well documented in the political domain [1,2,3,4,5,6,7]. Political polarization is a timely topic, and this paper examines the hypothesis that deliberation promotes the confirmation bias. Cognitive dissonance theory [8] suggests it is rational to engage in selective information exposure to reduce cognitive dissonance [9,10,11]. Dissonance may also be reduced by discounting the value of arguments opposed to one’s viewpoints. It is likely difficult to address and resolve the confirmation bias, and this study adds to our understanding of this behavioral phenomenon by examining how one’s thinking style or cognitive state may play a key role in its development.
Recent neuroscience findings [12,13] suggest the confirmation bias may result from the anticipation of cognitive dissonance [11] and a desire to avoid regret (Nicolle et al., [14]). This would imply that the bias results from thoughtfulness rather than the lack of thought. Theory has also described the confirmation bias as resulting from deliberative reasoning [15]. Recent evidence supporting this viewpoint was reported in Knobloch-Westerwick et al. [4], who found that cognitive reflection heightened the political confirmation bias. Another study found that higher cognitive reflection and increased thought put into an issue predicted a stronger confirmation bias in both the political and religious domains, but one’s self-reported sleepiness did not significantly affect the bias [16]. Overall, these previous findings suggest that limited attention, thought, or reflection on an issue may lead to less confirmation bias if one considers a framework where deliberation is what promotes this bias.
This paper first contributes to the literature by replicating classic confirmation bias findings [6] extended to include an examination of gender differences in this bias. We also replicate recent confirmation bias results showing that deliberation or cognitive reflection promotes the bias [4,16]. Secondly, we further the literature by testing a novel extension of this deliberation hypothesis by using a state of sufficient sleep (i.e., well-rested) as a proxy for deliberation—in this case, sleep restriction would then proxy for limited attention or limited deliberation. Dickinson [16] used self-reported sleepiness as one of several proxies for deliberation in evaluating the confirmation bias, but such a measure was inherently weak given participants were allowed to self-regulate their sleep levels with no experimental intervention. Here, we address this concern by drawing from participants in a larger study who were randomly assigned a sleep level for one week. Insufficient sleep is highly relevant in modern society—approximately one-third of adults in many countries have been found to suffer from insufficient sleep [17]—and so there is a naturally occurring heterogeneity in sleep states in the population. While some people may voluntarily subscribe to insufficient sleep levels in the real world, many are in such a state by constraint (e.g., young children in the household, shift-work scheduling). In the present study, the confirmation bias task was administered to participants involved in a separate 1 week sleep study who had been randomly assigned to a sleep restricted (SR: 5–6 h/night attempted sleep) or well-rested (WR: 8–9 h/night attempted sleep) treatment. The ecologically valid sleep protocol took place in one’s home environment using objective and validated sleep-tracking instrumentation, and the experimental (random) assignment of sleep levels helps us more confidently assess any causal link between insufficient sleep and the confirmation bias compared to a purely observational study.
The sleep study offered the unique opportunity to examine how a commonly experienced cognitive state may impact susceptibility to the confirmation bias. Specifically, we hypothesized that individuals in a randomly assigned WR state, who we assume should have additional cognitive resources available for deliberation, will display an enhanced confirmation bias relative to SR participants. Similar to Knobloch-Westerwick et al. [4], we also hypothesized that those higher in cognitive reflection will display a larger confirmation bias, although our task tested this on a distinct outcome measure. In other words, a goal of the present paper is to extend the boundaries of recent research that shows cognitive reflection enhances the confirmation bias, rather than mitigates it. Additionally, because sleep restriction is known to promote decision making consistent with reduced deliberation1, this implies that being in a well-rested state may be hypothesized to actually promote a greater confirmation bias.
2. Methods
Participants in our study were recruited from those enrolled in a larger research study on sleep and decision making. Other tasks administered to the participants were strategic noncooperative tasks that were independent from the survey administered for this paper, and these other tasks were administered in person during a lab visit at the end of the study. As noted below, participants in the larger research study were given the opportunity to participate in this independent online survey study for additional compensation. The fact that we only offered this confirmation bias task survey study to those in the larger sleep-and-decision study implied we would have objective sleep data on our participants that resulted from a validated random assignment sleep restriction methodology.
The sleep methodology used for the larger study is described in more detail elsewhere [19], but we summarize the methods here. Participants were recruited from a database of individuals at a public university who completed a short online screening survey. This survey elicited basic demographic information as well as basic sleep and mood disorder information on potential participants that were used as screening criteria for “sleep and decision making” studies, in general. Exclusion criteria for this study were: self-reported sleep disorder, at risk of major depressive or anxiety disorder, older than 39 years of age (young adult age range approved was 18–39 years old individuals), and no extreme diurnal preferences (i.e., no extreme morning-type or evening-type participants).2 Participants meeting the inclusion criteria were recruited to take part in a study involving a 1-week sleep manipulation prior to decision-making. Viable participants were randomly assigned to a sleep-restricted (SR: 5–6 h per night) or well-rested (WR: 8–9 h per night) condition, which took place in the participant’s home environment. Recruitment emails then specified the randomly assigned sleep condition, and no switching of sleep condition was allowed. The larger sleep study required participants to submit sleep diaries and have sleep tracked using research-grade actigraphy devices. Sleep data were scored using accepted protocols (e.g., [23]) such that we had valid data on sleep levels from each participant in the study.
For the present confirmation bias study, an email was sent after the 5th (of 7) night of the sleep-week protocol inviting participation in an additional compensated online study. Participants had roughly 48 h in which to complete the online survey (prior to the end of the main study). This implies that all those represented in our sample for this study had undergone at least 5 nights of the prescribed sleep levels for the larger main study, and this was considered sufficient to treat the participant in the sleep condition.3 As this additional study was optional and recruited participants may also fail to complete the sleep protocol, we address potential selection bias in the Results section.4
The survey administered to our confirmation bias study sample first elicited information on political preferences, attitudes, and ideology. Across the entire survey, the participant would only advance after completing each question or task and was not allowed to go back to any previous survey page. The key independent measure used to assess the confirmation bias was one’s response on a 5-point scale of self-reported political ideology we called the Liberal Score (1 = Very Conservative, 5 = Very Liberal). Taber and Lodge [6] classified individuals as Democrat or Republicans, but our survey elicited political party classifications to include “Independent” and “other”, along with “Democrat” and “Republican”. As such, we adopted a 5-point scale as a general continuous political ideology measure for our analysis. In our sample, Democrat participants had a significantly higher scores compared to non-Democrat participants (i.e., Conservatives, Independents, or “other”) on the Liberal Score measure (Mann–Whitney test of medians: z = 8.537, p < 0.001). This is what one would expect, and this supports the validity of the Liberal Score metric.
The political issue we used to assess the confirmation bias was “gun control”, following Taber and Lodge [6] (see Appendix B), which contained two components. The “information exposure” component of the task required viewing 6 arguments on gun control, where one could choose the argument’s source (2 liberal and 2 conservative source options were used, as in Taber and Lodge [6] such that it was possible to view arguments entirely from one-side, the other side, or on both sides of the issue of gun control. Specifically, for each of the 6 arguments, one could select to see an argument whose source was either the Republican Party, the National Rifle Association, the Democratic Party, or the Brady Campaign to Prevent Gun Violence (and the task instructions made clear that the first 2 sources were against gun control while the second 2 were in favor of gun control). After the first argument source choice was made, an argument (clip) was displayed to the participant on a new survey page from the library of 6 arguments from that source (see Appendix B for the full library of arguments from each source). After viewing the clip, a new page asked the participant from which of the same set of sources he/she would like to view the second argument. This process continued until 6 separate arguments had been viewed from self-selected sources. The next (distinct) “argument assessment” component of the confirmation bias task presented all participants with 3 pro-gun-control and 3 pro-gun-rights arguments, each on separate survey pages, and on the page of each argument we elicited the individual’s perception of how strong/weak the argument was.
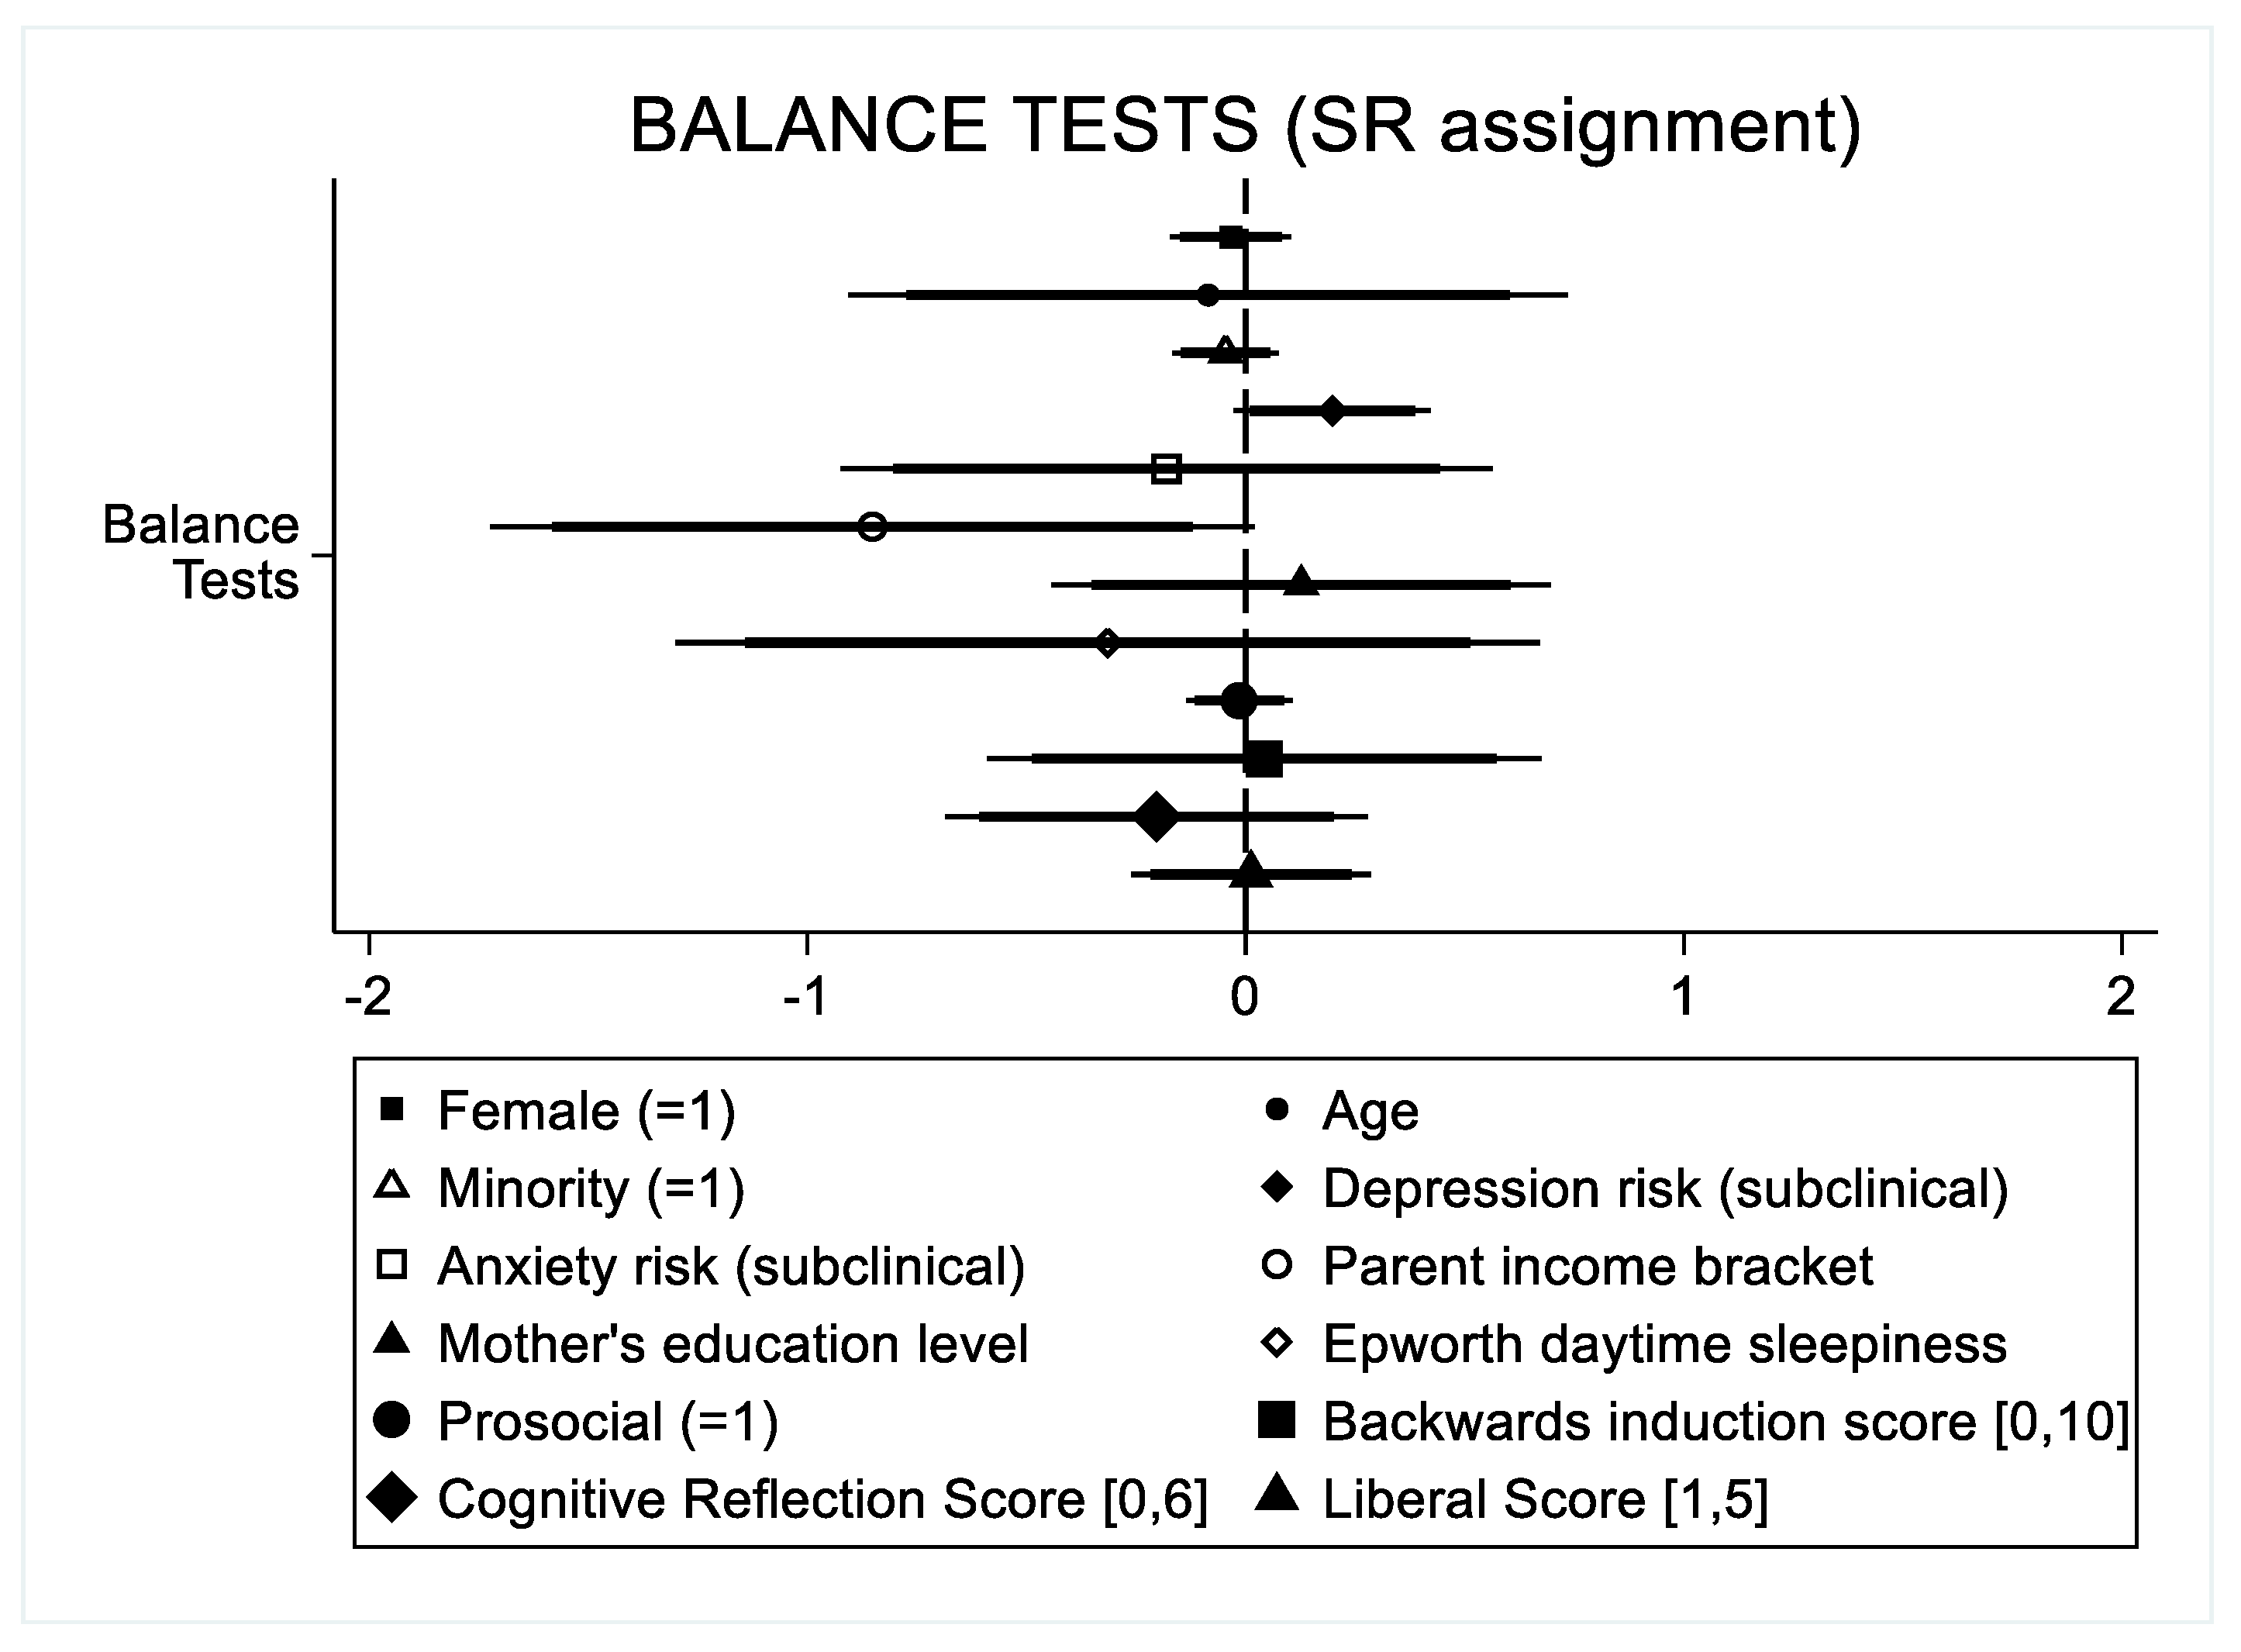
Regarding the deliberation hypothesis, we elicited how much thought the individual had put into the issue of gun control on a 0–100 scale, and we also administered a validated 6-point cognitive reflection task (CRT) [26] as a proxy for deliberation. The individual’s randomly assigned sleep treatment, SR = 0 or 1, served as a final proxy measure for deliberation. See Appendix B for complete survey and variable construction details. Additional measures used as control variables in the analysis included demographics, one’s morningness–eveningness measure [22], one’s daytime chronic sleepiness score [27], as well as baseline measures of prosociality and backwards induction generated as baseline measures in the main sleep study.5 Table 1 shows summary statistics on our sample of n = 197 participants. Female participants (n = 121) were significantly more liberal on our 1–5 scale than male participants (Liberal Score of 3.50 compared to 2.92, 2-sample t-test p < 0.01), and minority participants (n = 47) were marginally more liberal than nonminority participants (Liberal Score of 3.49 compared to 3.21, 2-sample t-test p = 0.08). Overall, the sample was well balanced on observable characteristics across randomly assigned sleep treatments (see Figure A1), and the sleep protocol was valid—SR assignment reduced objective sleep levels (Mann–Whitney test: p < 0.001), increased subjective sleepiness (Mann–Whitney test: p < 0.001), and reduced self-reported attentiveness (Mann–Whitney test: p < 0.001).
As part of our sensitivity analysis we also explicitly addressed the potential selection concern in our sample by first conducting a Probit estimation of the likelihood of inclusion in our sample, conditional on recruitment into the main study (see Table A1 for results from the selection equation). The estimated selection equation shows that, using the measured characteristics we had available on participants in the larger sleep study, only daytime sleepiness (Epworth) predicted a higher likelihood of selecting into our sample (i.e., choosing to participant in the confirmation bias online study). We then calculated the predicted likelihood of completing the online confirmation bias study, as a function of the observable demographic, sleep, and mood disorder measures we had (see Table A1). Using these predicted probabilities, we then constructed the inverse probability weights (IPW) and used these to perform weighted least squares analysis (our IPW-corrected analysis) in all our tests of Hypotheses 1 and 2.6 While this does not address the need to eventually extend this research to a more broad representation of the population, this approach does address the concern for selection bias into this confirmation task data set among those who were enrolled in the larger sleep study. Compensation for this study was a fixed USD 5 Amazon gift code and was separate from compensation for completing the sleep protocol.7
3. Hypotheses
As discussed in the Methods section, our task replicates the Taber and Lodge [6] decision environment used to study the confirmation bias in those with a politically liberal versus conservative ideology. The issue we used as the subject of our task environment was “gun control”.8 The two-part task allows us to evaluate one’s choice to expose oneself to politically dissonant (or consonant) arguments, as well as whether perceptions of arguments from the opposing ideology are viewed as weaker. These are articulated in our Hypothesis 1 below. The second hypothesis is with respect to the deliberation hypothesis, which we evaluate using a standard measure of cognitive reflection as well as one’s sleep state to proxy for deliberation. This deliberation hypothesis derives from the aforementioned studies that suggest theoretical frameworks whereby reason patterns of thought can produce the bias [15], as well as recent empirical studies showing evidence that some form of increased thought or reflection enhances the bias [4,16].
Hypothesis 1.
Those with more liberal political ideology will expose themselves to fewer conservative ideology statements, and view conservative arguments as being weaker.
Hypothesis 2.
Deliberation will enhance the confirmation bias. Deliberation will be assessed using a measure of cognitive reflection as well as one’s randomly assigned sleep state.
We share below the confirmation bias task results estimated from both the full sample as well as the subsample of those deemed to have been compliant with their assigned sleep condition (SR sleep ≤ 375 min/night, WR sleep ≥ 405 min/night)—not every participant’s objectively measured nightly sleep fell within the designated levels for SR or WR. This approach has been used previously to distinguish between participants who may or may not have put much effort into complying with their prescribed sleep assignment (e.g, [19]). Inherently, there is some subjectivity to the boundaries of any such compliance cutoff points, and so for this reason we also conducted and report estimation results on the full “intent-to-treat” sample of participants.
4. Results
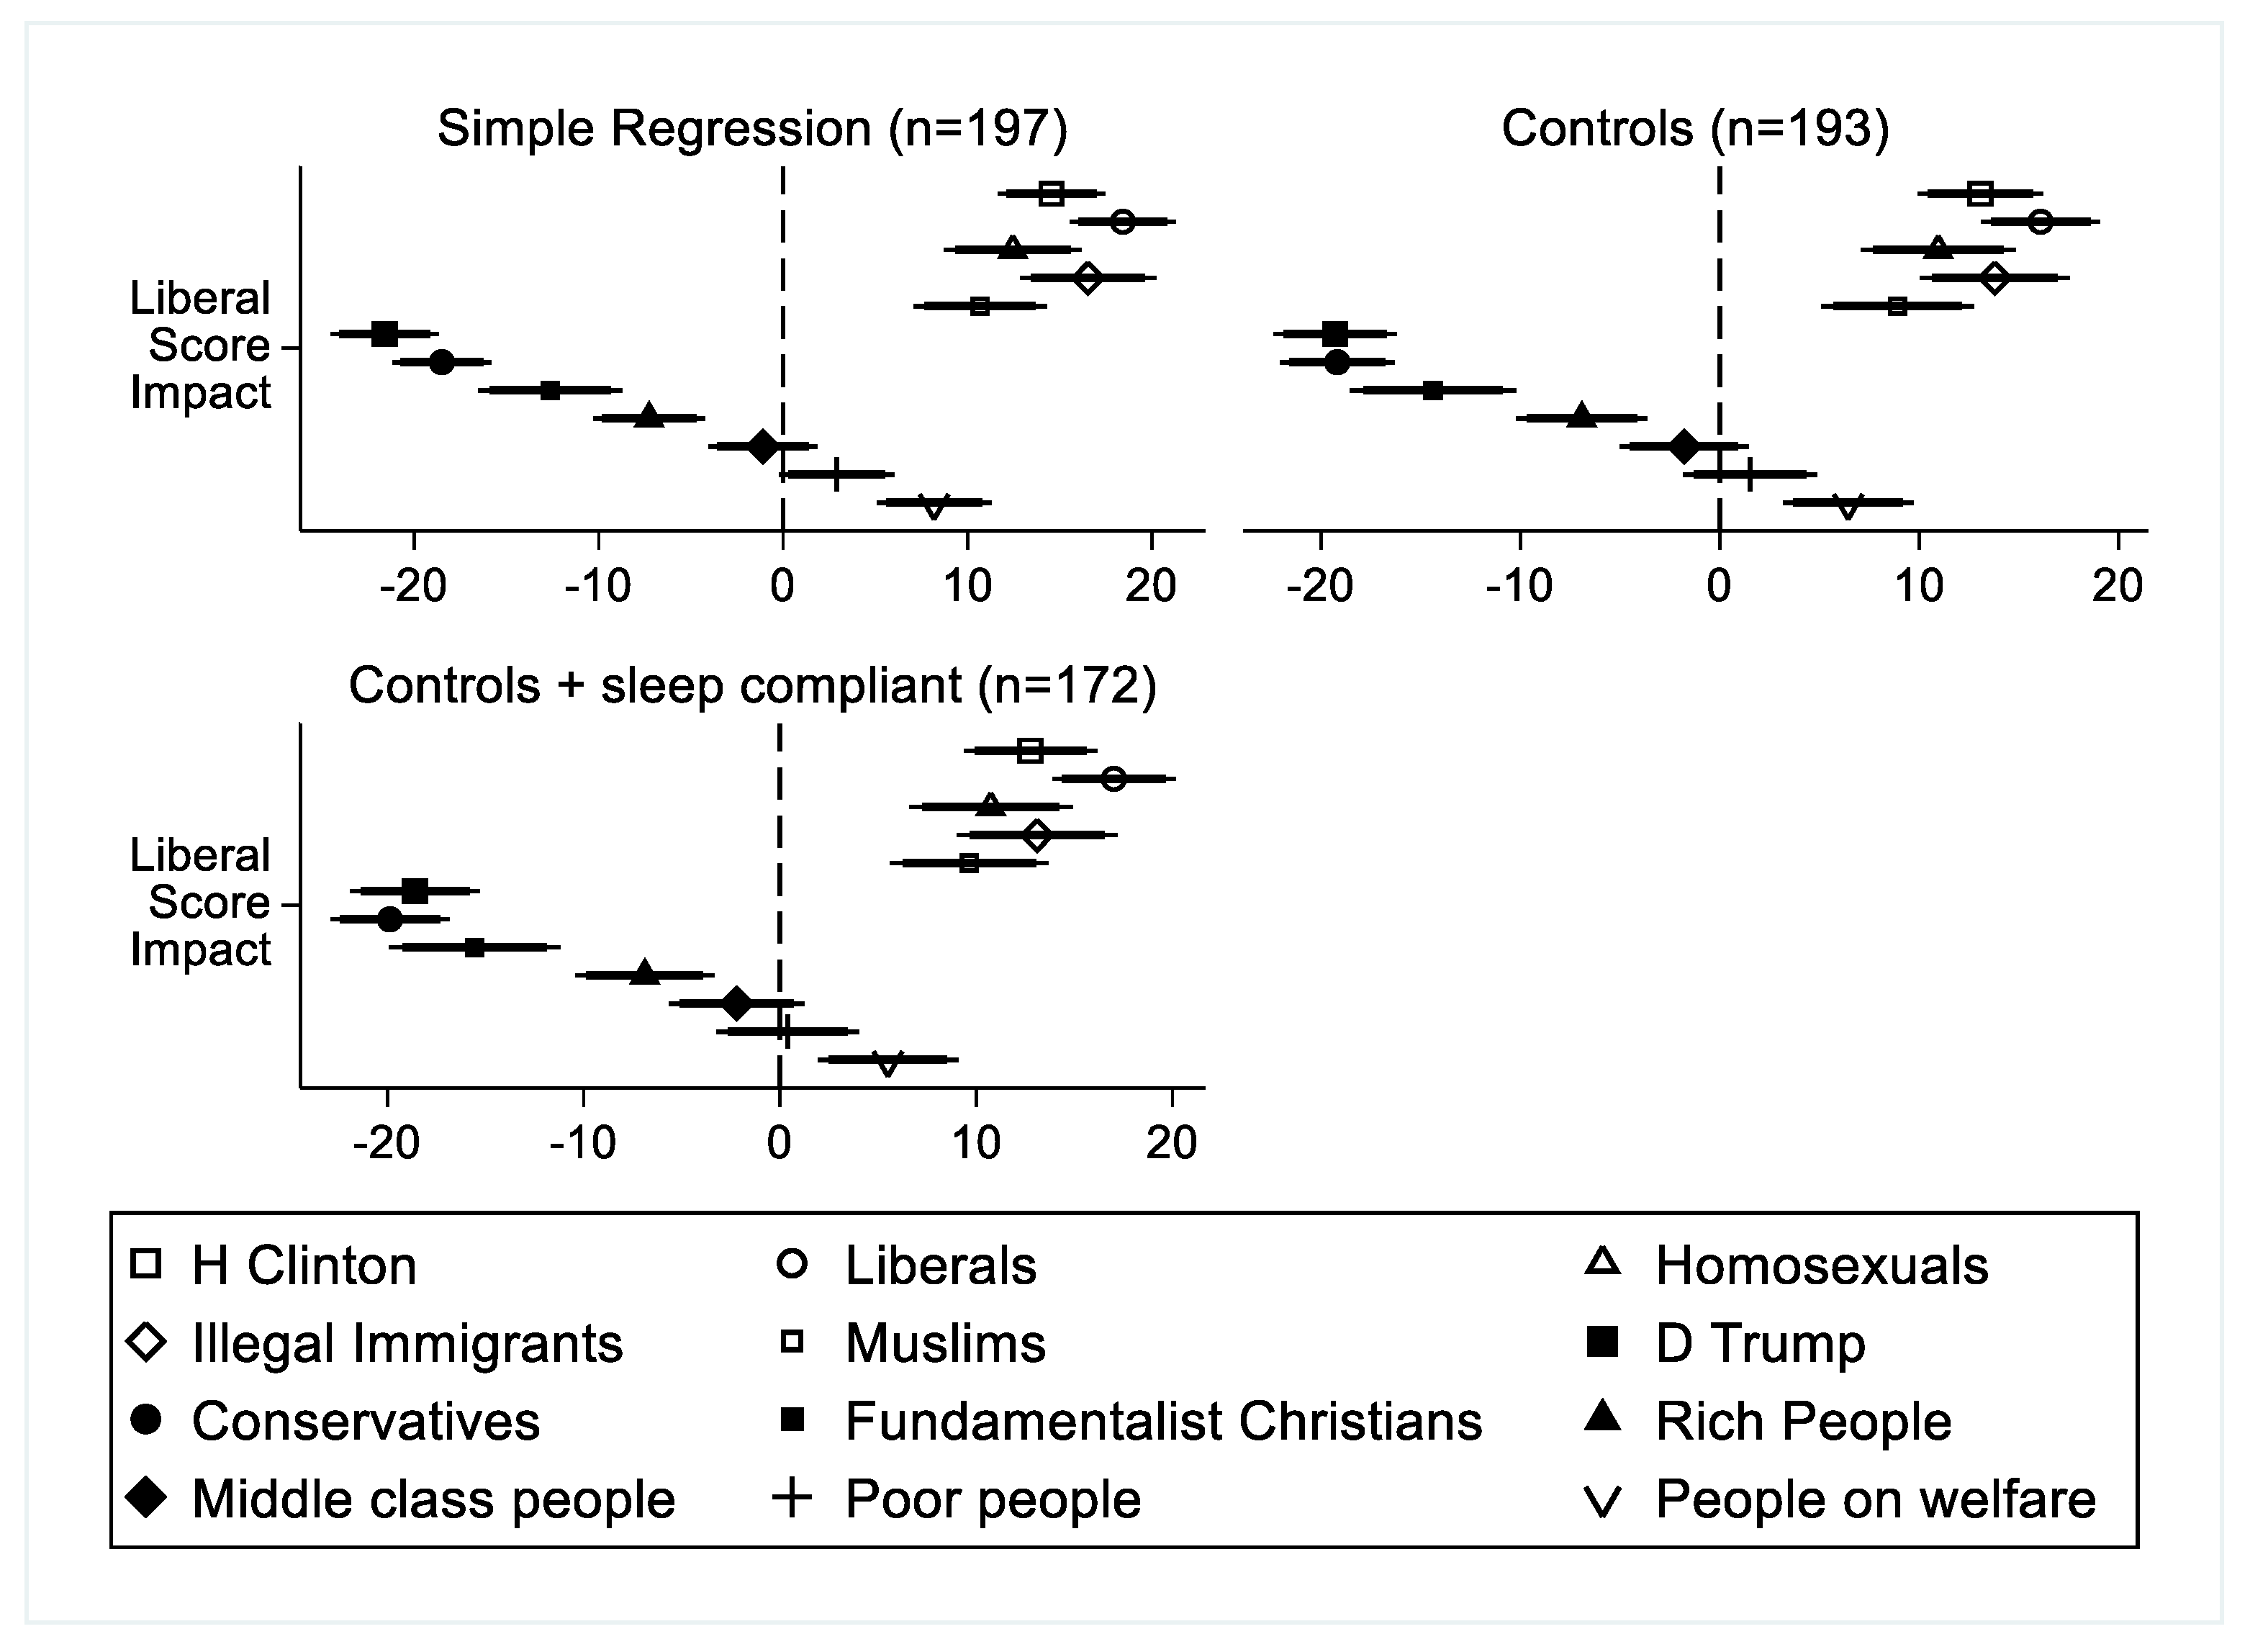
Our main focus is on testing Hypotheses 1 and 2. We also present results from our confirmation bias replication analysis by gender. As the key independent variable used to test both Hypotheses 1 and 2 is our Liberal Score measure, we will note here some additional evidence that helps further document its validity as a continuous measure of political ideology. Specifically, we examined the relationship between Liberal Score, gun rights preferences, and other partisan preferences. Partisan preferences were elicited via “thermometer ratings” (0–100 scale) of individuals and groups (see Appendix B). A thermometer rating of 100 shows “warm” feelings or high favorability regarding that individual/group, while a rating of 0 indicates the most “cold” or unfavorable rating. Preference ratings of recent high-profile U.S. Democratic presidential candidate Hillary Clinton and Republican President Donald Trump show the expected patterns: a higher Liberal Score measure predicted significantly higher favorability ratings for Hillary Clinton and liberals, in general, and it predicted lower favorability ratings for Donald Trump and conservatives, in general (see Figure A2). More liberal participants also had significantly higher favorability ratings of homosexuals, Muslims, illegal immigrants, and people on welfare. This is true whether or not the analysis includes demographic controls or sample restriction based on sleep compliance (Figure A2). Regarding the specific issue of gun control, our survey used the Taber and Lodge [6] elicitation of a gun rights “extremity of position” measure by eliciting 9-point Likert scale responses indicating one’s strength of agreement on a series of six gun rights (or gun-control) statements. We centered each response scale at 0 and reverse-scored the anti-gun rights statement responses to create a singular Pro-Gun-Rights position measure, which ranged from −24 to +24. We show in Table A2 that a higher Liberal Score predicts a lower Pro-Gun-Rights position measure across several estimation alternatives. In short, we proceed with our main analysis with confidence that our key independent variable measure of political ideology is valid.9
To test our confirmation bias replication hypothesis (Hypothesis 1), we first examined the impact of the Liberal Score measure on the number of pro-gun rights information clips viewed (0–6), # PRO-GUN-RIGHTS CLIPS, and the perceived strength of pro-gun rights arguments. We constructed the variable PRO-GUN-RIGHTS ARGUMENT STRENGTH from the Taber and Lodge [6] set of gun-control and gun-rights arguments to which participant were asked to assess the strength of each argument on a 9-point Likert scale. We centered each response, reverse scored the items whose arguments favored gun control and the result was a composite score that ranged from −24 to +24 and reflected one’s overall perception of the strength of the arguments favoring gun rights (i.e., negative values reflect on overall anti-gun-rights perception of argument strength).10 Thus, the dependent variable used to assess the information exposure dimension of the confirmation bias was # PRO-GUN-RIGHTS CLIPS, and the dependent variable used to examine the perceived argument strength dimension of the confirmation bias was PRO-GUN-RIGHTS ARGUMENT STRENGTH.
4.1. Hypothesis 1 Tests—The Confirmation Bias (Pooled and by Gender)
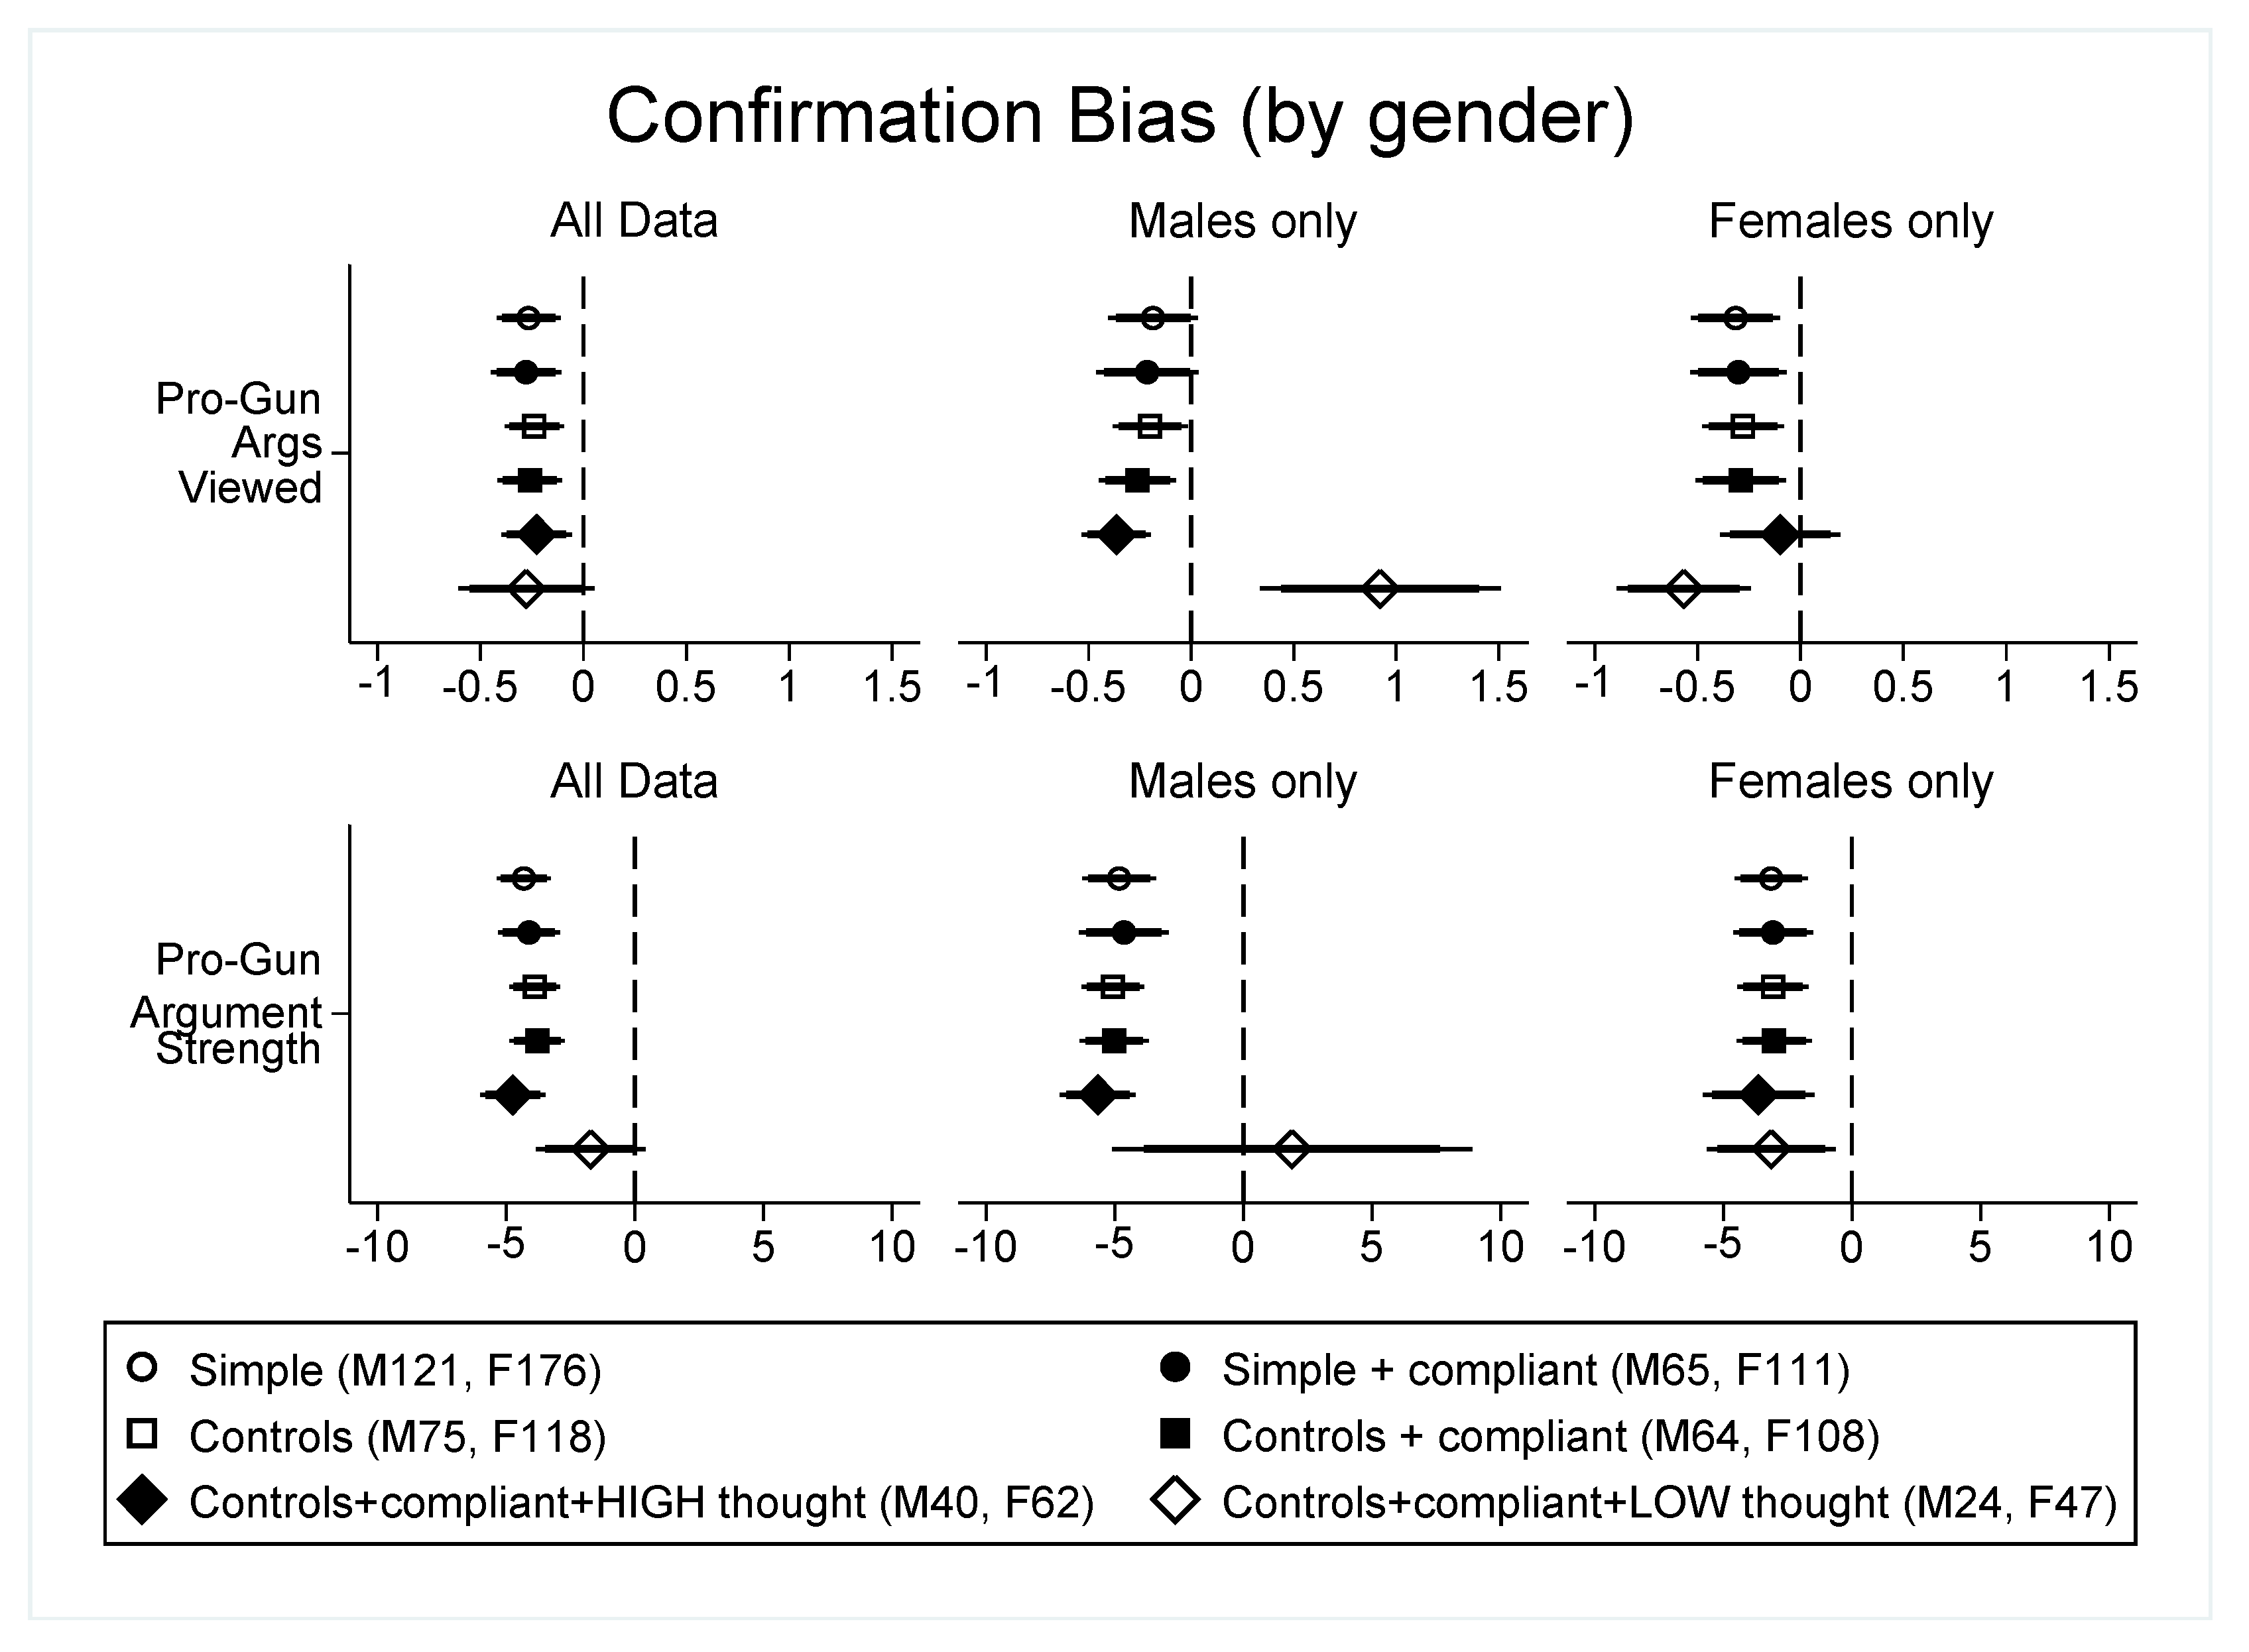
We estimated models to test both dimensions of the confirmation bias across several specifications. In all cases, we estimated weighted regressions using the inverse probability weights (IPW) correction to address potential sample selection, and the main Hypothesis 1 tests were also examined by gender. The full estimation details are given in Table 2 and Table 3 (pooled across genders) and in Table 4 and Table 5 (results separated by gender subsample). To help visualize the key findings across several specifications, Figure 1 presents the coefficient plots of the estimated impact of Liberal Score on each key outcome measure. The various specifications represent our sensitivity analysis of the key result and, given how we defined both confirmation bias outcome measures, negative estimates on the Liberal Score variable across all models in Table 2, Table 3, Table 4 and Table 5 support Hypothesis 1.11 As is succinctly shown in Figure 1, the estimates show consistent evidence in support of the confirmation bias in both the information exposure (upper panels, Figure 1) and perceived argument strength (lower panels, Figure 1) dimensions. This both replicates and extends previous findings given our results also document the confirmation bias separately in both male and female participants. Figure 1 also highlights that the estimated effect becomes less consistent when estimated on the subset of male participants indicating they had put relatively less thought into the issue of gun control.12 In fact, regarding information exposure, our estimates even suggest that male participants who thought relatively little about the gun control issue were willing to sample information clips from sources that did not align with their ideology (model 4, Table 4). As the sample size becomes quite small with those who have thought less about gun control (see number of observations listed in the figure legend), we conducted our main Hypothesis 2 tests on the subset of individuals who already expressed having thought/deliberated a lot about gun control.
A Note on Response Times
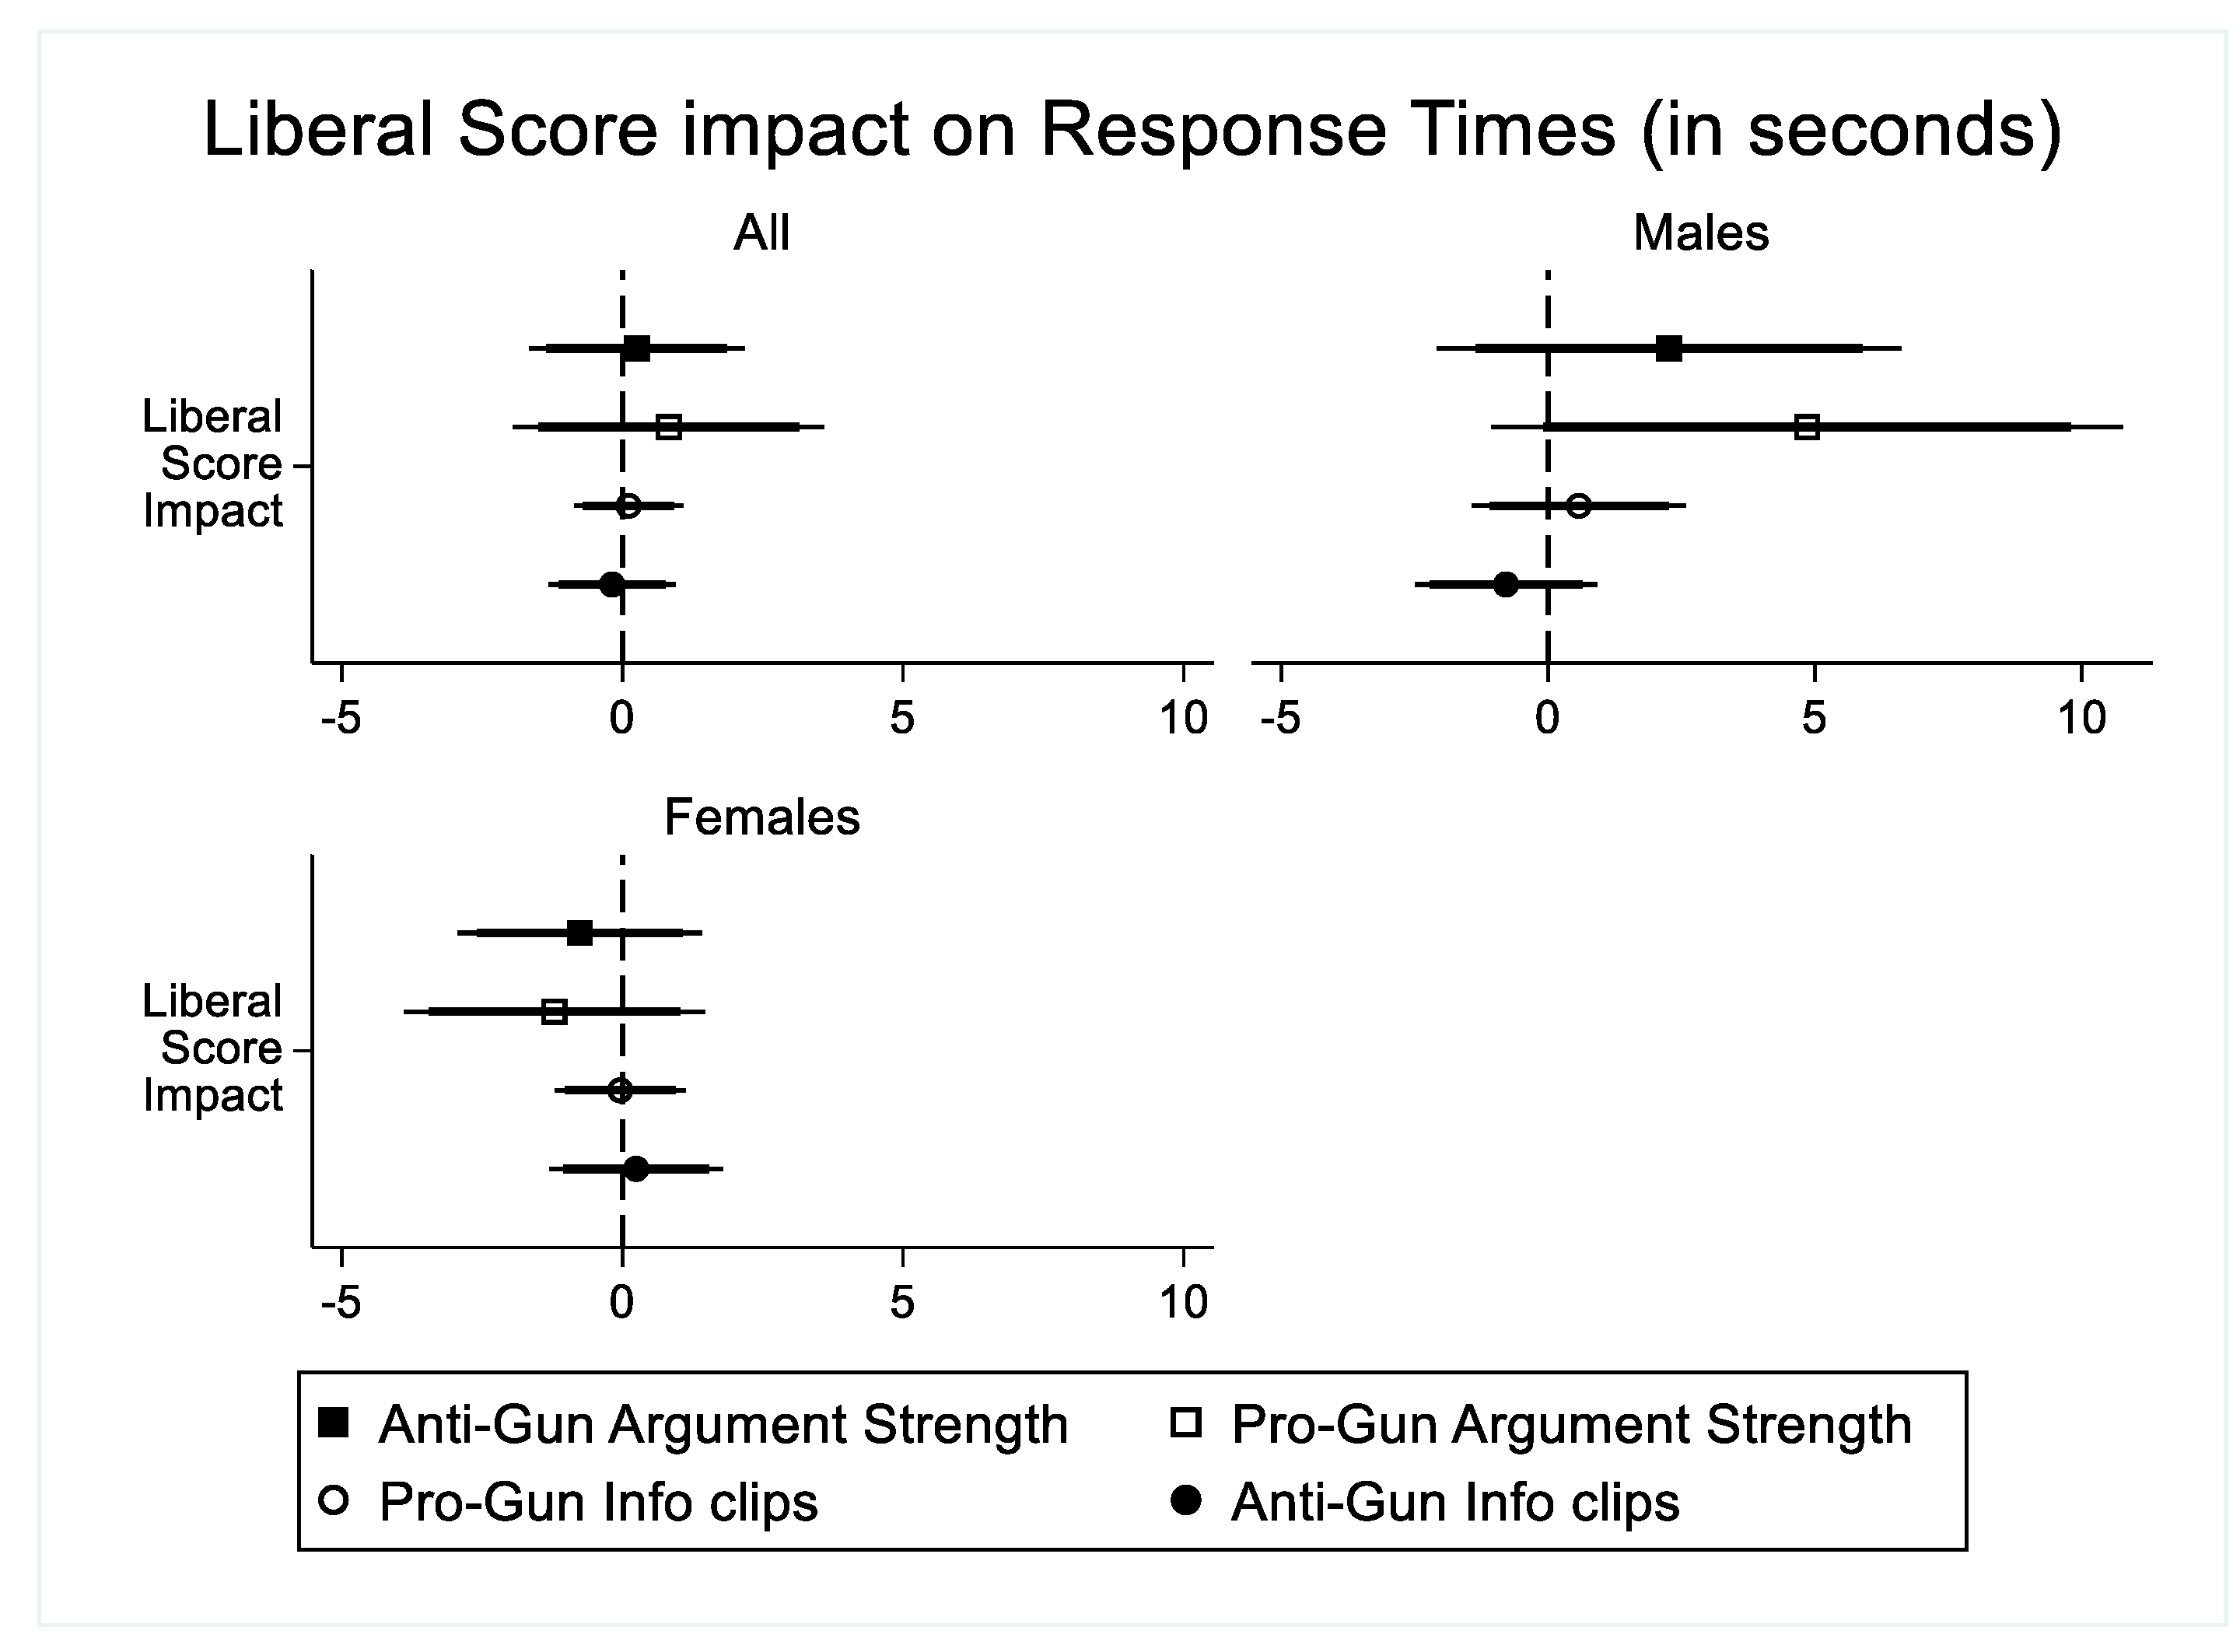
As Taber and Lodge [6] also found evidence that participants may spent additional time reading arguments contrary to their political ideology, we collected response time (RT) data within our survey. Here, we have RT data on both the time spent reading the information clips selected for the information exposure component of the confirmation bias task, as well as on the time spent assessing each argument of the perceived argument strength dimension of the task. The presentation of information clips and arguments (with argument strength assessment scale) on individual survey pages allowed for a relatively clean collection of these data.
We failed to find support for any significant impact of political ideology on the RT data along either dimension of the task. A series of regressions were estimated to assess the impact of Liberal Score on RT in both the pooled data, and also in the gender-specific subsamples. These results are shown as coefficient plots in the Figure A3, but there is no evidence of systematic RT effects of ideology in our data. The assessment of RT data in a sample of participants who varied by randomly assigned sleep state may, however, present unique challenges to the extent that RT data may be particularly noisy among sleep restricted participants (e.g., see discussion in Dickinson and McElroy [18]).
4.2. Hypothesis 2 Tests—The Impact of Deliberation
In testing Hypothesis 2, we extended the previous model specifications to include either a Liberal Score * CRT or Liberal Score * SR interaction term. The estimation results are shown in Table 6 and Table 7. We did not assess Hypothesis 2 separately by gender given the reduced power in an already small sample to identify an interaction effect compared to a main effect, although future research may find it useful to pursue potential gender differences in the confirmation bias at a deeper level.
Our findings in Table 6 show some support for Hypothesis 2 regarding selective information exposure, although we failed to support Hypothesis 2 with respect to perceived argument strength (Table 7).13 To the extent that our data showed some evidence supporting Hypothesis 2, the finding is still somewhat sensitive to our model specification. Focusing on the models with a more complete set of control variables (models 3–4 and 7–8 of Table 6) seems reasonable. Here, our findings are more robust regarding the impact of cognitive reflection (CRT score) on amplifying the confirmation bias (i.e., the negative and statistically significant coefficient estimate on the Liberal Score * CRT interaction term). As the CRT was assessed in an online survey, there may be some concern that participants searched for correct answers on the internet and thus compromised the validity of the CRT as a measure of deliberation in our study. While this was possible, the summary statistics in Table 1 highlight that, on average, participants did not even answer half of questions from the 6-item task correctly (78% got 3 or fewer correct out of 6 total items). As such, we do not have reason to question the CRT validity in our data set.
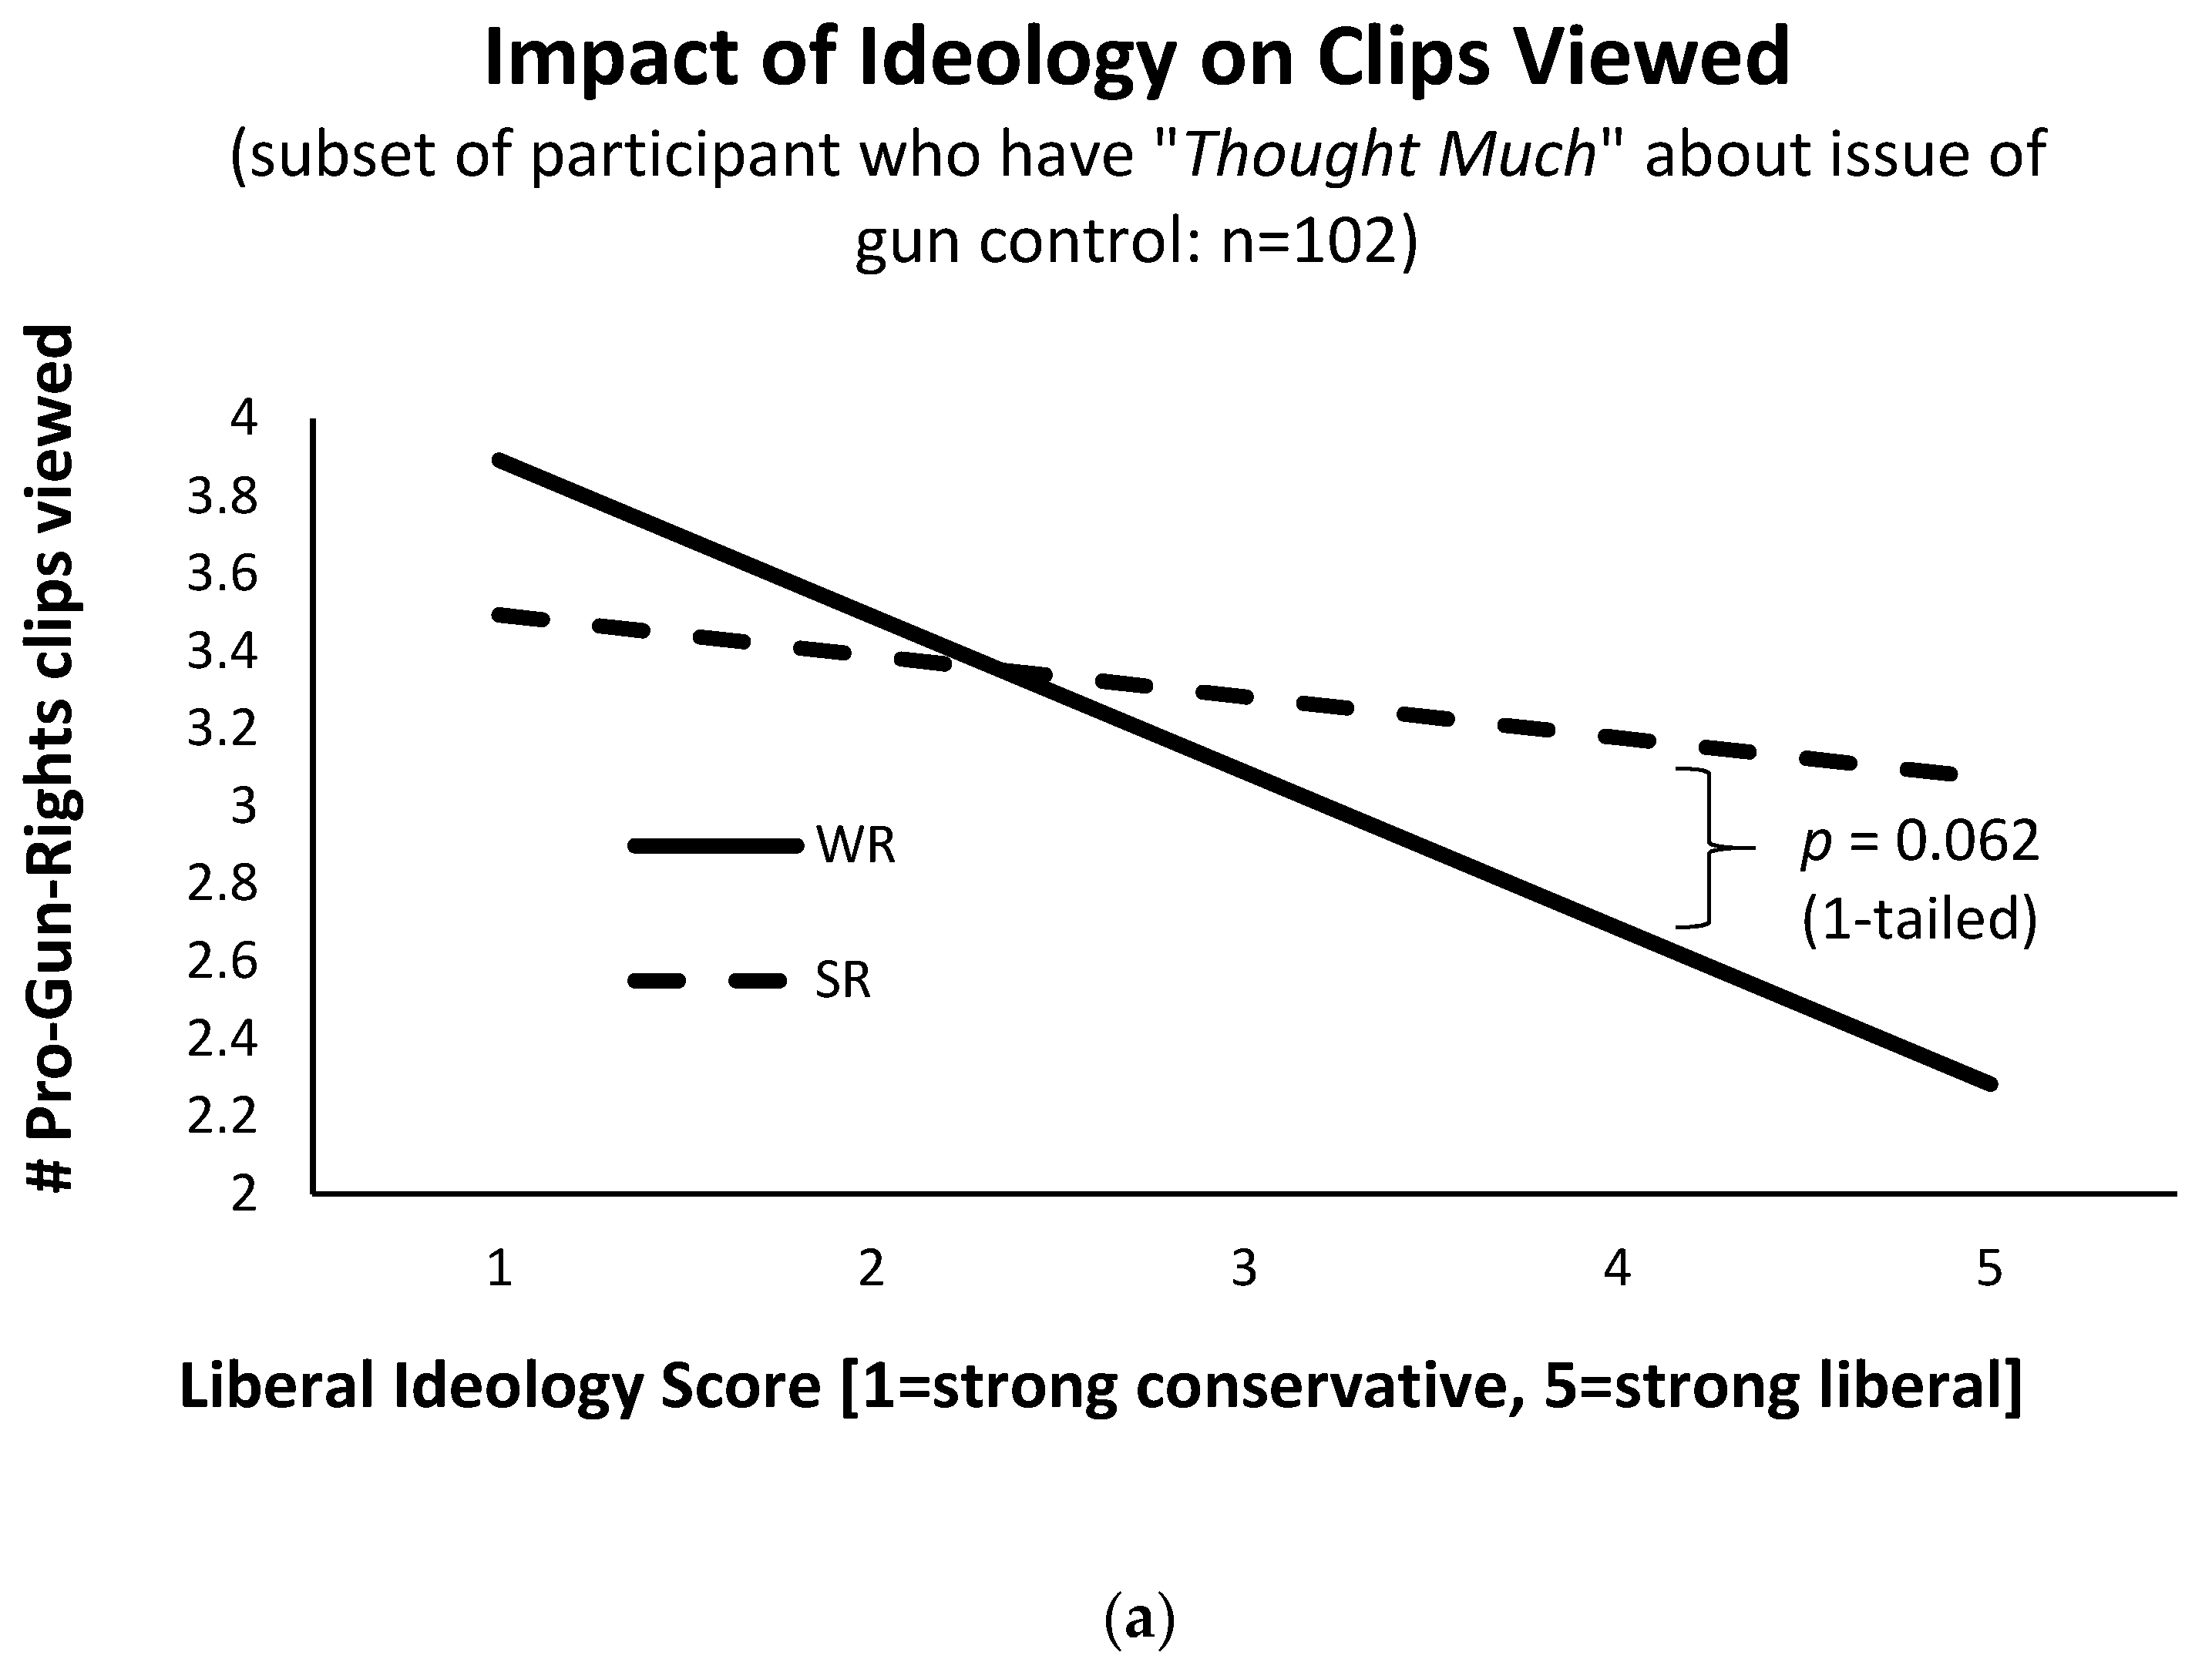
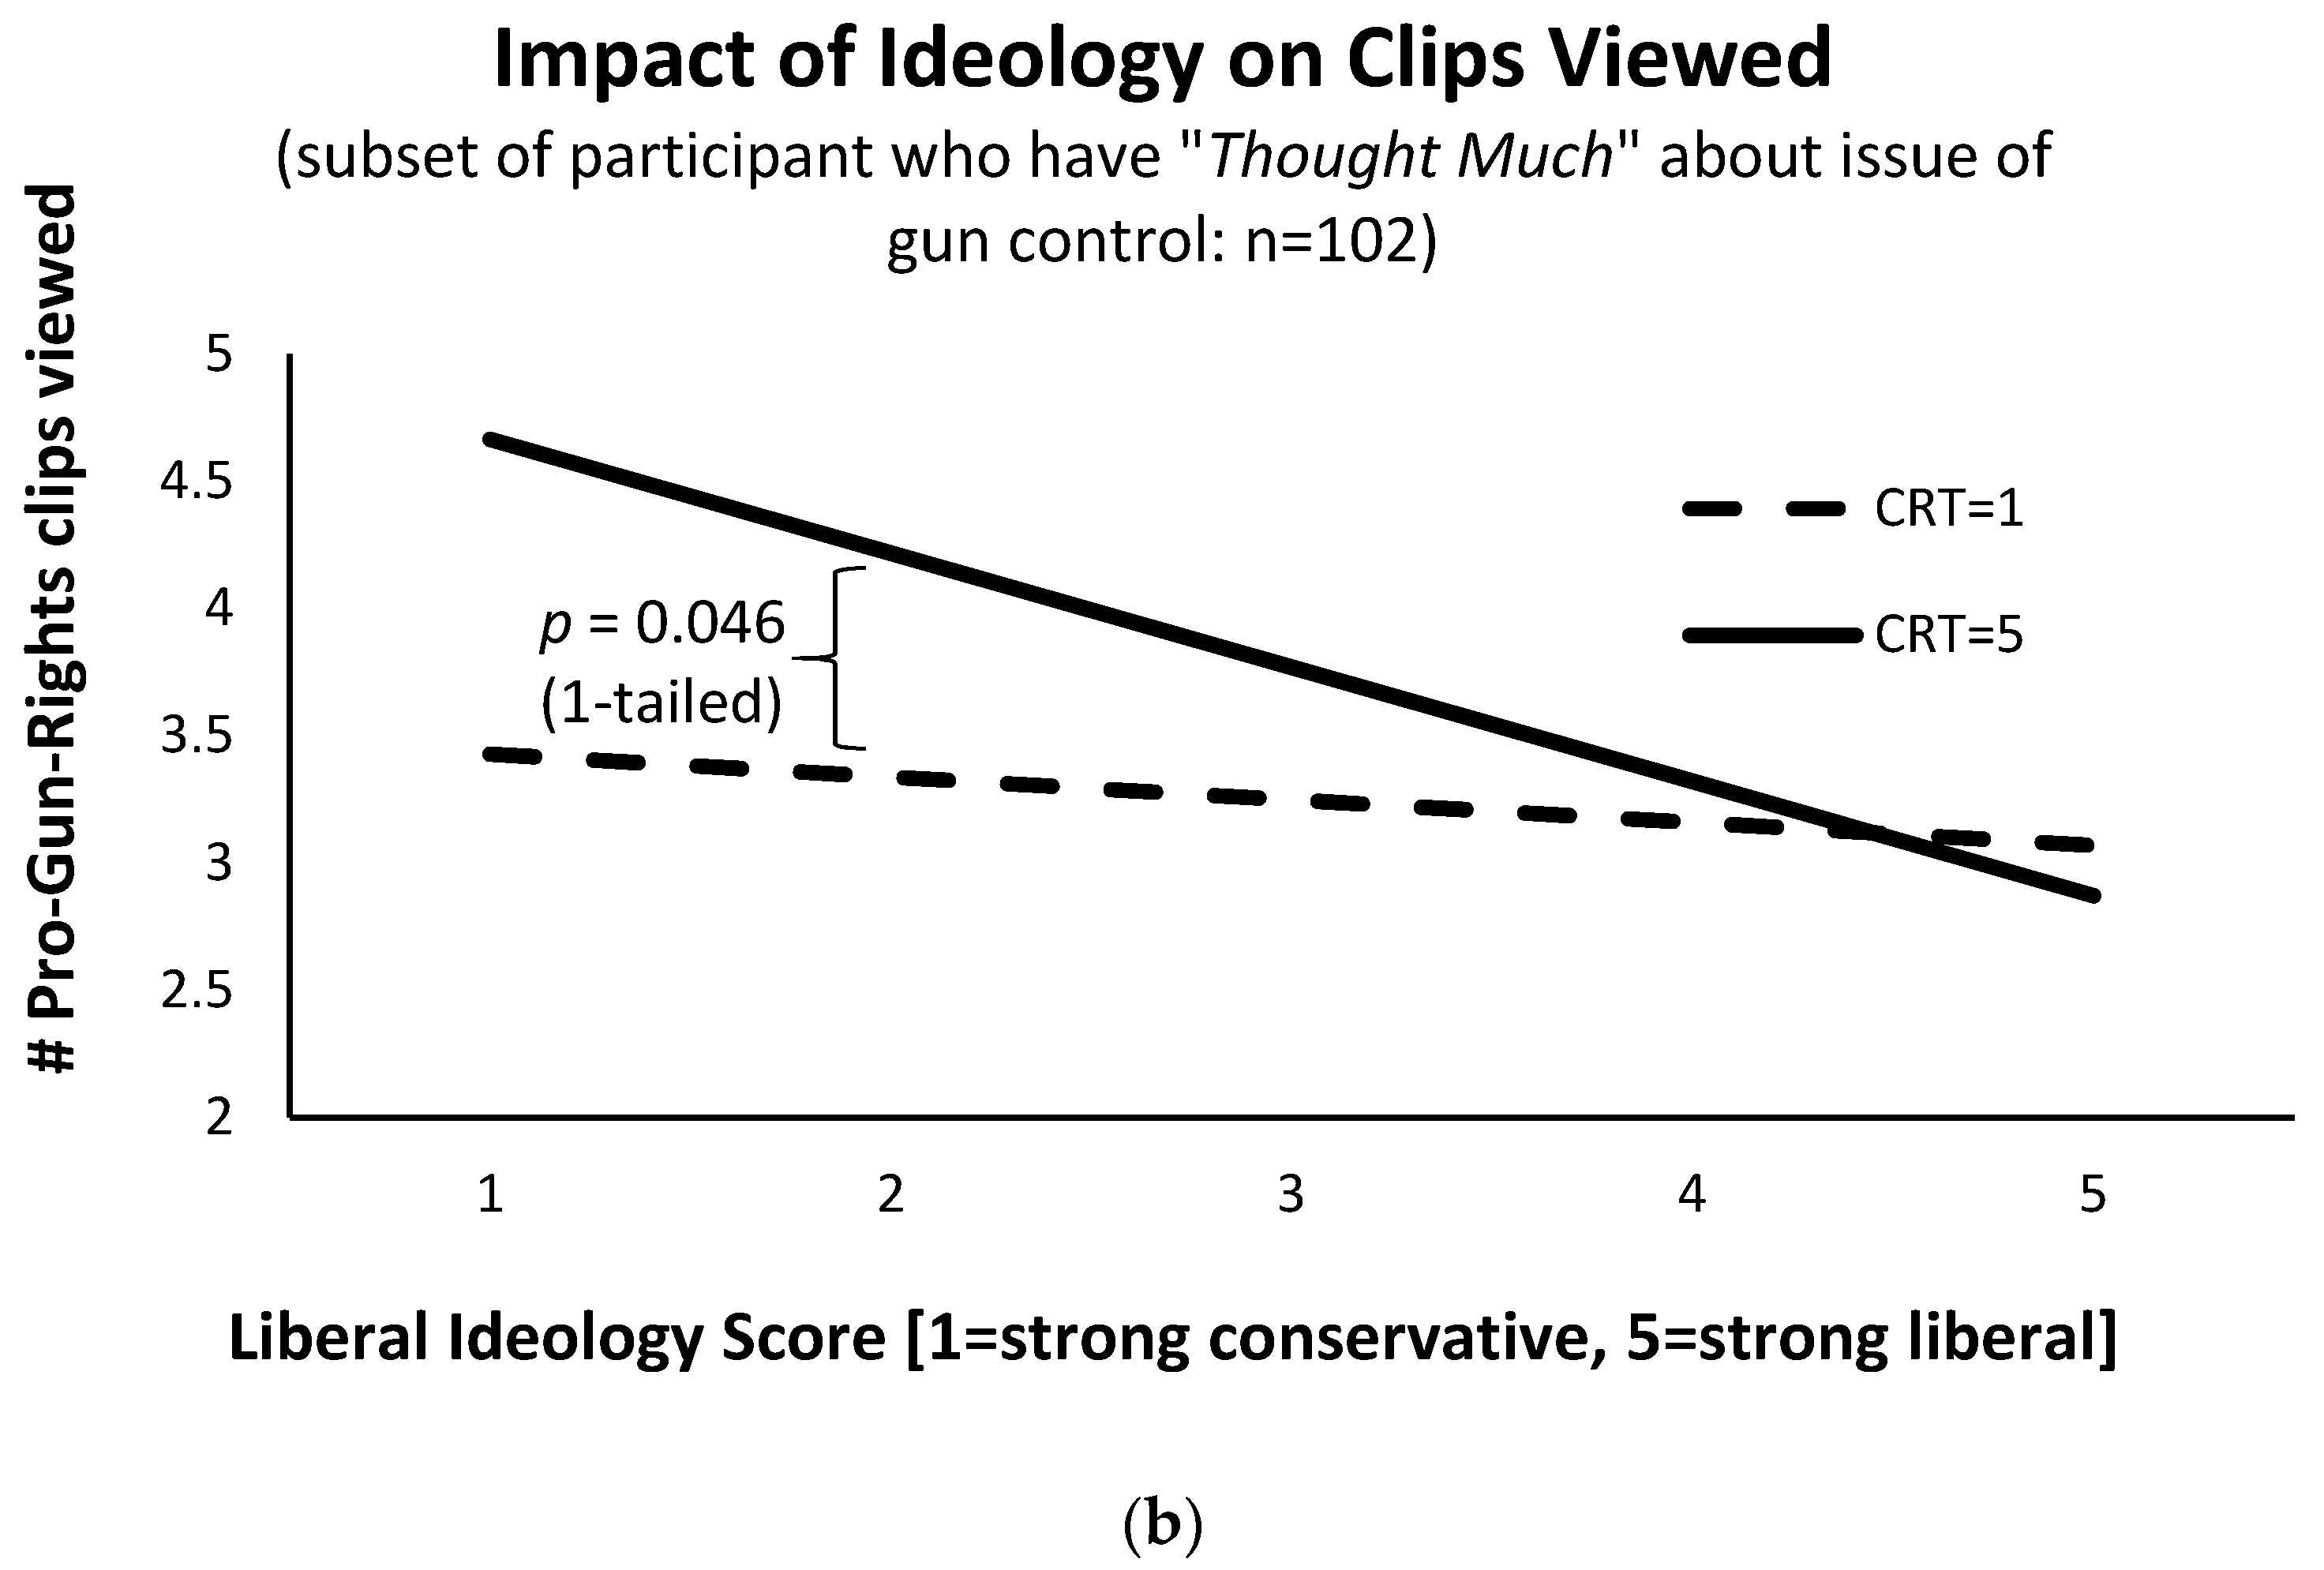
Regarding the impact of SR as a novel measure of deliberation, there is weaker evidence in model (3) of Table 6 suggesting SR may mitigate the confirmation bias to some extent (i.e., the positive and marginally significant coefficient estimate on the Liberal Score * SR interaction term). The same finding is not present in Table 6 model (4), but recall that model 4 also includes participants who did not comply well with the prescribed sleep parameters of the larger study. The key Hypothesis 2 findings from the specifications with demographic controls for the sleep-compliant sample of participants (Table 6 models (3) and (7)) are also graphically depicted in Figure 2 (see Table 6).14 Here, the top panel of Figure 2 shows the predicted confirmation bias effect increase for WR compared to SR participants (i.e., steeper slope in the forecast line for WR participants). The bottom panel of Figure 2 shows the estimated effect that those with higher CRT scores displayed a stronger confirmation bias in terms of selective information exposure.
5. Discussion and Conclusions
This study extended previous findings showing that deliberation promotes a stronger confirmation bias. Participants who had thought more about gun control were found to have a more precisely estimated confirmation bias regarding selective information exposure and also a stronger magnitude of effect regarding perceived argument strength (Figure 1). Extending previous results, we showed these main confirmation bias findings to be present in both male and female participants when conditioning on the participant having thought relatively a lot about the issue of gun control, with males showing a somewhat stronger confirmation bias along the dimension of perceived argument strength compared to females (Figure 1). As these confirmation bias findings may not hold for participants who have not thought a lot about the issue we examined (gun control), this is an indication of the importance of issue-specific deliberation on this bias. We also examined the hypothesis that more general measures of cognitive thinking style may impact this bias. Consistent with previous findings, we found that individuals higher in a validated measure of cognitive reflection showed evidence of a stronger confirmation bias. However, the CRT score effect was only identified along the information exposure dimension and not the perceived argument strength dimension. Finally, using our unique sample of sleep-manipulated participants, we reported marginal support for the hypothesis that selective information exposure is stronger for those well-rested compared to sleep restricted.
Of course, this study is not without limitations. Our college student sample was young (mean Age 19.82 ± 2.90), somewhat liberal (mean Liberal Score value 3.27 ± 0.97), and perhaps more naïve to the political process. For example, 21% indicated they were not yet registered to vote, and many likely had not yet voted. The trade-off in this study was our access to a unique sample of individuals randomly assigned to 5–7 consecutive night sleep level, and the SR condition is similar to the sleep level commonly experienced by nearly 1/3 of U.S. adults [30]. Though sleep restriction or deprivation is well-known to impact attention and deliberation, we do not find evidence that the Hypothesis 2 result regarding SR participants is due simply to increased random choice.15 Additionally, our results regarding the SR impact on the confirmation bias were somewhat sensitive the sample restriction and specification estimated. As such, it is clear that additional research is warranted to further examine how sleepiness may impact the confirmation bias, to explore the dose-response of this or other decision biases to a wider range of poor sleep measures, and to identify key effects in a more representative sample of participants.
Our goal was to stimulate interest in new directions and test novel predictions of the confirmation bias phenomenon, because the existing evidence suggests it is unlike other biases that are presumed to result from the lack of attention of deliberation. If the confirmation bias is a product of deliberative efforts to avoid regret and reduce cognitive dissonance, then this is a rare decision bias that may be less prevalent when deliberation is reduced or bounds to rationality introduced. Results reported here suggest this is likely the case, which may help further our understanding of the important confluence of the confirmation bias, political polarization, and how deliberation may likely be a contributing factor. Clearly, there is both a need and space for additional research in this area.
Funding
This research was supported by the National Science Foundation under grant SES-1734137 and the APC was funded by this same grant.
Acknowledgments
The author also thanks John Holbein for helpful feedback in the initial survey design.
Conflicts of Interest
The author declares no conflict of interest.
Appendix A
Figure A1.
Balance Tests. Notes: Observations = 197. Point estimates represent coefficient estimates, β, on simple regression of variable listed on indicator variable for treatment assignment (SR = 0 or 1): Characteristic = α + β(SR) + ε. Thin (thick) lines around point estimates represent the 95% (90%) confidence intervals. Measures assessed in these tests were derived from the recruitment database information.

Figure A2.
Impact of Liberal Score ∈ (1, 5) on Thermometer ratings. Notes: Model with controls includes controls for age, gender, minority status, Epworth (daytime) sleepiness score, morningness-eveningness preference (rMEQ), SR assignment, prosociality, backwards induction skill, and cognitive reflection score. One or more control measures not captured on 4 individuals (reducing sample by 4 observations when including controls). Model conditioned on sleep compliance does not include WR participants with < 405 min nightly sleep (actigraphy measured) or SR participants with > 375 min nightly sleep. This model also excludes participants who failed the attention check (poison pill) question within the survey. Thin (thick) lines around point estimates represent the 95% (90%) confidence intervals. Full estimation results available on request.

Figure A3.
Impact of Liberal Score ∈ (1, 5) on Response Times (RT). (RT averaged across all Pro-Gun or Anti-Gun info clips views or arguments assessed). Notes: Models included full set of control variables (age, gender, minority status, Epworth (daytime) sleepiness score, morningness-eveningness preference (rMEQ), SR assignment, prosociality, backwards induction skill, and cognitive reflection score), as well as the inverse probability weight correction for sample selection (based on the selection model estimates in Appendix A Table A1). Thin (thick) lines around point estimates represent the 95% (90%) confidence intervals. Full estimation results available on request.

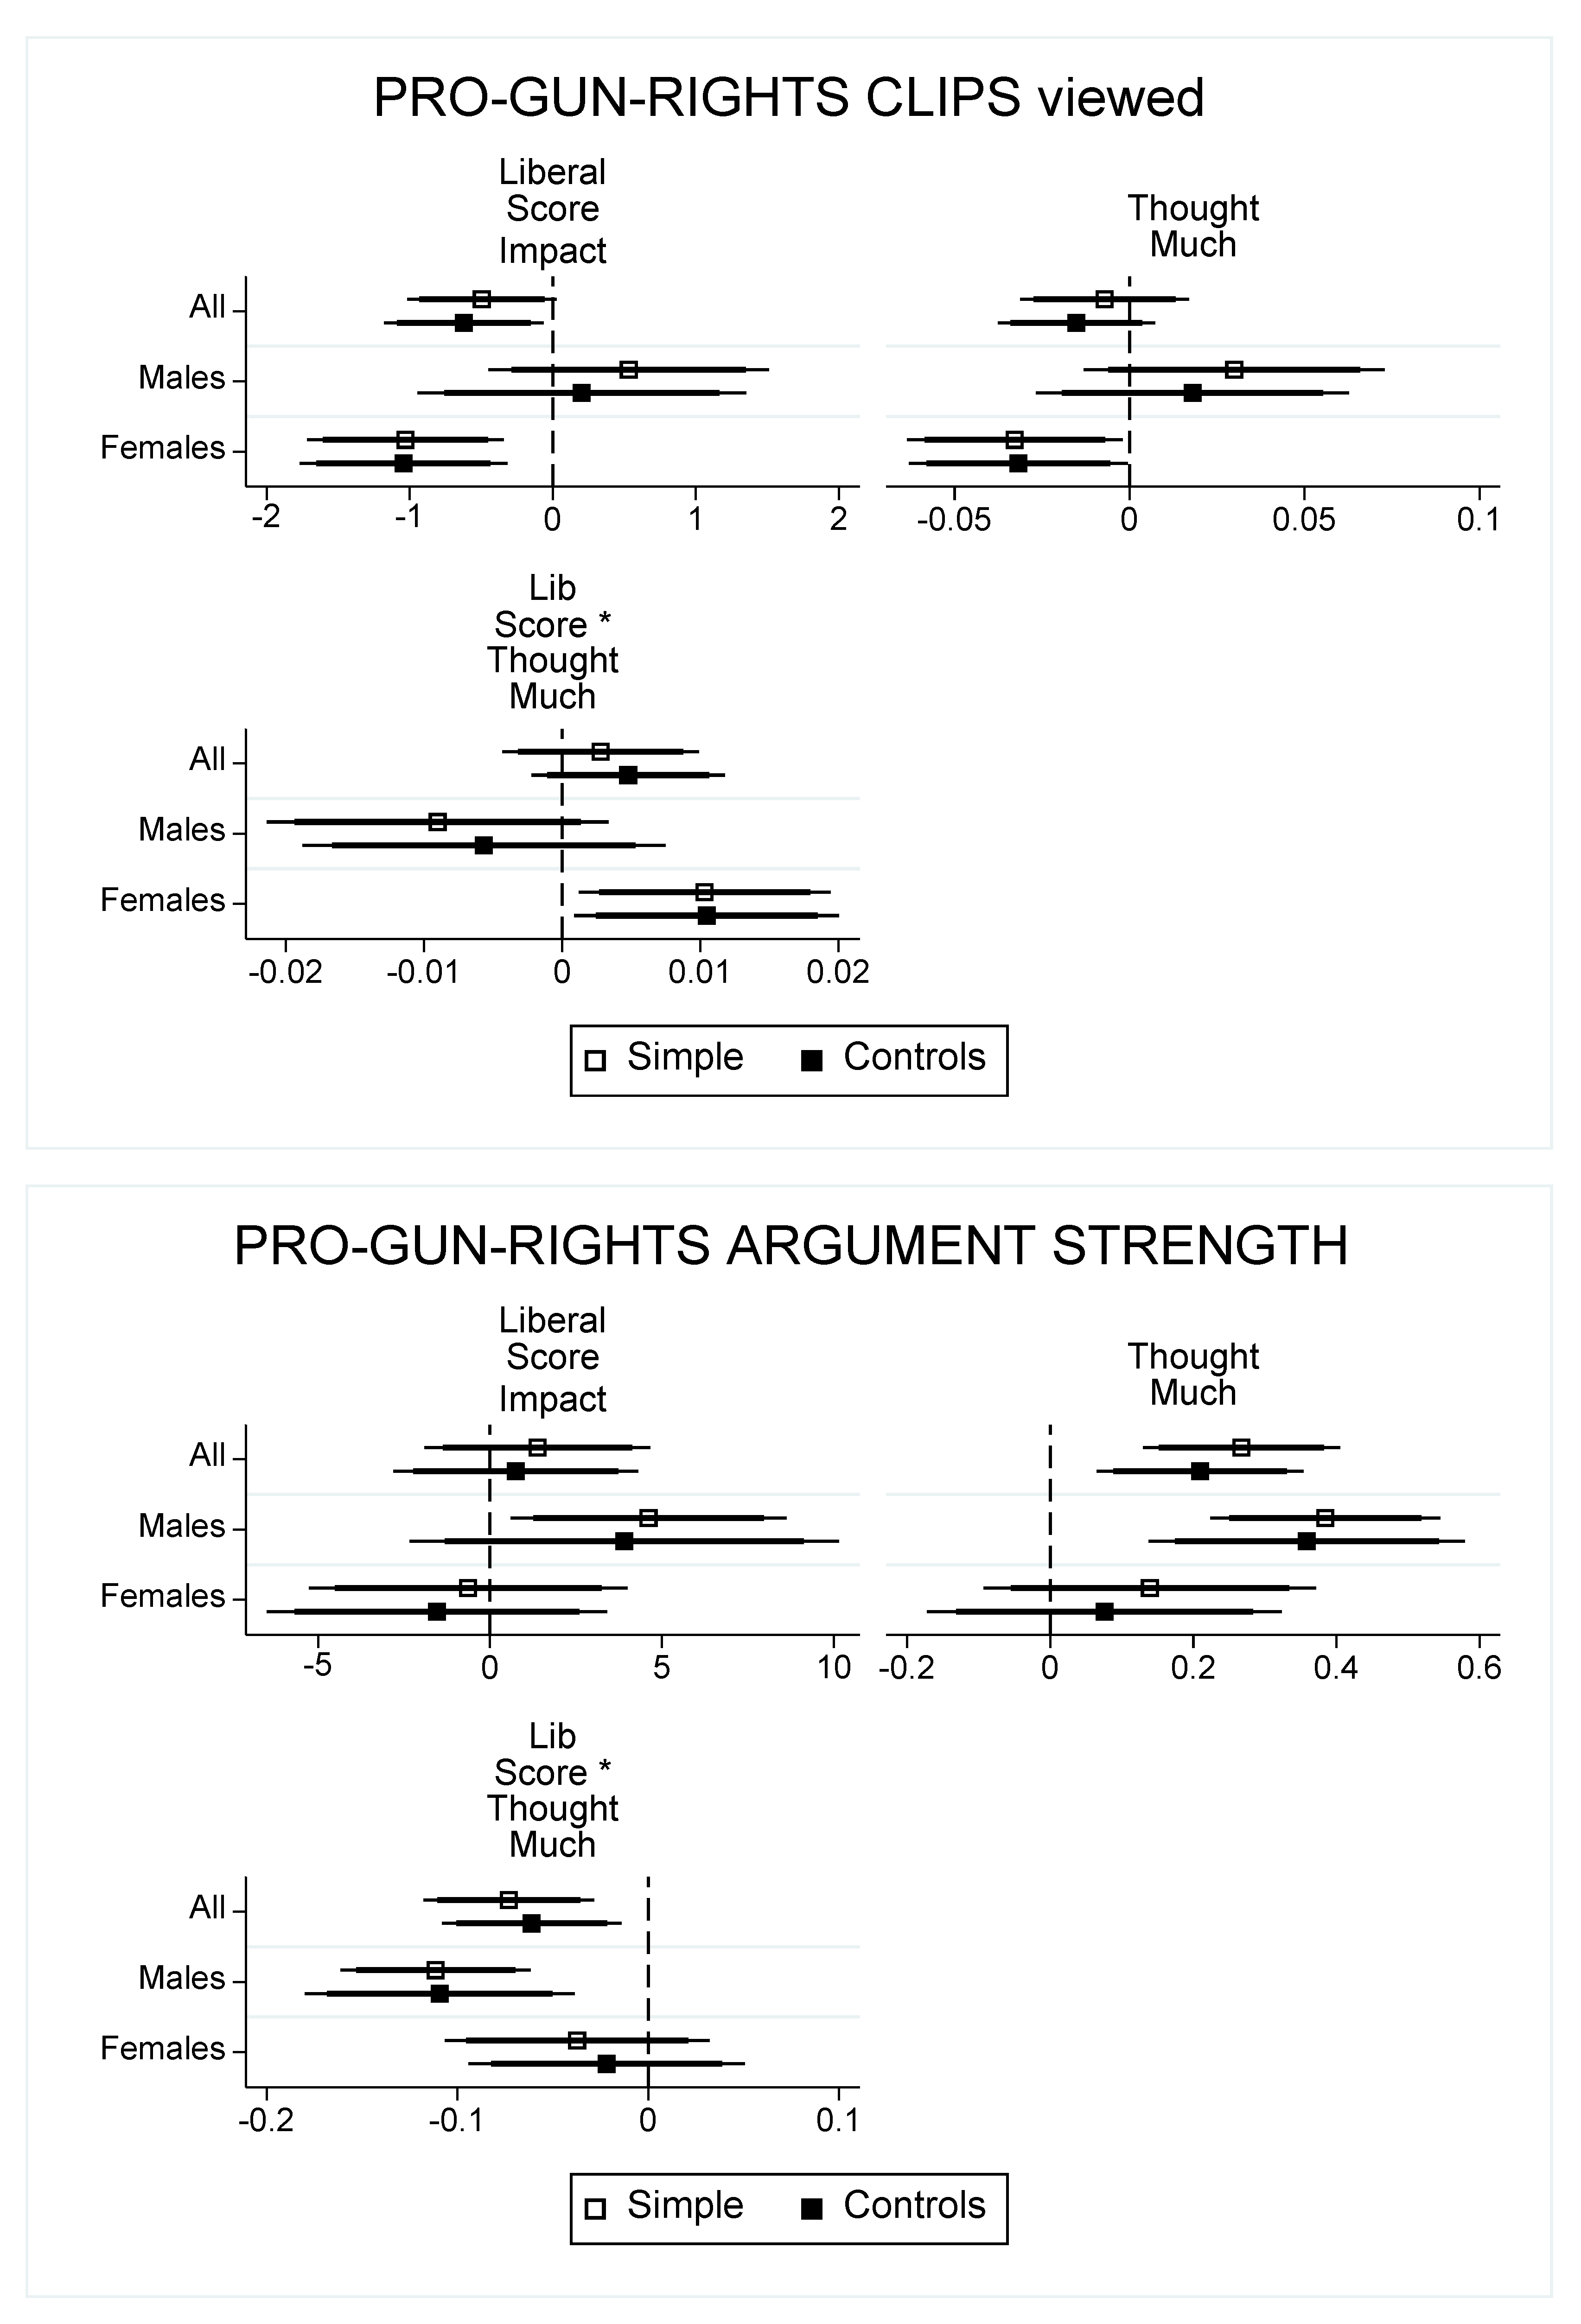
Figure A4.
Examining Thought Much direction as a regressor (with Liberal Score interaction). Notes: Simple models restricted analysis to SR compliant participants and accounted for sample selection using the IPW correction. These simple models included only the regressors whose coefficient estimates are shown above. “Controls” models additionally included full set of control variables (age, gender (for the “All” sample), minority status, Epworth (daytime) sleepiness score, morningness-eveningness preference (rMEQ), SR assignment, prosociality, backwards induction skill, and cognitive reflection score.) Thin (thick) lines around point estimates represent the 95% (90%) confidence intervals. Full estimation results available on request.


Table A1.
Selection Equation Probit model.
| Probit Estimation Variable | Dep Var = Participated in Online Experiment (=1) (Conditional on Recruited into Sleep Study) Coefficient (SE) |
|---|---|
| SR (=1) | −0.260 (0.162) |
| Female (=1) | 0.156 (0.172) |
| Minority (=1) | 0.190 (0.209) |
| Age | −0.035 (0.027) |
| Optimal Sleep | −0.033 (0.082) |
| Anxiety Risk | −0.019 (0.033) |
| Depression Risk | 0.060 (0.111) |
| Epworth | 0.045 (0.024) * |
| rMEQ | 0.023 (0.027) |
| Observations | 280 |
| Log Likelihood | −164.561 |
| Psuedo R-squared | 0.033 |
Notes: Full recruited sample of n = 280 participants, with n = 197 participating in the confirmation bias task (attrition due to study drop-out as well as those who completed the sleep study but chose not to participant in the optional online survey). * p <0.10 for the 2-tailed test. Model estimates used to determine individual probabilities of sample inclusion. The inverse of these probabilities are then used as the weights (inverse probability weights, or IPW) to account selection correction in the confirmation bias analysis.
Table A2.
Impact of Liberal Score on Pro-Gun-Rights position.
| Variable | Simple (1) Coef (SE) | Controls (2) Coef (SE) | Controls + Sleep Compliant (3) Coef (SE) | Controls + Sleep Compliant + IPW Correction (4) Coef (SE) |
|---|---|---|---|---|
| Constant | 19.449 (2.543) *** | 13.695 (7.623) * | 12.064 (8.203) | 12.904 (8.649) |
| Liberal Score | −8.054 (0.745) *** | −6.938 (0.765) *** | −6.762 (0.848) *** | −6.948 (0.838) *** |
| Age | --- | 0.316 (.277() | 0.382 (0.291) | 0.316 (0.282) |
| Female | --- | −5.704 (1.536) *** | −5.034 (1.665) *** | −4.806 (1.722) *** |
| Minority | --- | −3.191 (1.724) * | −3.804 (1.841) ** | −3.828 (1.625) ** |
| Epworth | --- | 0.074 (0.204) | 0.003 (0.217) | −0.006 (0.201) |
| rMEQ | --- | 0.092 (0.232) | 0.090 (0.255) | −0.007 (0.299) |
| SR | --- | −0.643 (1.397) | −0.858 (1.515) | −0.803 (1.598) |
| Pro-Social | --- | −2.329 (1.649 | −2.030 (1.748) | −2.214 (2.022) |
| Race Wins | --- | 0.272 (0.321) | 0.289 (0.353) | 0.373 (0.326) |
| CRT score | --- | −0.389 (0.431) | −0.423 (0.465) | −0.385 (0.448) |
| Obs | 197 | 193 | 172 | 172 |
| R-squared | 0.375 | 0.458 | 0.422 | 0.434 |
Notes: * p < 0.10, ** p < 0.05, *** p < 0.01 for the 2-tailed test. Asterisks on Liberal Score coefficient estimates are 1-tailed tests given ex ante hypothesis that more liberal ideology would have less pro-gun-rights views. --- indicates covariates omitted for that specification. The inverse probability weight (IPW) correction in model (4) uses probability estimates from the selection equation (see Appendix A Table A1) to weight observations based on the inverse of their likelihood of being in our sample (conditional on the participant having been recruited into the sleep study).
Appendix B
(note: survey was offered as an online experiment to participants in a “sleep and decision making” study who had already gone through at least 5 of the 7 treatment nights assigned (WR or SR). Compensation for this survey was separate from compensation in the main sleep and decision study.)
Demographics measured: Parental income, mother’s education level (other demographics not elicited but were known given participation in the main sleep and decision study).
Liberal Scale measure (continuous measure used for regression-based hypotheses tests).
Question: In terms of politics, do you consider yourself conservative, liberal, or middle-of-the-road?
(response options: 1 = Very conservative, 2 = Conservative, 3 = Middle-of-the-road, 4 = Liberal, 5 = Very Liberal)
HIGH THOUGHT Measure
Question: People have told us they have thought a lot about some issues and haven’t thought at all about some other issues. How would you rate the amount of thinking you have done about the issue of gun control?
(slider bar [0, 100] scale with 0 = “Less thinking on this issue” and 100 = “more thinking on this issue”)
Thermometer Ratings:
Question: We’d like to get your feelings toward some of our political leaders and other people/groups who are in the news these days. I’ll read the name of a person or group and I’d like you to rate that person using something we call the feeling thermometer. Ratings between 50 degrees and 100 degrees mean that you feel favorable and warm toward the person. Ratings between 0 degrees and 50 degrees mean that you don’t feel favorable toward the person and that you don’t care too much for that person. You would rate the person at the 50 degree mark if you don’t feel particularly warm or cold toward the person.
Listing of individuals/groups: Donald Trump, Hilary Clinton, Conservatives, Liberals, Gay men and lesbians (i.e., homosexuals), Illegal Immigrants, Muslims, Christian Fundamentalists, Rich People, Middle Class People, Poor People, People on Welfare.
(slider bar [0, 100] scale for each with 0 = “Not favorable/cold feelings (I don’t care much for this person or these people)” and 100 = “Favorable/warm feelings towards this person or these people”)
Politics—Attitudes and Extremity of Position (measured pre- and post main tasks).
Politics—Attitudes
Question: How much do you personally care about the issue of gun control?
Question: Compared to how you feel about other public issues, how strong are your feelings regarding the issue of gun control?
Question: Some people report that they are very certain of their feelings on the issue of gun control. Others say they are not certain at all. How certain are you of your feelings on the issue of gun control?
Question: People have told us they have thought a lot about some issues and haven’t thought at all about some other issues. How would you rate the amount of thinking you have done about the issue of gun control?
(for each, response is by slider bar [0, 100] scale with 0 representing the lowest values and 100 representing the highest value on the scale for that response metric)
Politics—Extremity of Position (responses to 6 statements combined using positive and reverse scoring to create a singular metric ∈ [−24, +24] with positive scores indicating a pro-gun-rights bias in one’s position). This measure is assessed before and after main tasks, with pre-measure used as one’s pro-Gun-Rights score in the Appendix A Table A2 analysis where it is referred to as Pro-Gun-Rights position)
Statement: Curbing gun violence is very important, but limiting the right to bear arms is not really an effective way to do this.
Statement: Everyone’s rights and freedoms are important, but sometimes, as with gun control, it is necessary to limit freedom for the greater public good.
Statement: Guns, like cars, should only be used by responsible citizens. Gun control laws just insure that responsible people are using guns in a responsible manner.
Statement: Over the past few years our right to bear arms has been eroding. This encroachment on our rights must be stopped.
Statement There should be no limits on the number of guns someone can own.
Statement: It is not the government’s job to pick and choose the types of weapons it finds acceptable for citizens to own.
(for each individual item, response ∈ [−4, +4] indicates strength of agreement or disagreement with the statement)
***********************************************************************************
MAIN TASKS
Information Board—POLITICS
(Respondent selects the source of each of the six arguments, which were used to create the # PRO-GUN-RIGHTS CLIPS variable. Sources used for information board arguments were: Republican Party, National Rifle Association, Democratic Party, the Brady Campaign to Prevent Gun Violence)
On the first task page, participants were asked:
From which source would you like to read the 1st argument on the issue of gun control?
- ○
- Republican Party
- ○
- National Rifle Association
- ○
- Democratic Party
- ○
- the Brady Campaign to Prevent Gun Violence
Following the participant’s selection, the corresponding clip (1–6) from the argument library below was then shown on a new page. Then the participant was shown a new page where asked “From which source would you like to read the 2nd argument on the issue of gun control?”, which was followed by the same set of options. This process repeated until choices were made for each of the 6 self-chosen arguments (clips) in this task. For example, if “Democratic Party” was chosen as the source for the 4th argument, then the 4th of the 6 arguments in the Democratic Party arguments library (below) was shown to the participant.
Republican Party Arguments Library:
Lawful gun ownership enables Americans to exercise their God-given right of self-defense for the safety of their homes, their loved ones, and their communities.
A smaller government with less regulation is the most efficient means to run a country. The same holds true with gun rights: more interference by the government will lead to more gun deaths, not less.
Gun ownership is responsible citizenship, enabling Americans to defend their homes and communities.
Frivolous lawsuits against gun manufacturers are harmful to the safety of the American people.
It’s wrong to impose federal licensing or registration of law-abiding gun owners.
Increasing access to hunting clinics and safety programs for children and adults will improve gun safety.
Democratic Party Arguments Library:
In order to make our communities safer, we should expand and strengthen background checks and close dangerous loopholes in our current gun laws.
It is immoral and wrong to provide gun makers and sellers with legal immunity protections.
In order to make our communities safer, we should ban assault weapons and large capacity ammunition magazines. We must get these off our streets.
In order to reduce gun violence, we should focus on effective enforcement of existing laws, especially strengthening our background check system.
In order to reduce gun violence, we can work together to enact commonsense improvements—like reinstating the assault weapons ban and closing the gun show loophole—so that guns do not fall into the hands of those irresponsible, law-breaking few.
The right to own firearms is subject to reasonable regulation, but what works in Chicago may not work in Cheyenne.
National Rifle Association Arguments Library:
We (the NRA) oppose legislation to ban gun accessories, like bump stocks. Bills that propose doing so are intentionally violating our Constitutional right to bear arms.
Background check systems are ineffective because they don’t stop criminals from getting firearms. After all, people who commit firearm crimes usually get their firearms through theft, the black market, or family members or friends.
Assault weapons bans are completely ineffective. They violate our Constitutional right to defend ourselves, our families and our communities.
The NRA opposes expansion of the background check system, because criminals easily get guns by other means and because expanding the background check requirement would be a step toward transforming the background check system into a national gun registry.
Self-defense is a fundamental right, and the right to use firearms for self-defense is recognized by the Constitution of the United States.
The NRA does not want terrorists or dangerous people to have firearms. The NRA’s only objective is to ensure that Americans who are wrongly on the terrorist watch list are afforded their constitutional right to due process.
The Brady Campaign to Prevent Gun Violence arguments library:
Many children and teens live in homes with firearms, including ones that are loaded and unlocked. This endangers the most vulnerable members of our communities.
Congress should renew the assault weapons ban. Until they do so, we are at risk for more tragic mass shootings.
The decisions by bad actors in the gun industry to engage in reckless and dangerous practices is one of the primary drivers of gun violence in America.
The evidence is clear: background checks work. They keep our communities safer and protect us from having guns fall into the hands of those who would seek to harm our children and our communities.
Experts estimate that 1 out of 5 gun sales occur in “no questions asked” transactions that often take place over the Internet or at gun shows where, in most states, background checks are not required. This dangerous loophole puts thousands and thousands of guns in the hands of dangerous people like domestic abusers, felons and the dangerously mentally ill.
Gun accessories, like bump stocks, that convert semiautomatic weapons into the functional equivalent of machine guns are dangerous and irresponsible. Congress should act to ban these devices.
***********************************************************************************
Argument Strength—POLITICS
(for each individual item, a response ∈ [−4, +4] indicates how “incredibly weak” (−4) to how “incredibly strong” (+4) one finds the argument, and each argument is presented on its own separate page in the survey. Responses on all 6 arguments are combined using positive and reverse scoring to create a singular metric PRO-GUN-RIGHTS ARGUMENT STRENGTH ∈ [−24, +24] with positive scores indicating pro-gun-rights arguments were found relatively more strong than pro-gun-control arguments.)
BASIC INSTRUCTIONS: In this section, you are asked to read a set of arguments on gun control and tell us how WEAK or STRONG you believe each argument is. These arguments may be useful if you need to explain the gun control debate to someone. Please note: We want to know how WEAK or STRONG you believe the argument is, NOT WHETHER YOU AGREE OR DISAGREE WITH THE ARGUMENT. Please try to leave your feelings about gun control aside and indicate how strong or weak you feel the argument is. Please be as objective as possible.
REMEMBER: whether you agree or disagree with the conclusion of an argument is not the same thing as whether you think the argument is weak or strong.
The next page presents the first argument for you to rate. Please read each argument careful before giving your rating.
Argument #1: Self-defense arguments for the need of guns are silly: guns only become necessary for self-defense because there are so many guns out there. Thus, guns should be outlawed outright--then we won’t need to worry about self-defense
Argument #2: The liberal media distorts gun issues: they only talk about tragedies involving guns. Yet guns were used defensively 2.5 million times last year. The real tragedy would be to outlaw guns--crime would spiral out of control.
Argument #3: Recent trials against gun manufacturers have consistently found them guilty, and have forced the gun industry to pay out huge sums of money. If the courts can find good reason to rein in the gun industry, then it is high time for Congress to follow suit.
Argument #4: Most privately-owned guns in America are owned by sportsmen and are used for completely peaceful purposes. These guns pose no risk to society, but they are unfairly targeted by gun control legislation.
Argument #5: The United States has the highest murder rate of all industrialized nations. It is also the only industrialized country that has lenient gun laws. We therefore say: bring down the number of guns, bring down the murder rate.
Argument #6: Gun control legislation can only regulate guns sold through legal outlets. But these days, many criminals buy their guns illegally. Gun control legislation therefore cannot regulate the most dangerous guns in society.
***********************************************************************************
Self Report Sleep Measures (Ask Prior to the Political Confirmation Bias Task Questions)
Question: Please mark the number that best corresponds to how sleep you feel right now. You may mark any number, but mark only one number.
(Response options range from 1 = “Extremely alert” to 9 = “Extremely sleepy—fighting sleep”. This is the Karolinska sleepiness measure: Åkerstedt and Gillberg, 1990 [24])
Question: Over the last 7 nights, what is the average amount of sleep you obtained each night?
(slider bar response between 0 and 12 h/night, with partial hours allowed)
References
- Allcott, H.; Gentzkow, M. Social media and fake news in the 2016 election. J. Econ. Perspect. 2017, 31, 211–236. [Google Scholar] [CrossRef] [Green Version]
- Bakshy, E.; Messing, S.; Adamic, L.A. Exposure to ideologically diverse news and opinion on Facebook. Science 2015, 348, 1130–1132. [Google Scholar] [CrossRef]
- Hart, W.; Albarracín, D.; Eagly, A.H.; Brechan, I.; Lindberg, M.J.; Merrill, L. Feeling validated versus being correct: A meta-analysis of selective exposure to information. Psychol. Bull. 2009, 135, 555–588. [Google Scholar] [CrossRef] [Green Version]
- Knobloch-Westerwick, S.; Mothes, C.; Polavin, N. Confirmation Bias, Ingroup Bias, and Negativity Bias in Selective Exposure to Political Information. Commun. Res. 2017, 47, 104–124. [Google Scholar] [CrossRef]
- Lord, C.G.; Ross, L.; Lepper, M.R. Biased assimilation and attitude polarization: The effects of prior theories on subsequently considered evidence. J. Personal. Soc. Psychol. 1979, 37, 2098. [Google Scholar] [CrossRef]
- Taber, C.; Lodge, M. Motivated Skepticism in the Evaluation of Political Beliefs. Am. J. Politi Sci. 2006, 50, 755–769. [Google Scholar] [CrossRef]
- Bail, C.A.; Argyle, L.P.; Brown, T.W.; Bumpus, J.P.; Chen, H.; Hunzaker, M.F.; Volfovsky, A. Exposure to opposing views on social media can increase political polarization. Proc. Natl. Acad. Sci. USA 2018, 115, 9216–9221. [Google Scholar] [CrossRef] [Green Version]
- Festinger, L. A Theory of Cognitive Dissonance; Stanford University Press: San Francisco, CA, USA, 2017; Volume 2. [Google Scholar]
- Cotton, J.L. Cognitive dissonance in selective exposure. In Selective Exposure to Communication; Routledge: London, UK, 1985; pp. 11–33. [Google Scholar]
- Frey, D. Recent Research on Selective Exposure to Information. In Advances in Experimental Social Psychology; Berkowitz, L., Ed.; Academic Press: New York, NY, USA, 1986; pp. 41–80. [Google Scholar]
- Frimer, J.A.; Skitka, L.J.; Motyl, M. Liberals and conservatives are similarly motivated to avoid exposure to one another’s opinions. J. Exp. Soc. Psychol. 2017, 72, 1–12. [Google Scholar] [CrossRef] [Green Version]
- Charpentier, C.J.; Bromberg-Martin, E.S.; Sharot, T. Valuation of knowledge and ignorance in mesolimbic reward circuitry. Proc. Natl. Acad. Sci. USA 2018, 115, E7255–E7264. [Google Scholar] [CrossRef] [Green Version]
- Kobayashi, K.; Hsu, M. Common neural code for reward and information value. Proc. Natl. Acad. Sci. USA 2019, 116, 13061–13066. [Google Scholar] [CrossRef] [Green Version]
- Nicolle, A.; Fleming, S.M.; Bach, D.R.; Driver, J.; Dolan, R.J. A regret-induced status quo bias. J. Neurosci. 2011, 31, 3320–3327. [Google Scholar] [CrossRef]
- Jones, M.; Sugden, R. Positive confirmation bias in the acquisition of information. Theory Decis. 2001, 50, 59–99. [Google Scholar] [CrossRef]
- Dickinson, D.L. Deliberation Enhances the Confirmation Bias: An Examination of Politics and Religion; IZA Discussion Paper 132421; Appalachian State University: Boone, NC, USA, 2020. [Google Scholar]
- Hafner, M.; Stepanek, M.; Taylor, J.; Troxel, W.M.; Van Stolk, C. Why sleep matters—The economic costs of insufficient sleep: A cross-country comparative analysis. Rand Health Q. 2017, 6, 11. [Google Scholar]
- Dickinson, D.L.; McElroy, T. Bayesian versus heuristic-based choice under sleep restriction and suboptimal times of day. Games Econ. Behav. 2019, 115, 48–59. [Google Scholar] [CrossRef] [Green Version]
- Castillo, M.; Dickinson, D.L. Sleep Restriction Increases Coordination Failure; IZA Discussion Paper No. 13242; Appalachian State University: Boone, NC, USA, 2020. [Google Scholar]
- Kroenke, K.; Spitzer, R.L.; Williams, J.B. The Patient Health Questionnaire-2: Validity of a two-item depression screener. Med. Care 2003, 41, 1284–1292. [Google Scholar] [CrossRef]
- Spitzer, R.L.; Kroenke, K.; Williams, J.B.; Löwe, B. A brief measure for assessing generalized anxiety disorder: The GAD-7. Arch. Intern. Med. 2006, 166, 1092–1097. [Google Scholar] [CrossRef] [Green Version]
- Adan, A.; Almirall, H. Horne & Östberg morningness-eveningness questionnaire: A reduced scale. Pers. Individ. Differ. 1991, 12, 241–253. [Google Scholar] [CrossRef]
- Goldman, S.E.; Stone, K.L.; Ancoli-Israel, S.; Blackwell, T.; Ewing, S.K.; Boudreau, R.; Cauley, J.A.; Hall, M.; Matth20ews, K.A.; Newman, A.B. Poor Sleep is Associated with Poorer Physical Performance and Greater Functional Limitations in Older Women. Sleep 2007, 30, 1317–1324. [Google Scholar] [CrossRef] [Green Version]
- Åkerstedt, T.; Gillberg, M. Subjective and Objective Sleepiness in the Active Individual. Int. J. Neurosci. 1990, 52, 29–37. [Google Scholar] [CrossRef]
- Dickinson, D.L.; Drummond, S.P.A.; McElroy, T. The viability of an ecologically valid chronic sleep restriction and circadian timing protocol: An examination of sample attrition, compliance, and effectiveness at impacting sleepiness and mood. PLoS ONE 2017, 12, e0174367. [Google Scholar] [CrossRef] [Green Version]
- Primi, C.; Morsanyi, K.; Chiesi, F.; Donati, M.A.; Hamilton, J. The Development and Testing of a New Version of the Cognitive Reflection Test Applying Item Response Theory (IRT). J. Behav. Decis. Mak. 2016, 29, 453–469. [Google Scholar] [CrossRef] [Green Version]
- Johns, M.W. A New Method for Measuring Daytime Sleepiness: The Epworth Sleepiness Scale. Sleep 1991, 14, 540–545. [Google Scholar] [CrossRef] [Green Version]
- Murphy, R.O.; Ackermann, K.A.; Handgraaf, M. Measuring Social Value Orientation. SSRN Electron. J. 2011, 6, 771–781. [Google Scholar] [CrossRef] [Green Version]
- Gneezy, U.; Rustichini, A.; Vostroknutov, A. Experience and insight in the race game. J. Econ. Behav. Organ. 2010, 75, 144–155. [Google Scholar] [CrossRef]
- Schoenborn, C.A.; Adams, P.E. Health behaviors of adults: United States, 2005–2007. Vital Health Stat. 2010, 245, 132. [Google Scholar]
- Castillo, M.; Dickinson, D.L.; Petrie, R. Sleepiness, choice consistency, and risk preferences. Theory Decis. 2017, 82, 41–73. [Google Scholar] [CrossRef] [Green Version]
| 1 | See Dickinson and McElroy [18] on this point and for a comparison of alternative frameworks. The conclusion is that a reasonable theoretical framework would consider that sleep restriction increases the relative cost of deliberative reasoning inputs in one’s decision making “production function”, which points to a reduced use of deliberation in such instances. Such a formal framework is consistent with the empirical evidence that generally finds decision making when sleepy as consistent with reduced deliberation and increased use of heuristics or automatic decision processes. |
| 2 | Risk of major depressive disorder was contained in the database responses to the PHQ-2 instrument (Kroenke et al.[20]), anxiety risk was assessed using the GAD-7 (Spitzer et al.[21]), and diurnal preferences were assessed using a validated short-form morningness–eveningness instrument (Adan and Almiral [22]). |
| 3 | |
| 4 | All subjects gave their informed consent for inclusion before they participated in the study, which was not required as a condition of continuance in the main sleep study. This study was conducted in accordance with the Declaration of Helsinki, and the protocol was approved by the Ethics Committee of Appalachian State University (IRB approval number 17-0177). |
| 5 | The indicator for Pro-Social = 1 individuals was based on the Social Value Orientation measure in Murphy et al. [28], Race Wins (out of 10 games) was a measure of backwards induction ability assessed using performance in a series of 10 Race Game tasks played against a computer opponent (Gneezy et al.[29]). |
| 6 | All results are similar if we ignore the selection issue altogether (available on request). |
| 7 | Variable compensation for this task was not used given that argument assessments were subjective, and there was no right or wrong number of pro-gun control information clips to view. A separate task not related to this paper was included within the survey and allowed participants to add up to another USD 3.75 (for a total of USD 8.75) to their Amazon gift code compensation for the survey. Fixed compensation for completing the sleep protocol was USD 30 paid by check after the conclusion of the study. |
| 8 | Taber and Lodge [6] examined both gun control and affirmative action in their study. The key feature is that the issue chosen for the task represents a rather partisan issue at the time. |
| 9 | Details on the questions and construction of this measure on shown in Appendix B (the “Extremity of Position” set of questions). |
| 10 | While the construction of the composite metric follows a similar approach, note that PRO-GUN-RIGHTS ARGUMENT STRENGTH differs from the Pro-Gun-Rights position measure in that the latter was constructed from a distinct set of arguments (for and against gun control) to which the respondent was asked to indicate his/her level of agreement, not the strength or weakness of the argument itself. |
| 11 | That is, a negative coefficient estimate indicates the higher one’s Liberal Score, the fewer Pro-Gun-Rights Clips viewed and the weaker the PRO-GUN-RIGHTS ARGUMENT STRENGTH. |
| 12 | Dickinson [16] documented a significantly stronger confirmation bias in both the political and religious domains for those participants indicating they had thought relatively more about these issues (using the same Thought Much measure as was in our survey). As an alternative, we estimated several of our main specifications that correspond to Figure 1 results by including the continuous variable Thought Much as a regressor, which necessitates the inclusion of a Thought Much * Liberal Score interaction term as all. These results are shown in the Appendix A, Figure A4, and they also highlight that the strongest impact of High Thought on the gun control issue in our confirmation bias finding is regarding PRO-GUN-RIGHTS ARGUMENT STRENGTH (especially for males). To avoid the need later for triple interaction terms to pursue this approach in examining Hypothesis 2, we conduct the analysis here using the High Thought subsample of the data where the estimated effects are most clear. |
| 13 | That is, the confirmation bias regarding perceived argument strength (Table 7) was equally strong across CRT scores and randomly assigned sleep levels. |
| 14 | Across all specifications in Table 6, the deliberation interaction term effects are consistently in the direction of the Hypothesis 2 prediction, but they vary in statistical significance. |
| 15 | Specifically, an examination of other outcomes by sleep condition do not support increased random choice. If one examines the Liberal Score impact on favorability ratings shown in Appendix A Figure A2, and compares the Liberal Score impact of SR versus WR participants on partisan personalities like Donald Trump and Hillary Clinton (or, on wealthy individuals versus those on welfare), we find no significant different in the partisan effect on favorability ratings by SR assignment (results available on request). A more random response pattern from SR individuals would not be predicted to produce a systematic pattern such as this. Castillo et al.[31] examined how sleepiness impacted risky choice and documented that the increased preference for risk in their sleepier participant was not due to increased randomness in choice. |
Figure 1.
Impact of Liberal Score on # PRO-GUN-RIGHTS CLIPS viewed (upper panels) and on perceived strength of pro-gun-rights arguments (lower panels). Notes: All models account for sample selection using the inverse probability weight (IPW) correction—see Table A1 for selection equation estimates. One or more control measures were not captured on 4 individuals. Models conditioned on sleep compliance do not include well-rested (WR) participants with < 405 min nightly sleep (actigraphy measured) or sleep-restricted (SR) participants with > 375 min nightly sleep (and also excludes participants who failed the attention check question). HIGH Thought refers to those responding ≥ 65 on a [0, 100] scale of how much thought they had put into the issue of gun control. Thin (thick) lines represent the 95% (90%) confidence intervals. See Table 2, Table 3, Table 4 and Table 5 for full results of all models other than binary regressions for the separate male and female subsample models (where the only independent variable was Liberal Score and whose coefficient estimate is shown above).

Figure 2.
WR and cognitive reflection promote the confirmation bias. (a) Impact of Sleep Treatment on # PRO-GUN-RIGHTS CLIPS viewed; (b) Impact of Cognitive Reflection on # PRO-GUN-RIGHTS CLIPS viewed. Notes: Effect shown for models (3) and (7) in Table 6, which included control variables and used the subset of participants who complied with their prescribed sleep assignment from the larger sleep study. Negatively sloped forecast lines are consistent with the confirmation bias, but the steeper profile of the WR (upper panel) and CRT = 5 (lower panel) forecast lines indicate a more severe confirmation bias.


Table 1.
Summary statistics.
| Variable | Mean (Std Dev) | Notes |
|---|---|---|
| Female (=1) | 0.614 (0.488) | n = 121 females, n = 76 males |
| Minority (=1) | 0.239 (0.427) | n = 47 minority, n = 150 nonminority |
| Age (in years) | 19.822 (2.900) | ≥40 years of age excluded from study |
| Parent Income category | 7.995 (3.108) | 8 = USD 75,000 total household income |
| Mother’s Education Level | 8.178 (2.014) | 8 = Associate degree |
| Epworth daytime sleepiness score | 8.173 (3.487) | ≥10 indicate significant daytime sleepiness |
| Prosocial (=1) | 0.767 (0.424) | Based on Social Value Orientation (n = 193) |
| Race Game Score [0, 10] | 4.253 (2.215) | Backwards induction measure (n = 194) |
| 6-item Cognitive Reflection Task score | 2.273 (1.691) | (n = 194) |
| Liberal Score (1–5) | 3.274 (0.967) |
Notes:observations = 197 unless otherwise specified (lower in a few instances due to missing responses on some instruments).
Table 2.
Impact of Liberal Score on # PRO-GUN-RIGHTS CLIPS viewed—all subjects.
| Variable | Simple (1) Coef (SE) | Simple + SR Compliant (2) Coef (SE) | Controls (3) Coef (SE) | Controls + SR Compliant (4) Coef (SE) | Controls + SR Compliant HIGH THOUGHT (5) Coef (SE) | Controls + SR Compliant LOW THOUGHT (6) Coef (SE) |
|---|---|---|---|---|---|---|
| Constant | 3.961 (0.262) *** | 3.973 (0.293) *** | 3.770 (0.844) *** | 3.915 (0.857) *** | 4.079 (1.032) *** | 3.808 (1.274) *** |
| Liberal Score | −0.266 (0.078) *** | −0.278 (0.086) *** | −0.238 (0.073) *** | −0.260 (0.079) *** | −0.227 (0.086) *** | −0.277 (0.165) * |
| Age | --- | --- | 0.018 (0.040) | 0.015 (0.040) | 0.022 (0.046) | −0.026 (0.062) |
| Female | --- | --- | −0.0077 (0.121) | −0.073 (0.129) | −0.104 (0.148) | −0.033 (0.270) |
| Minority | --- | --- | −0.467 (0.159) *** | −0.435 (0.169) ** | −0.362 (0.249) | −0.586 (0.232) ** |
| Epworth | --- | --- | 0.006 (0.016) | 0.006 (0.017) | 0.020 (0.020) | −0.017 (0.028) |
| rMEQ | --- | --- | 0.002 (0.021) | −0.0002 (0.022) | −0.021 (0.024) | 0.055 (0.038) |
| SR | --- | --- | −0.016 (0.117) | −0.005 (0.128) | −0.059 (0.170) | 0.023 (0.181) |
| Pro-Social | --- | --- | −0.047 (0.143) | −0.074 (0.150) | −0.088 (0.206) | −0.014 (0.208) |
| Race Wins | --- | --- | −0.041 (0.026) | −0.056 (0.029) * | −0.132 (0.038) *** | 0.057 (0.045) |
| CRT score | --- | --- | 0.010 (0.041) | 0.032 (0.044) | 0.070 (0.051) | −0.017 (0.081) |
| IPW-correct | Yes | Yes | Yes | Yes | Yes | Yes |
| Obs | 197 | 176 | 193 | 172 | 102 | 71 |
| R-squared | 0.091 | 0.093 | 0.163 | 0.172 | 0.257 | 0.243 |
Notes: * p < 0.10, ** p < 0.05, *** p < 0.01 for the 1-tailed test for the confirmation bias hypothesis tests of the Liberal Score coefficient estimate given our ex ante hypothesis of a confirmation bias via selective information exposure. Asterisks show results from 2-tailed tests for all other regressors. --- indicates covariates omitted for that specification. All models take selection into account by using the inverse probability weights from the selection equation estimates given in Table A1. High Thought refers to those who reported have thought relatively a lot about the specific issue of gun control (Thought Much ≥ 65 on scale of 0–10).
Table 3.
Impact of Liberal Score on PRO-GUN-RIGHTS ARGUMENT STRENGTH—all subjects.
| Variable | Simple (1) Coef (SE) | Simple + SR Compliant (2) Coef (SE) | Controls (3) Coef (SE) | Controls + SR Compliant (4) Coef (SE) | Controls + SR Compliant HIGH THOUGHT (5) Coef (SE) | Controls + SR Compliant LOW THOUGHT (6) Coef (SE) |
|---|---|---|---|---|---|---|
| Constant | 16.755 (1.926) *** | 15.954 (2.222) *** | 12.975 (5.061) ** | 13.592 (5.407) ** | 21.985 (6.887) *** | −2.678 (9.065) |
| Liberal Score | −4.312 (0.533) *** | −4.113 (0.608) *** | −3.896 (0.497) *** | −3.795 (0.543) *** | −4.742 (0.633) *** | −1.714 (1.02) * |
| Age | --- | --- | 0.391 (0.185) ** | 0.451 (0.188) ** | 0.352 (0.194) * | 0.396 (0.461) |
| Female | --- | --- | −1.846 (0.982) * | −1.531 (1.066) | 0.124 (1.409) | −2.789 (1.597) * |
| Minority | --- | --- | −2.268 (1.185) * | −2.520 (1.246) ** | −3.332 (1.869) * | −1.115 (1.592) |
| Epworth | --- | --- | −0.042 (0.142) | −0.093 (0.152) | −0.048 (0.193) | −0.073 (0.205) |
| rMEQ | --- | --- | −0.205 (0.169) | −0.318 (0.185) * | −0.488 (0.219) ** | 0.254 (0.269) |
| SR | --- | --- | −0.622 (0.963) | −0.613 (1.041) | −0.540 (1.461) | −0.678 (1.439) |
| Pro-Social | --- | --- | −0.773 (1.251) | −0.871 (1.330) | −2.329 (1.767) | 1.401 (1.974) |
| Race Wins | --- | --- | 0.025 (0.187) | −0.076 (0.203) | −0.299 (0.285) | 0.328 (0.321) |
| CRT score | --- | --- | −0.046 (0.258) | −0.051 (0.276) | 0.112 (0.354) | −0.388 (0.432) |
| IPW- correct | Yes | Yes | Yes | Yes | Yes | Yes |
| Obs | 197 | 176 | 193 | 172 | 102 | 71 |
| R-squared | 0.288 | 0.253 | 0.348 | 0.362 | 0.467 | 0.159 |
Notes: * p < 0.10, ** p < 0.05, *** p < 0.01 for the 1-tailed test for the confirmation bias hypothesis tests of the Liberal Score coefficient estimate given our ex ante hypothesis of a confirmation bias via perceptions regarding argument credibility. Asterisks show results from 2-tailed tests for all other regressors. --- indicates covariates omitted for that specification. All models take selection into account by using the inverse probability weights from the selection equation estimates given in Table A1. High Thought refers to those who reported have thought relatively a lot about the specific issue of gun control (Thought Much ≥ 65 on scale of 0–100).
Table 4.
Impact of Liberal Score on # PRO-GUN-RIGHTS CLIPS viewed—males vs females.
| MALE SUBSAMPLE | FEMALE SUBSAMPLE | |||||||
|---|---|---|---|---|---|---|---|---|
| Variable | (1) Coef (SE) | SR Compliant (2) Coef (SE) | Compliant HIGH THOUGHT (3) Coef (SE) | Compliant LOW THOUGHT (4) Coef (SE) | (5) Coef (SE) | SR Compliant (6) Coef (SE) | Compliant HIGH THOUGHT (7) Coef (SE) | Compliant LOW THOUGHT (8) Coef (SE) |
| Constant | 3.27 (1.13) *** | 3.85 (1.16) *** | 4.39 (1.10) *** | 3.91 (1.74) ** | 4.75 (0.75) *** | 4.79 (0.81) *** | 4.39 (1.17) *** | 5.12 (0.87) *** |
| Liberal Score | −0.20 (0.09) ** | −0.26 (0.09) *** | −0.36 (0.08) *** | 0.92 (0.27) *** | −0.28 (0.10) *** | −0.29 (0.11) *** | −0.10 (0.14) | −0.57 (0.16) *** |
| Age | 0.06 (0.04) | 0.05 (0.05) | 0.04 (0.04) | −0.14 (0.07) * | −0.04 (0.03) | −0.04 (0.03) | −0.03 (0.03) | −0.05 (0.04) |
| Minority | −0.29 (0.20) | −0.20 (0.22) | −0.34 (0.37) | −0.38 (0.29) | −0.52 (0.21) ** | −0.49 (0.22) ** | −0.32 (0.33) | −0.57 (0.26) ** |
| Epworth | −0.01 (0.03) | −0.004 (0.03) | −0.02 (0.03) | −0.11 (0.05) ** | 0.02 (0.02) | 0.01 (0.02) | 0.03 (0.03) | −0.01 (0.03) |
| rMEQ | −0.02 (0.03) | −0.04 (0.04) | −0.05 (0.04) | 0.07 (0.07) | 0.01 (0.03) | 0.02 (0.03) | −0.01 (0.03) | 0.07 (0.04) * |
| SR | −0.21 (0.16) | −0.19 (0.18) | −0.25 (0.23) | −0.48 (0.28) | 0.17 (0.16) | 0.16 (0.17) | 0.15 (0.24) | 0.01 (0.19) |
| Pro-Social | −0.06 (0.20) | −0.10 (0.22) | −0.15 (0.29) | 0.10 (0.38) | 0.04 (0.19) | 0.004 (0.20) | 0.11 (0.30) | −0.11 (0.21) |
| Race Wins | −0.05 (0.03) * | −0.08 (0.04) ** | −0.12 (0.04) *** | −0.06 (0.11) | −0.04 (0.04) | −0.06 (0.04) | −0.17 (0.06) *** | 0.04 (0.05) |
| CRT score | 0.07 (0.05) | 0.10 (0.06) | 0.15 (0.08) * | −0.12 (0.09) | −0.05 (0.06) | −0.03 (0.06) | 0.01 (0.06) | −0.08 (0.11) |
| IPW-correct | Yes | Yes | Yes | Yes | Yes | Yes | Yes | Yes |
| Obs | 75 | 64 | 40 | 24 | 118 | 108 | 62 | 47 |
| R-squared | 0.237 | 0.286 | 0.474 | 0.525 | 0.197 | 0.187 | 0.212 | 0.447 |
Notes: * p < 0.10, ** p < 0.05, *** p < 0.01 for the 1-tailed test for the confirmation bias hypothesis tests of the Liberal Score coefficient estimate given our ex ante hypothesis of a confirmation bias via selective information exposure. Asterisks show results from 2-tailed tests for all other regressors. All models take selection into account by using the inverse probability weights from the selection equation estimates given in Table A1. High Thought refers to those who reported have thought relatively a lot about the specific issue of gun control (Thought Much ≥ 65 on scale of 0–10).
Table 5.
Impact of Liberal Score on PRO-GUN-RIGHTS ARGUMENT STRENGTH—males vs females.
| MALE SUBSAMPLE | FEMALE SUBSAMPLE | |||||||
|---|---|---|---|---|---|---|---|---|
| Variable | (1) Coef (SE) | SR Compliant (2) Coef (SE) | Compliant HIGH THOUGHT (3) Coef (SE) | Compliant LOW THOUGHT (4) Coef (SE) | (5) Coef (SE) | SR Compliant (6) Coef (SE) | Compliant HIGH THOUGHT (7) Coef (SE) | Compliant LOW THOUGHT (8) Coef (SE) |
| Constant | 23.72 (8.90) *** | 24.91 (9.58) ** | 28.59 (10.25) *** | 21.83 (32.70) | 3.93 (5.32) | 4.65 (5.83) | 13.66 (10.067) | −13.20 (8.40) |
| Liberal Score | −5.07 (0.61) *** | −5.02 (0.66) *** | −5.66 (0.72) *** | 1.89 (3.26) | −3.07 (0.69) *** | −3.02 (0.74) *** | −3.63 (1.08) *** | −3.14 (1.24) *** |
| Age | 0.10 (0.34) | 0.12 (0.35) | 0.13 (0.32) | −1.05 (1.07) | 0.58 (0.16) *** | 0.64 (0.16) *** | 0.56 (0.20) *** | 1.06 (0.43) ** |
| Minority | −2.56 (2.31) | −2.50 (2.56) | −5.22 (4.11) | −0.27 (6.61) | −1.94 (1.35) | −2.07 (1.39) | −2.48 (2.07) | −0.60 (1.92) |
| Epworth | −0.14 (0.26) | −0.12 (0.26) | −0.19 (0.35) | −0.17 (0.44) | 0.01 (0.15) | −0.04 (0.16) | 0.09 (0.20) | −0.14 (0.26) |
| rMEQ | −0.25 (0.25) | −0.31 (0.30) | −0.33 (0.39) | 0.28 (0.91) | −0.22 (0.23) | −0.35 (0.25) | −0.63 (0.30) | 0.31 (0.30) |
| SR | −0.08 (1.58) | 0.46 (1.78) | 0.16 (2.78) | −1.89 (3.80) | −0.87 (1.23) | −1.27 (1.26) | −0.84) (1.66) | −1.75 (1.85) |
| Pro-Social | −2.15 (2.01) | −2.82 (2.27) | −2.32 (3.11) | −1.71 (5.28) | 0.11 (1.61) | 0.19 (1.65) | −1.79 (2.13) | 2.25 (2.43) |
| Race Wins | −0.09 (0.32) | −0.44 (0.38) | −0.79 (0.49) | −0.61 (1.60) | 0.04 (0.22) | 0.08 (0.22) | −0.13 (0.29) | 0.28 (0.36) |
| CRT score | 0.45 (0.36) | 0.60 (0.44) | 0.77 (0.52) | −0.18 (1.32) | −0.23 (0.37) | −0.20 (0.38) | −0.003 (0.53) | −0.80 (0.60) |
| IPW-correct | Yes | Yes | Yes | Yes | Yes | Yes | Yes | Yes |
| Obs | 75 | 64 | 40 | 24 | 118 | 108 | 62 | 47 |
| R-squared | 0.418 | 0.397 | 0.532 | 0.091 | 0.224 | 0.237 | 0.384 | 0.258 |
Notes: ** p < 0.05, *** p < 0.01 for the 1-tailed test for the confirmation bias hypothesis tests of the Liberal Score coefficient estimate given our ex ante hypothesis of a confirmation bias via selective information exposure. Asterisks show results from 2-tailed tests for all other regressors. All models take selection into account by using the inverse probability weights from the selection equation estimates given in Table A1. High Thought refers to those who reported have thought relatively a lot about the specific issue of gun control (Thought Much ≥ 65 on scale of 0–100).
Table 6.
Impact Liberal Score and interactions on # PRO-GUN-RIGHTS CLIPS viewed.
| Interaction of Liberal Score Strength with SR | Interaction of Liberal Score Strength with CRT | |||||||
|---|---|---|---|---|---|---|---|---|
| Variable | Compliant (1) Coef (SE) | Full (2) Coef (SE) | Compliant (3) Coef (SE) | Full (4) Coef (SE) | Compliant (5) Coef (SE) | Full (6) Coef (SE) | Compliant (7) Coef (SE) | Full (8) Coef (SE) |
| Constant | 4.827 (0.615) *** | 4.444 (0.554) *** | 4.812 (1.005) *** | 4.330 (1.032) *** | 3.242 (0.553) *** | 3.224 (0.513) *** | 3.743 (0.950) *** | 3.584 (0.908) *** |
| Liberal Score | −0.505 (0.166) *** | −0.387 (0.148) *** | −0.403 (0.153) *** | −0.307 (0.134) ** | −0.107 (0.164) | −0.080 (0.151) | −0.036 (0.142) | −0.006 (0.142) |
| SR | −1.507 (0.715) ** | −1.069 (0.657) | −1.091 (0.668) | −0.835 (0.618) | --- | --- | −0.015 (0.168) | −0.080 (0.161) |
| Lib Score * SR | 0.422 (0.200) ** | 0.296 (0.184) * | 0.297 (0.191) * | 0.211 (0.173) | --- | --- | --- | --- |
| CRT | --- | --- | 0.058 (0.051) | 0.027 (0.049) | 0.315 (0.236) | 0.308 (0.218) | 0.399 (0.200) ** | 0.359 (0.186) * |
| Lib Score * CRT | --- | --- | --- | --- | −0.071 (0.065) | −0.074 (0.059) | −0.095 (0.055) ** | −0.094 (0.051) ** |
| Age | --- | --- | 0.018 (0.037) | 0.028 (0.040) | --- | --- | 0.012 (0.033) | 0.020 (0.033) |
| Female | --- | --- | −0.127 (0.145) | −0.117 (0.146) | --- | --- | −0.094 (0.145) | −0.111 (0.145) |
| Minority | --- | --- | −0.302 (0.247) | −0.400 (0.244) | --- | --- | −0.354 (0.254) | −0.452 (0.249) |
| Epworth | --- | --- | 0.013 (0.020) | 0.006 (0.020) | --- | --- | 0.012 (0.021) | 0.003 (0.021) |
| rMEQ | --- | --- | −0.020 (0.024) | −0.020 (0.024) | --- | --- | −0.022 (0.025) | −0.025 (0.024) |
| Pro-Social | --- | --- | −0.109 (0.208) | −0.028 (0.200) | --- | --- | −0.117 (0.217) | −0.037 (0.207) |
| Race Wins | --- | --- | −0.121 (0.041) *** | −0.094 (0.035) *** | --- | --- | −0.147 (0.037) *** | −0.111 (0.033) *** |
| IPW-correct | Yes | Yes | Yes | Yes | Yes | Yes | Yes | Yes |
| Obs | 104 | 115 | 102 | 113 | 102 | 113 | 102 | 113 |
| R-squared | 0.160 | 0.121 | 0.286 | 0.222 | 0.139 | 0.123 | 0.292 | 0.242 |
Notes: * p < 0.10, ** p < 0.05, *** p < 0.01 for the 2-tailed test. --- indicates covariates omitted for that specification. Models estimated on the subsample of individuals having Thought Much ≥ 65 on scale of 0–100. Key coefficient estimates on Liberal Score and its interactions Liberal Score * SR and Liberal Score * CRT can be assessed using 1-tailed test given our ex ante hypothesis that deliberation promotes the confirmation bias. Key main and interaction effect estimations in shaded cells. A specification that includes both interaction effects maintains the same sign on the main effects of SR and CRT, as well as the same sign on interaction effects of these variables with Liberal Score, but statistical precision is not robust as power is reduced. In such a specification, which of the SR or CRT effects are precisely estimated (i.e., statistically significant) depends on the specification (i.e., controls or not, compliant participants or intent-to-treat). Female and Minority are indicator variables. Epworth and rMEQ are the Epworth daytime sleepiness score and reduced morningness-eveningness diurnal preference score, respectively, of the individual from the prescreen survey (i.e., trait level measured at point in time prior to this study). Pro-Social is an indicator variable derived from the social value orientation measure, and Race Wins measures the individual’s score on a backwards induction measure (the “race game”). The sample size is reduced by 2 observations in some specifications due to two participants for which the CRT measure is missing.
Table 7.
Impact of Liberal Score and interactions on PRO-GUN-RIGHTS ARGUMENT STRENGTH.
| Interaction of Liberal Score Strength with SR | Interaction of Liberal Score Strength with CRT | |||||||
|---|---|---|---|---|---|---|---|---|
| Variable | Compliant (1) Coef (SE) | Full (2) Coef (SE) | Compliant (3) Coef (SE) | Full (4) Coef (SE) | Compliant (5) Coef (SE) | Full (6) Coef (SE) | Compliant (7) Coef (SE) | Full (8) Coef (SE) |
| Constant | 21.23 (3.30) *** | 21.31 (2.63) *** | 11.10 (8.30) *** | 21.61 (7.47) *** | 19.24 (4.19) *** | 18.78 (3.62) *** | 22.15 (6.89) *** | 20.89 (6.49) *** |
| Liberal Score | −5.33 (0.82) *** | −5.32 (0.65) *** | −4.79 (0.96) *** | −4.82 (0.79) *** | −5.03 (1.04) *** | −4.95 (0.90) *** | −4.84 (1.06) *** | −4.58 (0.96) *** |
| SR | −2.27 (4.96) | −2.43 (4.40) | −0.84 (5.19) | −1.73 (4.52) | --- | --- | −0.56 (1.44) | −0.82 (1.30) |
| Lib Score * SR | 0.61 (1.27) | 0.62 (1.15) | 0.09 (1.29) | 0.26 (1.15) | --- | --- | --- | --- |
| CRT | --- | --- | 0.11 (0.35) | 0.23 (0.32) | 0.09 (1.56) | 0.42 (1.37) | −0.05 (1.39) | 0.41 (1.25) |
| Lib Score * CRT | --- | --- | --- | --- | 0.06 (0.42) | −0.01 (0.36) | 0.05 (0.37) | −0.05 (0.34) |
| Age | --- | --- | 0.35 (0.20) * | 0.30 (0.20) | --- | --- | 0.36 (0.22) | 0.30 (0.22) |
| Female | --- | --- | 0.12 (1.41) | −0.60 (1.27) | --- | --- | 0.12 (1.42) | −0.57 (1.28) |
| Minority | --- | --- | −3.31 (1.87) * | −2.77 (1.81) | --- | --- | −3.34 (1.88) | −2.83 (1.82) |
| Epworth | --- | --- | −0.05 (0.20) | −0.05 (0.19) | --- | --- | −0.04 (0.20) | −0.05 (0.19) |
| rMEQ | --- | --- | −0.49 (0.22) ** | −0.39 (0.21) * | --- | --- | −0.49 (0.22) ** | −0.39 (0.21) * |
| Pro-Social | --- | --- | −2.34 (1.78) | −2.12 (1.65) | --- | --- | −2.32 (1.77) | −2.11 (1.64) |
| Race Wins | --- | --- | −0.30 (0.30) | −0.19 (0.26) | --- | --- | −0.29 (0.30) | −0.20 (0.26) |
| IPW-correct | Yes | Yes | Yes | Yes | Yes | Yes | Yes | Yes |
| Obs | 104 | 115 | 102 | 113 | 102 | 113 | 102 | 113 |
| R-squared | 0.380 | 0.408 | 0.467 | 0.480 | 0.390 | 0.423 | 0.467 | 0.480 |
Notes: * p < 0.10, ** p < 0.05, *** p < 0.01 for the 2-tailed test. --- indicates covariates omitted for that specification. Models estimated on the subsample of individuals having Thought Much ≥ 65 on scale of 0–100. Key coefficient estimates on Liberal Score and its interactions Liberal Score * SR and Liberal Score * CRT can be assessed using 1-tailed test given our ex ante hypothesis that deliberation promotes the confirmation bias. Key main and interaction effect estimations in shaded cells. Female and Minority are indicator variables. Epworth and rMEQ are the Epworth daytime sleepiness score and reduced morningness-eveningness diurnal preference score, respectively, of the individual from the prescreen survey (i.e., trait level measured at point in time prior to this study). Pro-Social is an indicator variable derived from the social value orientation measure, and Race Wins measures the individual’s score on a backwards induction measure (the “race game”). The sample size is reduced by 2 observations in some specifications due to two participants for which the CRT measure is missing.
Publisher’s Note: MDPI stays neutral with regard to jurisdictional claims in published maps and institutional affiliations. |
© 2020 by the author. Licensee MDPI, Basel, Switzerland. This article is an open access article distributed under the terms and conditions of the Creative Commons Attribution (CC BY) license (http://creativecommons.org/licenses/by/4.0/).
Share and Cite
MDPI and ACS Style
Dickinson, D.L. Deliberation Enhances the Confirmation Bias in Politics. Games 2020, 11, 57. https://0-doi-org.brum.beds.ac.uk/10.3390/g11040057
AMA Style
Dickinson DL. Deliberation Enhances the Confirmation Bias in Politics. Games. 2020; 11(4):57. https://0-doi-org.brum.beds.ac.uk/10.3390/g11040057
Chicago/Turabian StyleDickinson, David L. 2020. "Deliberation Enhances the Confirmation Bias in Politics" Games 11, no. 4: 57. https://0-doi-org.brum.beds.ac.uk/10.3390/g11040057
Note that from the first issue of 2016, this journal uses article numbers instead of page numbers. See further details here.