Article

Recent Developments in the Recycling of Spent Selective Catalytic Reduction Catalyst in South Korea

1
Korea Institute of Geoscience and Mineral Resources, 124 Gwahak-ro, Yuseong-gu, Daejeon 34132, Korea
2
HANNAE For T, 22 Sandan 3-ro, 5-gil, Seongmun-myeon, Dangjin-si, Chungcheongnam-do 31702, Korea
3
Department of Advanced Material Science and Engineering, Daejin University, 1007 Hoguk-ro, Pocheon-si, Gyeonggi-do 11159, Korea
4
Department of Resources Recycling, Korea University of Science and Technology, 217 Gajeong-ro Yuseong-gu, Daejeon 34113, Korea
*
Authors to whom correspondence should be addressed.
Submission received: 3 January 2020 / Revised: 26 January 2020 / Accepted: 31 January 2020 / Published: 3 February 2020
(This article belongs to the Special Issue State-of-the-Art Catalytical Technology in South Korea)

Abstract

:
Spent selective catalytic reduction (SCR) catalyst installed in power and incineration plants is used to convert nitrogen oxide (NOx) gas to nitrogen (N2) gas. Currently, most spent SCR catalyst in South Korea is eventually discarded in landfills. Recently, a novel and efficient recycling process has been developed to recover tungsten (W), vanadium (V) and titanium (Ti) from spent SCR catalyst. In this process, after soda-melting reactions between the spent SCR catalyst and sodium carbonate (Na2CO3) at 1273 K, hydrometallurgical treatments were carried out for the production of high-purity products, such as 99.3% sodium tungstate (Na2WO4), 99.3% vanadium oxide (V2O5) and 99.6% titanium dioxide (TiO2). On the basis of the fundamental investigation of this novel recycling process, process scale-up has been attempted to establish a commercial process. In this paper, recent developments in the recycling process for spent SCR catalyst and the results obtained using the scaled-up process will be discussed. Therefore, this study will provide a practical method for the recovery of W, V and Ti from spent SCR catalyst.

1. Introduction

Selective catalytic reduction (SCR) catalyst is used in power plants, incineration plants and vehicles for the conversion of nitrogen oxide (NOx) gas to nitrogen (N2) gas. This NOx gas is one of the major causes of particulate matter smaller than 2.5 micron (PM 2.5) that threatens public health [1,2]. For the prevention of the harmful effect of NOx gas, governments around the world have been strengthening related legislations and policies to control the emission of NOx gas from the stationary sources and automobiles [3]. As a result, attention is drawn to the importance of the use of SCR catalyst and the volume installed will increase in the future.
Among the several types of SCR catalysts, vanadium pentoxide (V2O5)-tungsten trioxide (WO3)/titanium dioxide (TiO2) catalyst is the most commonly used in industries owing to the high conversion rate of NOx gas, durability, sulfur endurance and wide temperature range for operation [4,5]. The compositions for the SCR catalyst are 0.5 mass %–1.5 mass % of V2O5, 7 mass %–10 mass % of WO3 and 70 mass %–80 mass % of TiO2 [4,6]. Among these components, V2O5 is used for catalytic reactions and WO3 and TiO2 are used as the catalytic promoter and supporting material, respectively [5].
When the catalytic performance of the installed SCR catalyst is decreased, regeneration of the spent catalyst is carried out for the recovery of its catalytic performance. However, it is difficult to prevent the decrease in the catalytic performance. As a result, a large amount of the spent SCR catalyst that cannot be regenerated further is discarded from plants. Moreover, the amount of the discarded spent SCR catalyst has increased owing to the increased volumes of installation in factories. For example, in South Korea, 11,000 tons of spent SCR catalyst were generated in 2014 [7].
Unfortunately, most of the spent SCR catalyst generated in South Korea is discarded in a landfill, although it contains valuable elements. Moreover, the landfill of the spent SCR catalyst costs because it contains hazardous materials such as vanadium (V). Therefore, the development of a cost-effective and environmentally-friendly method for the recycling of spent SCR catalyst is necessary for the recovery of the valuable elements as well as for environmental preservation by decreasing the amount of the spent catalyst discarded in landfills.
Several studies have been conducted for the recovery of V and tungsten (W) from a spent SCR catalyst. Soda-roasting and water leaching [8], pressure leaching [9,10] or alkaline leaching [11,12] are employed to extract V and W from a spent SCR catalyst. It is, however, worth noting that about 70–80% of the amount of a spent SCR catalyst feed processed will be generated as a waste if only V and W are recovered. Therefore, it is important to recover titanium (Ti) as well as V and W when the recycling of a spent SCR catalyst is taken into consideration.
However, the recovery of Ti from a spent SCR catalyst is seldom reported although the methods for the extraction of Ti from ores or slags were investigated for the production of TiO2 [13,14,15,16]. Recently, Moon et al. reported the method that is characterized by soda-melting, water/hydrochloric acid (HCl) leaching, desilication and hydrolysis in order to recover Ti as well as V and W [13,14]. The results showed that TiO2 with a purity of 99.6–99.9% was obtained using a spent SCR catalyst. This study demonstrated the feasibility of the recycling of a spent SCR catalyst by lab-scale experiments.
In spite of the importance of recycling a spent SCR catalyst, there is no commercial plant for the recycling of a spent SCR catalyst in the world, as per the authors’ knowledge, although desulfurization and automotive catalysts are commercially recycled. When the amount and environmental concerns of spent SCR catalyst discarded in the future are considered, the establishment of a cost-effective commercial recycling process for spent SCR catalyst will be recognized as an urgent issue and will become a vital concern in the near future.
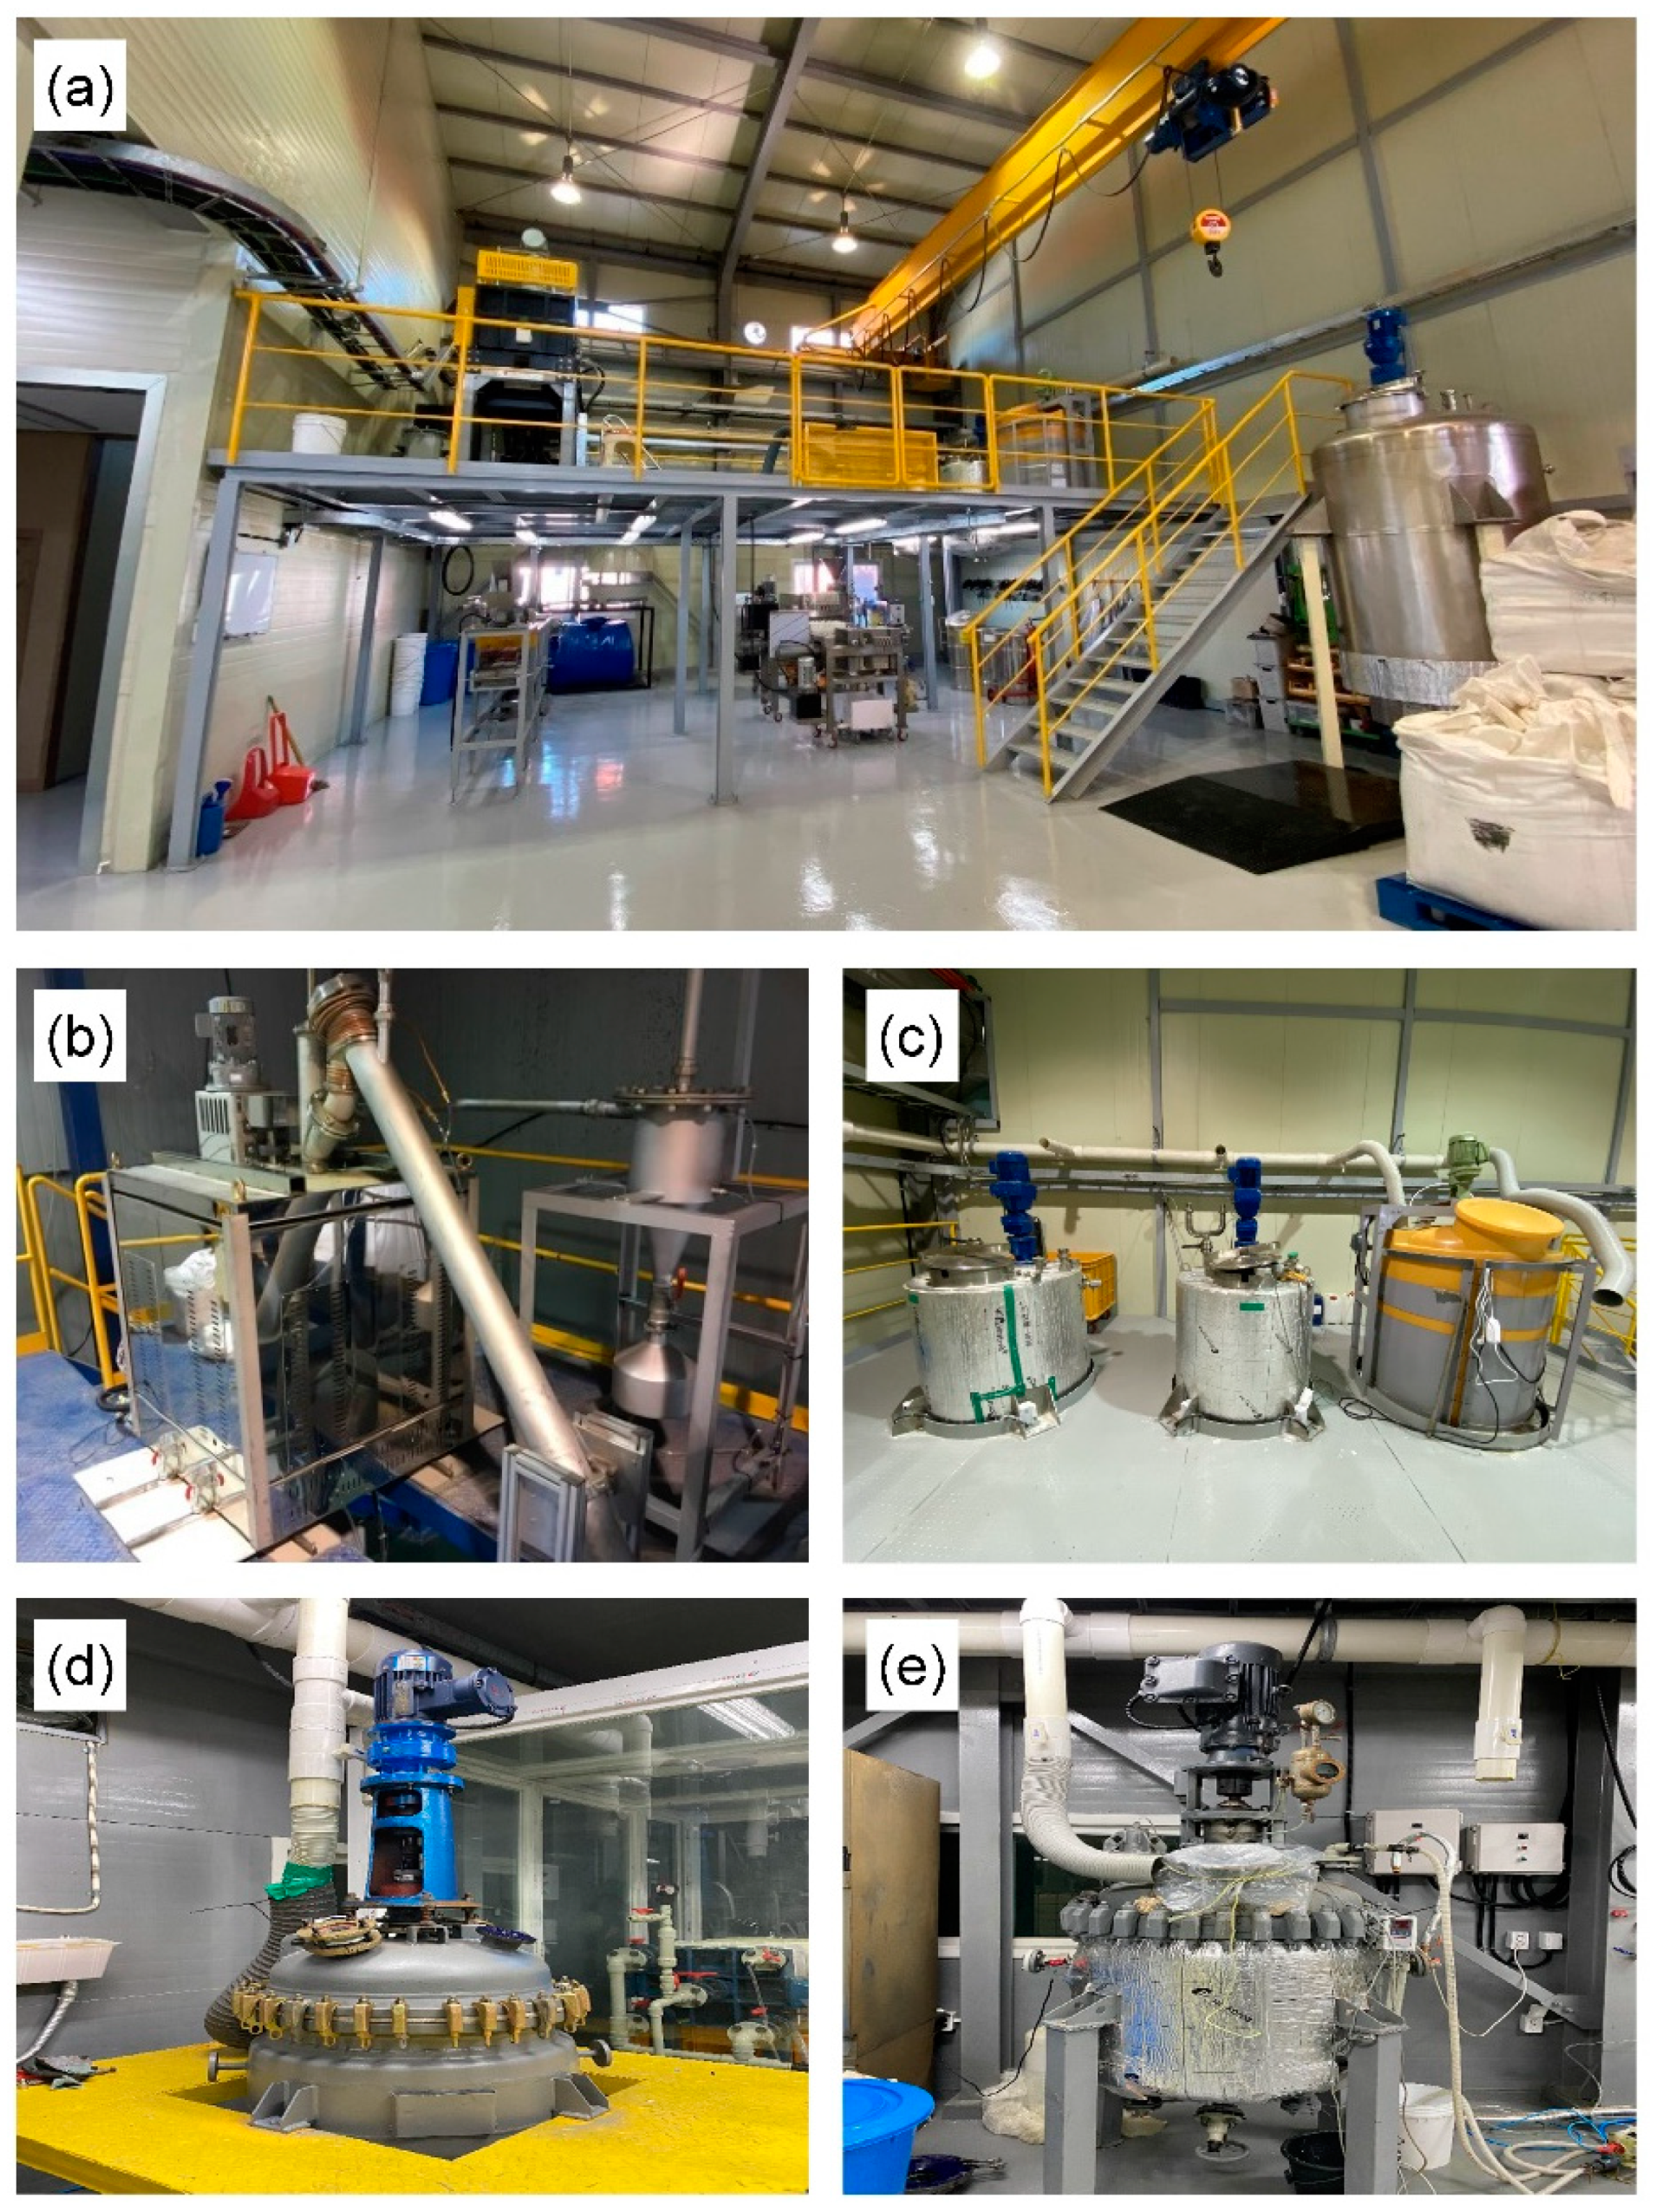
At the Korea Institute of Geoscience and Mineral Resources (KIGAM), there has been progress in the development of a recycling process using a spent SCR catalyst since 2011. Recently, beyond the lab-scale experiments, the feasibility study of semi-pilot and pilot plants was carried out and a commercial plant for processing 3000 ton/year of the spent SCR catalyst generated from power plants is under construction in South Korea. 
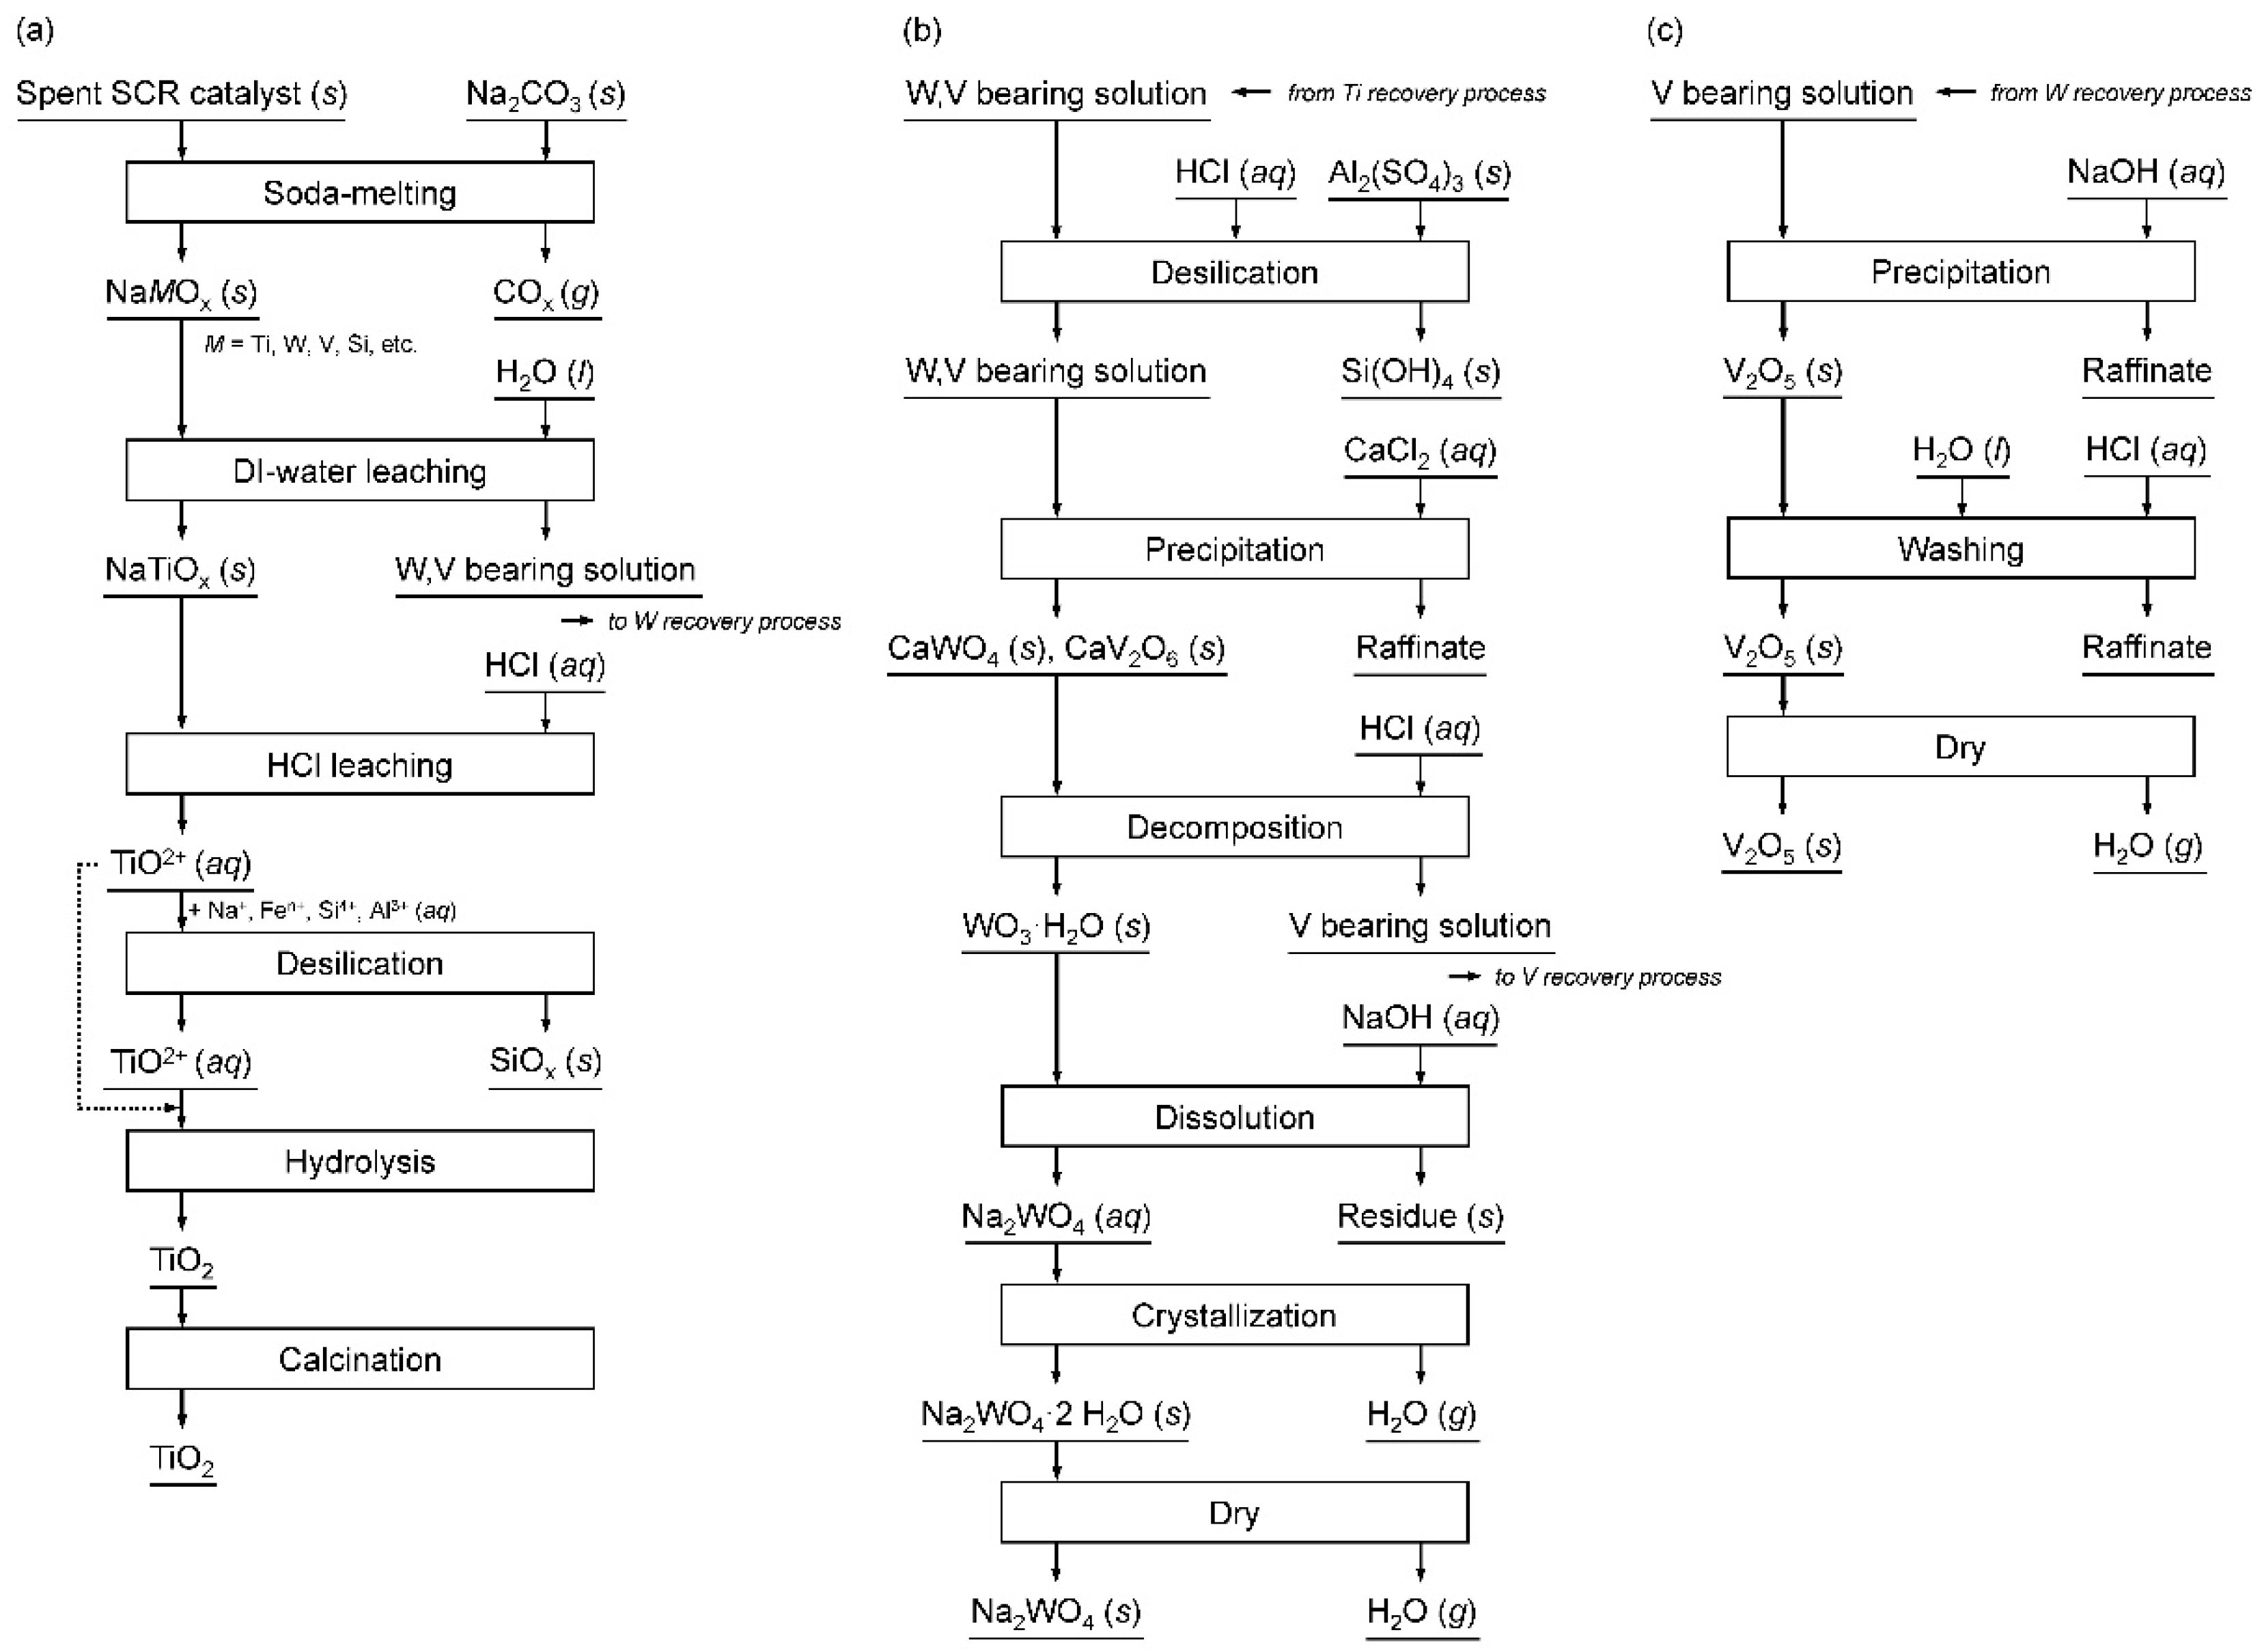
Figure 1a–c show the process flowchart for the spent SCR catalyst recycling process. This process aims to produce sodium tungstate (Na2WO4) with a purity of more than 99%, V2O5 with a purity of more than 98% [17] and TiO2 with a purity of more than 99% [18]. In this paper, the developed recycling process for the production of Na2WO4, V2O5 and TiO2 using the spent SCR catalyst feed will be discussed. When the recycling of a spent SCR catalyst is commercially carried out in South Korea, the decrease in environmental burdens and the increase in security of resources via the recovery of valuable elements are expected.

2. Results and Discussion

2.1. Recovery of W from a Spent SCR Catalyst

2.1.1. Soda-Melting of Spent SCR Catalyst Using Sodium Carbonate (Na2CO3)

Figure 2 shows the results of the X-ray Diffraction (XRD) analysis of a spent SCR catalyst used in this study. In addition, Table 1 shows the analytical results of the feedstock. As shown in Figure 2, anatase type of TiO2 was identified as the main phase and the other phases were not identified although the concentrations of silicon (Si) and W were high [6], as shown in Table 1.
Figure 3a shows the results of the XRD analysis of residues obtained after the soda-melting reactions at 1273 K. As shown in Figure 3a, sodium titanate, such as Na8Ti5O14 (Na16Ti10O28) and Na2WO4, were produced. When the decomposition of Na2CO3 at 1273 K proceeds owing to the decrease of sodium oxide (Na2O) activity or the vapor pressure of carbon dioxide (CO2), Na2O reacts with Ti and W in a spent SCR catalyst feed. In addition, Na2CO3 also directly reacts with Ti and W in the feedstock. However, when the results of the thermal decomposition of Na2CO3 in a mixture of spent SCR catalyst and Na2CO3 are considered, the dominant reaction is that between Na2CO3 and the spent SCR catalyst [19], as shown in Equation (1) [20] and Equation (2) [21]. In both cases, the total reactions for Ti and W with Na2CO3 are as follows.
10/8 TiO2 (s) + Na2CO3 (l) = 1/4 Na8Ti5O14 (l) + CO2 (g)
G°r, (1) = −80.0 kJ at 1273 K
WO3 (s) + Na2CO3 (l) = Na2WO4 (l) + CO2 (g)
G°r, (2) = −172.5 kJ at 1273 K
However, as shown in Figure 3a, other important sodium compounds, such as sodium vanadate, were not identified by the XRD analysis. The low concentration of V made it difficult to identify sodium vanadate. When the formation of V in the SCR catalyst is considered, V coexists with W as a two-dimensional amorphous layer on the surface of TiO2 [22]. Therefore, it is expected that V in a spent SCR catalyst also reacted with Na2CO3 because Na2WO4 was identified in the residues obtained after soda-melting.

2.1.2. Water Leaching of the Soda-Melted Product for the Recovery of W and V

Table 2 shows the leaching efficiencies of W and V when the water leaching of the soda-melted product with a range of below 210 μm was conducted at 353 K for 1 h under 50% of S/L ratio (w/v, weight of feed (kg) × 100/volume of solution (L)). As shown in Table 2, the average leaching efficiencies of W and V were 99.3% and 98.9%, respectively. In addition, when the water leaching of the soda-melted feed was repeated five times using scale-up equipment, the ranges of the leaching efficiencies of W and V were 98.9–99.9% and 98.5–99.2%, respectively. These results indicate that high leaching efficiencies of W and V can be reproducibly obtained.
Moon et al. reported that the leaching efficiencies were higher than 99.2% for both W and V, when water leaching was conducted at 303–373 K under 2–20% S/L ratio (w/v) using laboratory scale apparatus [13]. When the results obtained in this study and by Moon et al. are considered, it is expected that a high leaching efficiency larger than 98.9% for both W and V will be obtained by the water leaching of soda-melted feed at ≥353 K, even under 50% S/L ratio (w/v) using scale-up equipment. Therefore, the water leaching step is scalable.

2.1.3. Desilication of W and V Bearing Solution Obtained After Water Leaching

Table 3 shows the concentration change of Si in W and V bearing solution obtained after water leaching by the pH adjustment and following the addition of Al2(SO4)3. Table 4 shows the analytical result of the W and V bearing solution obtained after desilication.
Figure 4 shows the Pourbaix diagram of the Si-H2O system at 298.15 K [23]. As shown in Figure 4, in order to remove Si in the solution by polymerization of silica, it is necessary to decrease the pH of the solution to below the pH of the equilibrium corresponding to H4SiO4/H7SiO6. In addition, silica polymerization of monomer to oligomers and three-dimensional silica particles of 1–2 nm proceeds very rapidly, within a few minutes when the pH of the solution is above 7 [24]. Furthermore, according to the previous literatures on the solubility of silica depending on pH, Si in the alkaline solution is removed as silica with the lowest solubility by adjusting the pH of the solution to below 9 [25].
In this study, by considering the decrease in the consumption of the HCl solution and for the subsequent precipitation step using CaCl2, the pH of the leaching solution was adjusted from pH 13.1 to pH 9.0. As shown in Table 3, the initial concentration of Si in the leaching solution at pH 13.1 was 5197–5975 mg/L. However, when the pH of the leaching solution was adjusted to pH 9.0 using the HCl solution, the concentration of Si in the leaching solution was decreased to 122–204 mg/L.
Although the concentration of Si was decreased to 122–204 mg/L, it was difficult to completely remove Si from the solution for the duration of 1 h owing to the solubility of Si at pH 9. The residual Si in the solution can directly affect the final W product. Therefore, the complete removal of silica is important. In order to further remove Si from the leaching solution obtained after pH adjustment, Al2(SO4)3 was added to the solution. As a result, the concentration of Si decreased to below 1 mg/L, as shown in Table 3. Okamoto reported that a small amount of Al in the solution plays an important role in the removal of Si by the polymerization of silica, especially when the silica is colloidal [26]. In addition, when the pH of the solution was below 7 or 7–10 with the presence of salts in the solution, three-dimensional gel networks can be formed [24]. Therefore, it is expected that the presence of Al ion in the leaching solution by the addition of Al2(SO4)3 increased the polymerization rate of silica in the solution and resulted in the <1 mg/L concentration of Si.

2.1.4. Precipitation of W and V Using Calcium Chloride (CaCl2)

Table 5 shows the influence of the amount of CaCl2·2H2O (s) added in the W and V bearing solution obtained after the desilication on the efficiency of the precipitation of W and V. As shown in Table 5, when the mole ratio of Ca/(W + V) increased from 1.0 to 1.5, the efficiencies of precipitation of W and V was increased to 47.9% and 38.3%, respectively. In addition, when the mole ratio of Ca/(W + V) was 2.0–3.0, the efficiencies of W and V were larger than 98.8% and 97.4%, respectively. These results indicate that the mole ratio of Ca/(W + V) should be larger than 2.0 for the effective recovery of W and V.
Figure 5 shows the results of the XRD analysis of the precipitates obtained after the addition of CaCl2. As shown in Figure 5, CaWO4 was mainly identified. In addition, minor peaks of Ca3WO6 were also identified. These results indicate that the W in the solution was mainly precipitated through a reaction with CaCl2, as shown in Equation (3) [20].
Na2WO4 (aq) + CaCl2 (aq) = CaWO4 (s) + 2 NaCl (aq)
G°r, (3) = −31.8 kJ at 333 K
Although the precipitation of V was analyzed, as shown in Table 5, the V compound produced by precipitation using CaCl2 was not identified in Figure 5 owing to the low concentration of V. However, because the precipitation efficiency of V reached 97.4–97.9% when CaCl2 was added, it is expected that calcium vanadate compounds, such as Ca(VO3)2, were produced by the reaction between sodium vanadate and CaCl2 in the solution, as shown in Equation (4) [20].
2 NaVO3 (aq) + CaCl2 (aq) = Ca(VO3)2 (s) + 2 NaCl (aq)
G°r, (4) = −9.0 kJ at 333 K

2.1.5. Separation of W from V via Decomposition Using HCl Solution

For the separation of W from V in the precipitates obtained by using CaCl2, decomposition using HCl solution was conducted. In a highly acidic solution, W exists as tungstic acid (H2WO4) in solid form and V is dissolved, as shown in the Pourbaix diagrams of W-H2O and V-H2O systems [27].
Table 6 shows the influence of the amount of HCl solution used on the decomposition efficiency of W and the leaching efficiency of V. As shown in Table 6, when the mole ratio of W/2 HCl increased from 1.2 to 3.0, the decomposition efficiency of W was increased from 79.1% to 97.2% and the leaching efficiency of V was increased from 81.2% to >99.0%. These results indicate that a high separation ratio of W from V can be obtained when the mole ratio of W/2 HCl is 3.0.
Figure 6 shows the results of the XRD analysis of the residues obtained after decomposition using HCl solution. As expected from the Pourbaix diagram of W-H2O system [27], H2WO4 was identified because the reaction shown in Equation (5) [20] proceeded. In addition, Table 7 shows the analytical results of H2WO4 obtained after decomposition using HCl solution. As shown in Table 7, H2WO4 with a purity of 98.2% was produced. However, the complete separation of W from V was not carried out because the concentration of V2O5 was 0.43%.
CaWO4 (s) + 2 HCl (aq) = H2WO4 (s) + CaCl2 (aq)
G°r, (5) = −44.3 kJ at 333 K

2.1.6. Dissolution Using NaOH, Crystallization and Drying for the Production of Na2WO4

The final product of the recovery of W from a spent SCR catalyst is Na2WO4. The crystallization is not only to recover the W in solid Na2WO4 but also to increase its purity utilizing evaporation degree. For the production of Na2WO4, dissolution of H2WO4 using NaOH, shown in Equation (6) [20], was conducted at 353 K for 1 h. The leaching solution obtained after dissolution using NaOH was evaporated at 363 K under vacuum for crystallization. Afterward, the residues obtained by the crystallization were dried at 393 K. Figure 7 and Table 8 show the results of XRD analysis and analytical results of the residues obtained after drying, respectively. As shown in Figure 7 and Table 8, Na2WO4 with a purity of 99.3% was produced through the dissolution of H2WO4 using NaOH, crystallization and drying.
H2WO4 (s) + 2 NaOH (aq) = Na2WO4 (aq) + 2 H2O (l)
G°r, (6) = −97.1 kJ at 353 K

2.2. Recovery of V from a spent SCR catalyst

Precipitation, Washing and Drying for the Recovery of V as V2O5

As shown in the Pourbaix diagram of V-H2O system at 298.15 K, V can be precipitated as V2O5 when the range of pH is 0.82–4.44 with limited solubility of V ion [27]. When the equilibrium corresponding to V ion and V2O5 is considered, the pH for the lowest solubility of V that can be obtained is 1.96 [28]. These results indicate that the highest recovery efficiency of V from V bearing solution as V2O5 can occur at pH 1.96. It is worth noting that the concentration of V ion in the solution affects the pH for the highest recovery efficiency of V [28].
Table 9 and Figure 8 show the analytical results and the results of XRD analysis of the residues obtained after precipitation by NaOH, washing and drying, respectively. As shown in Table 9 and Figure 8, V2O5 with a purity of 99.3% was produced. The efficiency of precipitation of V reported was 97.5% in the previous study [29].

2.3. Recovery of Ti from a Spent SCR Catalyst

2.3.1. Preparation of Sodium Titanate Feed for HCl Leaching

Table 10 shows the analytical results of the spent SCR catalyst feed, residues obtained after soda-melting using Na2CO3 and residues obtained after water leaching. As explained in Section 2.1.1, Na8Ti5O14 (Na16Ti10O28) and Na2WO4 were produced by the soda-melting reactions, as shown in Figure 3b. When the water leaching of the soda-melted product was conducted at room temperature, the concentrations of W and V decreased from 4.39 mass % to 0.26 mass % and from 1.55 mass % to 0.01 mass %, respectively, because W and V are easily dissolved in highly basic solution. In addition, the concentration of Si was also decreased from 3.72 mass % to 2.27 mass % owing to high basicity of the solution.

2.3.2. HCl Leaching of Sodium Titanate for the Production of Titanyl Chloride (TiOCl2) Solution

When the HCl leaching of sodium titanate obtained after water leaching was conducted, TiOCl2 solution was produced by the reaction between the Ti in sodium titanate and HCl solution, as shown in Equation (7) [20]. The leaching efficiency of Ti in sodium titanate is strongly influenced by the leaching temperature, molarity of HCl solution and S/L ratio [13]. Moon et al. reported that 96.5–97.2% of leaching efficiency of Ti was obtained when the leaching experiments were conducted at 333 K for 3 h under 10% S/L ratio (w/v) [13]. In addition, the molarity of HCl solution used for HCl leaching should be larger than the critical molarity of HCl solution required for obtaining high leaching efficiency of Ti by retarding the hydrolysis of Ti ion in TiOCl2 solution at the HCl leaching temperature.
NaxTiO(x+4)/2 (s) + (x+2) HCl (aq) = TiOCl2 (aq) + x NaCl (aq) + (x+2)/2H2O (l) (x=2, 8/5, 2/3, 1/3)
G°r, (7, x=2) = −184.7 kJ at 333 K
G°r, (7, x=8/5) = −110.1 kJ at 333 K
G°r, (7, x=2/3) = −37.1 kJ at 333 K
G°r, (7, x=1/3) = −8.91 kJ at 333 K
Table 11 shows the experimental conditions and analytical results of the leaching solution obtained after leaching experiments using 7–8 M HCl solution at 333 K for 3 h under 20% S/L ratio (w/v). The molarity of HCl solution used in this study was determined by the results of the preliminary experiments. In the preliminary experiments, a sample leaching efficiency of 97.4% weight basis was obtained when the leaching of sodium titanate was conducted using 6 M HCl solution at 333 K for 3 h under 20% S/L ratio (w/v).
In this study, when the HCl leaching was conducted using 7 and 8 M HCl solutions, the leaching efficiencies of Ti were 73.5% and 74.6%, respectively, based on the concentration of Ti in the leaching solution obtained. Unfortunately, the leaching efficiency of Ti on the basis of the weight of the residues was not obtained because all the leaching solution including the residues was used as a feedstock for the desilication step. However, it is expected that a high leaching efficiency of Ti greater than 95% can be obtained by optimizing the molarity of the HCl solution and the S/L ratio.
Table 11 also shows the results of HCl leaching of sodium titanate using scale-up equipment. In the scale-up experiments, the residues obtained after water leaching and following filtration and before drying were used as a feedstock. When the HCl leaching was conducted using 11.5 M HCl solution at 333 K for 3 h under 50% S/L ratio (w/v), leaching efficiency of Ti reached 97.9%. It is worth noting that the concentration of Si in the TiOCl2 solution obtained after HCl leaching was 80 mg/L. These analytical results are much smaller than the concentration of Si in the leaching solutions in Exp. nos. 180727 and 180730 in Table 11.
Moon et al. reported that the leaching efficiency of Si was increased to a certain value and then decreased when the acidity of the HCl solution used for HCl leaching of sodium titanate at 333 K was increased from 2 M to 7 M [13]. This is because the polymerization of silica in TiOCl2 solution occurred rapidly when the molarity of the HCl solution used was increased. As a result, the silica particles of sizes larger than the filter pore size remained in the residues. Therefore, in this study, the low concentration of Si in the TiOCl2 solution was obtained because the polymerization of silica was expected to proceed rapidly when the HCl leaching was conducted using 11.5 M HCl solution at 333 K for 3 h under 50% S/L ratio (w/v). Furthermore, depending on the concentration of Si in TiOCl2 solution, the following desilication step is not required, as shown in Figure 1a.

2.3.3. Desilication of TiOCl2 Solution Obtained After HCl Leaching

Table 12 shows the experimental conditions and analytical results of TiOCl2 solutions obtained after desilication. When the desilication of a highly acidic solution is considered, acidity of solution, presence of salts in solution, desilication temperature and the desilication time affect the efficiency of Si removal from the solution [14,30]. This is because these parameters affect the polymerization of silica in an acidic solution. As shown in Table 11, there are no large differences in the concentrations of Ti and other elements of impurities such as W, V, Al, Fe, Ca in TiOCl2 solutions obtained by 7 M and 8 M HCl solutions used for HCl leaching. In addition, the difference between the concentrations of Na in the TiOCl2 solution is 6200 mg/L. In this case, the acidity of TiOCl2 solution is the most important variable that affects the desilication. Therefore, it is expected that the desilication of TiOCl2 solution obtained by using the 8 M HCl solution for HCl leaching proceeds faster than the use of the 7 M HCl solution.
After the desilication of TiOCl2 solutions, as shown in Table 12, the concentration of Si in the TiOCl2 solution decreased to 116 mg/L and 29 mg/L when 7 M and 8 M HCl solutions were used for HCl leaching, respectively. When the molarity of HCl solution used for leaching was increased, the concentration of Si in the purified TiOCl2 solution was decreased. This is because the polymerization of silica in an acidic TiOCl2 solution proceeded rapidly when the acidity of TiOCl2 solution was increased [14,30].
In addition, when the concentrations of Ti in TiOCl2 solution feeds in Table 11 and purified TiOCl2 solution obtained after desilication in Table 12 are compared, the concentration change of Ti in TiOCl2 solutions did not occur. These results indicate that there is no loss of Ti ion by hydrolysis of Ti ion in TiOCl2 solutions during desilication. Therefore, the acidity of the TiOCl2 solution and the temperature for the preservation of the TiOCl2 solution in these experiments are appropriate for retarding the hydrolysis of Ti ion in TiOCl2 solution.

2.3.4. Hydrolysis and Calcination of Purified TiOCl2 Solution

Hydrolysis of the purified TiOCl2 solutions was conducted at 363 K for 5 h. Table 13 shows the experimental conditions and analytical results of TiO2 obtained after hydrolysis. When the purified TiOCl2 solutions obtained using the 7 M and 8 M HCl solutions underwent hydrolysis, the concentrations of Ti in TiOCl2 solutions decreased from 54,800 mg/L to 2730 mg/L and 52,600 mg/L to 1030 mg/L, respectively. When it is assumed that the volume of the solution was constant before and after the hydrolysis, the efficiencies of hydrolysis were 95.0% and 98.0% when the 7 M and 8 M HCl solutions were used for HCl leaching, respectively. In addition, when the hydrolysis of TiOCl2 obtained after HCl leaching using 11.5 M HCl solution without desilication was conducted using scale-up equipment at 353 K for 3 h, the concentration of Ti in TiOCl2 solution decreased from 110,500 mg/L to 1801 mg/L. As a result, the efficiency of hydrolysis reached 98.4%.
As shown in Table 13, TiO2 with a purity of 99.4–99.6% was obtained. The main impurities of the TiO2 product were W, Fe and Si. It is worth noting that a small amount of W exists in TiOCl2 solution, as shown in Table 11 and Table 12, although the TiOCl2 solution is a highly acidic solution. As shown in the Pourbaix diagram of the W-H2O system [27], H2WO4 in solid form is stable at low pH. These results indicate that WO3 was analyzed in the TiO2 product because the W dissolved in the purified TiOCl2 solution owing to the fact that the solubility of W in the acidic solution was hydrolyzed [31].
In addition, Figure 9 shows that the rutile type of TiO2 was obtained after hydrolysis at 353–363 K without calcination. In addition, Figure 10 shows the images of TiO2 obtained after hydrolysis at 363 K. The total reaction for the production of TiO2 from purified TiOCl2 solution is shown in Equation (8) [20]. When the TiO2 pigment is produced by the sulfate process, the anatase type of TiO2 is produced [32]. In addition, Middlemas et al. reported that the anatase type of TiO2 was produced even when the TiO2 obtained after hydrolysis at 298–353 K was calcined at 923 K for 2 h [15]. However, in this study, the rutile type of TiO2 with the size range of the primary particles under 2 μm was directly produced by the hydrolysis at 353–363 K. The detailed reason for this is under investigation.
TiOCl2 (aq) + H2O (l) = TiO2 (s) + 2 HCl (aq)
G°r, (8) = −17.6 kJ at 353 K
G°r, (8) = −18.9 kJ at 363 K

3. Materials and Methods

3.1. Recovery of W from a Spent SCR Catalyst

3.1.1. Spent SCR Catalyst Feedstock

Table 1 lists the analytical results of a spent SCR catalyst (V2O5-WO3/TiO2 catalyst, honeycomb type) used. Feedstock was supplied by Samcheonpo thermoelectric power plant (coal-fired), South Korea. Before the pulverization of the feedstock, attached and pore plugged ashes and dusts were removed. Afterwards, the feedstock was pulverized by jaw crushing and mill grinding. The particle size distribution of the pulverized feedstock was determined as mainly ranging from 1 to 100 μm using a particle size analyzer (Mastersizer2000, Malvern Instruments, Westborough, MA, USA). Pulverized feedstock was dried at 353 K in an air oven over 24 h to remove residual moisture. After the drying, the weight of the feedstock was reduced to 95.5%.

3.1.2. Soda-Melting

Figure 11a,b shows the photographs of pilot-scale plant and the furnace used for the continuous soda-melting reactions, respectively. Na2CO3 (99.8%, Kanto Chemicals Co., Inc., Tokyo, Japan) was used for the soda-melting reactions. The mixing ratio of the spent SCR catalyst and Na2CO3 was 1:1.2 by weight (mole ratio of MOx/(MOx + Na2O) = 0.5, where M = Ti, Si, W and V). The mixture was supplied to an Inconel crucible in the soda-melting furnace. The temperature of the soda-melting reactions was set up to 1273 K. The soda-melting furnace featured by continuous production of the soda-melt. The soda-melt produced from the furnace was cooled and was ground using a pin mill before the water leaching. Particle size distribution of the pulverized soda-melted product ranged mainly from 1 to 200 μm.

3.1.3. Water Leaching

Figure 11c shows the photograph of the reactor used for water leaching, desilication and precipitation using CaCl2. Water (DI water) leaching of the soda-melted product was conducted at 353 K for 1 h under 50% S/L ratio (w/v) with stirring at 350 rpm. The capacity of scale-up equipment used for water leaching was 300 kg·soda-melted product/batch. The temperature of DI water was increased to 353 K in advance and the soda-melted product was supplied. During water leaching, vaporized water was collected using a water-cooled condenser. Water leaching slurry was filtrated and separated into solution and residues by vacuum filtration. After the solid-liquid separation, the residues were washed using water at room temperature for 0.5 h under 100% S/L ratio (w/v) while stirring at 350 rpm. Afterward, the solution was filtrated and mixed with the leaching solution. During further processing, the mixed solution (leaching solution + washing solution) was used as feed solution.

3.1.4. Desilication

To remove Si in the W and V bearing solution of pH 13.1 obtained by water leaching through the adjustment of the feed solution pH to pH 9, 35% HCl solution (Junsei Chemicals, Tokyo, Japan) was used. After the desilication by utilizing the pH adjustment, hydrated (15–18·H2O) Al2(SO4)3 (Junsei Chemicals, Japan) was added to remove the residual Si in the solution. The hydration number of Al2(SO4)3 was considered to be 18 in this experiment. The desilication was carried out at room temperature. The solution obtained after desilication was filtered by vacuum filtration.

3.1.5. Precipitation Using CaCl2

Before the precipitation of W and V using CaCl2 from W and V bearing solution obtained after desilication, the pH of the solution was adjusted to 10 using sodium hydroxide (NaOH) (s). CaCl2∙2H2O (Junsei Chemicals, Japan) was used as an agent for the precipitation of W and V in the solution feed. Precipitation using CaCl2∙2H2O (s) was carried out at 333 K for 1 h while stirring at 350 rpm. The amount of CaCl2∙2H2O (s) used was determined by considering the mole ratio of Ca/(W + V) from 1.0 to 3.0. After the precipitation, precipitates were obtained by vacuum filtration.

3.1.6. Decomposition Using HCl solution for the Separation of W from V

Figure 11d shows the photograph of a glass-lined reactor for preparation of H2WO4. 35% HCl solution was used and the amount of HCl solution required was determined by considering mole ratio of W/(2 HCl) from 1.2 to 3.0. The temperature of 35% HCl solution in the double jacket glass reactor was increased up to 333 K by a bath circulator in advance. Afterwards, the precipitates obtained by precipitation using CaCl2 were added into the HCl solution. During the decomposition reactions, the vaporized water and the HCl solution were collected using a water-cooled condenser. After the decomposition reactions, the residues and the solution were separated by vacuum filtration. The cake type residues obtained were rinsed using a 5% HCl solution during the vacuum filtration.

3.1.7. Production of Na2WO4 through Dissolution Using NaOH, Crystallization and Drying

H2WO4 obtained after decomposition using HCl solution was dissolved for preparation of the Na2WO4 solution. NaOH (s, 98%, Junsei Chemicals, Japan) was used. Dissolution of H2WO4 was conducted at 353 K for 1 h with stirring at 350 rpm with the addition of NaOH (mole ratio of 2 Na/W = 1.2). The temperature of NaOH solution was increased to 353 K before H2WO4 was added. During the dissolution reactions, vaporized water was collected by a water-cooled condenser. After the dissolution, Na2WO4 solution was filtered by vacuum filtration.
Na2WO4 solution (Conc., 255 g/L as W) obtained from the dissolution of H2WO4 was used as stock solution. Na2WO4 crystal was recovered by vacuum evaporation using the evaporation apparatus (Rotavapor®, R-100, BÜCHI, Flawil, Switzerland). Crystallization proceeded as follows: evaporation degree, 70%; temperature, 363 K; atmospheric pressure, 0.6 atm. After crystallization, Na2WO4 crystal was filtered by vacuum filtration. Na2WO4 cake obtained was washed using anhydrous ethanol at room temperature for 0.5 h under 20% S/L ratio (w/v) with stirring at 350 rpm and dried at 393 K for 3 h.

3.2. Recovery of V from a Spent SCR Catalyst

Precipitation, Washing and Drying for the Recovery of V as V2O5

V bearing solution produced from the decomposition using the HCl solution was used as stock solution for the recovery of V. pH adjustment to increase the pH to 2 was conducted using NaOH (s). Precipitation was conducted at 323 K for 1 h. When precipitation was completed, the precipitate was filtered by vacuum filtration. V2O5 cake obtained was washed using the HCl solution having pH 2 at room temperature for 0.5 h under 20% S/L ratio (w/v), trice.

3.3. Recovery of Ti from a Spent SCR Catalyst

3.3.1. Preparation of Sodium Titanate Feed for HCl Leaching

The sample of the spent SCR catalyst used in this study was provided from a combined heat-and-power plant in Incheon, South Korea (see Table 10). Before soda-melting reactions, the dust inside the spent catalyst was blown out using air and pulverization was carried out.
The spent SCR catalyst was mixed with Na2CO3 (purity: 99.0%) in advance by 120% weight ratio of Na2CO3 to the spent catalyst. The mixture was placed in an Inconel reactor and the reaction temperature was increased to 1273 K. Soda-melting reactions were carried out at 1273 K for 1 h under atmospheric conditions. In addition, the soda-melt in the reactor was stirred using an impeller during soda-melting.
Water leaching of the residues obtained after the soda-melting step was conducted using DI water at 298 K under 20% S/L ratio (w/v) while stirring at 350 rpm for 3 h. 13 kg of the residues obtained after soda-melting with a range of below 300 μm was used as a feedstock for DI water leaching. The solution obtained after DI water leaching was filtered using a filter paper (pore size: 1–2 μm). The residues were washed at 298 K under 20% S/L ratio (w/v) for 3 h, then filtration was conducted. The washing and filtration were conducted six times. After the final filtration was carried out, the residues were dried at 378 K using air oven.

3.3.2. HCl Leaching of Sodium Titanate

Figure 12 shows the schematic and photograph of the experimental apparatus used for HCl leaching of sodium titanate obtained after DI water leaching. HCl leaching experiments were conducted at 333 K using 7–8 M HCl solution under 20% S/L ratio (w/v) for 3 h (see Table 11). In addition, the solution was stirred at 200 rpm during HCl leaching.
The HCl solution was supplied into the gas-tight reactor using a condenser to prevent the evaporation of the solution and the temperature of the solution was increased to 333 K in advance by using a mantle heater, as shown in Figure 12. When the reaction temperature was reached, sodium titanate feed was supplied into the reactor for 2 h. This is because the temperature was increased by the heat generated by neutralization when the feedstock was supplied abruptly.
After the HCl leaching was finished, all the liquor except the 200 mL sampled for analysis was used as a feedstock for desilication. Centrifugation of the sampled solution was conducted at 4000 rpm for 10 min and the liquid was obtained using filter paper. The residues were rinsed twice ultrasonically using DI water. After the centrifugation of the sample was carried out at 4000 rpm for 10 min, the solid was obtained using a filter unit (pore size: 0.2 μm). The residues were dried at 378 K using an air oven.

3.3.3. Desilication of TiOCl2 Solution Obtained after HCl Leaching

The TiOCl2 solution obtained after HCl leaching without filtration was placed into a glass bottle for desilication. The bottles were placed inside an air oven and the temperature was increased to 313 K. The bottles were sufficiently preserved at 313 K for 5–11 days. When desilication was completed, the TiOCl2 solution was centrifuged at 4000 rpm for 10 min and filtration (pore size: 0.2 μm) was conducted to obtain purified TiOCl2 solution.

3.3.4. Hydrolysis of Purified TiOCl2 Solution

Before the hydrolysis of the purified TiOCl2 solutions, dissolution of the NaOH pellet was conducted to decrease the acidity of the HCl solution. 1 and 2 M solutions of NaOH were used for TiOCl2 solutions obtained by using 7 and 8 M HCl solution for HCl leaching, respectively. Hydrolysis of the TiOCl2 solution was conducted using a double-jacketed reactor at 363 K for 5 h with an impeller running at 300 rpm. A condenser was used for the prevention of the evaporation of the reactor contents. When the hydrolysis was finished, centrifugation was conducted at 4000 rpm for 10 min for the solid-liquid separation. The liquid obtained after the centrifugation was filtered (pore size: 0.20 μm). In addition, the residue was rinsed thrice using the 5 M HCl solution and five times using DI water at room temperature. Afterward, the residue was dried at 378 K using an air oven.

4. Conclusions

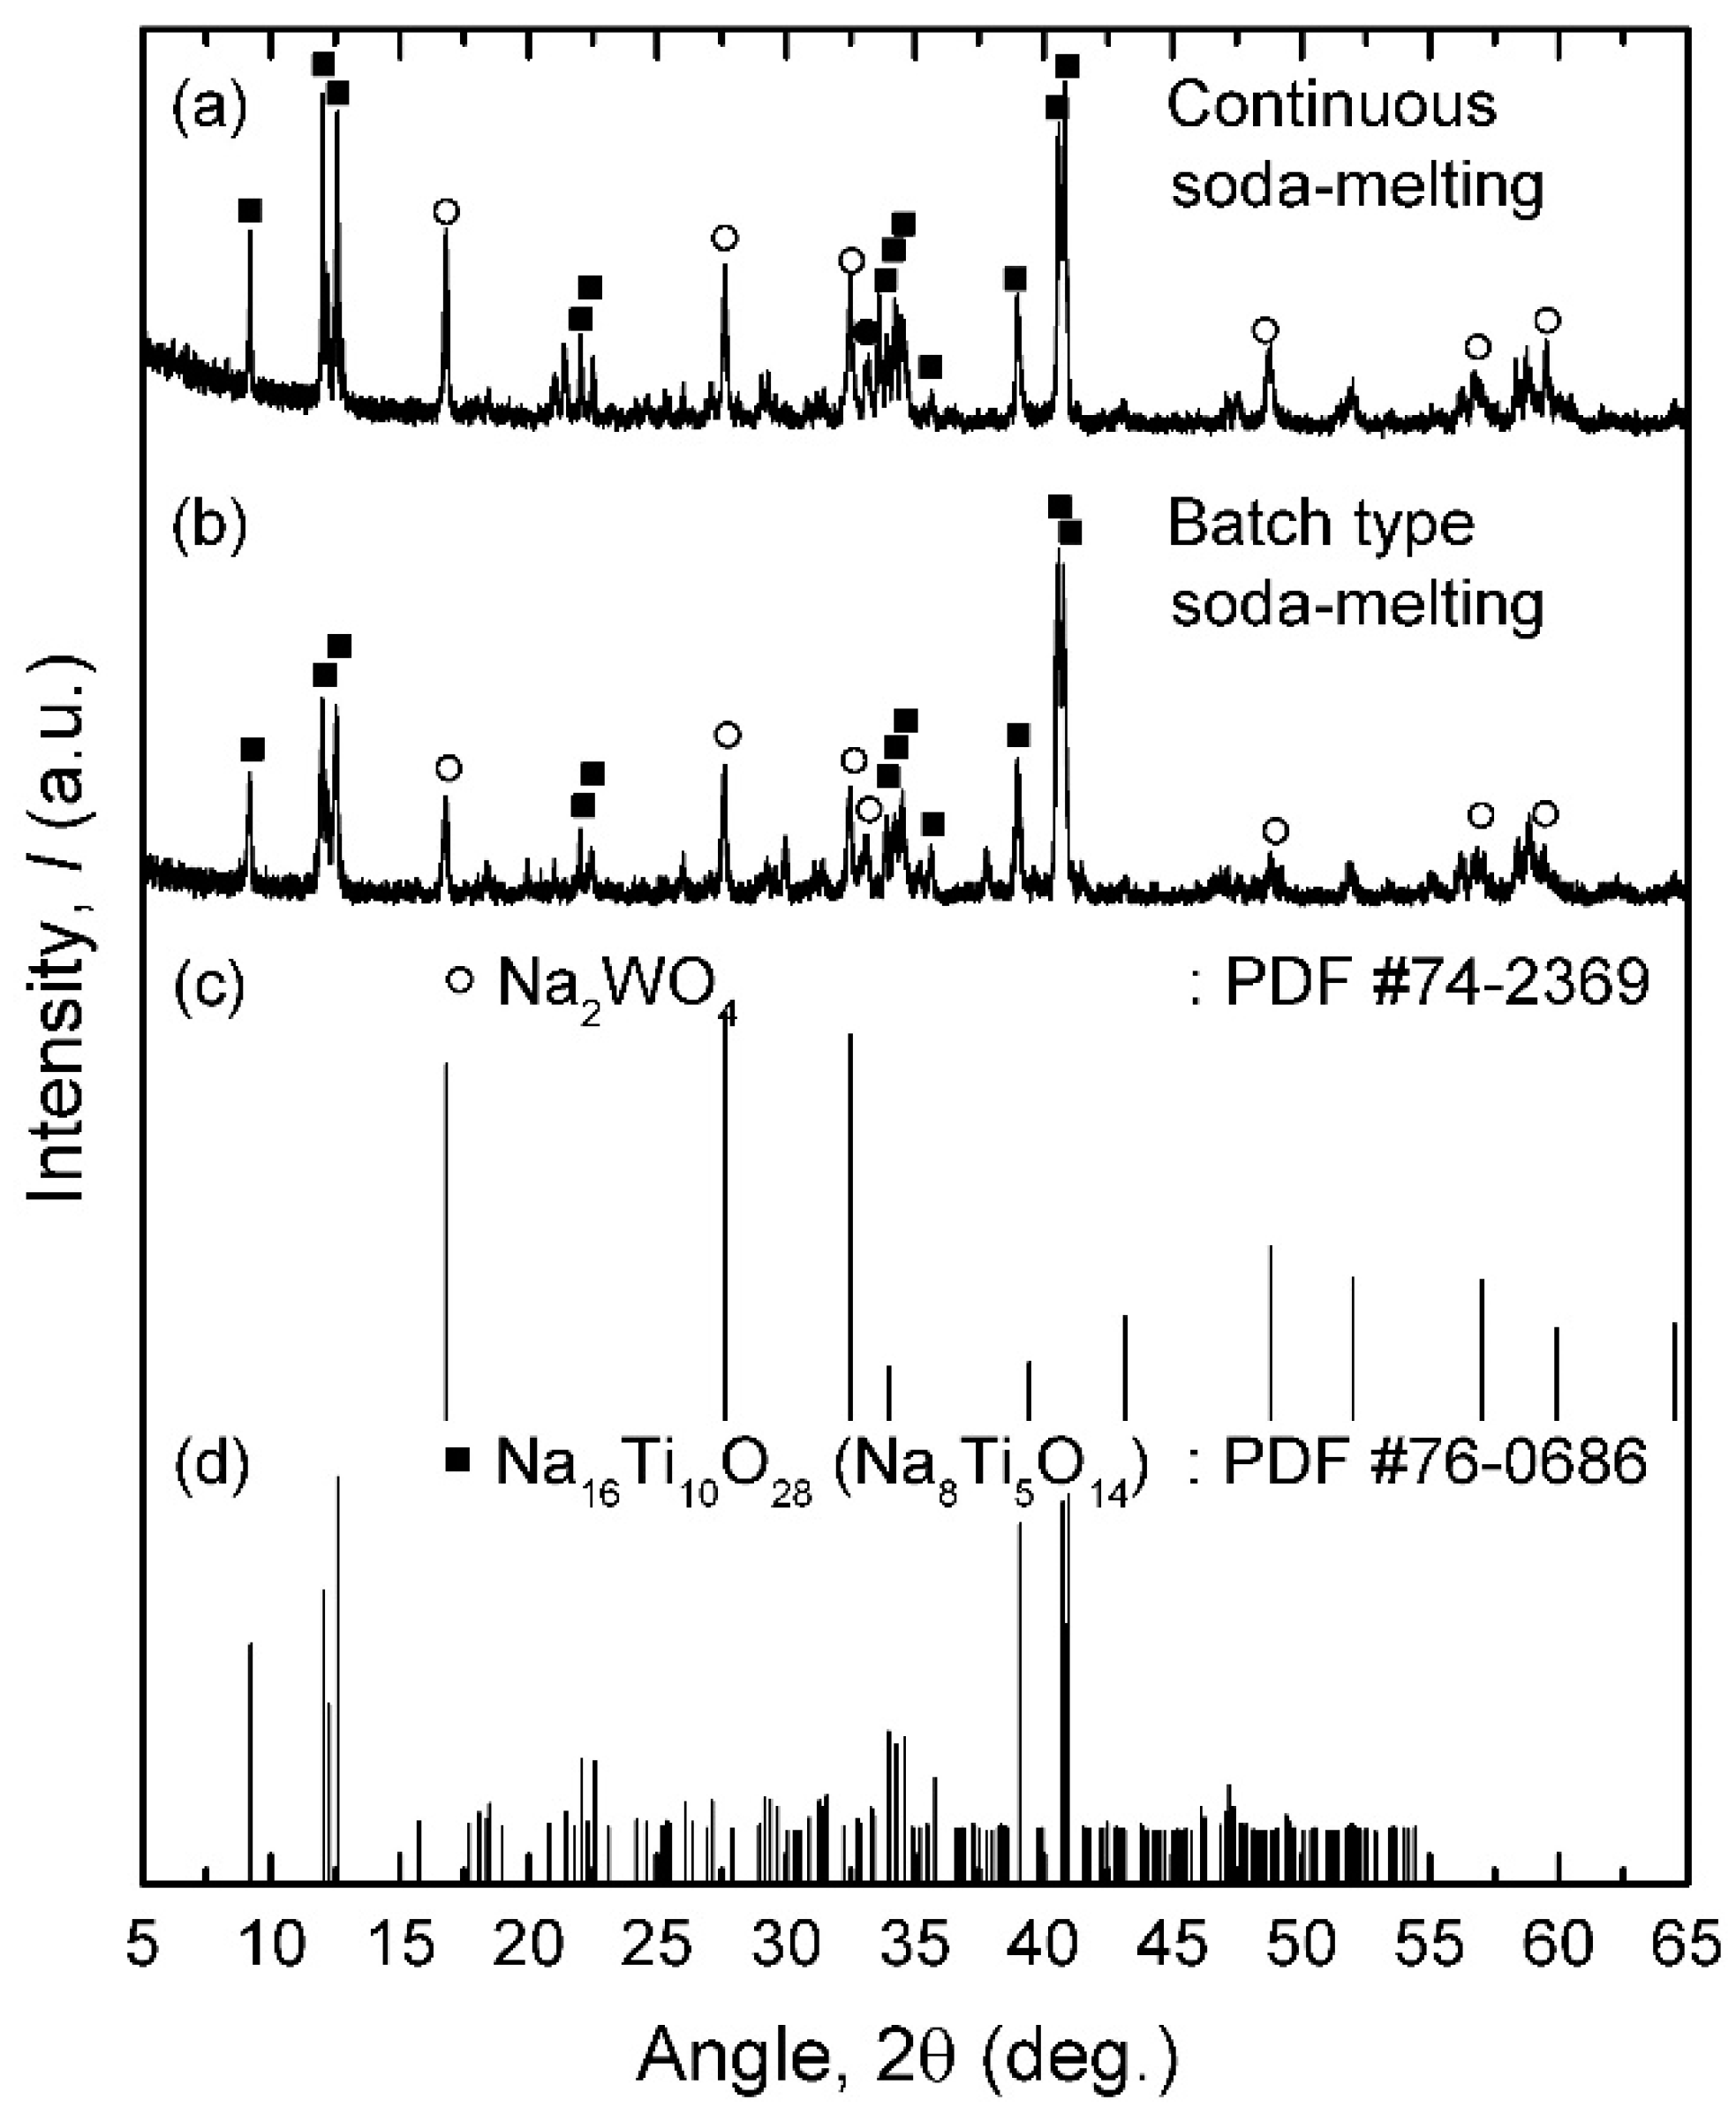
In order to recover valuable elements such as W, V and Ti from a spent SCR catalyst, the effective process was developed by the combination of soda-melting and hydrometallurgical treatments. Through the soda-melting of a spent SCR catalyst at 1273 K and water leaching at 353 K, W and V were separated from Ti.
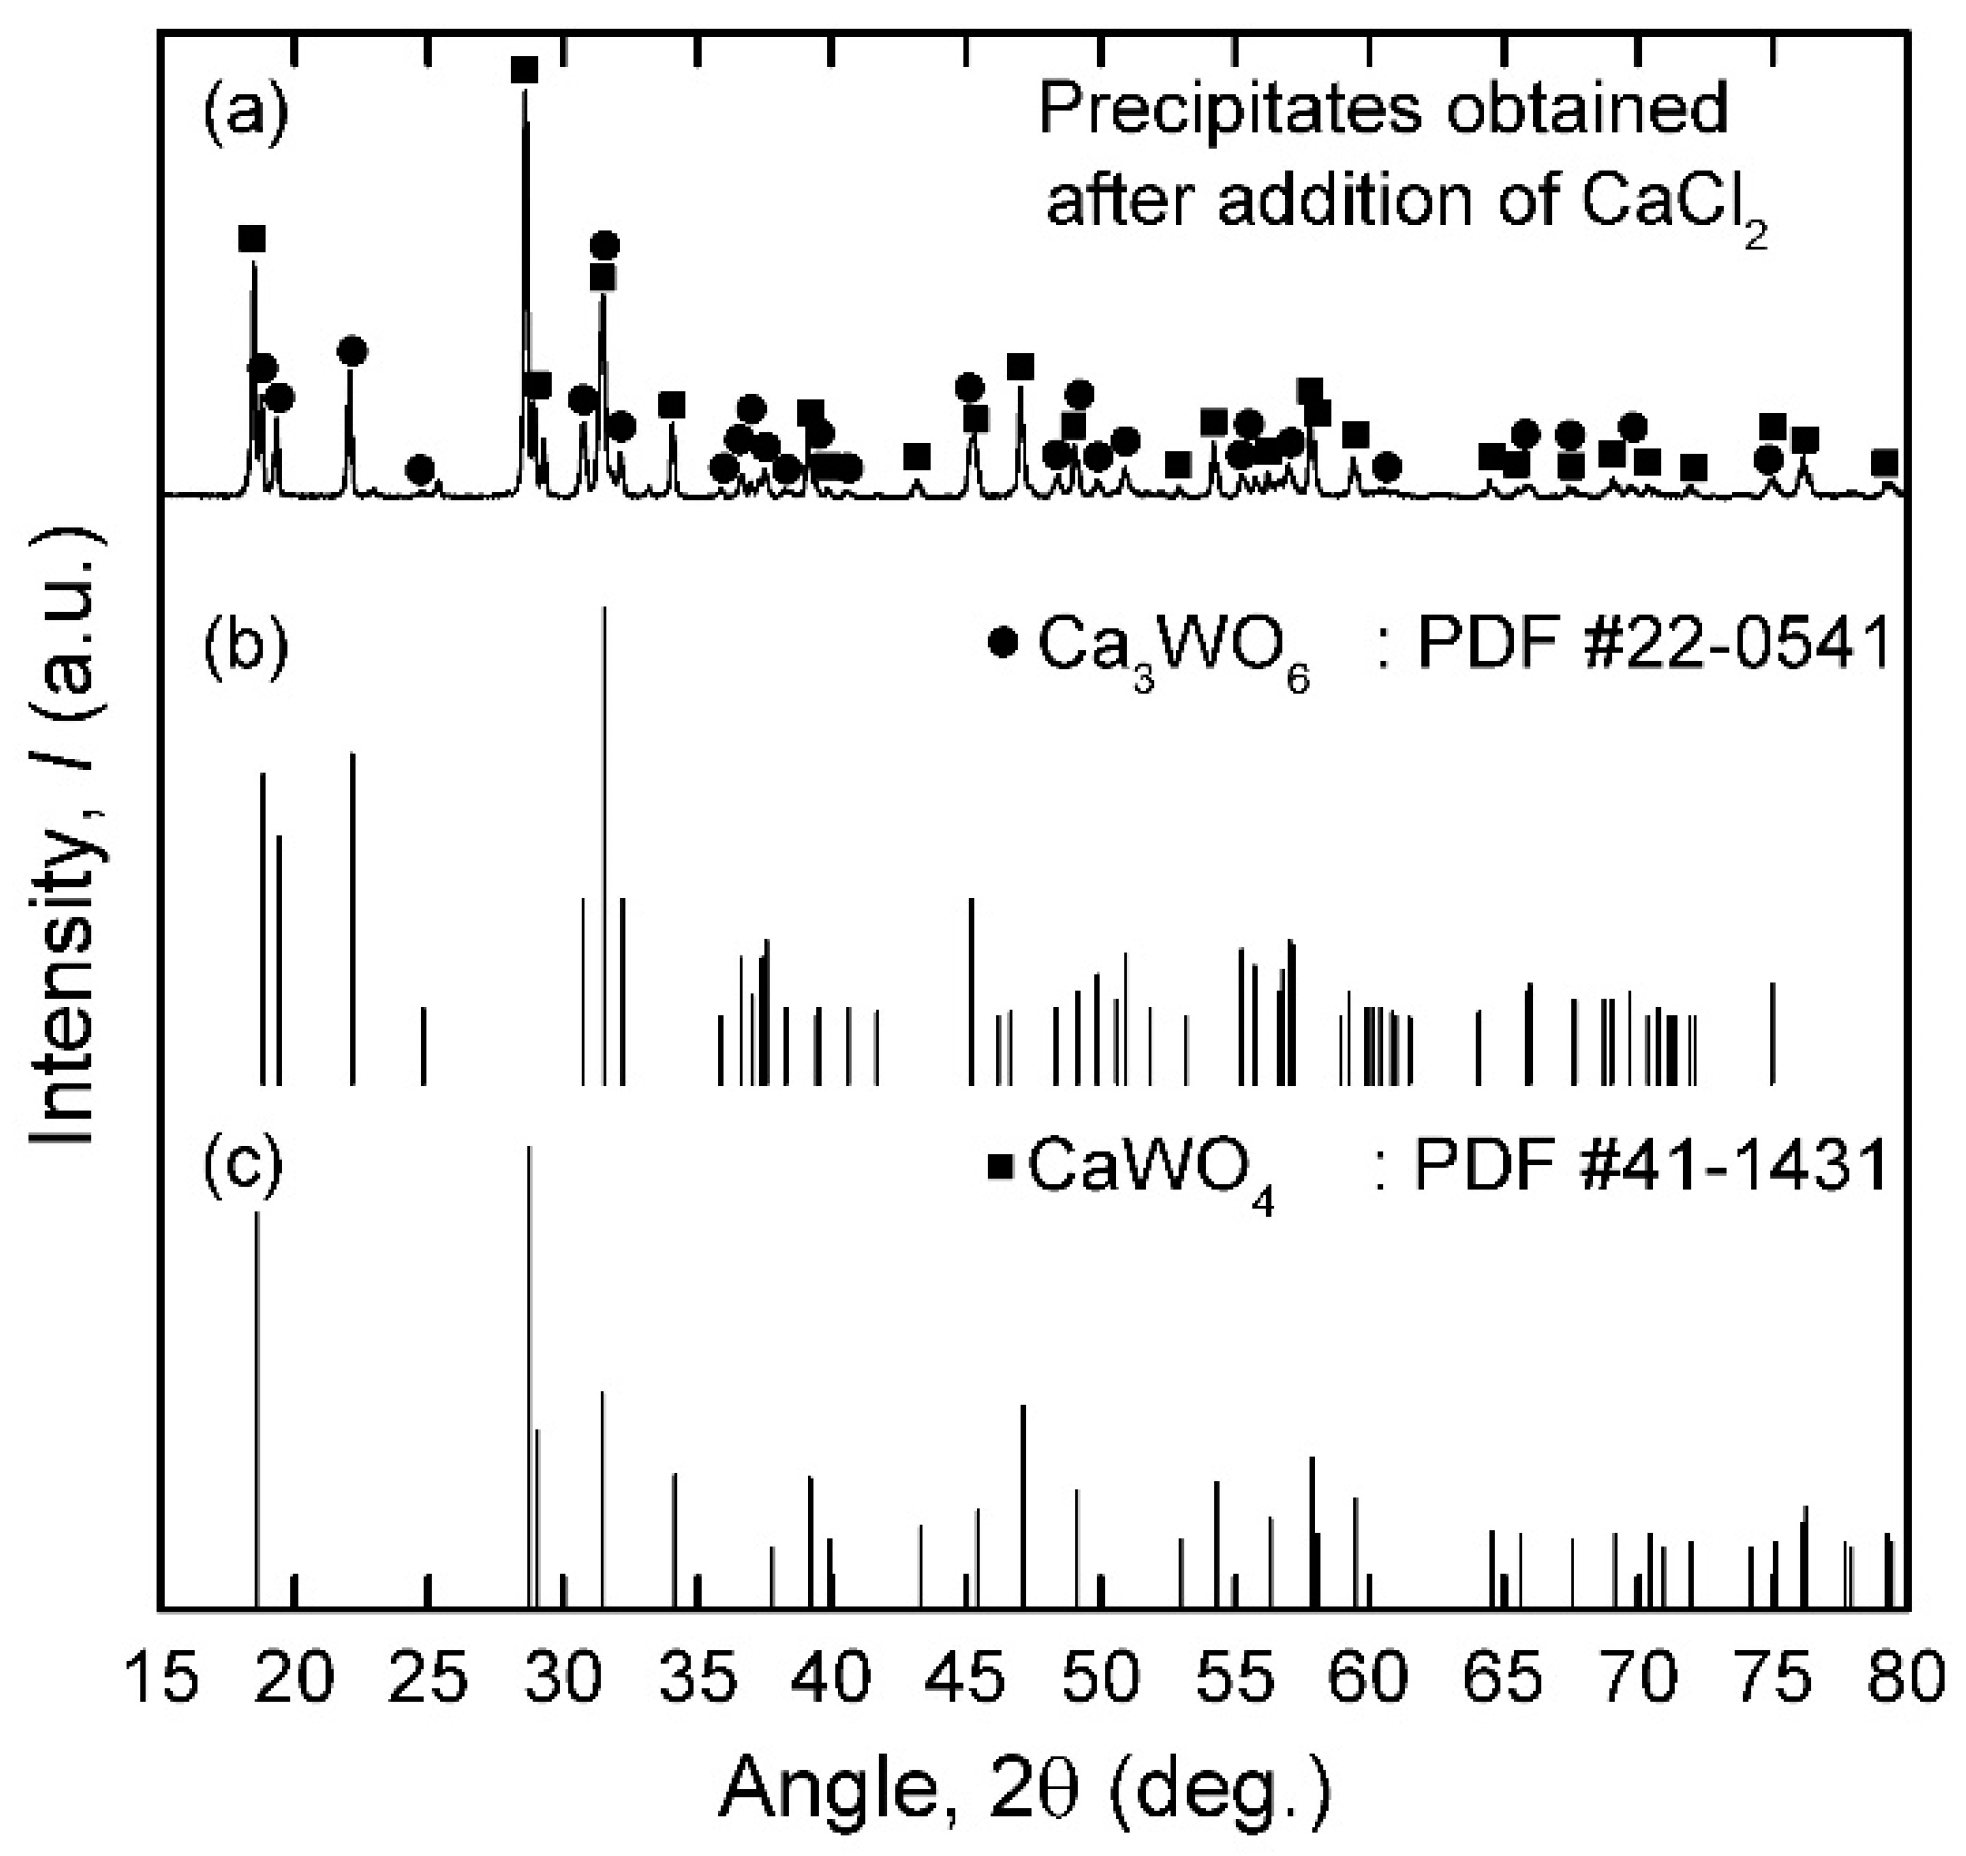
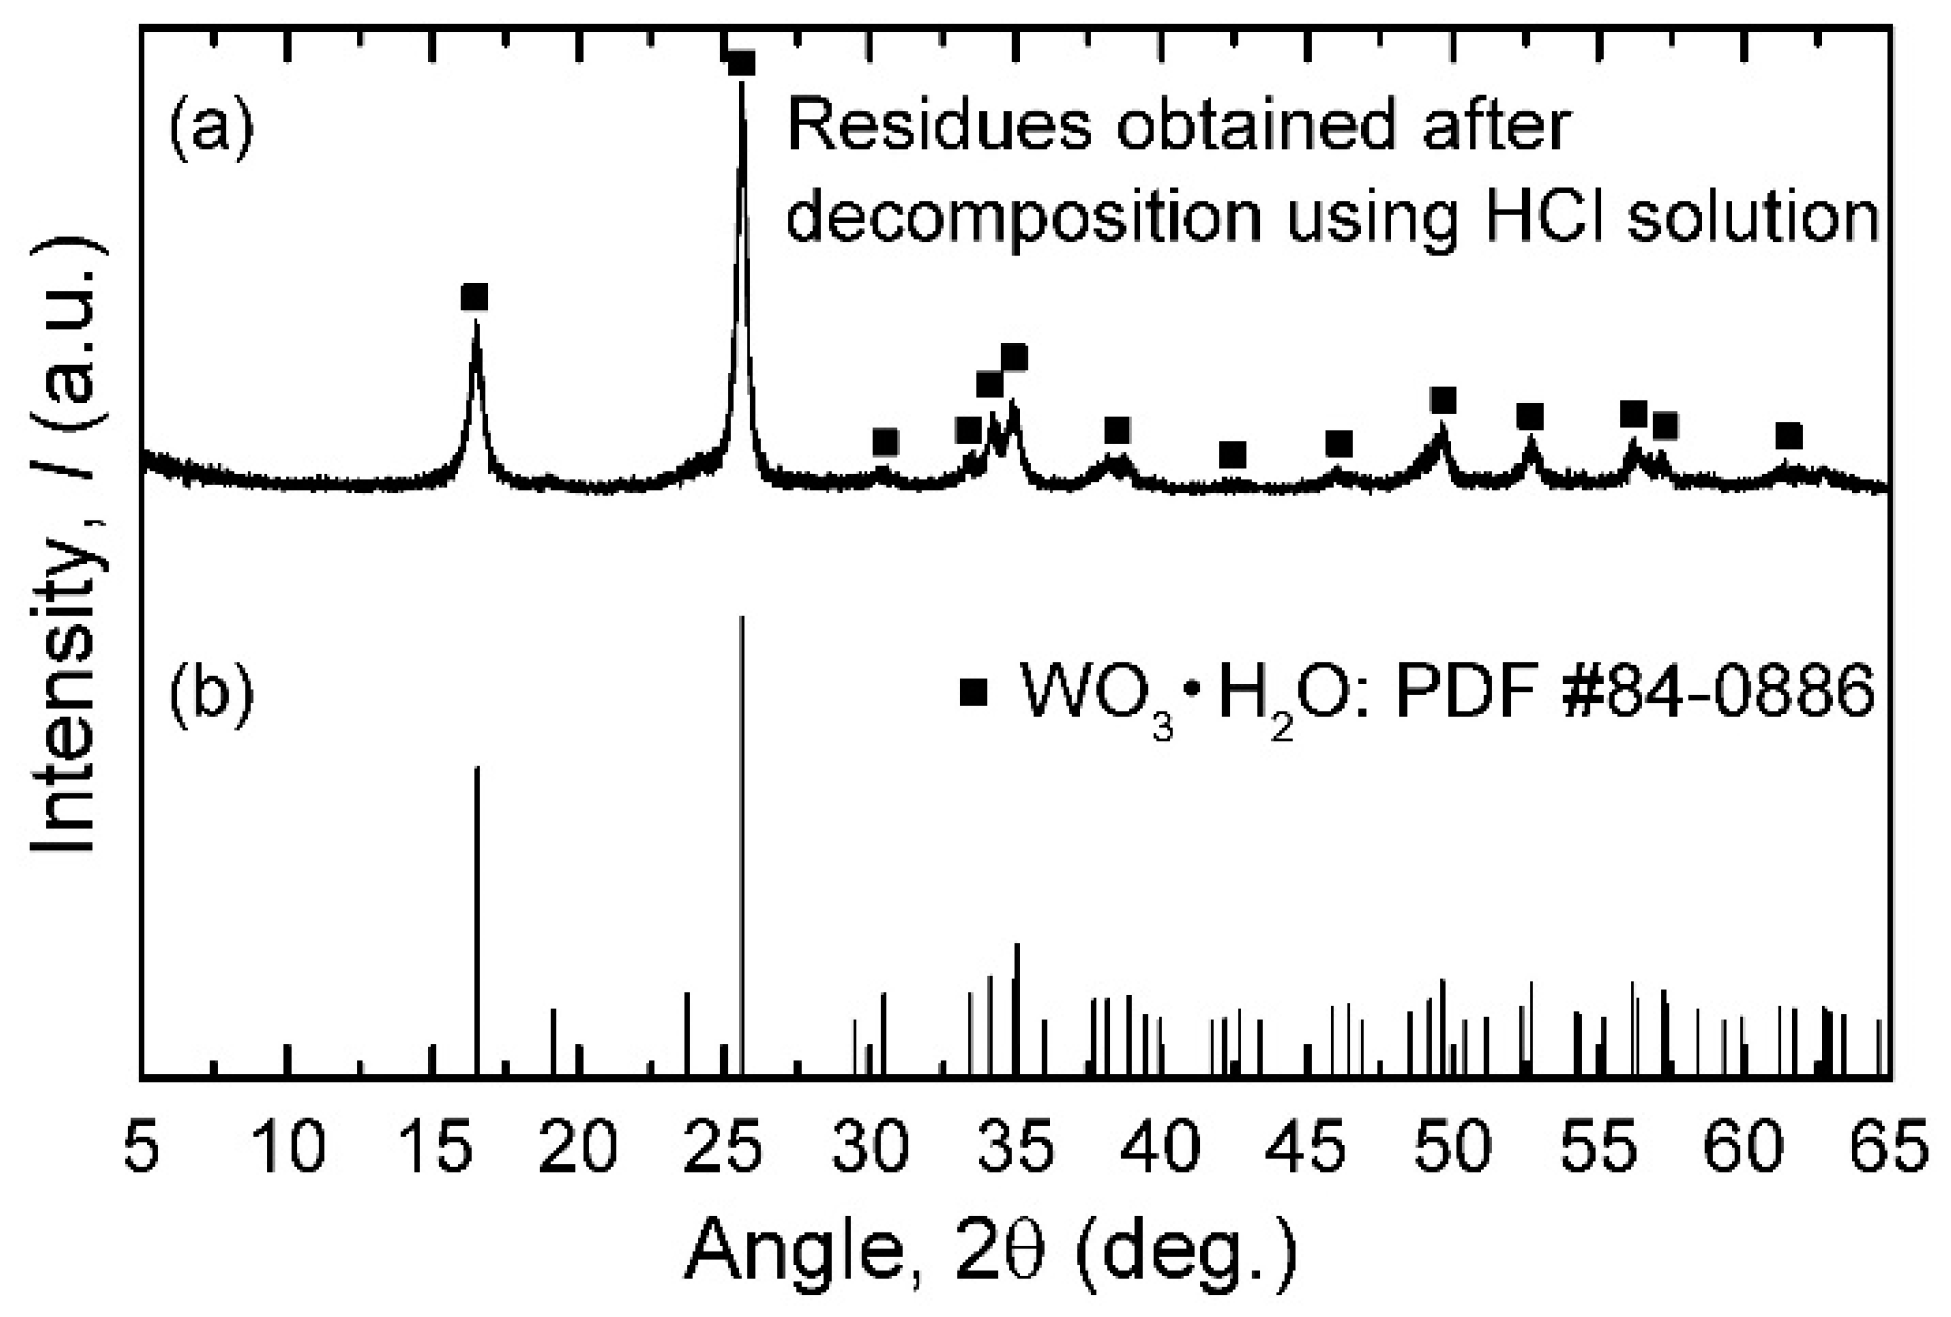
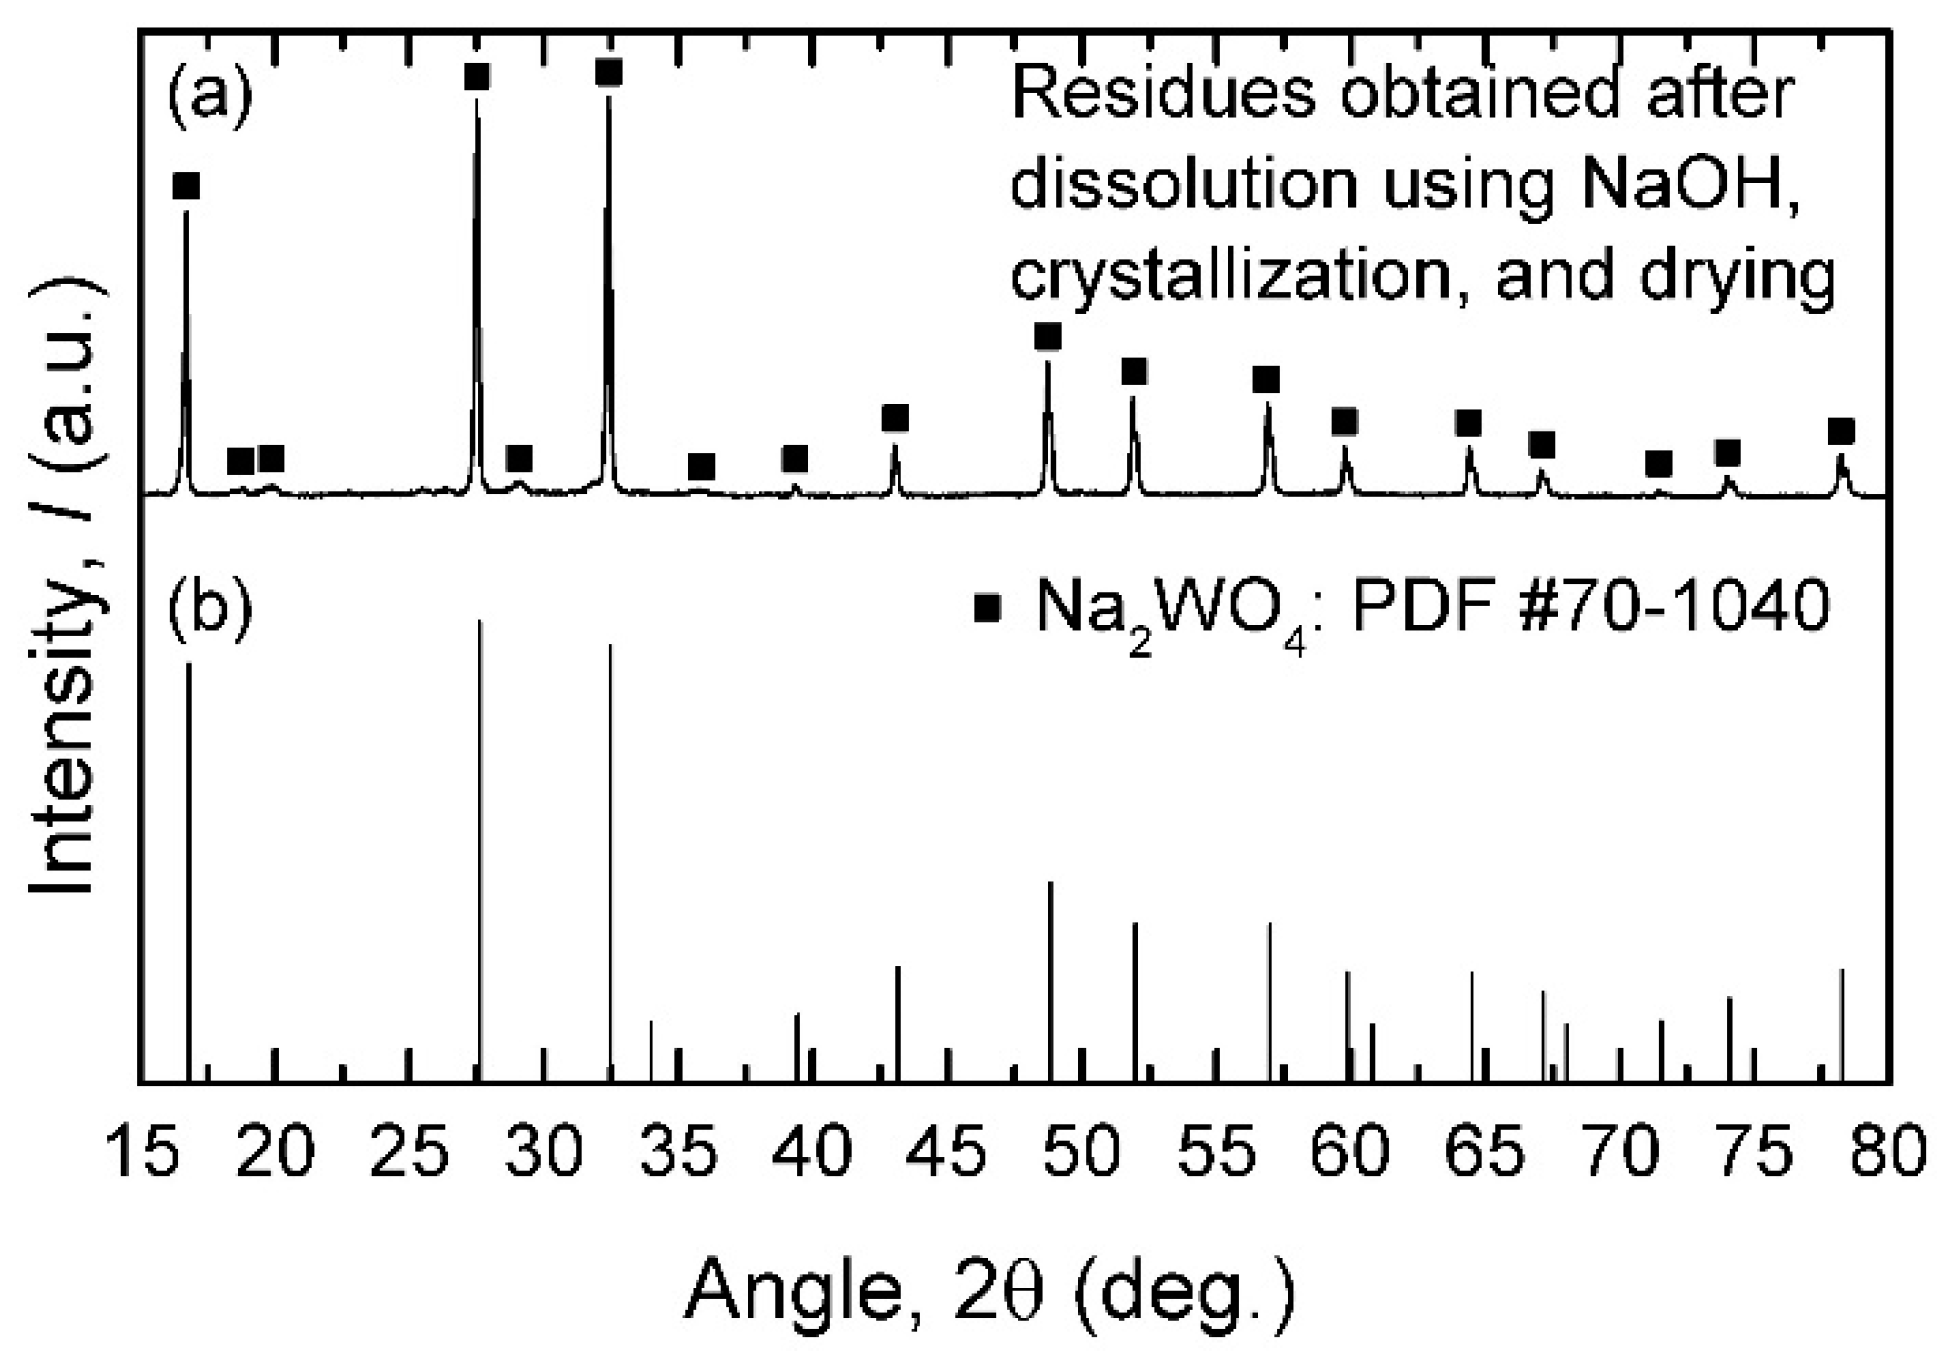
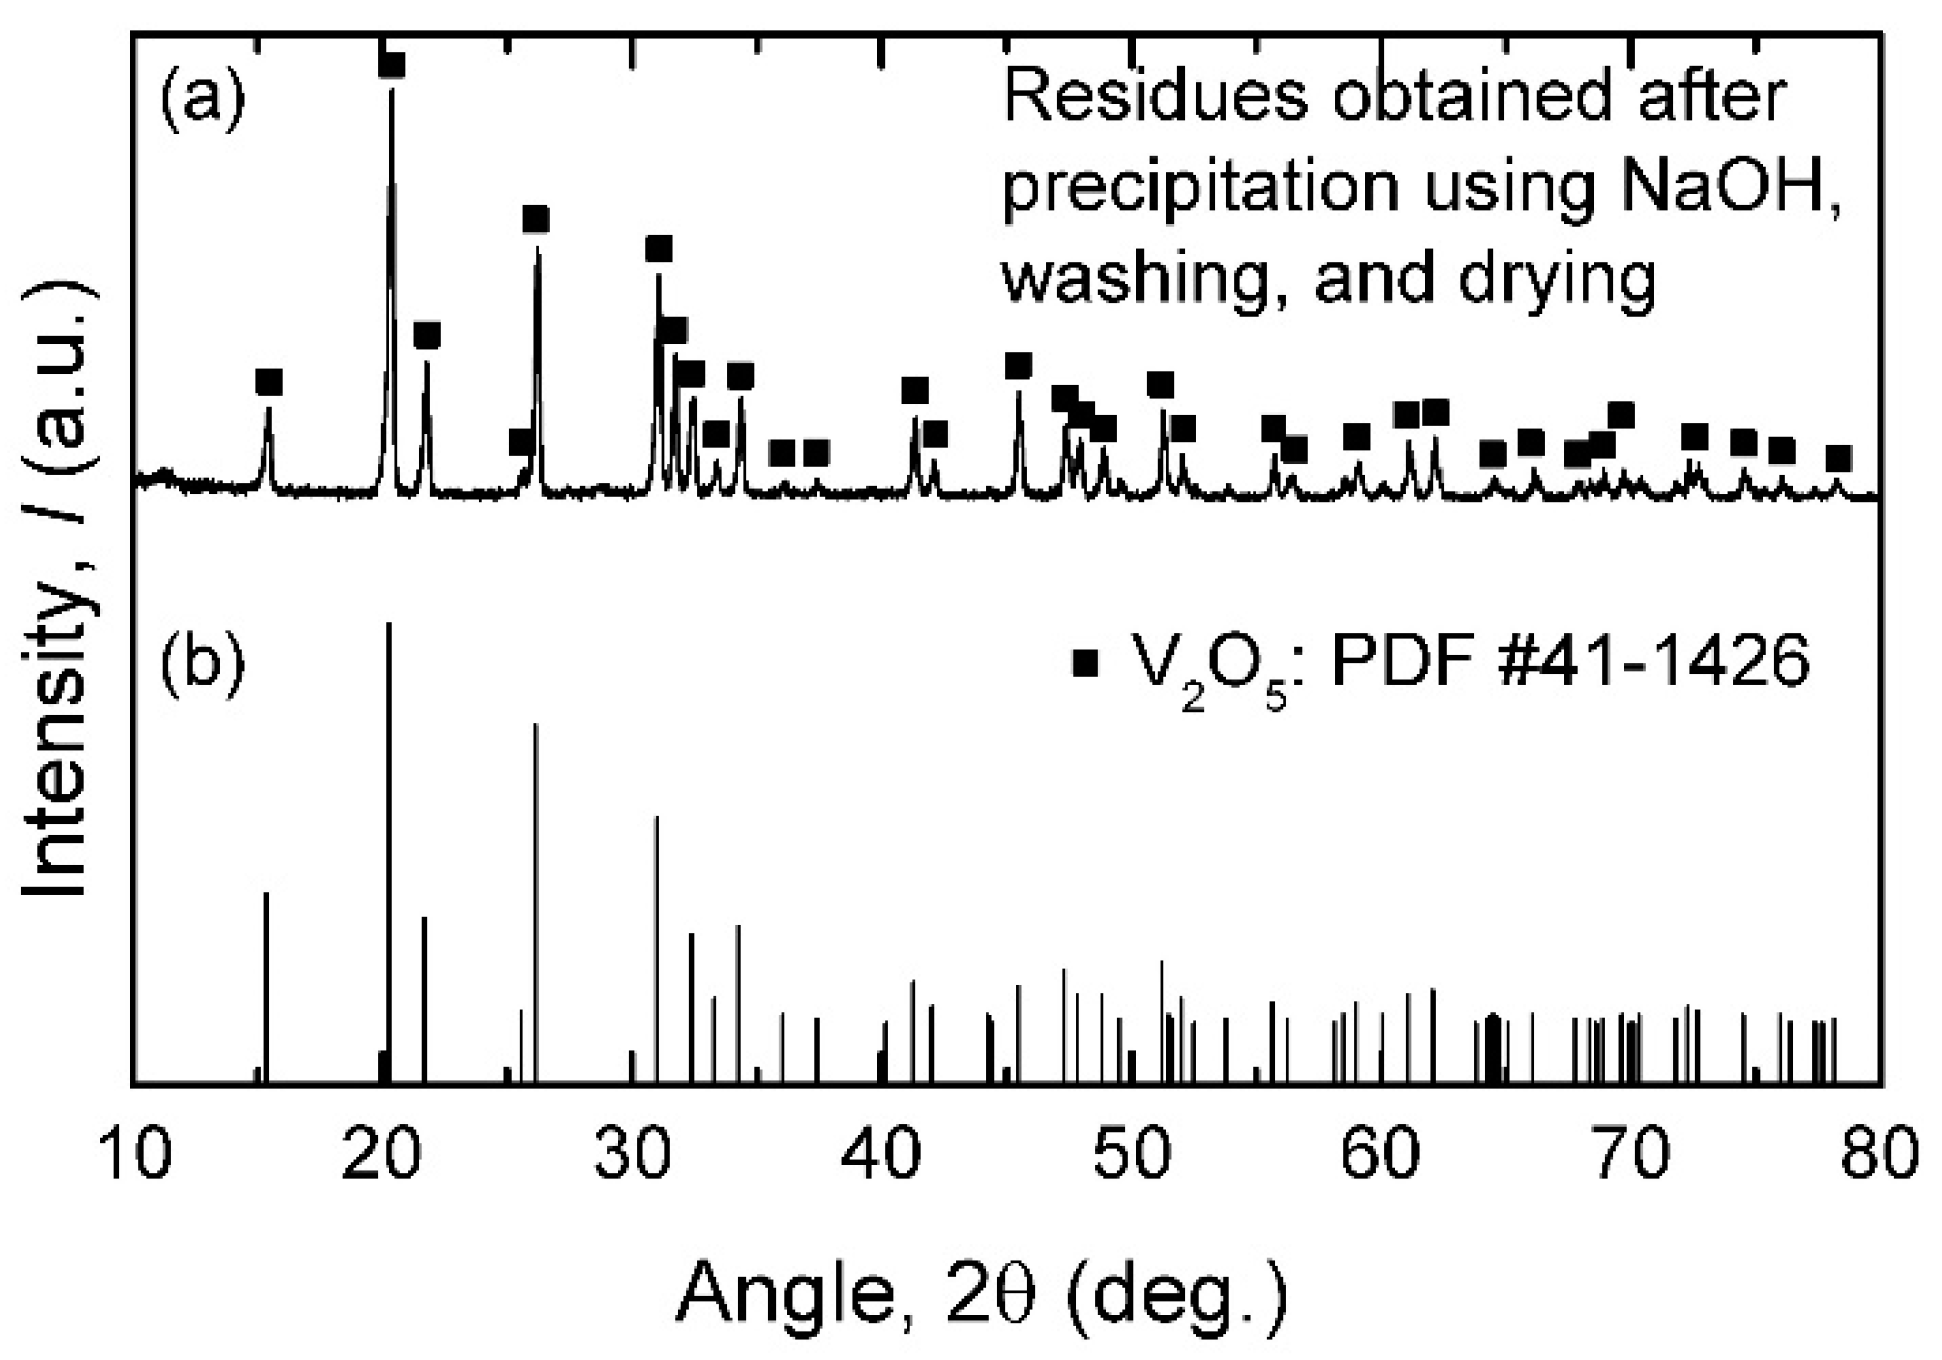
Desilication, precipitation using CaCl2 and decomposition of W and V precipitates using HCl solution were carried out to separate W as H2WO4 in a form of solid from V ion in the leaching solution obtained after the decomposition. Na2WO4 with a purity of 99.3% was produced via dissolution of H2WO4 using NaOH, crystallization and drying. In addition, V2O5 with a purity of 99.3% was produced through the precipitation of V bearing solution using NaOH, washing and drying. The overall recovery yields for V and W were calculated 91.6% and 94.1%, respectively, by the pilot-scale experiments.
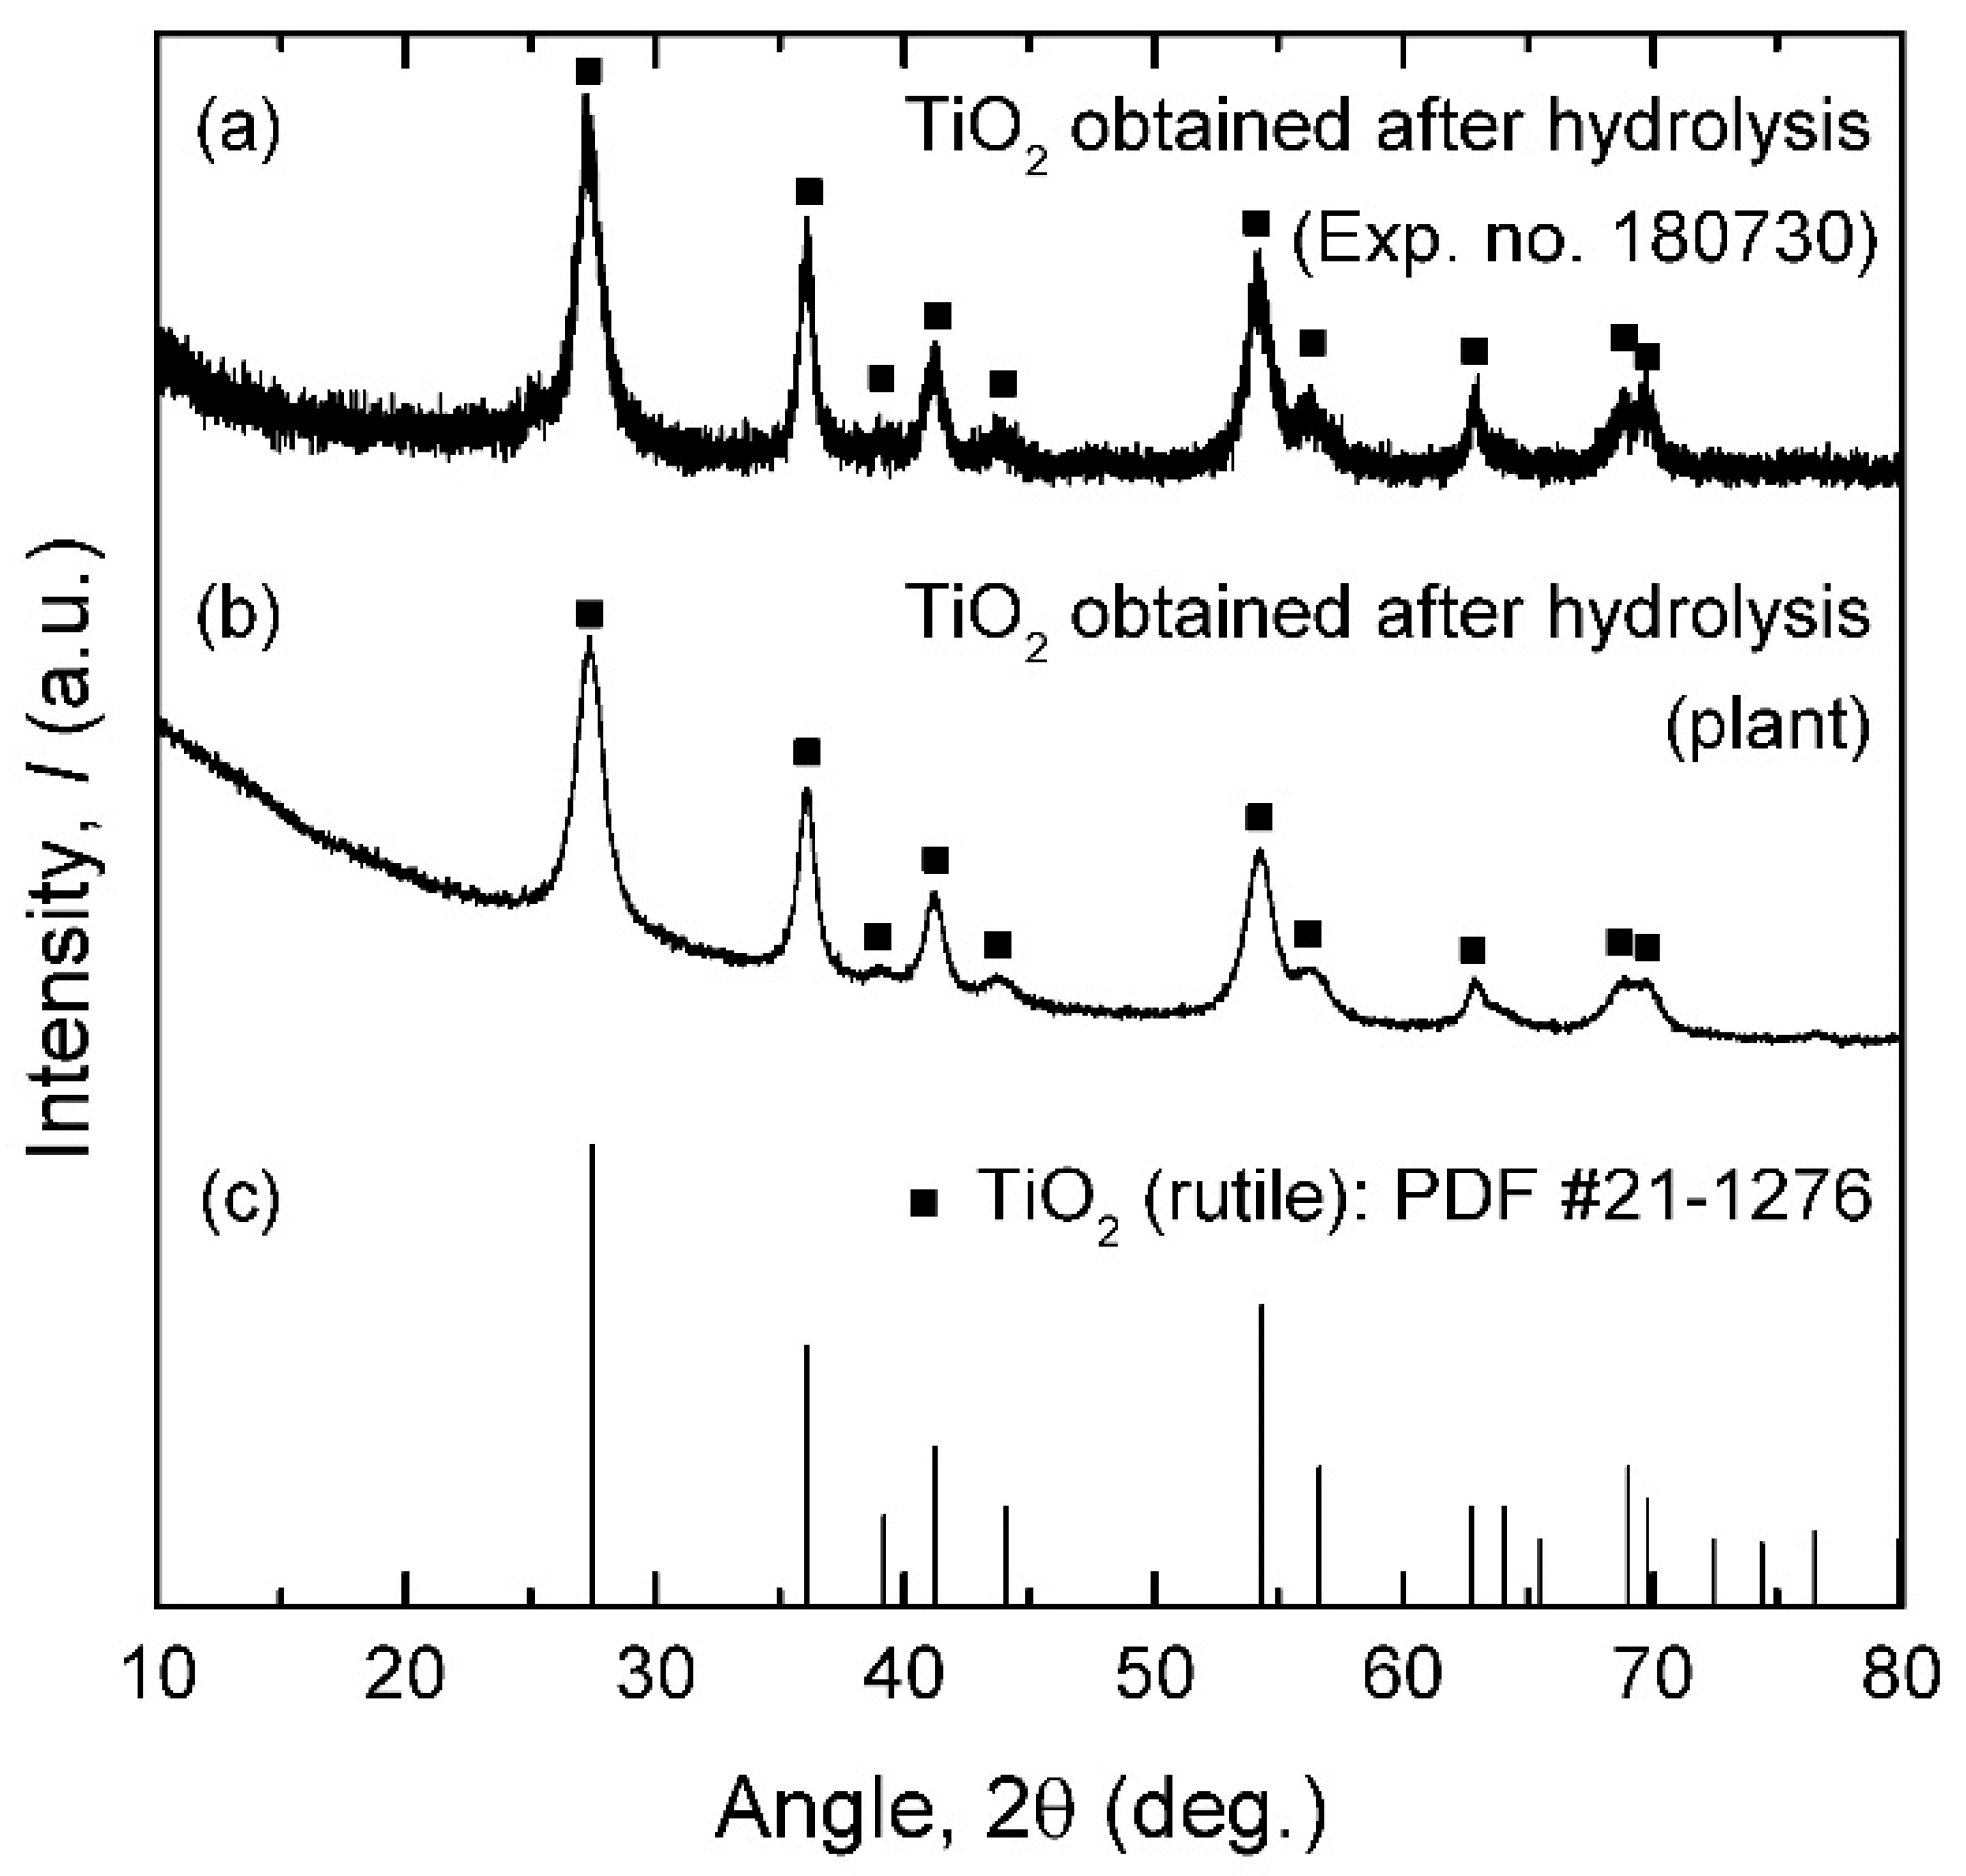
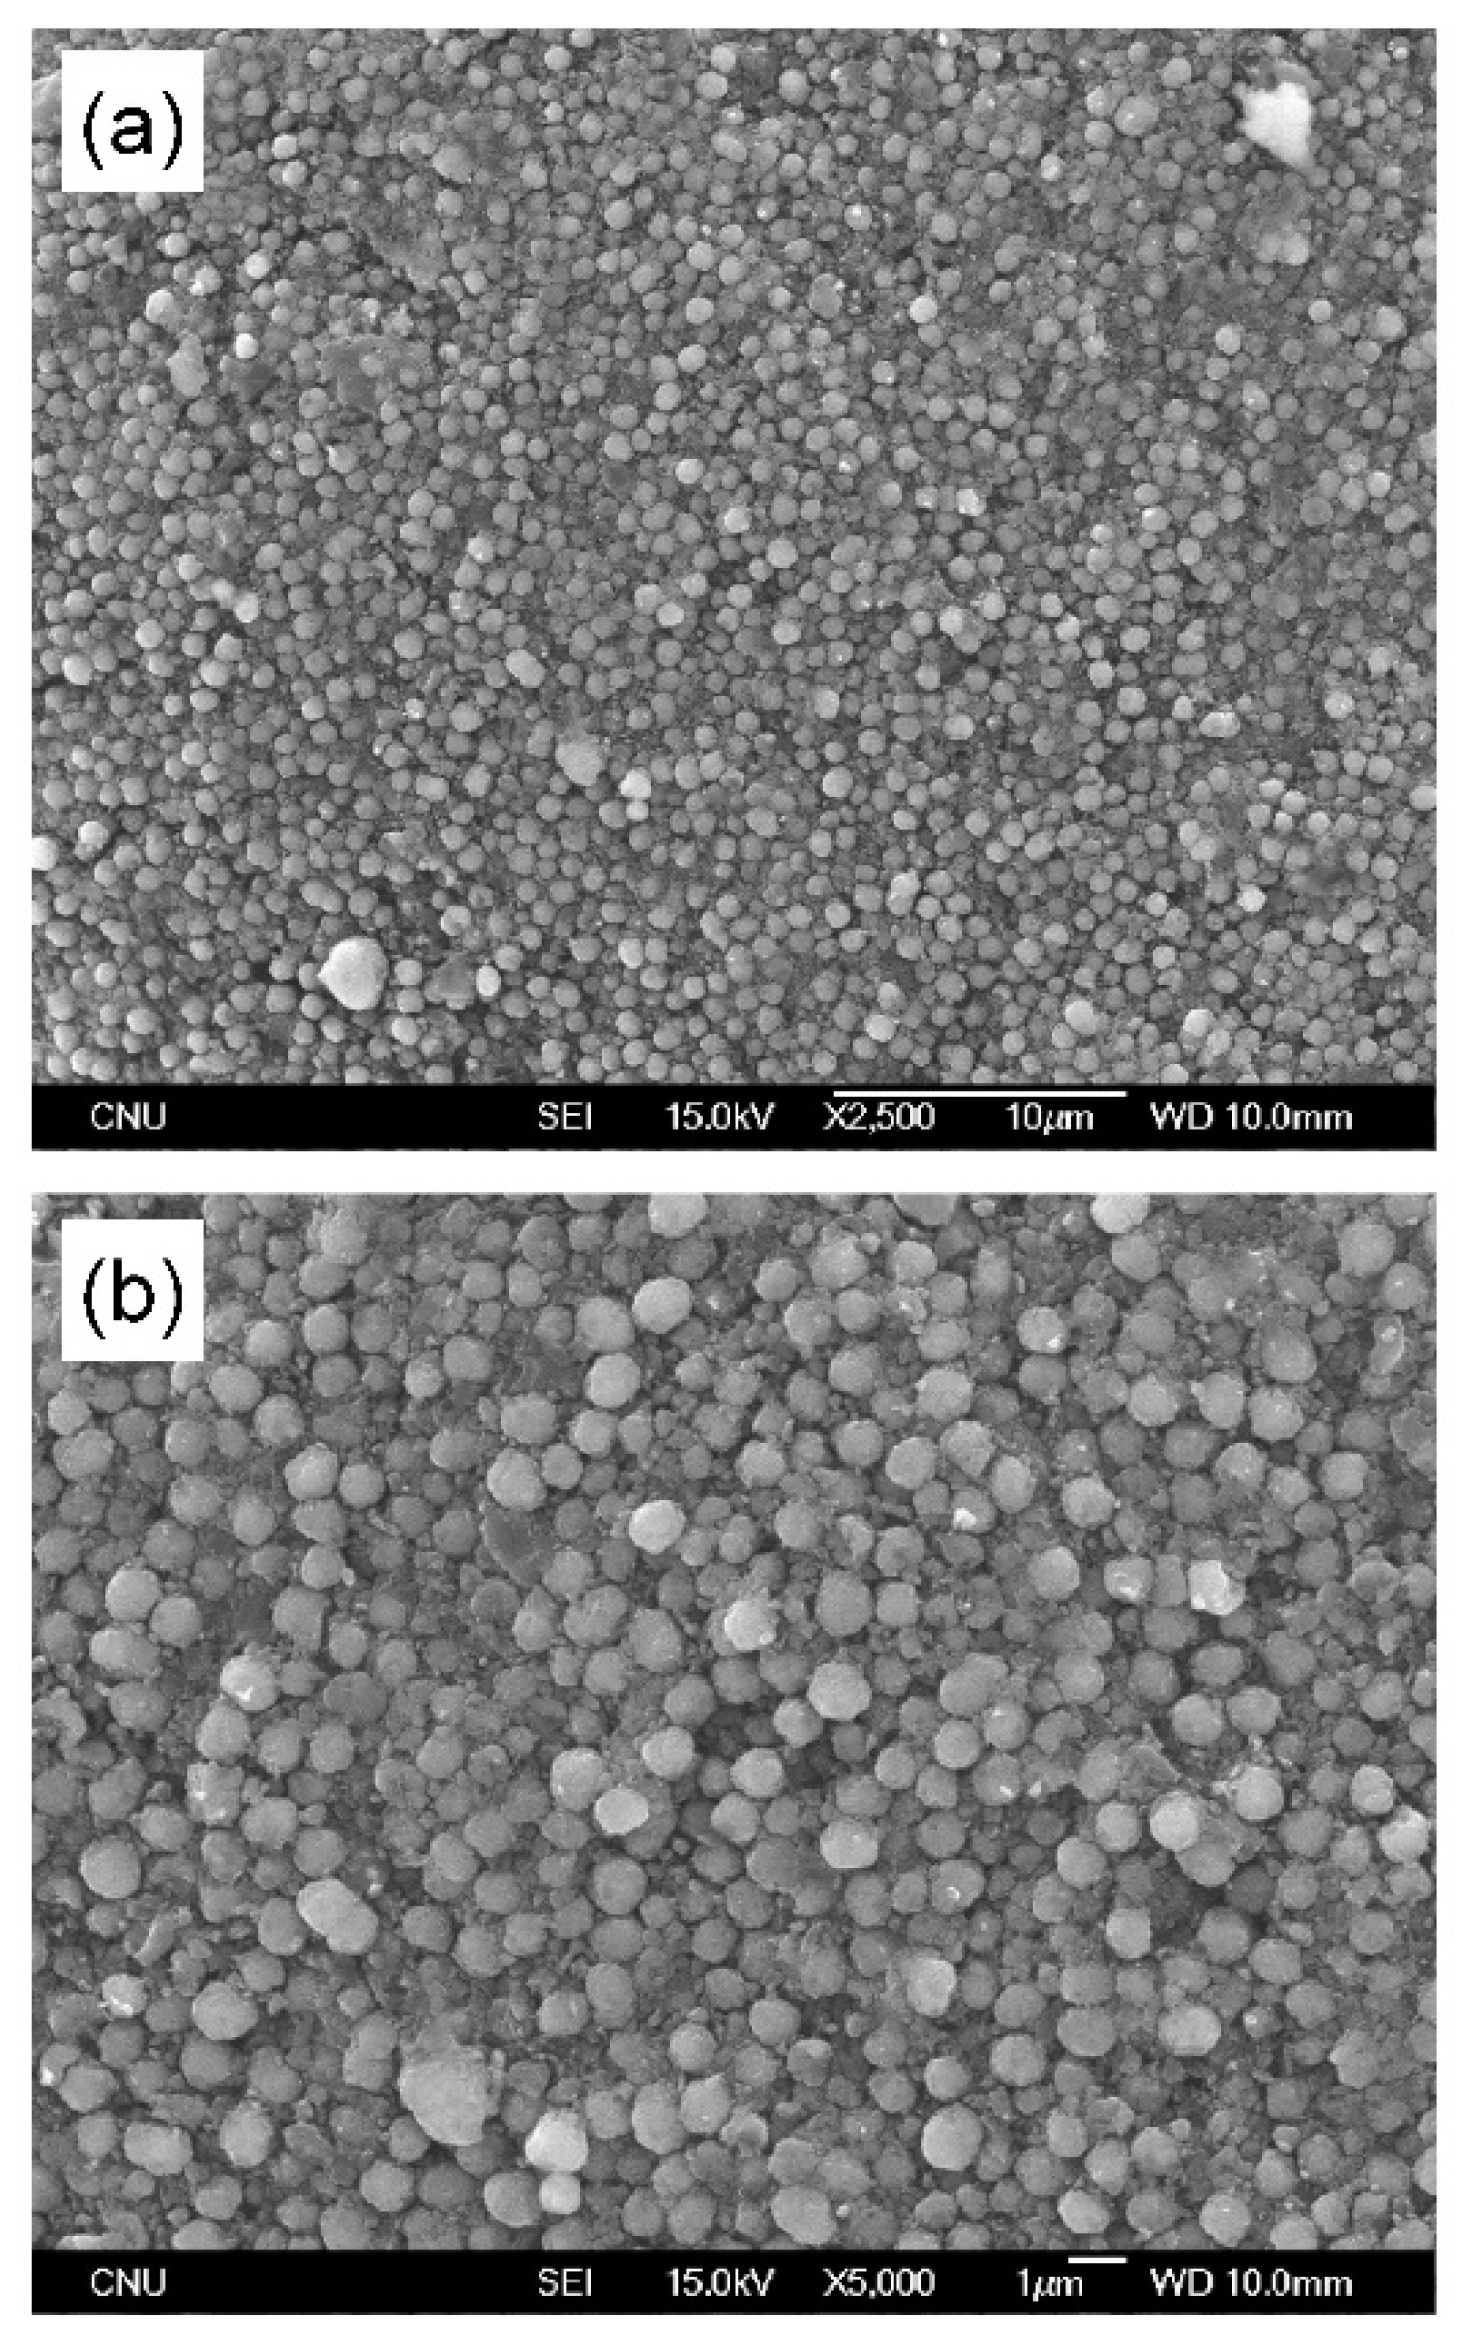
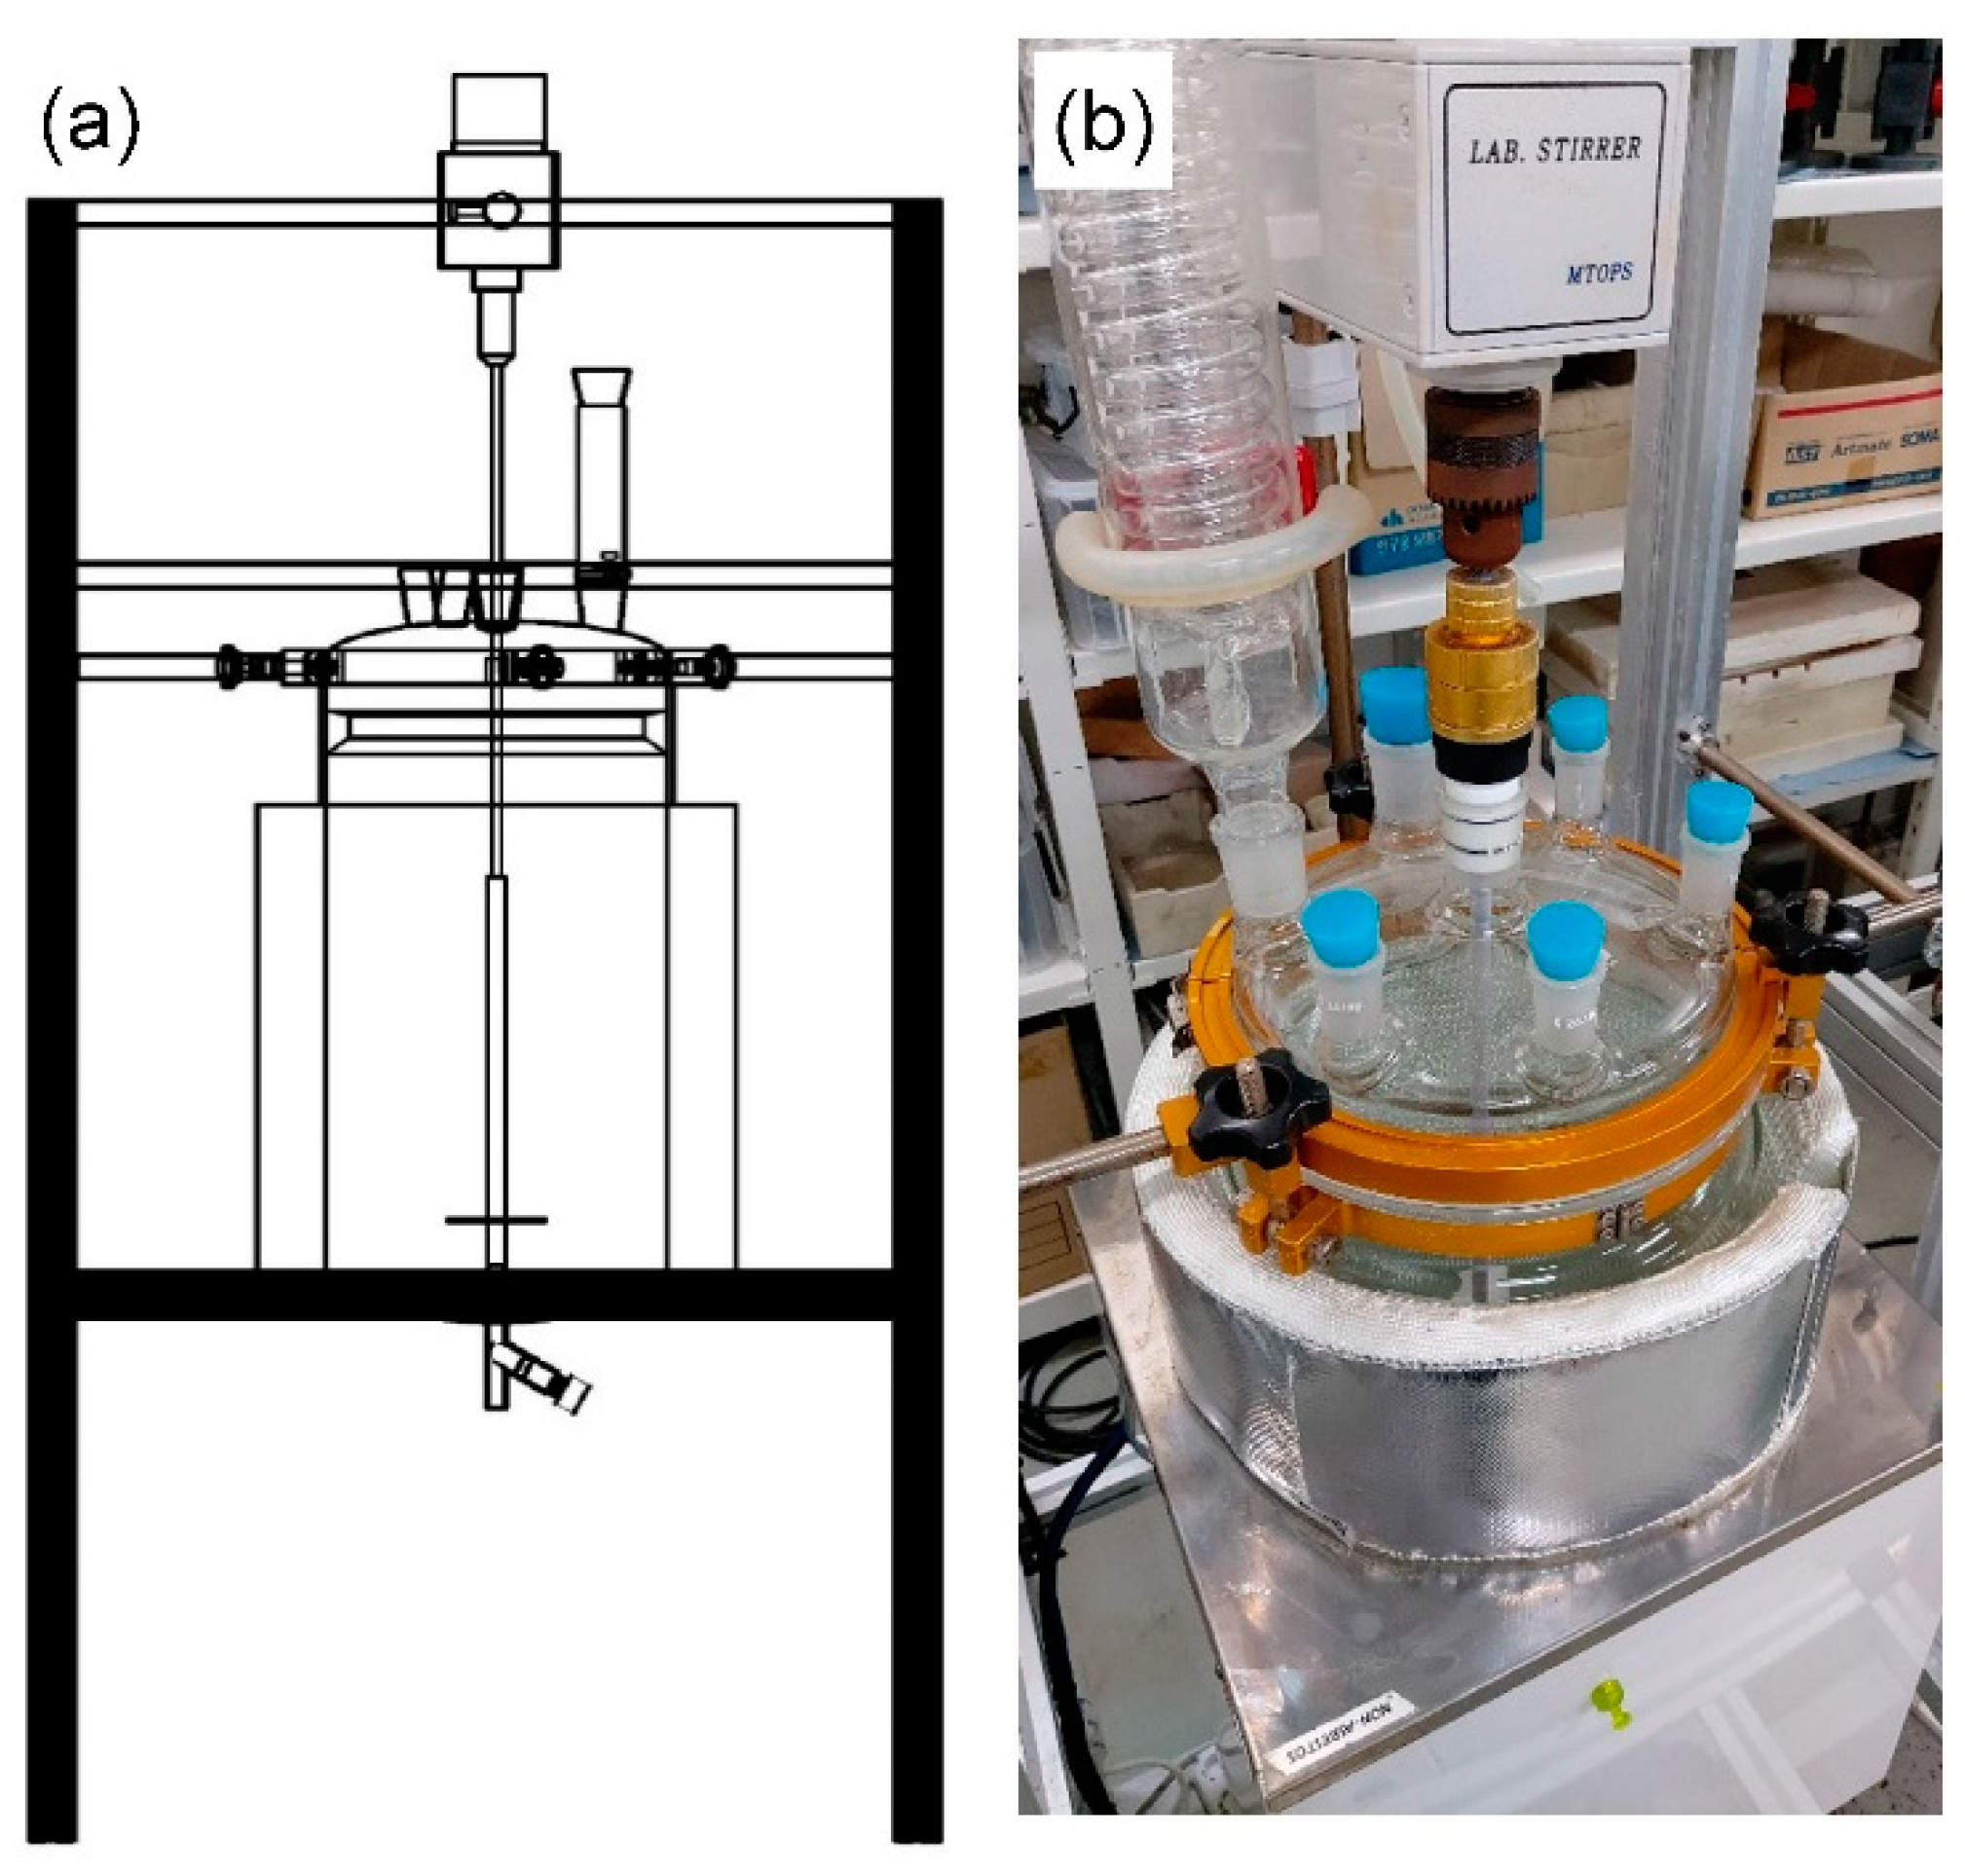
Sodium titanate obtained after water leaching was dissolved using HCl solution at 333 K for the production of TiOCl2 solution. In addition, the desilication method was utilized for the removal of silica in TiOCl2 solution. Afterwards, rutile type of TiO2 with a purity of 99.4–99.6% was produced by the hydrolysis of the purified TiOCl2 solution at 353–363 K. In addition, 90% of the overall recovery yield was obtained for Ti by the pilot-scale experiments.

Author Contributions

I.-H.C., Y.-C.C., G.M. and H.-N.K. carried out the experiments and analysis and interpretation of the data obtained. Y.O. acquired funding for the establishment of pilot-scale and commercial plants utilized for the experiments. I.-H.C. and J.K. wrote and edited the paper. J.-Y.L. and J.K. are the Co-Principal Investigators of this work. All authors have read and agreed to the published version of the manuscript.

Funding

This research was supported by the R&D Center for Valuable Recycling (Global-Top R&D Program) funded by the Ministry of Environment in Korea (Project No.: 2019002230001).

Acknowledgments

The authors are grateful to Tae-Hyuk Lee and Hong-Il So for their technical support throughout this study. The authors are also grateful to all the members of the Geoanalysis Department of KIGAM for their technical assistance.

Conflicts of Interest

The authors declare no conflict of interest.

References

  1. Gurjar, B.R.; Jain, A.; Sharma, A.; Agarwal, A.; Gupta, P.; Nagpure, A.S.; Lelieveld, J. Human health risks in megacities due to air pollution. Atmos. Environ. 2010, 44, 4606–4613. [Google Scholar] [CrossRef]
  2. Anderson, J.O.; Thundiyil, J.G. Clearing the Air: A Review of the Effects of Particulate Matter Air Pollution on Human Health. J. Med. Toxicol. 2012, 8, 166–175. [Google Scholar] [CrossRef] [PubMed] [Green Version]
  3. Han, L.; Cai, S.; Gao, M.; Hasegawa, J.; Wang, P.; Zhang, J.; Shi, L.; Zhang, D. Selective Catalytic Reduction of NOx with NH3 by using Novel Catalysts: State of the Art and Future Prospects. Chem. Rev. 2019, 119, 10916–10976. [Google Scholar] [CrossRef] [PubMed]
  4. Spivey, J.J. Catalysis; The Royal Society of Chemistry: North Yorkshire, UK, 2002; pp. 236–271. [Google Scholar]
  5. Alemany, L.J.; Lietti, L.; Ferlazzo, N.; Forzatti, P.; Busca, G.; Giamello, E.; Bregani, F. Reactivity and Physicochemical Characterization of V2O5-WO3/TiO2 De-NOx Catalysts. J. Catal. 1995, 155, 117–130. [Google Scholar] [CrossRef]
  6. Marberger, A.; Elsener, M.; Ferri, D.; Kröcher, O. VOx Surface Coverage Optimization of V2O5/WO3-TiO2 SCR Catalysts by Variation of the V Loading and by Aging. J. Catal. 2015, 5, 1704–1720. [Google Scholar] [CrossRef]
  7. Ministry of Environment. Available online: http://me.go.kr/home/web/main.do (accessed on 1 February 2020).
  8. Choi, I.; Kim, H.; Moon, G.; Jyothi, R.K.; Lee, J. Spent V2O5-WO3/TiO2 catalyst processing for valuable metals by soda roasting-water leaching. Hydrometallurgy 2018, 175, 292–299. [Google Scholar] [CrossRef]
  9. Choi, I.; Moon, G.; Jyothi, R.K.; Lee, J. Extraction of tungsten and vanadium from spent selective catalytic reduction catalyst for stationary application by pressure leaching. J. Clean. Prod. 2018, 197, 163–169. [Google Scholar] [CrossRef]
  10. Kim, J.W.; Lee, W.G.; Hwang, I.S.; Lee, J.; Han, C. Recovery of tungsten from spent selective catalytic reduction catalysts by pressure leaching. J. Ind. Eng. Chem. 2018, 28, 73–77. [Google Scholar] [CrossRef]
  11. Wu, W.C.; Tsai, T.Y.; Shen, Y.H. Tungsten recovery from spent SCR catalyst using alkaline leaching and ion exchange. Minerals 2016, 6, 107. [Google Scholar] [CrossRef] [Green Version]
  12. Joung, M.J. A Study on the Alkaline Leaching of Vanadium and Tungsten from Spent SCR Catalyst. Master’s Thesis, Korea University, Seoul, Korea, 2012. [Google Scholar]
  13. Moon, G.; Kim, J.H.; Lee, J.; Kang, J. Leaching of spent selective catalytic reduction catalyst using alkaline melting for recovery of titanium, tungsten and vanadium. Hydrometallurgy 2019, 189, 105132. [Google Scholar] [CrossRef]
  14. Moon, G.; Cho, Y.; Lee, J.; Kang, J. Desilication of highly acidic titanium solution for the production of high-purity titania pigment from spent selective catalytic reduction catalyst. Mater. Trans. 2019, 60, 988–996. [Google Scholar] [CrossRef] [Green Version]
  15. Middlemas, S.; Fang, Z.Z.; Fan, P. A new method for production of titanium dioxide pigment. Hydrometallurgy 2013, 131, 107–113. [Google Scholar] [CrossRef]
  16. Lefler, H.; Zhang, Y.; Fang, Z.Z.; Free, M.; Huang, Z. Removal of silicon from highly acidic HCl medium to produce purified TiO2. Hydrometallurgy 2017, 173, 218–223. [Google Scholar] [CrossRef]
  17. International Agency for Research on Cancer (IARC). Cobalt in Hard Metals and Cobalt Sulfate, Allium Arsenide, Indium Phosphide and Vanadium Pentoxide; International Agency for Research on Cancer: Lyon, France, 2006; p. 230. [Google Scholar]
  18. Braun, J.H.; Baidins, A.; Marganski, R.E. TiO2 pigment technology: A review. Prog. Org. Coat. 1992, 20, 105–138. [Google Scholar] [CrossRef]
  19. Choi, I.; Moon, G.; Jyothi, R.K.; Lee, J. Alkali fusion using sodium carbonate for extraction of vanadium and tungsten for the preparation of synthetic sodium titanate from spent SCR catalyst. Sci. Rep. 2019, 9, 12316. [Google Scholar] [CrossRef] [PubMed] [Green Version]
  20. HSC Chemistry. Chemical Reaction and Equilibrium Software with Extensive Thermochemical Database and Flowsheet Simulation, 7.11th ed.; Outokumpu Research Oy: Pori, Finland, 2011. [Google Scholar]
  21. Barin, I. Thermochemical Data of Pure Substances, 3rd ed.; VCH Verlagsgesellschaft mbH: Weinheim, Germany, 1995. [Google Scholar]
  22. Deo, G.; Wachs, I.E. Supported vanadium oxide catalysts: Molecular structural characterization and reactivity properties. Crit. Rev. Surf. Chem. 1994, 4, 141–187. [Google Scholar] [CrossRef]
  23. Nikolaychuk, P.A. The revised Pourbaix Diagram for Silicon. Silicon 2014, 6, 109–116. [Google Scholar] [CrossRef]
  24. Iler, R.K. The Chemistry of Silica; A Wiley-Interscience Publication: New York, NY, USA, 1979. [Google Scholar]
  25. Alexander, G.B.; Heston, W.M.; Iler, R.K. The Solubility of Amorphous Silica in Water. J. Phys. Chem. 1954, 58, 453–455. [Google Scholar] [CrossRef]
  26. Okamoto, G.; Okura, T.; Goto, K. Properties of silica in water. Geochim. Cosmochim. Acta 1957, 12, 123–132. [Google Scholar] [CrossRef]
  27. Pourbaix, M. Atlas of Electrochemical Equilibria in Aqueous Solutions; National Association of Corrosion Engineers: Houston, TX, USA, 1974. [Google Scholar]
  28. Post, K.; Robins, G. Thermodynamic diagrams for the vanadium-water system at 298.15 K. Electrochim. Acta 1976, 21, 401–405. [Google Scholar] [CrossRef]
  29. Choi, I. Process Design for Recovery of Vanadium and Tungsten from Spent V2O5-WO3/TiO2 Catalyst. Ph.D. Thesis, University of Science and Technology, Daejeon, Korea, 2018. [Google Scholar]
  30. Gorrepati, E.A.; Wongthahan, P.; Raha, S.; Fogler, H.S. Silica Precipitation in Acidic Solutions: Mechanism, pH Effect and Salt Effect. Langmuir 2010, 26, 10467–10474. [Google Scholar] [CrossRef] [PubMed]
  31. Honggui, L.; Jiangao, Y.; Kun, L. Tungsten Metallurgy; Central South University Press: Changsha, China, 2010. [Google Scholar]
  32. Zhang, W.; Zhu, Z.; Cheng, C.Y. A literature review of titanium metallurgical processes. Hydrometallurgy 2011, 108, 177–188. [Google Scholar] [CrossRef]
Figure 1. Flowchart of the recovery of (a) Ti, (b) W and (c) V from a spent selective catalytic reduction (SCR) catalyst investigated in Korea Institute of Geoscience and Mineral Resources.
Catalysts 10 00182 g001
Figure 2. Results of the (a) X-ray diffraction (XRD) analysis of a spent SCR catalyst used in this study and (b) reference patterns of TiO2 (anatase).
Catalysts 10 00182 g002
Figure 3. Results of XRD analysis of the residues obtained after the soda-melting of a spent SCR catalyst using Na2CO3 at 1273 K by (a) continuous and (b) batch type of soda-melting reactors, and reference patterns of (c) Na2WO4 and (d) Na16Ti10O28.
Catalysts 10 00182 g003
Figure 4. Pourbaix diagram of Si-H2O system at 298.15 K.
Catalysts 10 00182 g004
Figure 5. (a) Results of XRD analysis of the precipitates obtained after the addition of CaCl2, and reference patterns of (b) Ca3WO6 and (c) CaWO4.
Catalysts 10 00182 g005
Figure 6. (a) Results of XRD analysis of the residues obtained after the decomposition using HCl solution and (b) reference patterns of WO3·H2O.
Catalysts 10 00182 g006
Figure 7. (a) Results of XRD analysis of the residues obtained after the dissolution using NaOH, crystallization and drying and (b) reference patterns of Na2WO4.
Catalysts 10 00182 g007
Figure 8. (a) Results of XRD analysis of the residues obtained after precipitation using NaOH, washing and drying and (b) reference patterns of V2O5.
Catalysts 10 00182 g008
Figure 9. Results of XRD analysis of TiO2 obtained after hydrolysis of the purified TiOCl2 solutions in (a) Exp. no. 180730 and (b) plant and (c) reference patterns of TiO2 (rutile).
Catalysts 10 00182 g009
Figure 10. Images of TiO2 powder obtained by the hydrolysis of the purified TiOCl2 solutions at 363 K at resolution of (a) ×2500 and (b) ×5000 magnification.
Catalysts 10 00182 g010
Figure 11. Photographs of (a) pilot-scale plant, (b) the furnace used for the continuous soda-melting reactions (100 L), (c) reactors for water leaching, desilication and precipitation (1 m3), (d) glass-lined reactor for a preparation of tungstic acid (100 L) and (e) glass-lined reactor for Ti leaching and hydrolysis (300 L).
Catalysts 10 00182 g011
Figure 12. (a) Schematic and (b) photograph of the experimental apparatus used for HCl leaching of sodium titanate (30 L).
Catalysts 10 00182 g012
Table 1. Analytical results of the spent SCR catalyst feed used for the recovery of W and V.
Concentration of Element i, Ci (mass %) aNote
TiO2WO3V2O5Al2O3Fe2O3CaOSiO2 bMgOMoO3
SCR catalyst feed70.97.110.982.410.252.509.320.130.12H2O: 4.5 mass % c
a: Determined by ICP-OES analysis except Si. b: Concentration of Si was analyzed using wet analysis (gravimetric analysis). c: Concentration of H2O was calculated by the weight reduction of the feedstock after drying at 378 K for 12 h.
Table 2. Efficiencies of W and V by water leaching at 353 K for 1 h under 50% S/L ratio (w/v).
Exp. No aLeaching Efficiency of Element i, ei (%)
WV
Water leaching #199.198.6
Water leaching #298.998.5
Water leaching #399.699.1
Water leaching #499.999.1
Water leaching #599.099.2
a: Experiments were repeatedly conducted for reproducibility.
Table 3. Concentration change of Si in W and V bearing solution by pH adjustment and following the addition of Al2(SO4)3.
Exp. No aConcentration of Si, CSi (mg/L) b
pH = 13.1 (Initial)pH = 9 (Use of HCl Solution)pH = 8.9 (Use of Al2(SO4)3)
Desilication #15448152N.D
Desilication #25228175N.D
Desilication #35975122N.D
Desilication #45197204N.D
Desilication #55391144N.D
a: Experiments were repeatedly conducted for reproducibility, pH of the leaching solution feed was decreased to pH 9 by using the HCl solution, Afterwards, Al2(SO4)3 was added into the solution to remove the residual Si in the solution, Addition of Al2(SO4)3: 2 Al/Si = 1.2 (mole ratio). b: Determined by ICP-OES analysis, N.D: Not Detected (<1 mg/L).
Table 4. Analytical result of W and V bearing solution obtained after desilication.
Exp. NoConcentration of Element i, Ci (mg/L) a
TiWVSiAlCaFeMgMo
W,V bearing solutionN.D98012011N.DN.DN.D15N.D22
a: Determined by ICP-OES analysis, N.D: Not Detected (<1 mg/L).
Table 5. Influence of the amount of CaCl2·2H2O (s) added on the efficiency of the precipitation of W and V.
Exp. No aMole Ratio of Ca/(W + V)Final pH of SolutionConcentration of Element i in the Solution, Ci (mg/L) bEfficiency of Precipitation (%)
WVWV
Precipitation_Exp_#11.09.12887218389.711.4
Precipitation_Exp_#21.58.945119128047.938.3
Precipitation_Exp_#32.08.281184698.897.9
Precipitation_Exp_#42.58.10795299.297.5
Precipitation_Exp_#53.07.99695499.397.4
a: Precipitation was conducted at 333 K for 1 h, initial pH of the solution was 10. b: Determined by ICP-OES analysis, N.D: Not Detected (<1 mg/L).
Table 6. Influence of the amount of HCl solution used on the decomposition efficiency of W and leaching efficiency of V.
Exp. No aMole Ratio of W/2HClDecomposition Efficiency of W (%)Leaching Efficiency of V (%)
Decomposition_Exp_#11.279.181.2
Decomposition_Exp_#21.589.990.5
Decomposition_Exp_#32.091.895.5
Decomposition_Exp_#43.097.2> 99.0
a: Precipitates obtained was washed using DI water at room temp. for 0.5 h under 20% S/L ratio (w/v), Decomposition was conducted using 35% HCl solution at 333 K for 2 h under 10% S/L ratio (w/v), Tungstic acid obtained after experiments was washed using 5% HCl solution at room temperature for 0.5 h under 10% S/L ratio (w/v).
Table 7. Analytical results of tungstic acid (H2WO4) obtained after the decomposition using HCl solution.
Concentration of Element i, Ci (mass %) aNote b
WO3V2O5CaOMoO3Fe2O3
Tungstic acid91.10.430.340.080.02Purity of H2WO4 = 98.2%
a: Determined by ICP-OES analysis. Ti, Si, Al and Mg were not detected (N.D < 0.01 mass %). b: The concentration of H2WO4 was calculated using the concentration of WO3.
Table 8. Analytical results of Na2WO4 obtained after the dissolution of H2WO4 using NaOH, crystallization and drying.
Concentration of Element i, Ci (mass %) aNote b
Na2OWO3V2O5CaOMoO3Fe2O3
Sodium tungstate20.978.30.020.280.010.01Purity of Na2WO4 = 99.3%
a: Determined by ICP-OES analysis. Ti, Si, Al and Mg were not detected (N.D < 0.01 mass %). b: The concentration of Na2WO4 was calculated using the concentration of WO3.
Table 9. Analytical results of V2O5 obtained by the recovery of V from V bearing solution.
Concentration of Element i, Ci (mass %) a
V2O5 bWO3CaOMoO3Fe2O3
Vanadium oxide99.30.130.420.040.07
a: Determined by ICP-OES analysis. Ti, Si, Al and Mg were not detected (N.D < 0.01 mass %). b: The concentration of V2O5 was calculated as follows: 100—(sum of concentrations of impurities).
Table 10. Analytical results of the spent SCR catalyst feed, residues obtained after soda-melting of the feedstock using Na2CO3 and residues obtained after water leaching.
Concentration of Element i, Ci (mass %) aNote
TiO2WO3V2O5Al2O3Fe2O3CaOSiO2Na2O
Feed (SCR catalyst)67.27.493.231.590.331.807.15N.A
Residues after
soda-melting
30.94.391.550.870.330.713.7237.6This study
34.34.351.881.230.360.774.7139.3Previous study [13]
Residues after
water leaching
66.40.260.010.760.771.582.2715.0This study
60.40.060.031.680.631.413.3619.0Previous study [13]
a: Determined by ICP-OES analysis, N.A: Not Analyzed.
Table 11. Experimental conditions and analytical results of leaching solution obtained by HCl leaching at 333 K.
Exp. No.Weight of Feed, wfeed/kgMolarity of HCl Solution (mol/L)S/L Ratio (%)Concentration of Element i, Ci (mg/L) c
TiWVAlFeCaNaSi
180727 a1.6072058,50022712677894128017,2001190
180730 a1.4082059,40024013677906129011,0001910
Plant b-11.550110,500N.AN.AN.AN.AN.AN.A 80
a: Experimental conditions; Glass reactor was heated by mantle heater, Reaction temperature = 333 K, Reaction time = 3 h, Agitation speed = 200 rpm, S/L ratio (%) = weight of feedstock (kg) × 100/volume of solution (L). b: Experimental conditions; Capacity: 100 kg/batch (based on the weight of water leaching residue), Residues obtained after water leaching and filtration without drying were used as a feedstock. Reaction temperature = 333 K, Reaction time = 3 h, S/L ratio (%) = weight of feedstock (kg) × 100/volume of solution (L). c: Concentration of elements was analyzed using ICP-OES, N.A: Not Analyzed.
Table 12. Experimental conditions and analytical results of titanyl chloride solutions obtained after desilication.
Exp. No.Molarity of HCl Solution for HCl Leaching (mol/L)Days for PreservationConcentration of Element i, Ci (mg/L) a
TiWVAlFeCaNaSi
18072771158,40022712666922131017,000116
1807308559,50024513668923131010,40029
a: Determined by ICP-OES analysis, N.D: Not Detected (<1 mg/L).
Table 13. Experimental conditions and analytical results of TiO2 obtained after hydrolysis.
Exp. No.Molarity of HCl Solution for HCl Leaching (mol/L)Temp., T/KTime, t/hConcentration of Element i, Ci (mass %) a
TiO2 bWO3V2O5Al2O3Fe2O3CaOSiO2Na2O
1807277363599.60.25N.DN.D0.02N.D0.11N.D
1807308363599.60.25N.DN.D0.02N.D0.09N.D
Plant11.5353399.40.280.004N.A0.140.0030.110.004
a: Concentration of elements except Si was analyzed using ICP-OES, Concentration of Si was analyzed using wet analysis (gravimetric analysis). N.D: Not Detected (<0.002 mass %), N.A: Not Analyzed. b: Concentration of TiO2 was calculated as follows: TiO2 purity (%) = 100 − (sum of the conc. of oxides of W, V, Al, Fe, Ca, Si and Na).

