Article

Environmental Assessment of Humic Acid Coated Magnetic Materials Used as Catalyst in Photo-Fenton Processes

by
Mattia Costamagna
,
Nuno P. F. Gonçalves
* and
Alessandra Bianco Prevot
Department of Chemistry, University of Turin, 10125 Turin, Italy
*
Author to whom correspondence should be addressed.
Submission received: 24 June 2020 / Revised: 8 July 2020 / Accepted: 8 July 2020 / Published: 10 July 2020
(This article belongs to the Special Issue Green Catalysts: Application to Waste and Groundwater Treatment)

Abstract

:
Persistent organic pollutants have been increasingly detected in natural waters, and this represents a real challenge to the quality of this resource. To remove these species, advanced treatment technologies are required. Among these technologies, Fenton-like and photo-Fenton-like processes have been investigated for the removal of pollutants from water. Delicate aspects of photo-Fenton processes are that light-driven processes are energy intensive and require a fair amount of chemical inputs, which strongly affects their overall environmental burdens. At present, aside from determining the efficiency of the processes to remove pollutants of a particular technology, it becomes fundamental to assess also the environmental sustainability of the overall process. In this work, the methodology of the life cycle assessment (LCA) was applied to identify the hotspots of using magnetite particles covered with humic acid (Fe3O4/HA) as a heterogeneous photo-Fenton catalyst for water remediation. The sustainability of the overall process was considered, and a comparative LCA study was performed between H2O2 and persulfate activation at different pH. The addition of humic substances to the particles allows the effectiveness of the catalyst to improve without increasing the environmental impacts; these processes are strongly correlated with energy consumption and therefore with the efficiency of the process. For this reason, working at acidic pH allows us to contain the impacts.

Graphical Abstract

1. Introduction

Water is one of the most important resources for human life; however, over the years its protection has been neglected resulted from the anthropic activities [1,2]. Due to water scarcity and the increasing number of pollutants observed in wastewater as well as surface and drinking water, the preservation of this resource is considered one of the most urgent global emergencies we will face in the next decades [3,4]. The scientific community has been focusing on the development and application of sustainable water remediation techniques to reduce the constant release of pollutants into the environment and their consequent impact. Advanced oxidation processes (AOPs) provide a viable and effective remediation solution for the removal of persistent organic pollutants in water by the reaction with the in situ generated highly reactive species, mainly hydroxyl radicals (OH·) but also sulfate radicals (SO4). Among the AOPs, Fenton-like processes are one of the most investigated processes due to their high efficiency for the removal of a wide range of pollutants from water [5,6]. In the classic (photo)-Fenton process, OH· radicals are generated by the H2O2 decomposition mediated by iron species (Fe(II)/Fe(III)) in solution [6]. However, this process is limited by the need to adjust the pH to the optimal conditions (pH ≈ 3) and by the subsequent neutralization before water discharge, thereby creating a serious operational and economic constraint for its large-scale application [7]. The addition of substances to allow the iron complex formation in order to keep the system active at circumneutral pH have been investigated [8]; however, the environmental and economic aspects of the incorporation of these substances must be also addressed. Additionally, the classic Fenton process is well-known for the iron consumption that requires constant Fe(II) addition and consequently sludge formation, in turn impacting the cost-effectiveness of the process for its removal [9].
The use of magnetite (Fe3O4), a mixture of Fe(II) and Fe(III), as a heterogeneous (photo)-Fenton catalyst represents a promising approach to overcome some limitations of the classic process. Magnetite can act as an iron source that can be easily recovered from the reaction medium by employing as a costless and environmentally friendly magnetic field allowing their reusability in successive cycles [10,11]. However, the natural oxidation of Fe(II) forms an outer layer of Fe(III) that passivates the magnetite, slowing down the generation of reactive species. The addition of an external organic layer of humic acid, when in proper amounts, has been described as a way to enhance the efficiency for drugs removal and to stabilize the magnetite core from iron oxidation, thereby keeping the catalyst active without losing its efficiency in consecutive cycles [8]. Moreover, even if the light-driven photo-Fenton process can be activated by natural sun-light, due to its seasonality, an energy-demanding artificial irradiation system is required for a continuous process that strongly affects its environmental burden [12,13].
The industrial application of photo-Fenton processes brings out the need for a comprehensive evaluation of several aspects. This assessment should take into account not only the mere mechanistic aspects that lead to a greater effectiveness in degrading pollutants but also the environmental impacts generated by these processes. As far as we know, a limited number of studies have addressed an environmental assessment of the photo-Fenton processes. Some of these, set on a laboratory scale, have pointed out that the greatest impacts are related to energy consumption, namely the energy used for irradiating the system, pumping, stirring, etc. [13,14]. On the contrary, on a larger scale (pilot plant), Gallego-Schimd et al. [15] highlighted how chemicals and specifically EDDS, which is used as a complexing agent in neutral photo-Fenton, contribute to around 70% of the overall impacts associated to the life cycle of a pilot plant. A recent study of Feijoo et al. [10] assessed the environmental performance of the synthetic route for preparing different magnetite particles, which represent a promising option as a heterogeneous catalyst for Fenton and photo-Fenton processes.
In this work, we focus on the actual environmental impacts generated by the heterogeneous photo-Fenton processes. The methodology of a life cycle assessment (LCA) was applied to identify the hotspots of using the magnetite particles covered with humic acid (Fe3O4/HA [11]) as a heterogeneous photo-Fenton catalyst for water remediation. The introduction of humic acid is shown to improve the efficacy and stability of the catalyst. An interesting aspect of the application of humic acids is the potential replacement by humic-like substances derived from food or urban wastes, valorizing materials that would be considered waste [16,17]. The overall process of sustainability was considered, and a comparative LCA study was performed by applying Fe3O4/HA materials for the activation of hydrogen peroxide and persulfate. The burdens related to catalyst preparation, chemicals, pH adjustment, and electricity consumption were evaluated at a laboratory scale. Bisphenol A (BPA) was studied as a target contaminant of emerging concern, and its removal was evaluated in the different experimental conditions. Considering the potential photo-Fenton activation by natural solar light in the wastewater treatment plant, the effect of the experimental parameters was explored more in detail, when neglecting the contribution of the irradiation energy demand.

2. Results and Discussion

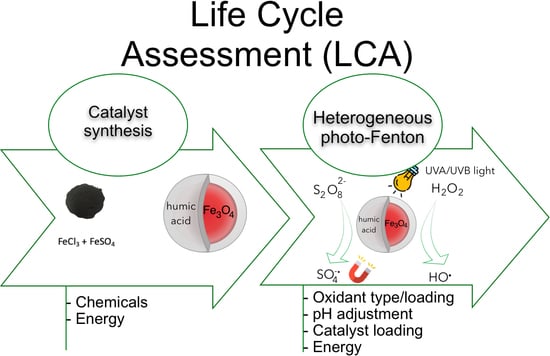
2.1. Life Cycle Impact Assessment of the Catalyst Synthesis

Table 1 shows the environmental impacts calculated for the 1 kg scale synthesis of magnetite particles covered with humic acid following the previously described procedure [18]. All used chemicals and necessary energy in the process were evaluated while considering the following impact categories: the climate change potential (CCP), ozone depletion potential (ODP), terrestrial acidification potential (TAP), freshwater eutrophication potential (FEP), and non-renewable (fossil) energy use (NREU). For the values of each impact category in the table, a heat map introduces a color gradient that marks the results from red (the worst score, major impacts) to green (the best score, more limited impacts).
The data show that for all impact categories (CCP, ODP, TEP, and NREU), the main contribution derives from energy consumption; in particular, the drying phase at the end of the synthesis procedure is responsible for the greatest impacts. The impact on ozone depletion potential not only derives from the energy contribution, but it is also caused by the use of FeCl3, attributable in turn to the use of chlorine gas. Instead, the highest impact for the FEP is generated by the use of nitrogen, which in turn requires energy for its production. For each impact category examined, a low contribution due to the use of humic acid (HA) was observed. As the synthesis process of bare magnetite particles (Fe3O4) is identical, results comparable to those reported above are obtained, obviously excluding the addition of humic acids.

2.2. Life Cycle Impact Assessment (LCIA) of the Degradation Process

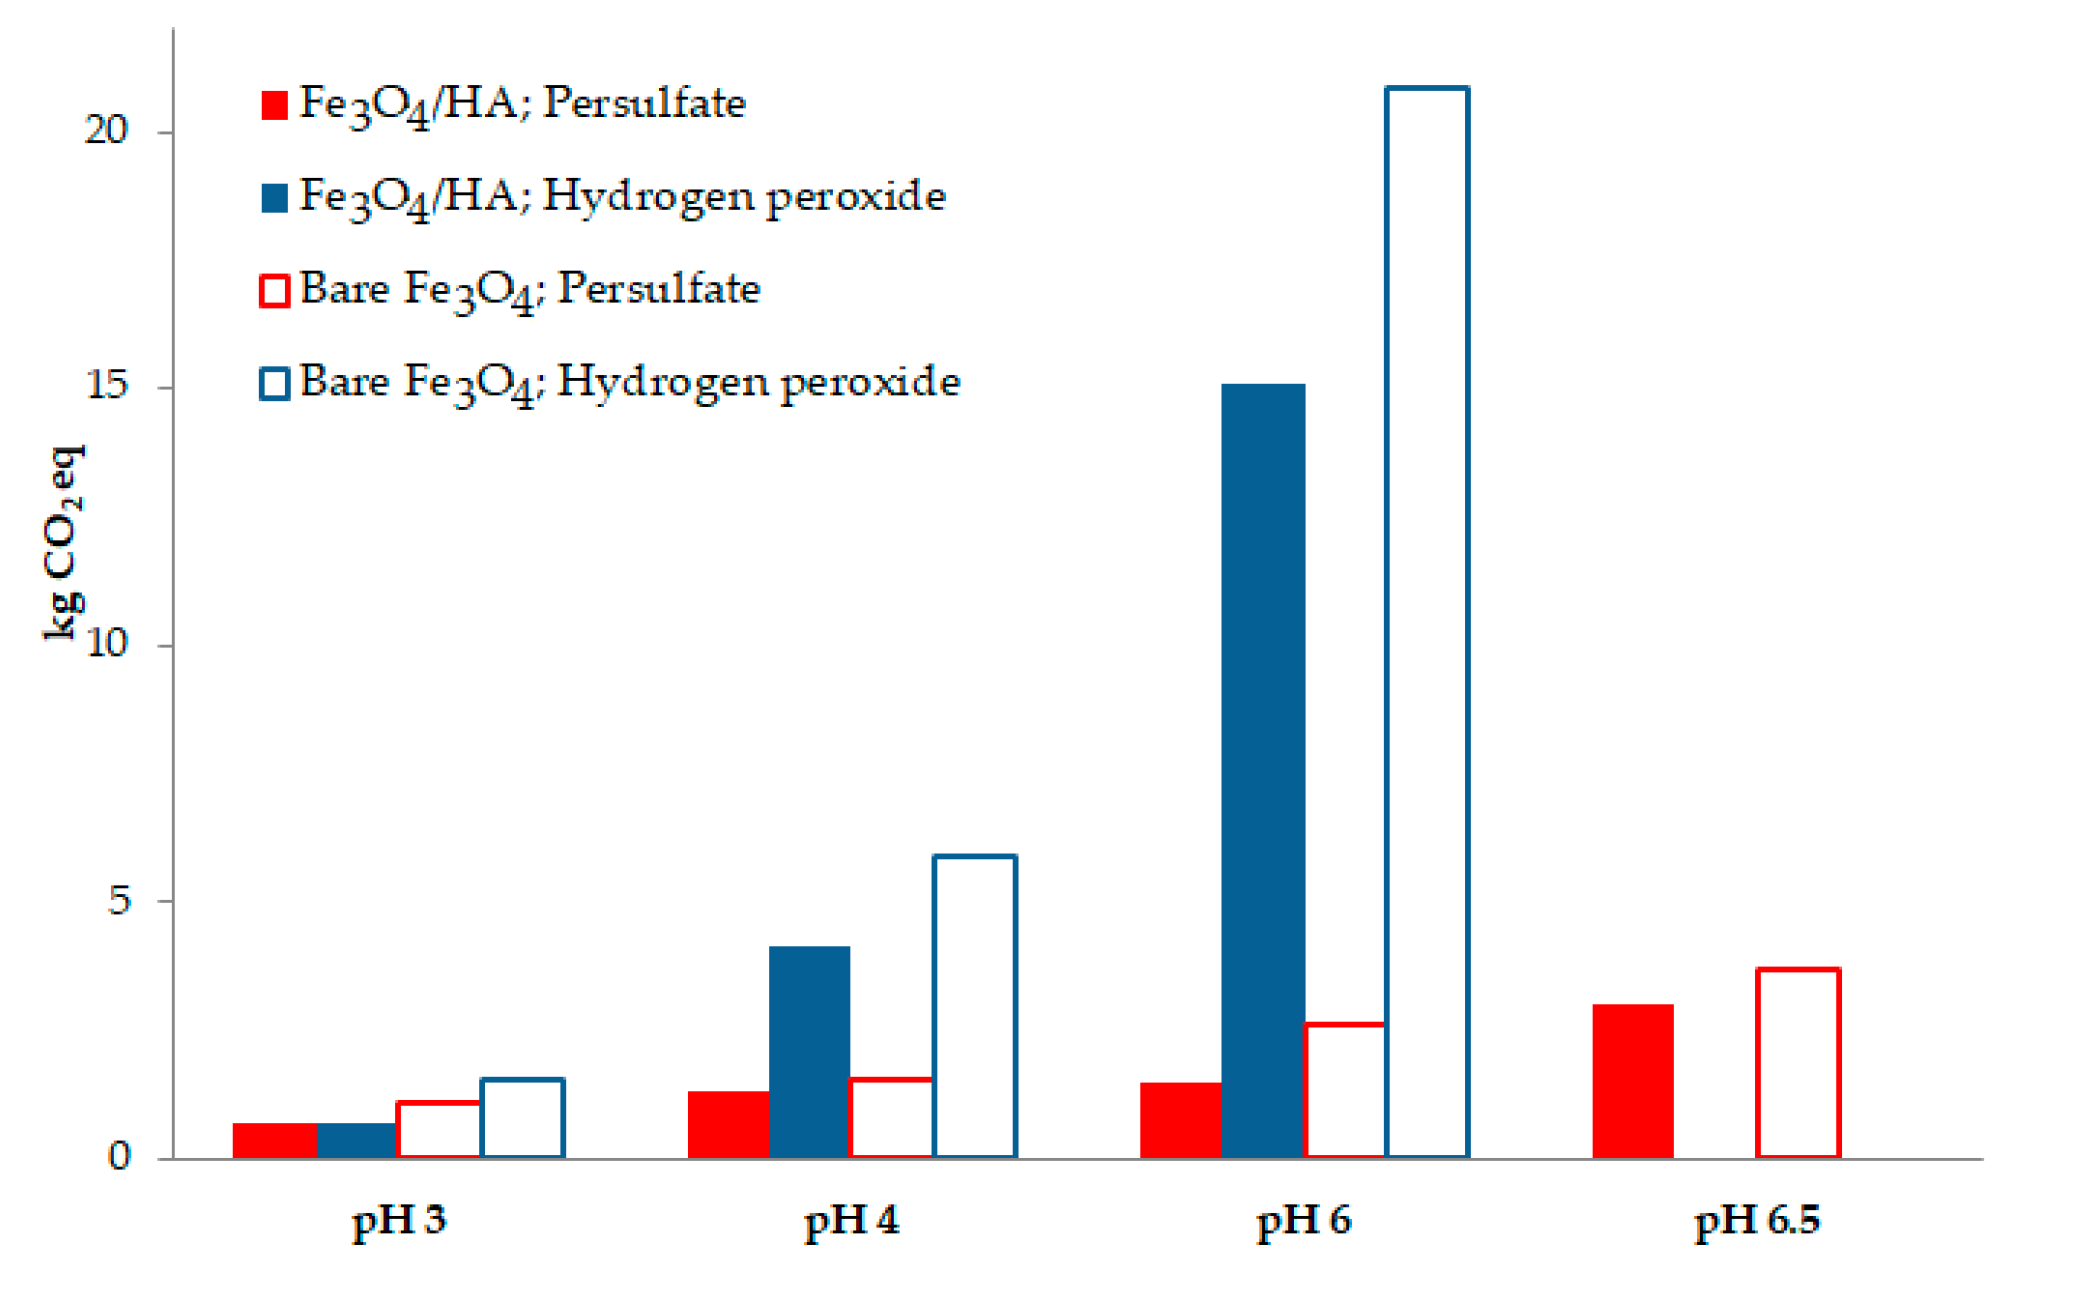
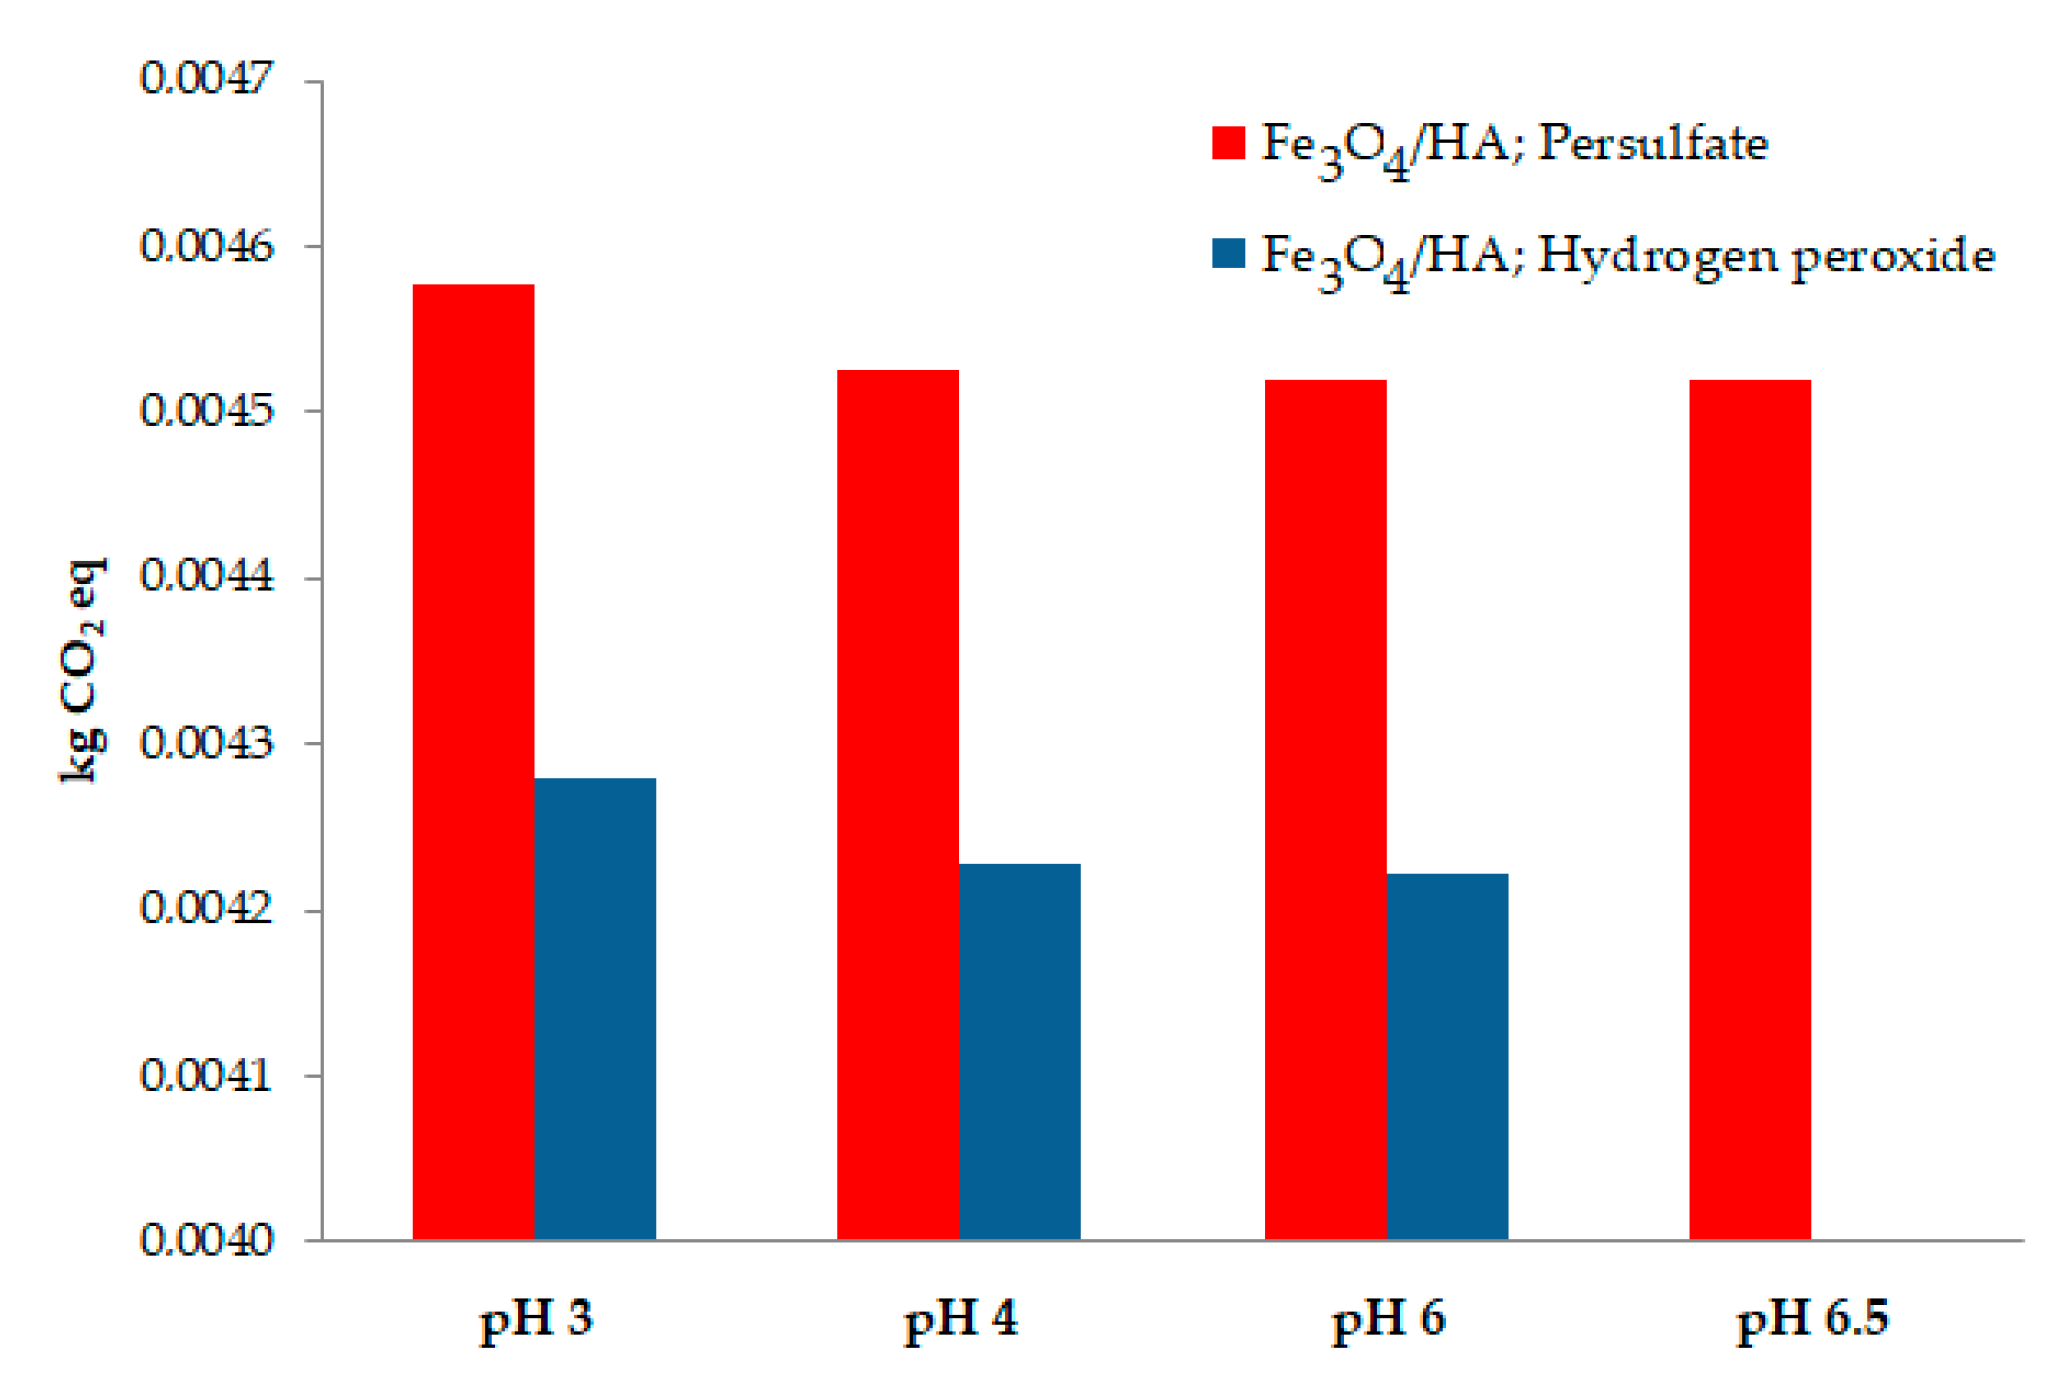
2.2.1. Comparative Study between Persulfate and Hydrogen Peroxide

A comparative LCIA of Fe3O4/HA (100 mg/L) as a heterogeneous photo-Fenton catalyst for the persulfate and hydrogen peroxide (1 mM) activation was performed, and the results are shown in Table 2 and Table 3, respectively. The impact of the catalyst, reagents, all chemicals for the pH adjustment (pH 3), and the subsequent neutralization as well as irradiation energy (UVA/UVB lamp), for the 90% bisphenol A (20 µM) removal from water, in 1 L scale, were considered. For the values of each impact category, a heat map introduces a color gradient that marks the results from red (major impacts) to green (more limited impacts).
For both systems of persulfate and hydrogen peroxide, the contribution of electricity on the final impacts is evident. This energy consumption derives from the electricity spent to irradiate the system (UVA/UVB lamp) and is directly proportional to the time required by the processes to degrade 90% of BPA (the greater the time required, the greater energy demand). For each impact category, more than 99% of the total impact is due to electricity. Taking into account the energy consumption (electricity input), it is clear therefore how the overall environmental impacts are directly proportional to the kinetic constants (k) deriving from degradations (see Table S1); the higher the value expressed by the kinetic constant, the higher the rate of degradation, which results in a better efficiency of the system. It can be observed how the working conditions of the degradation processes analyzed in Table 2 and Table 3 have k values among the highest and therefore can be considered examples of efficient processes. Despite what has just been observed, the high consumption of electricity, as highlighted by the LCA analysis, derives from the fact that at the laboratory scale, in order to activate the degradation reaction, it is necessary to use lamps that emit specific wavelengths (in this case, an UVA–UVB range). In summary, the energy demand to irradiate the system is therefore directly proportional to (a) the concentration of the pollutant, (b) the volume of water to be treated, and obviously (c) the effectiveness of the catalytic system.
Focusing our attention only on the impacts generated by the oxidants, it was observed that the input of persulfate has a slightly greater impact than hydrogen peroxide; in fact, for the four impact categories (CCP, ODP, TEP, and FEP), the impact related to H2O2 is lower (or similar) than the impact related to sulfuric acid, while in the case of persulfate, the impacts are always greater than those relative to sulfuric acid.
The impact of the humic acid coating was evaluated by comparing the coated magnetite with the pristine material (Fe3O4) for the activation of persulfate and hydrogen peroxide at different pH levels (3, 4, 6 and 6.5) as presented in Tables S2 and S3. A general trend similar to that reported for cases at pH 3 can be observed; the greatest impacts derive from the energy consumption, namely the energy consumption that increases when raising the pH (as degradation times slow down and a greater exposure to the light source is required to degrade BPA). At circumneutral pH, a decrease in impacts due to less use of sulfuric acid and sodium hydroxide is noted, as shown in more detail later. However, these minor impacts do not affect the final result.
As the trends of all the impact categories analyzed are similar, in the subsequent analyses only the results relating to the climate change potential category will be shown.

2.2.2. Climate Change Potential

The humic acid coating impact on the CCP was evaluated by comparing the degradation process performed in the presence of coated magnetite with the bare magnetite at different pH conditions, as shown in Figure 1. Moreover, the impact of using persulfate or hydrogen peroxide activation for BPA degradation was also evaluated in the presence of both materials. For all tested pH levels, we observed a higher CCP impact for the bare magnetite compared with the humic acid coated material for both persulfate and hydrogen peroxide at all tested pH conditions. This feature can be justified by the slower degradation that occur in the presence of the bare material. We also observed a CO2 emission increase in raising the pH level, due to a slower degradation rate in these conditions and a longer irradiation time needed (more energy consumed) to achieve the pollutant removal. In fact, when working in the presence of hydrogen peroxide at pH 6, an enormous impact for both materials was observed, while this effect was significantly lower in the presence of persulfate, even at pH 6.5.
When neglecting the electricity impact, it was observed that working at a circumneutral pH allows us to obtain a slightly lower impact, as presented in Figure 2. As expected, the degradation process shows a lower impact in raising the pH, due to the progressive lower chemicals used for the pH adjustment and the neutralization that is necessary to carry out the degradation. Additionally, neglecting the electricity impact, a significantly lower CO2 emission was estimated when using hydrogen peroxide comparing with persulfate.
Considering the lower CO2 emissions of the degradation system when using hydrogen peroxide instead of persulfate, the effect of raising the H2O2 concentration up to 20 mM at pH levels 3 and 4 was investigated; the obtained results are presented in Table 4. This choice aimed to investigate whether higher concentrations of H2O2 promote greater efficiency with more limited impacts (a higher rate of degradation and lower energy consumption). The results of the LCA analysis reported in Table 4 were obtained by taking into account the energy demand to irradiate the system. From the heat map, by identifying the best (in green) and worst (in red) values, it was possible to observe a lower CO2 emission for the degradation when performed at pH 3 than 4. Additionally, a lower impact was observed for those H2O2 concentrations that allowed for faster degradation kinetics, i.e., 1 mM and 10 mM, as presented in Table 5.
The effect of significantly raising the H2O2 concentration was more extensively evaluated by comparing the CCP analysis of the degradation system at the 1 and 10 mM concentrations (Table 6). The CO2 emission related to hydrogen peroxide is directly proportional to the amount of oxidant put in the solution. Therefore, the emission in the order of 10−5 kg, in the case of a concentration of H2O2 of 1 mM, was raised to 10−4 kg for a concentration of 10 mM. As shown in Table 6, a factor of 10 in increase does not affect the total impacts significantly, since about 99% of the CO2 emissions are due to energy consumption. Observing the data reported in Table 4, there is no clear decrease in the impacts passing from a concentration of 1 to 10 mM of H2O2. This aspect, therefore, does not justify the higher economic costs of working at higher concentrations in industrial applications.
The effect of the catalyst loading concentration was also evaluated. Table 7 shows the CCP results and the kinetic constants of the degradation processes performed with 1 mM of H2O2, at three different pH levels and with different catalyst concentrations (100, 200, and 500 mg/L). The results of the LCA analysis reported in Table 7 were obtained, taking into account the energy demand to irradiate the system. The lower CO2 emission was assessed for the BPA degradation when 500 mg/L of the catalyst was applied and the pH medium adjusted to 3. Due to the slow degradation rate observed at pH 6 (see Table 7), higher greenhouse gases emissions were estimated. However, increasing the catalyst loading leads to a decrease of CCP impact.
Table 8 shows the results of the LCA analysis for the processes conducted at pH 3, with a catalyst loading of 100 and 500 mg/L, as we aimed to investigate the role of the catalyst concentration on the final impact. From the BPA degradation process at different catalyst loadings, it was possible to observe a significant impact of the electricity consumption, which represent ≈ 94% of the global impact. Neglecting the energy contribution, it was possible to observe how using the catalyst at high concentrations involves a substantial CO2 emission. In addition, in this case this emission is directly proportional to the concentration of the catalyst. However, the contribution to the final impacts due solely to the catalyst is limited to 6%.
These data highlight how, by using high concentrations of the catalyst, an effective improvement of the system can be achieved by impacting the degradation kinetics and the environmental footprint. At the same time, the energy consumption, directly related to the efficiency of the system, plays a predominant role.
Furthermore, the potential environmental impacts that resulted from the higher catalyst loading can be mitigated by its reusability in consecutive water treatment cycles. Indeed, the previous reusability experiments, after magnetically recovering the Fe3O4/HA catalyst, showed no significant activity decrease until the third consecutive catalytic cycle [11]. These experiments performed at a laboratorial scale do not allow for an estimation of the environmental impact related to the catalyst recovery; however, on a larger scale (pilot plant or industrial level), this process should be automated and should therefore lead to additional (presumably limited) energy consumption.

3. Materials and Methods

The assessment of environmental impacts was carried out with data obtained at the laboratory level; for more information beyond the LCA analysis, please refer to the work of Gonçalves et al. [11].
The environmental impacts were estimated throughout the LCA analysis, which was performed according to the ISO 14040/44 guidelines [19,20]. The LCA process consists of 4 phases: goal and scope definition, life cycle inventory (LCI), life cycle impact assessment (LCIA), and results interpretation.

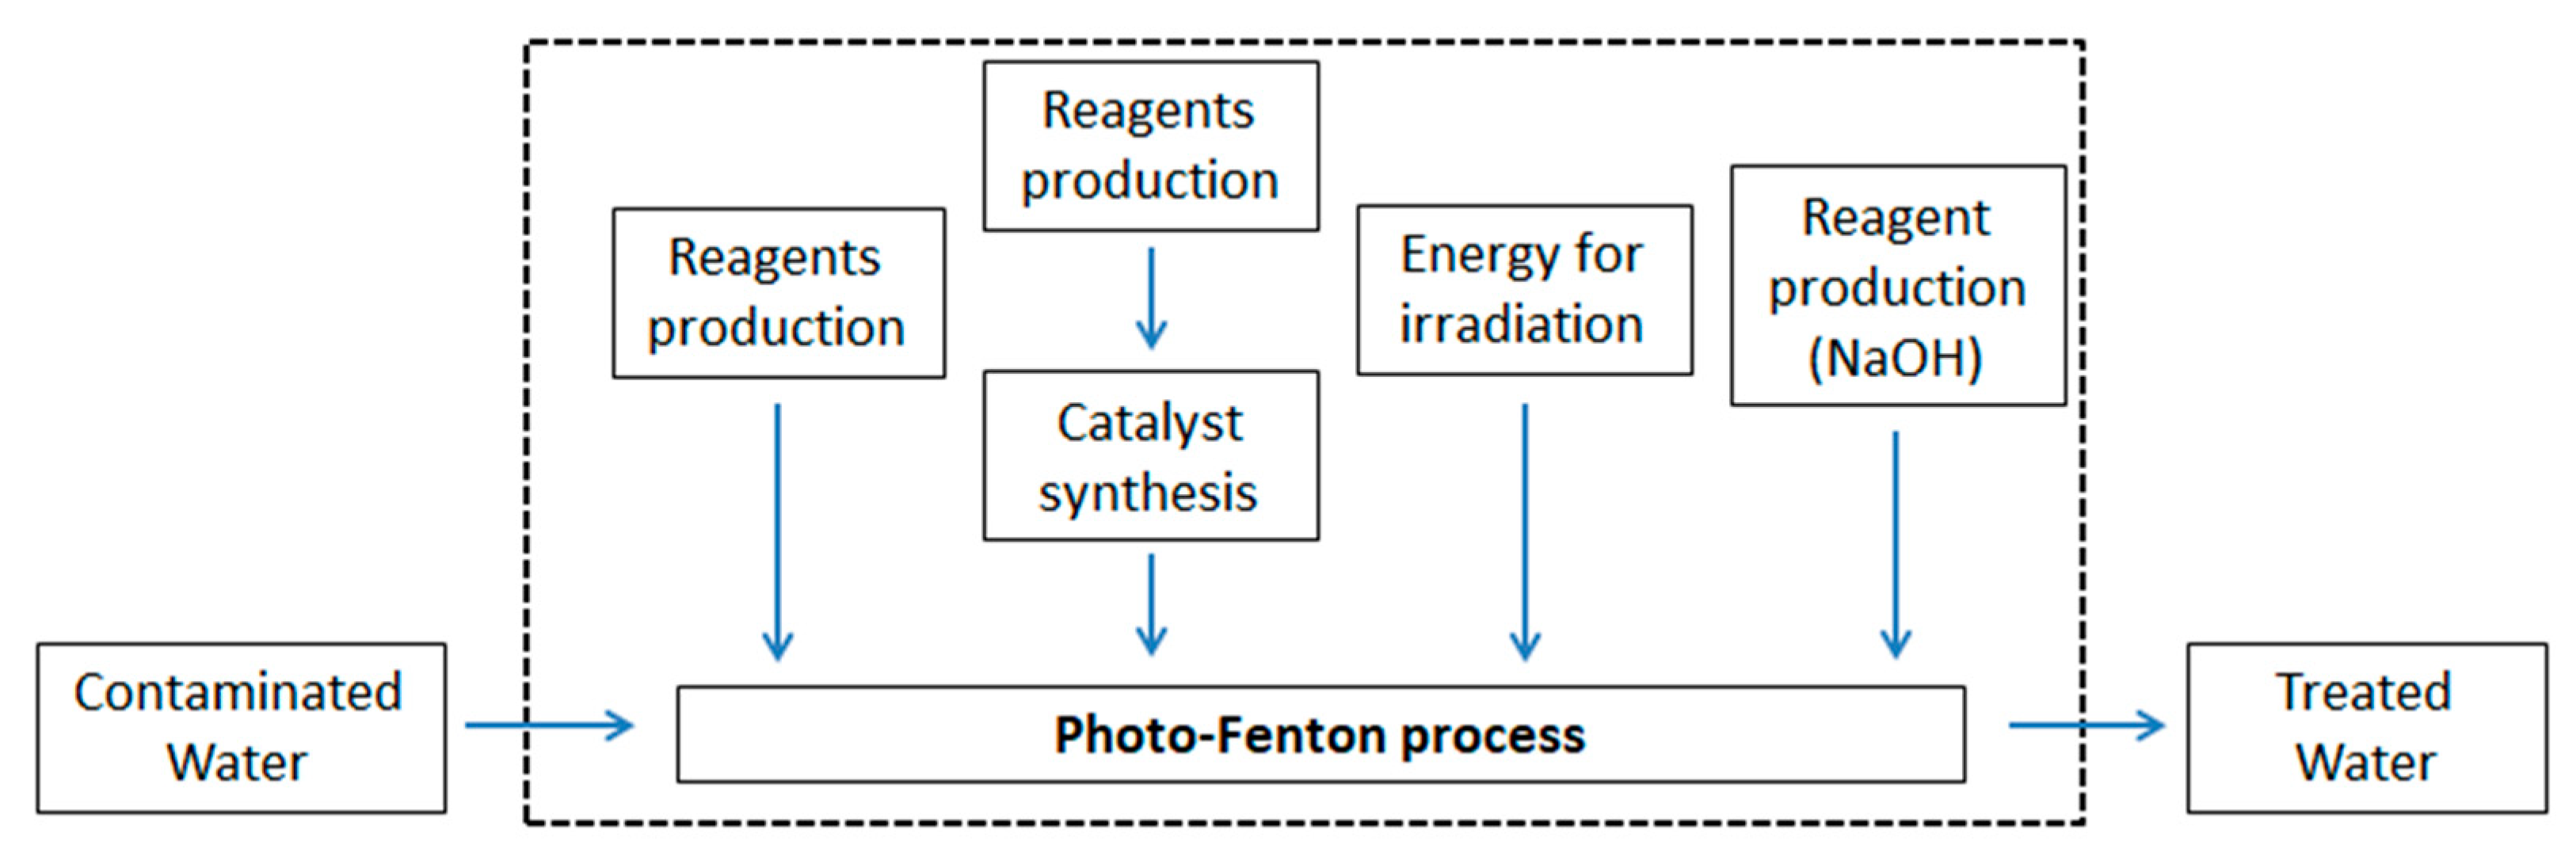
3.1. Goal and Scope Definition

The goal of the present study is to assess the environmental impacts of the use of photo-Fenton processes to treat polluted water. In detail, the environmental performances of magnetite particles coated with humic acid for their application as heterogeneous photo-Fenton processes were investigated using bisphenol A as the pollutant model molecule. For this, the environmental impact of different experimental conditions was considered, namely the effect of humic acid coating, the catalyst loading, and the type and oxidant loading at different pH levels.
To perform the degradation process, a solution of the oxidant and the heterogeneous catalyst were added to the polluted water (water contaminated with bisphenol A with an initial concentration of 20 μM); for the light source, an UVA/UVB lamp was applied. The removal of 90% BPA from 1 L of Milli-Q water was chosen as the functional unit. The obtained information can give insights into future industrial applications for water remediation in water or wastewater treatment plants.
Figure 3 reports the system boundaries considered for the study. The unit processes included are (a) the production of each chemical reagents (H2SO4, H2O2, etc.), starting from the extraction of the resources, the production of the chemicals, and transport; (b) the synthesis of the catalyst, where the entire synthesis process was modeled using both the data directly measured and data obtained from literature; (c) the production of electricity consumed by the different configurations of the degradation processes, including extraction of resources, transport, and energy conversion; and (d) the production of sodium hydroxide as the last unit process, used for neutralization before water discharge.
The amount of energy to reduce the initial concentration of the target pollutant by 90% was determined by the kinetic constant (k). The necessary time to degrade 90% of the pollutant and consequently the energy necessary to irradiate the system for the same time was determined from the k value. The infrastructure and equipment used during the experimental analysis were excluded from the calculation.
The main assumptions were made to model the catalyst synthesis. As reported by Gonçalves et al. [11], the catalyst was synthesized with commercial humic acids, but given the lack of information on the humic acid production process, it was decided that the procedure described by Montoneri et al. [21] would be reconstructed. The decision allowed us to effectively model the recovery of humic substances from the compost obtained from organic wastes in order to have information on the associated impacts; at the same time, given the absence of a unique structure of humic acids, their behavior should not be influenced by their origin.
To estimate the energy consumption associated with the heating step in both humic substances extraction and catalyst synthesis, the instructions given by Piccinno et al. [22] were followed. The energy consumption was estimated by assuming the ad hoc reactors and by using the equations that allow us to quantify the heat needed to reach a certain temperature and to compensate for the losses due to the reaction [22]. This was done due to the high energy input values directly measured at the laboratory level. In fact, the tools used for following the extraction and synthesis procedures are not designed exclusively for these purposes, and therefore a large amount of energy was wasted.

3.2. Inventory Analysis

The second step of the LCA consists of creating a model of the real system under analysis by collecting all the raw materials, resources, energy, outputs, and emission related to the considered functional unit.
The extraction of 1 kg of humic substances from the compost was modeled using the data reported in Table 9. It was decided that this system would be modeled with a cut-off approach [23]; we considered the transport of the compost from the production plant to the Turin laboratory as the “cradle” of the humic substances production. Any input and output related to the previous life of the materials that have given an origin to the compost and the processes themselves to obtain the compost have been neglected. Basically, based on the cut-off principle, we consider the compost as waste, and waste does not bear any environmental burden from the previous life.
The data used for modeling the synthesis of the magnetite particles are reported in Table 10. The only difference in the synthesis procedure between Fe3O4/HA and Fe3O4 particles is the presence of humic acid for the coated particles.
Table 11 reports the data on chemicals and energy consumption per functional unit. The tested variables were the pH, type of oxidant, and type of catalyst. The amount of catalyst used is the same both for the processes with Fe3O4/HA and with Fe3O4. The quantity of sodium hydroxide refers to the quantity theoretically added to the treatment to restore the natural pH. The energy consumption refers to the energy spent to irradiate the system and is directly proportional to the kinetic constant. The kinetic constant values were determined by degradation experiments [11]; the lower the k value, the faster the degradation is, and therefore the more effective the process is, as presented in the Table S1.
Another set of experiments was conducted by varying the concentration of hydrogen peroxide; considering the low efficiency above pH 4, these tests were carried out at pH 3 and 4. The variables kept constant were the type and concentration of the catalyst. Input values are reported in Table 12. Table 5 shows the kinetic constant collected for this set of experiments.
The effect of catalyst loading was evaluated as well for the activation of hydrogen peroxide as shown in Table 13. The kinetic constant values are reported in Table 8.
In general, the data presented in the Ecoinvent 3.3 database were used as input to model the system; for the production of chemicals, reference was made to the European context (when present), while the Italian energy mix was used instead to model the energy consumption.

3.3. Life Cycle Impact Assessment

The inputs and outputs collected that make up the inventory were transformed into a handful of environmental impact categories. SimaPro 8.2 was used for LCA modeling, and environmental impacts were estimated according to two different methods: the ReCiPe 2008 method [24] and the cumulative energy demand method [25]. The ReCiPe 2008 method includes both the midpoint (problem oriented) and endpoint (damage oriented) impact categories; in other words, midpoints are considered to be a point between the emission and the endpoint in the cause–effect chain of a particular impact category [26]. In general, indicators that are chosen close to the inventory result (midpoint) have a lower uncertainty, as only a small part of the environmental mechanism needs to be modeled, while indicators near the endpoint level can have significant uncertainties. Given the high number of impact categories analyzed by the ReCiPe method at the midpoint level, it has been preferred to use a limited group of impact categories. The most widely used impact categories chosen for this study were the climate change potential (CCP, kg CO2 eq), ozone depletion potential (ODP, kg CFC-11 eq), terrestrial acidification potential (TAP, kg SO2 eq), and freshwater eutrophication potential (FEP, kg P eq). For the assessment of energy consumption, only the impact category relating to non-renewable (fossil) resources was considered (NREU, MJ); inputs based on renewable energy were not taken into account, as these were regarded as sustainable.

4. Conclusions

As the advanced oxidation processes and specifically heterogeneous photo-Fenton processes have been established as viable and effective approaches for waste water treatment, it becomes fundamental to assess also their environmental sustainability. This assessment should allow us to avoid the risks of rebound effects that offset the environmental gains. In this work, the methodology of life cycle assessment was applied to identify the hotspots of using Fe3O4/HA as a heterogeneous photo-Fenton catalyst for water remediation.
The addition of humic substances proved to improve the operational effectiveness of the catalyst without significant environmental impacts, despite the use of energy and chemicals during the extraction of HA.
The environmental impacts of all the conditions that affect the photo-Fenton process were also considered, while also highlighting the significant impact due to energy consumption mainly due to irradiation. In fact, the energy consumption is significant above all for processes with a lower efficiency and which therefore require a longer irradiation time to degrade the target molecule. The contribution of pH adjustment and subsequent neutralization was highlighted by neglecting the energy consumption. It was observed that actually working at an almost neutral pH allows environmental impacts to be limited; this, however, involves a reduction in the efficiency of the processes.
Even if persulfate proved to promote a faster BPA removal at a higher pH in relation to hydrogen peroxide, the last proved to be more environmentally friendly due to the lower impacts associated with its production.
The higher efficiency observed in increasing the catalyst concentration evidenced a decrease in environmental impacts, which is very encouraging considering the potential reusability of the catalyst [11].
It should be pointed out that although the modeling of the degradation processes reported here are based on a laboratory scale, it can still give insights into larger scale applications. In fact, at the laboratory level, the impact of the energy to irradiate the system is high and is proportional to the time required to treat a certain amount of water. If the constraint of a certain volume of water to be treated daily remains, a hypothetical system that does not require electricity to operate (e.g., solar plant like compound parabolic collector—CPC [27]) must be large enough to allow for a daily treatment of this volume. Therefore, the impacts associated with electricity consumption would be converted into impacts resulting from the amount of steel and square meters of soil needed to build a plant of adequate size.
In conclusion, working at milder conditions (circumneutral pH) would effectively limit environmental impacts, but the benefits deriving from these conditions can only be perceived if the process has a high degradative efficiency. In fact, if the process is fast from the kinetic point of view, it allows us to limit the energy consumption or the size of the system to treat the desired volume of water. For a more comprehensive analysis, the work developed here can be integrated, taking into account the environmental impacts (mainly related to toxicity) of the pollutants present in the water and also the contributions due to the by-products of the degradation reaction. In this way, it will be possible to obtain a more precise idea of how much it is worth pushing the degradation process, in order to not generate rebound effects.

Supplementary Materials

The following are available online at https://0-www-mdpi-com.brum.beds.ac.uk/2073-4344/10/7/771/s1, Table S1: Kinetic constant (k) for the degradation processes changing different parameters: pH, catalyst type (Fe3O4/HA and Fe3O4) and type of oxidant (persulfate and hydrogen peroxide); Table S2: Impact at midpoint level for the degradation process of 90% of 20 μM BPA in 1 L of water. The used catalyst was Fe3O4/HA (100 mg/L). The processes were carried out changing pH and type of oxidant: persulfate and hydrogen peroxide (both at a concentration of 1 mM); Table S3: Impact at midpoint level for the degradation process of 90% of 20 μM BPA in 1 L of water. The used catalyst was bare Fe3O4 (100 mg/L). The processes were carried out changing pH and type of oxidant: persulfate and hydrogen peroxide (both at a concentration of 1 mM).

Author Contributions

Conceptualization, A.B.P., M.C., and N.P.F.G.; methodology, M.C.; software, M.C.; validation, M.C., N.P.F.G., and A.B.P.; formal analysis, M.C. and N.P.F.G.; investigation, M.C.; resources, N.P.F.G.; data curation, M.C. and N.P.F.G.; writing—original draft preparation, M.C., N.P.F.G., and A.B.P.; writing—review and editing, N.P.F.G., A.B.P., and M.C.; visualization, M.C. and N.P.F.G.; supervision, A.B.P.; project administration, A.B.P.; funding acquisition, A.B.P. All authors have read and agreed to the published version of the manuscript.

Funding

This work is part of a project that has received funding from the European Union’s Horizon 2020 research and innovation program under the Marie Skłodowska-Curie Grant Agreement No. 765860 (AQUAlity).

Conflicts of Interest

The authors declare no conflict of interest.

References

  1. Giannakis, S.; Gamarra Vives, F.A.; Grandjean, D.; Magnet, A.; De Alencastro, L.F.; Pulgarin, C. Effect of advanced oxidation processes on the micropollutants and the effluent organic matter contained in municipal wastewater previously treated by three different secondary methods. Water Res. 2015, 84, 295–306. [Google Scholar] [CrossRef] [PubMed]
  2. Stefan, M.I. Advanced Oxidation Processes for Water Treatment: Fundamentals and Applications, 1st ed.; IWA Publishing: London, UK, 2018. [Google Scholar]
  3. World Water Council. Available online: https://www.worldwatercouncil.org/en/water-crisis (accessed on 30 April 2020).
  4. Liu, J.; Mooney, H.; Hull, V.; Davis, S.J.; Gaskell, J.; Hertel, T.; Lubchenco, J.; Seto, K.C.; Gleick, P.; Kremen, C.; et al. Systems integration for global sustainability. Science 2015, 347, 1258832. [Google Scholar] [CrossRef] [PubMed] [Green Version]
  5. Davididou, K.; Monteagudo, J.M.; Chatzisymeon, E.; Durán, A.; Expósito, A.J. Degradation and mineralization of antipyrine by UV-A LED photo-Fenton reaction intensified by ferrioxalate with addition of persulfate. Sep. Purif. Technol. 2017, 172, 227–235. [Google Scholar] [CrossRef] [Green Version]
  6. Fiorenza, R.; Balsamo, S.A.; D’Urso, L.; Sciré, S.; Brundo, M.V.; Pecoraro, R.; Scalisi, E.M.; Privitera, V.; Impellizzeri, G. CeO2 for Water Remediation: Comparison of Various Advanced Oxidation Processes. Catalysts 2020, 10, 446. [Google Scholar] [CrossRef] [Green Version]
  7. Malato, S.; Fernandez-Ibanez, P.; Maldonado, M.I.; Blanco, J.; Gernjak, W. Decontamination and Disinfection of Water by Solar Photocatalysis: Recent Overview and Trends. Catal. Today 2009, 147, 1–59. [Google Scholar] [CrossRef]
  8. García-Ballesteros, S.; Grimalt, J.; Berto, S.; Minella, M.; Laurenti, E.; Vicente, R.; López-Pérez, M.F.; Amat, A.M.; Bianco Prevot, A.; Arques, A. New route for valorization of oil mill wastes: Isolation of humic-like substances to be employed in solar-driven processes for pollutants removal. ACS Omega 2018, 3, 13073–13080. [Google Scholar] [CrossRef] [PubMed]
  9. Lastre-Acosta, A.M.; Vicente, R.; Mora, M.; Jáuregui-Haza, U.J.; Arques, A.; Teixeira, A.C.S.C. Photo-Fenton reaction at mildly acidic conditions: Assessing the effect of bio-organic substances of different origin and characteristics through experimental design. J. Environ. Sci. Health A 2019, 54, 711–772. [Google Scholar] [CrossRef]
  10. Feijoo, S.; González-Rodríguez, J.; Fernández, L.; Vázquez-Vázquez, C.; Feijoo, G.; Moreira, M.T. Fenton and Photo-Fenton Nanocatalysts Revisited from the Perspective of Life Cycle Assessment. Catalysts 2020, 10, 23. [Google Scholar] [CrossRef] [Green Version]
  11. Gonçalves, N.P.F.; Minella, M.; Mailhot, G.; Brigante, M.; Bianco Prevot, A. Photo-activation of persulfate and hydrogen peroxide by humic acid coated magnetic particles for Bisphenol A degradation. Catal. Today 2019. [Google Scholar] [CrossRef]
  12. Chatzisymeon, E.; Foteinis, S.; Mantzavinos, D.; Tsoutsos, T. Life cycle assessment of advanced oxidation processes for olive mill wastewater treatment. J. Clean. Prod. 2013, 54, 229–234. [Google Scholar] [CrossRef] [Green Version]
  13. Giménez, J.; Bayarri, B.; González, Ó.; Malato, S.; Peral, J.; Esplugas, S. Advanced oxidation processes at laboratory scale: Environmental and economic impacts. ACS Sustain. Chem. Eng. 2015, 3, 3188–3196. [Google Scholar] [CrossRef]
  14. Muñoz, I.; Rodríguez, A.; Rosal, R.; Fernández-Alba, A.R. Life Cycle Assessment of urban wastewater reuse with ozonation as tertiary treatment. Sci. Total Environ. 2009, 407, 1245–1256. [Google Scholar] [CrossRef] [PubMed]
  15. Gallego-Schmid, A.; Tarpani, R.R.Z.; Miralles-Cuevas, S.; Cabrera-Reina, A.; Malato, S.; Azapagic, A. Environmental Assessment Solar Photo-Fenton processes in combination with nanofiltration for the removal of micro-contaminants from real wastewaters. Sci. Total Environ. 2019, 650, 2210–2220. [Google Scholar] [CrossRef] [PubMed]
  16. Montoneri, E.; Bianco Prevot, A.; Avetta, P.; Arques, A.; Carlos, L.; Magnacca, G.; Laurenti, E.; Tabasso, S. Food Wastes Conversion to Products for Use in Chemical and Environmental Technology, Material Science and Agriculture. ChemInform Abstr. 2013, 46. [Google Scholar] [CrossRef]
  17. Nisticò, R.; Bianco Prevot, A.; Magnacca, G.; Canone, L.; García-Ballesteros, S.; Arques, A. Sustainable magnetic materials (from chitosan and municipal biowaste) for the removal of diclofenac from water. Nanomaterials 2019, 9, 1091. [Google Scholar] [CrossRef]
  18. Gonçalves, N.P.F.; Minella, M.; Fabbri, D.; Calza, P.; Malitesta, C.; Mazzotta, E.; Bianco Prevot, A. Humic Acid Coated Magnetic Particles as Highly Efficient Heterogeneous Photo-Fenton Materials for Wastewater Treatments. Chem. Eng. J. 2020, 390, 124619. [Google Scholar] [CrossRef]
  19. ISO. Environmental Management—Life Cycle Assessment—Principles and Framework; vol. EN ISO 14040:2006; International Organisation for Standardisation: Brussels, Belgium, 2006. [Google Scholar]
  20. ISO. Environmental Management—Life Cycle Assessment—Requirements and Guidelines; vol. EN ISO 14044:2006; International Organisation for Standardisation: Brussels, Belgium, 2006. [Google Scholar]
  21. Montoneri, E.; Boffa, V.; Savarino, P.; Perrone, D.G.; Musso, G.; Mendichi, R.; Chierotti, M.R.; Gobetto, R. Biosurfactants from Urban Green Waste. ChemSusChem 2009, 239–247. [Google Scholar] [CrossRef]
  22. Piccinno, F.; Hischier, R.; Seeger, S.; Som, C. From laboratory to industrial scale: A scale-up framework for chemical processes in life cycle assessment studies. J. Clean. Prod. 2016, 135, 1085–1097. [Google Scholar] [CrossRef]
  23. Shen, L.; Worrell, E.; Patel, M.K. Open-loop recycling: A LCA case study of PET bottle-to-fibre recycling. Resour. Conserv. Recy. 2010, 55, 34–42. [Google Scholar] [CrossRef]
  24. Goedkoop, M.; Heijungs, R.; Huijbregts, M.; De Schryver, A.; Struijs, J.; Van Zelm, R. Recipe 2008: A Life Cycle Impact Assessment Method Which Comprises Harmonised Category Indicators at the Midpoint and the Endpoint Level; Ministry of Housing Spatial Planning and the Environment: The Hague, The Netherlands, 2009. [Google Scholar]
  25. Frischknecht, R.; Editors, N.J.; Althaus, H.; Bauer, C.; Doka, G.; Dones, R.; Hischier, R.; Hellweg, S.; Köllner, T.; Loerincik, Y.; et al. Implementation of Life Cycle Impact Assessment Methods. Ecoinvent Report No. 3, v2.0; Swiss Centre for Life Cycle Inventories: Dübendorf, The Netherlands, 2007. [Google Scholar]
  26. Bare, J.; Hofstetter, P.; Pennington, D.; Haes, H. Midpoints Versus Endpoints: The Sacrifices and Benefits. Int. J. Life Cycle Ass. 2012, 5, 319–326. [Google Scholar] [CrossRef] [Green Version]
  27. Malato, S.; Blanco, J.; Vidal, A.; Alarcón, D.; Maldonado, M.; Caceres, J.; Gernjak, W. Applied Studies in Solar Photocatalytic Detoxification: An Overview. Sol. Energy 2003, 75, 329–336. [Google Scholar] [CrossRef]
Figure 1. Comparison of the climate change potential (kg CO2 eq) results of the degradation processes conducted by varying different parameters of pH and oxidants (persulfate and hydrogen peroxide as well as catalyst type Fe3O4/humic acid (HA) and bare Fe3O4).
Catalysts 10 00771 g001
Figure 2. Comparison of the climate change potential (kg CO2 eq) results of the degradation processes neglecting the electricity input. The bars report the results obtained by varying two parameters, the pH and oxidant (persulfate and hydrogen peroxide (1.0 mM)) in the presence of Fe3O4/HA (100 mg/L).
Catalysts 10 00771 g002
Figure 3. System boundary for the heterogeneous photo-Fenton processes. Only the unit processes contained in the dashed box were considered during the life cycle assessment (LCA) analysis.
Catalysts 10 00771 g003
Table 1. Impact at the midpoint level for the synthesis process of 1 kg of the catalyst (Fe3O4/HA).
FeCl3FeSO4NH3N2HAWaterHeat and StirringDryingCentrifugationDrying
CCP
kg CO2 eq
2.6250.4382.5455.7310.2031.0 × 10−71.4277.9973.19911.107
ODP
kg CFC11 eq
1.2 × 10−63.4 × 10−85.1× 10−75.9 × 10−73.3 × 10−85.8 × 10−111.6 × 10−79.0 × 10−73.6 × 10−71.2 × 10−6
TEP
kg SO2 eq
1.4 × 10−22.5 × 10−31.5 × 10−22.4 × 10−21.9 × 10−33.0 × 10−65.6 × 10−33.1 × 10−21.3 × 10−24.4 × 10−2
FEP
kg P eq
1.8 × 10−33.3 × 10−42.1 × 10−44.9 × 10−38.9 × 10−52.8 × 10−74.1 × 10−42.3 × 10−39.1 × 10−43.2 × 10−3
NREU
MJ
29.225.0943.3766.473.380.00918.24102.2340.89141.99
Table 2. Impact at the midpoint level for the degradation process of 90% of 20 μM BPA in 1 L of water in the presence of Fe3O4/HA (100 mg/L) and persulfate (1 mM) at pH 3.
TotalS2O82−H2SO4Fe3O4/HANaOHElectricity
CCP
kg CO2 eq
0.7143.41 × 10−47.91 × 10−63.52 × 10−34.97 × 10−57.10 × 10−1
ODP
kg CFC−11 eq
8.02 × 10−89.19 × 10−113.17 × 10−125.03 × 10−102.98 × 10−117.96 × 10⁻⁸
TEP
kg SO2 eq
0.0032.76 × 10−63.18 × 10−71.52 × 10−52.44 × 10−72.80 × 10−3
FEP
kg P eq
0.00021.94 × 10−79.73 × 10−91.42 × 10−62.99 × 10−82.03 × 10−4
NREU
MJ
9.1325.33 × 10−33.16 × 10−44.51 × 10−25.53 × 10−49.08
Table 3. Impact at the midpoint level for the degradation process of 90% of 20 μM BPA in 1 L of water in the presence of Fe3O4/HA (100 mg/L) and hydrogen peroxide (1 mM) at pH 3.
TotalH2O2H2SO4Fe3O4/HANaOHElectricity
CCP
kg CO2 eq
7.25 × 10−14.19 × 10−57.91 × 10−63.53 × 10−34.97 × 10−57.21 × 10−1
ODP
kg CFC−11 eq
8.14× 10−83.80 × 10−123.17 × 10−125.03 × 10−102.98 × 10−118.09 × 10⁻⁸
TEP
kg SO2 eq
3.0× 10−31.69 × 10−73.18 × 10−71.52 × 10−52.44 × 10−72.85 × 10−3
FEP
kg P eq
2.0 × 10−41.54 × 10−89.73 × 10−71.42 × 10−62.99 × 10−82.06 × 10−4
NREU
MJ
9.276.55 × 10−43.16 × 10−44.51 × 10−25.53 × 10−49.22
Table 4. Comparison of the CCP (kg CO2 eq) degradation processes results at different H2O2 concentrations in the presence of Fe3O4/HA (100 mg/L) as a catalyst, performed at pH levels 3 and 4.
kg CO2 eqH2O2 Concentration
0 mM0.5 mM1 mM2 mM3 mM5 mM10 mM20 mM
pH 345.8941.0970.7260.9220.9600.8540.7001.082
pH 476.4877.6524.1761.6431.5342.0901.0021.062
Table 5. Kinetic constant (k) for the degradation processes at different H2O2 concentrations at pH 3 and 4 in the presence of Fe3O4/HA as a catalyst. The higher the value expressed by the kinetic constant, the higher the rate of degradation, which results in a better efficiency of the system.
k (min−1)H2O2 Concentration
0 mM0.5 mM1 mM2 mM3 mM5 mM10 mM20 mM
pH 30.00050.0210.0320.0250.0240.0270.0330.021
pH 40.00030.0030.0060.0140.0150.0110.0230.022
Table 6. Comparison of the climate change potential (kg CO2 eq) results of the degradation process of 90% of 20 μM BPA in 1 L of water in the presence of 1mM and 10 mM of H2O2 activated by Fe3O4/HA (100 mg/L) at pH 3.
CCP kg CO2 eqTotalH2O2H2SO4Fe3O4/HANaOHElectricity
[H2O2] = 1 mM0.7264.19 × 10−57.91 × 10−63.53 × 10−34.97 × 10−50.722
[H2O2] = 10 mM0.6994.19 × 10−47.91 × 10−63.53 × 10−34.97 × 10−50.695
Table 7. Kinetic constant for the degradation and comparison of the CCP (kg CO2 eq) results of degradation processes at different Fe3O4/HA concentrations in the presence of H2O2 (1 mM) at different pH levels.
Catalyst Concentration (mg/L)
100200500
kkg CO2 eqkkg CO2 eqkkg CO2 eq
pH 30.03180.72580.0470.49670.0770.3190
pH 40.00554.17600.0211.10100.0102.3154
pH 60.001515.0990.0037.65670.0045.7571
Table 8. Comparison of the climate change potential (kg CO2 eq) results of the degradation process of 90% of 20 μM BPA in 1 L of water, between the processes conducted using a catalyst concentration of 100 and 500 mg/L, with the pH and oxidant concentration being pH 3 and hydrogen peroxide (1 mM) respectively.
CCP kg CO2 eqTotalH2O2H2SO4Fe3O4/HANaOHElectricity
100 mg/L0.7264.19 × 10−57.91 × 10−63.53 × 10−34.97 × 10−50.722
500 mg/L0.3164.19 × 10−57.91 × 10−61.76 × 10−24.97 × 10−50.298
Table 9. Inventory for the extraction process of 1 kg of humic substances from the compost, according to [21,22].
InputAmountUnit of MeasureType of Measure
Transport0.075tkmdirectly measured
NaOH39.997gestimated value 1
Na4P2O7265.9gdirectly measured
Energy for heating and stirring5140kJestimated value 1
Energy for centrifugation0.166kWhdirectly measured
Distilled water60Ldirectly measured
H2SO41390gdirectly measured
Energy for centrifugation0.166kWhdirectly measured
Distilled water30Ldirectly measured
Energy to dry2880kJestimated value 1
1 Value estimated according to the equation reported in [22].
Table 10. Inventory for the synthesis of 1 kg of magnetite particles (Fe3O4/HA), according to [8,22].
InputAmountUnit of MeasureType of Measure
FeCl32581.366gdirectly measured
FeSO41678.950gdirectly measured
Distilled water106.336Ldirectly measured
Energy for heating and stirring10,312.590kJestimated value 1
Humic acid 2100.317gdirectly measured
NH3882.789gdirectly measured
Energy to dry57,782.590kJestimated value 1
Energy for centrifugation6.420kWhdirectly measured
Energy to dry80,253.60kJestimated value 1
N221,467.840gdirectly measured
1 Value estimated according to the equation reported in [22]. 2 For the synthesis of bare Fe3O4, the input of humic acid is not considered.
Table 11. Inventory of the input related to the treatment of 1 L of Milli-Q water contaminated with BPA (20 μM).
Oxidant Type:S2O82−H2O2
pH 3Oxidant (g)0.2380.034
Catalyst (g)0.1000.100
Sulfuric acid (g)0.0490.049
Sodium hydroxide (g)0.0400.040
Catalyst type:Fe3O4/HAFe3O4Fe3O4/HAFe3O4
Energy consumption (kWh)1.4252.1511.4483.154
pH 4Oxidant (g)0.2380.034
Catalyst (g)0.1000.100
Sulfuric acid (g)0.0050.005
Sodium hydroxide (g)0.0040.004
Oxidant type:Fe3O4/HAFe3O4Fe3O4/HAFe3O4
Energy consumption (kWh)2.6013.0498.37311.808
pH 6Oxidant (g)0.2380.034
Catalyst (g)0.1000.100
Sulfuric acid (g)4.9 × 10−54.9 × 10−5
Sodium hydroxide (g)4 × 10−54 × 10−5
Catalyst type:Fe3O4/HAFe3O4Fe3O4/HAFe3O4
Energy consumption (kWh)2.9905.23330.29741.865
pH 6.5Oxidant (g)0.238
Catalyst (g)0.1
Sulfuric acid (g)1.96 × 10⁻⁵
Sodium hydroxide (g)1.6 × 10⁻⁵
Catalyst type:Fe3O4/HAFe3O4
Energy consumption (kWh)6.0597.427
Note: The tested variables were pH the (3, 4, 6, 6.5), oxidant type (S2O82− and H2O2), and catalyst type (Fe3O4/HA and bare Fe3O4).
Table 12. Inventory of the input for the treatment of 1 L of Milli-Q water contaminated with BPA (20 μM) in the presence of different H2O2 concentrations catalyzed by Fe3O4/HA (100 mg/L) at pH 3 and 4.
Oxidant Concentration0 mM0.5 mM1 mM2 mM3 mM5 mM10 mM20 mM
pH 3H2O2 (g)00.0170.0340.0680.1020.1700.3400.680
Catalyst (g)0.10.10.10.10.10.10.10.1
Sulfuric acid (g)0.0490.0490.0490.0490.0490.0490.0490.049
Sodium hydroxide (g)0.040.040.040.040.040.040.040.04
Energy consumption (kWh)92.1032.1931.4481.8421.9191.7061.3962.162
pH 4H2O2 (g)00.0170.0340.0680.1020.1700.3400.680
Catalyst (g)0.10.10.10.10.10.10.10.1
Sulfuric acid (g)0.00490.00490.00490.00490.00490.00490.00490.0049
Sodium hydroxide (g)0.0040.0040.0040.0040.0040.0040.0040.004
Energy consumption (kWh)153.50615.3518.3733.2893.0704.1872.0022.122
Table 13. Inventory of the input related for the treatment of 1 L of Milli-Q water contaminated with BPA (20 μM) in the presence of different Fe3O4/HA loadings (from 100 to 500 mg/L at pH 3, 4, and 6 in the presence of 1mM of H2O2).
Catalyst Concentration100 mg/L200 mg/L500 mg/L
pH 3H2O2 (g)0.0340.0340.034
Catalyst (g)0.10.20.5
Sulfuric acid (g)0.0490.0490.049
Sodium hydroxide (g)0.040.040.04
Energy consumption (kWh)1.4480.9800.598
pH 4H2O2 (g)0.0340.0340.034
Catalyst (g)0.10.20.5
Sulfuric acid (g)0.0050.0050.005
Sodium hydroxide (g)0.0040.0040.004
Energy consumption (kWh)8.3732.1934.605
pH 6H2O2 (g)0.0340.0340.034
Catalyst (g)0.10.20.5
Sulfuric acid (g)4.9 × 10−54.9 × 10−54.9 × 10⁻⁵
Sodium hydroxide (g)4 × 10−54 × 10−54 × 105
Energy consumption (kWh)30.29715.35111.513

