Article

Understanding of the Key Factors Determining the Activity and Selectivity of CuZn Catalysts in Hydrogenolysis of Alkyl Esters to Alcohols

1
Technopark Kralupy, University of Chemistry and Technology Prague, nám. G. Karse 7/2, 278 01 Kralupy nad Vltavou, Czech Republic
2
Department of Petroleum Technology and Alternative Fuels, University of Chemistry and Technology Prague, Technická 5, Praha 6, 166 28 Dejvice, Czech Republic
*
Author to whom correspondence should be addressed.
Submission received: 28 October 2021 / Revised: 11 November 2021 / Accepted: 19 November 2021 / Published: 22 November 2021

Abstract

:
CuZn catalysts are perspective catalysts for esters hydrogenolysis, but more knowledge is needed to optimize their catalytic performance. In this work, we consider the impact of CuZn catalysts composition on their structure, activity, selectivity, and stability in esters hydrogenolysis. Four catalysts with various Cu/Zn ratio were synthesized by a co-precipitation and characterized in as-prepared, calcined, reduced, and spent state by XRF, XRD, N2 physisorption, CO2-TPD, NH3-TPD, and N2O chemisorption. XRD data revealed the effect of the composition on the size of Cu and ZnO particles. The catalytic performance was investigated using an autoclave. All catalysts exhibited high methyl hexanoate conversion about 48–60% after 3 h but their activity and selectivity were found to be dependent on Cu/Zn ratio. The conversion of methyl hexanoate and hexyl hexanoate was compared to explain the observed product selectivity. Moreover, the catalysts stability was investigated in three consecutive reaction cycles and correlated with changes in the size of constituent particles. Moreover, when different esters were tested, a slight decrease in conversion and increase in alcohol selectivity with a growth in molecule size was observed. Obtained results allow making a conclusion about the optimal composition that provides the good performance of CuZn catalysts in ester hydrogenolysis.

Graphical Abstract

1. Introduction

The hydrogenolysis of carboxylic acid esters is a reaction of great commercial attractiveness. It allows selective production of corresponding alcohols and their derivatives that can further be used as raw materials in the production of surfactants, plasticizers, cosmetics, and other chemicals [1,2,3]. For several decades, the process of obtaining alcohols from carboxylic acid esters has been based on employing traditional and highly efficient Adkins catalysts, which include copper as an active metal and Cr2O3 (ca. 40–50 wt%) [1,4]. The role of the latter component is preventing Cu metallic particles from sintering and maintaining their high dispersion during the catalytic process. Typically, the Adkins catalysts operate at high temperatures (200–300 °C) and hydrogen pressures (140–300 bar) [5]. Consequently, great potential lies in finding catalytic formulations that would exhibit high activity in the hydrogenolysis of esters and high selectivity to alcohols when the process is carried out under milder reaction conditions. In addition, the synthesis of Adkins catalysts is accompanied by the formation of a large amount of Cr5+ and Cr6+ containing toxic wastes, that are harmful to the environment [6,7]. Cr-free catalysts based on noble metals, i.e., Pd [8,9], Pt [10,11], Ru [12,13], and Rh [14], demonstrate good catalytic performance in the hydrogenolysis of esters to corresponding alcohols at mild reaction conditions. However, the high cost of such catalysts hinders their widespread industrial adoption. Therefore, non-noble metals have attracted much attention to be used as an active component in catalysts for the production of alcohols from esters. Ni- and Co-based catalysts are active in the hydrogenolysis of both the C-O and C-C bonds, provoking the occurrence of decarbonylation/decarboxylation reactions with the formation of hydrocarbons, thus resulting in a decreased selectivity to target alcohols [15]. Copper-based catalysts, on the contrary, are selective in the hydrogenolysis of the C-O bond and hydrogenation of the carbonyl group but exhibit no activity in the hydrogenolysis of the C-C bond [16,17,18,19,20,21,22]. Thus, Cu-based catalysts have a great potential for their use in the hydrogenolysis of esters to alcohols. Especially this applies to bulk CuZn catalysts which are very effective in various applications, in particular in methanol synthesis from syngas [23,24,25,26]. The performance of CuZn catalysts has been also investigated in the hydrogenolysis of different compounds, including glycerol to propane-1,2-diol [27], dimethyl or diethyl succinate to butane-1,4-diol [20], hydrogenation of succinic anhydride [28] and dimethyl adipate to 1,6-hexanediol [21,22,29]. The CuZn catalysts were reported to be highly efficient in dimethyl adipate hydrogenolysis reaching the dimethyl adipate conversion of 97% at the temperature of 205 °C and 160 bar [21]. Our previous research on the catalyst systems containing Cu as an active part promoted by ZnO, Al2O3, and MgO showed that CuZn catalysts had the highest ester conversion and selectivity to hexane-1,6-diol in the reaction of adipic acid dimethyl ester [30]. Moreover, CuZn catalysts outperformed traditionally used CuCr catalysts, known as Adkins catalysts, in the same reaction of dimethyl adipate hydrogenolysis making them a good candidate to be the environmentally friendly alternative to CuCr catalysts [21] However, as far as we are aware, no comprehensive work on the performance of such CuZn catalysts in the hydrogenolysis of other carboxylic acid esters was reported. Several studies considered the effect of Cu/Zn ratio on the structural characteristics and the performance of the catalysts, and it was concluded that ester conversion increased with a growth in a copper surface area [28] or with a decrease in a copper particle size [21]. In our recent article [30] we have concluded that ZnO served as a structural promoter in CuZn catalysts for dimethyl adipate hydrogenolysis that improves the properties of the catalysts by increasing BET surface area and specific copper area as well as stabilizing Cu crystallites. However, ZnO could not be considered as activity promoter, what was evidenced from the calculation of TOF value for the CuZn catalyst. Nevertheless, there is an urgent need in receiving more comprehensive information for a deeper understanding of how the Cu/Zn ratio affects not only the activity, but also selectivity and stability of CuZn catalysts in the hydrogenolysis of carboxylic acid esters.
Although the efficiency of CuZn catalysts for ester hydrogenolysis was confirmed, the stability of such catalysts as well as their performance in hydrogenolysis of carboxylic acid esters of different chain length were not extensively studied. The present study is focused on comparing the activity, selectivity, and stability of CuZn catalysts varying in Cu/Zn ratio in the hydrogenolysis of methyl hexanoate. A difference in the performance of the catalysts was assessed by considering their physico-chemical properties, in particular by determining the size of Cu and Zn particles in as-prepared, calcined, reduced, and spent materials. In addition, to explain the observed dependence of product selectivity on the reactant conversion, we compared the activity of the prepared catalysts in the conversion of methyl hexanoate and hexyl hexanoate as an intermediate reaction product obtained by a transesterification reaction. Finally, to the best of our knowledge, we are the first who demonstrate the effect of carbon chain length in a reactant on the activity and selectivity of CuZn catalysts by carrying out experiments with different methyl esters.

2. Results

2.1. Physico-Chemical Characterization

2.1.1. Chemical Analysis
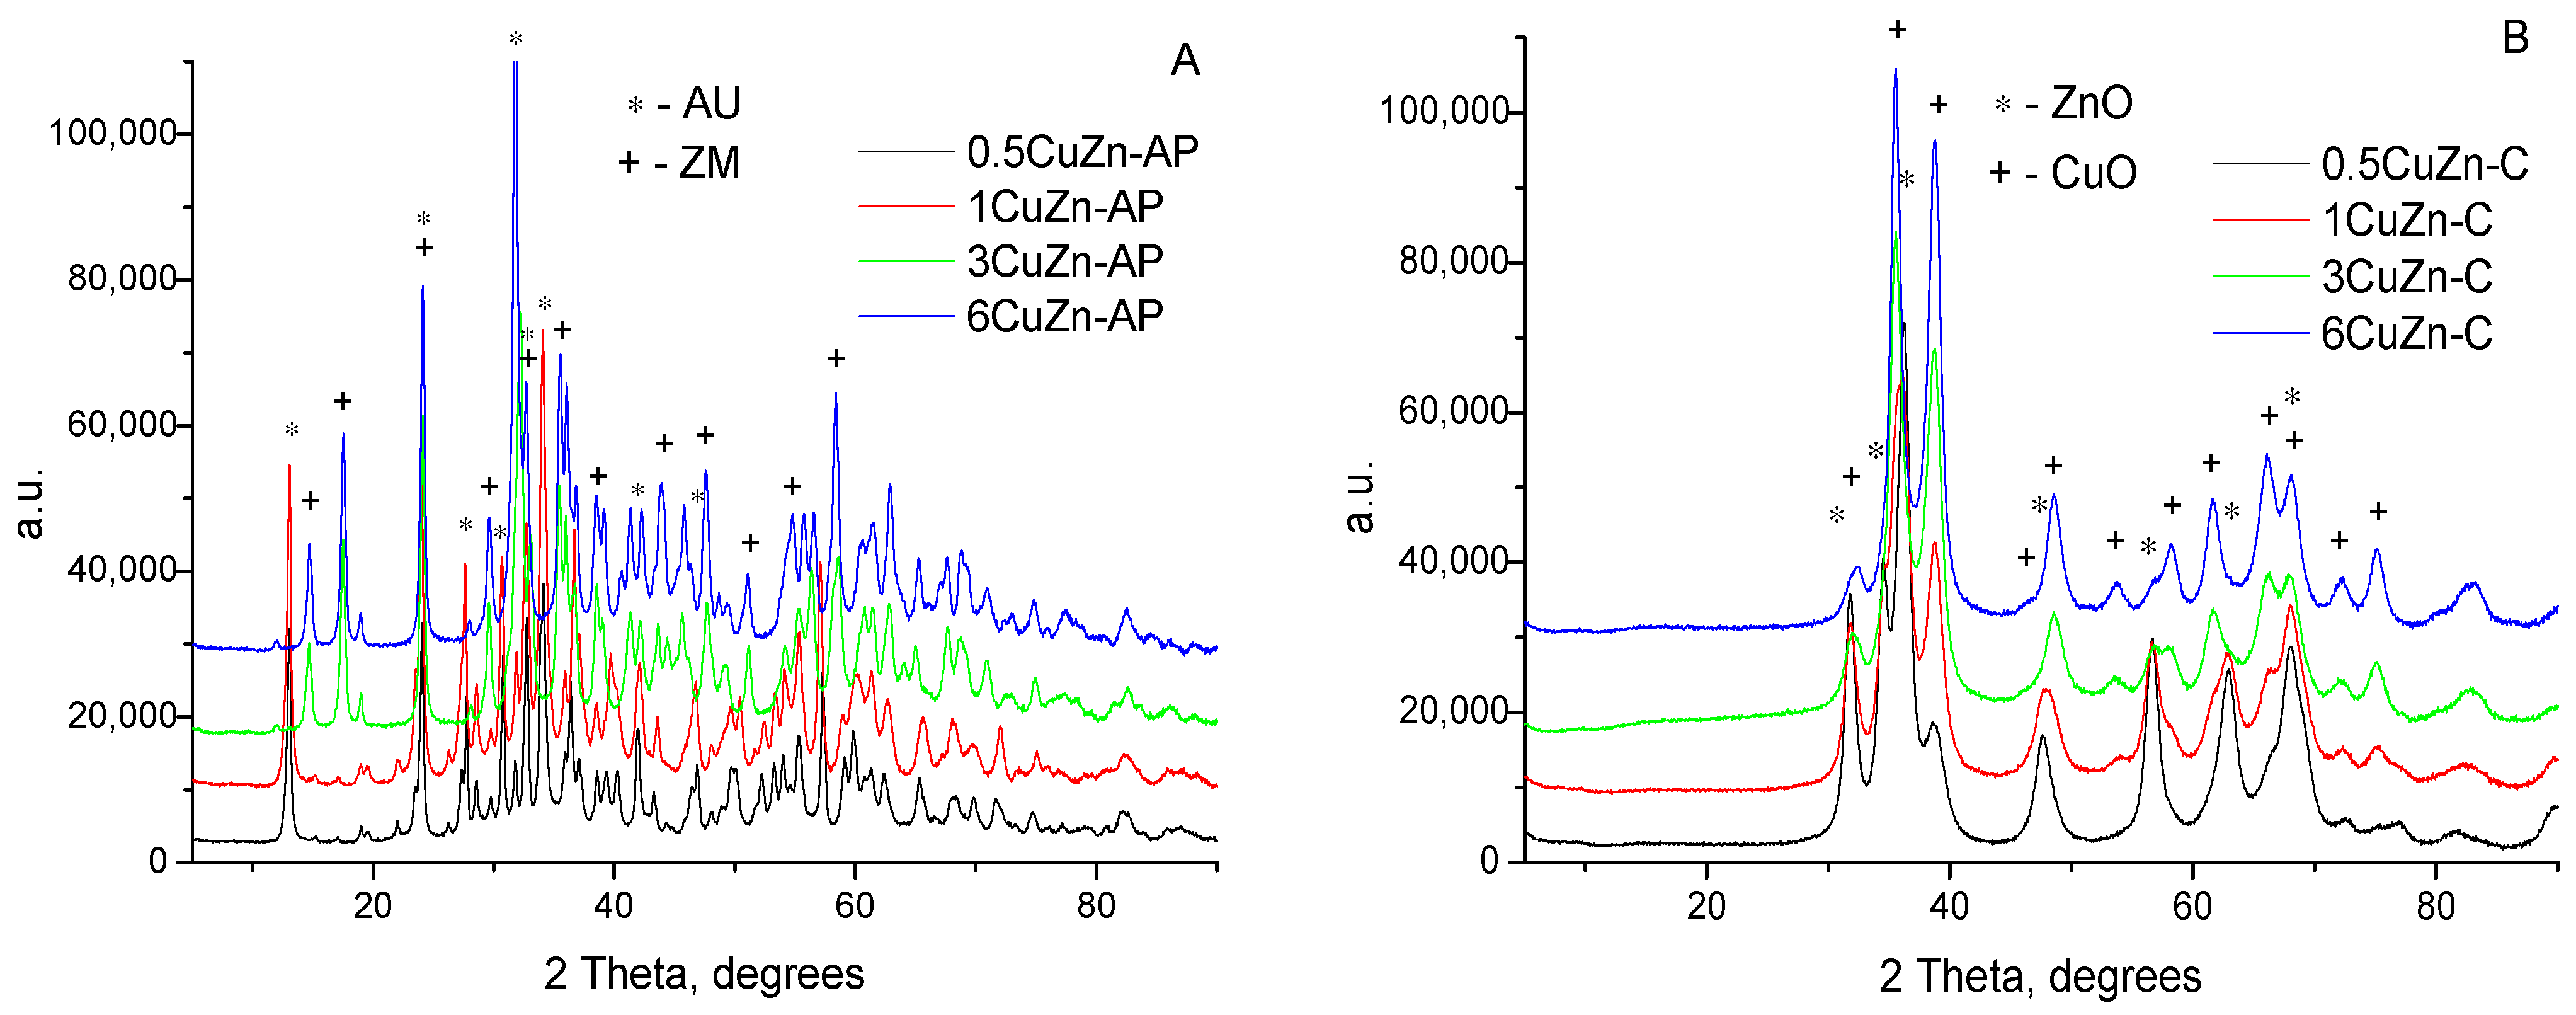
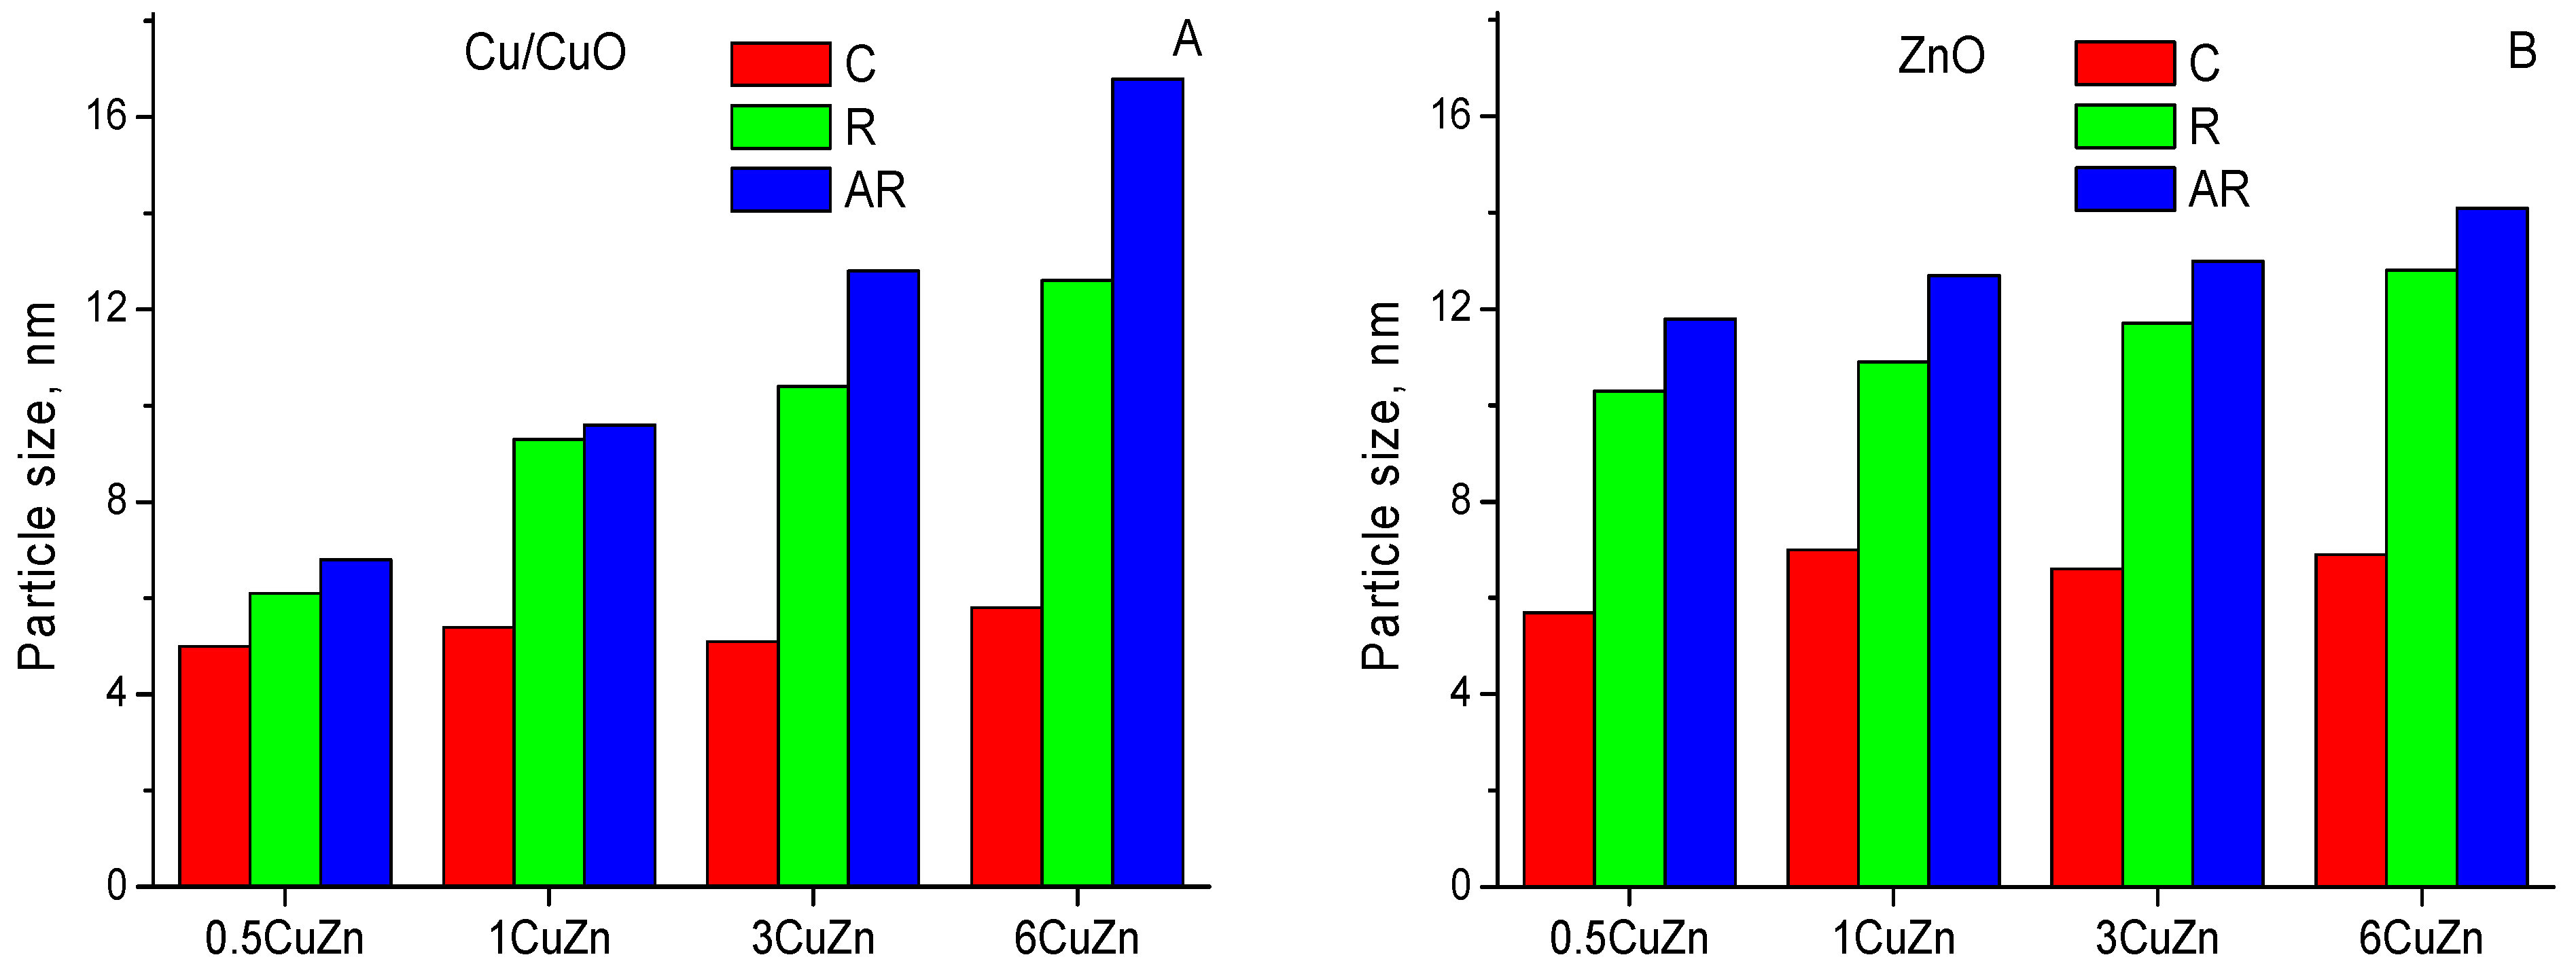
Four CuZn-AP precursors with varying Cu/Zn ratios were prepared by a co-precipitation method. XRF analysis evidenced that the obtained Cu/Zn ratios in the as-prepared precursors were very close to the theoretical values estimated from the chemical composition of the corresponding reaction mixtures used for the synthesis of the samples (Table 1). The high efficiency of the used synthesis method was also confirmed by the colorless aqueous filtrate obtained after separating a filter cake. It suggested that mostly all copper cations from the initial nitrate solution were included into the composition of the precipitate. Considering the XRF data, it could, therefore, be concluded that zinc cations were also largely in the composition of the precipitate. Accordingly, the synthesis method used under strictly controlled conditions should ensure a reproducible preparation of CuZn samples with the desired chemical composition. It was also assumed that the chemical composition of the samples did not change after calcination step.

2.1.2. XRD Study

The phase composition from as-prepared catalyst precursors to the spent samples was investigated using XRD (Figure 1). XRD patterns of the as-prepared materials are presented in Figure 1A. Samples 0.5CuZn-AP and 1CuZn-AP possessed aurichalcite structure Cu2Zn3(CO3)2(OH)6 (ref. code 00-038-0152) which was characterized by typical reflections at 2θ = 13.0°, 24.2, 34.1°, 41.9°, and 50.1° [22,31,32]. 3CuZn-AP and 6CuZn-AP contained almost exclusively zincian malachite phase (Cu0.8Zn0.2)2(OH)2CO3 (ref. code 01-079-7851) with characteristic reflections at 2θ = 14.8°, 17.6°, 24.1, or 31.9° [22,33]. In general, the results from Figure 1A evidenced that almost phase-pure materials were prepared and used for further characterization purposes, although the presence of other minor hydroxycarbonate phases with a content of up to 5% could not be ruled out [33].
The calcination of the as-prepared precursors at T = 350 °C resulted in the disappearance of the reflections from hydroxycarbonate phases and the appearance of the reflections from CuO and ZnO phases, which suggested the formation of mixed CuZn oxides (Figure 1B). Previously it was reported that the complete decomposition of zincian malachite phase to oxides occurred between 300 and 350 °C, while a residual characteristic diffraction peak at 2θ = 13.0° from aurichalcite phase could still be present in the XRD patterns of an aurichalcite precursor after its calcination at 350 °C [22]. In contrast, the XRD patterns of the calcined samples prepared from CuZn precursors in the present study did not show any reflexes from either aurichalcite or zincian malachite phase that suggested total decomposition of the as-prepared hydroxycarbonates (Figure 1B). CuO and ZnO crystallite size in the calcined samples with different Cu/Zn ratio was evaluated using the Scherrer equation for reflections at 2θ ≈ 38.7° and 31.8°, respectively. Previously, it was suggested that aurichalcite-derived catalysts had smaller Cu crystallites than the catalysts derived from zincian malachite or copper-hydrozincite [34,35,36]. Nonetheless, some studies indicated that there was no difference in the CuO particle size of the calcined samples as a result of the precursor phase composition [31]. Similar to the latter study, no obvious dependence of either CuO or ZnO crystallite size on the increase in Cu/Zn ratio was observed for the samples prepared in the present study. Based on the XRD results, the estimated size of the CuO crystallites in the mixed oxides was 5–6 nm, while that of the ZnO crystallites was 6–7 nm (Figure 2).
The state of copper as well as the size of copper and zinc particles before catalytic runs were determined in CuZn mixed oxides reduced at 210 °C. The measurement of metallic copper particle size was failed for the samples reduced by a standard method: after being unloaded from the reactor, the reduced samples were immediately re-oxidized with atmospheric oxygen which was evidenced by the obvious and significant heating of the samples. As evidenced by their XRD patterns, most of the copper in the reduced samples were present as CuO species with only residual presence of Cu and Cu2O (Figure 1C). To prevent the re-oxidation of reduced copper species, CuZn samples were reduced at 210 °C by a standard method and then treated with MeHe, as described in the Materials and Methods. XRD patterns of the reduced and treated samples (Figure 1D) showed that Cu particles in the catalysts corresponded to Cu0. It suggested that (i) the total reduction of CuO species occurred at the reduction temperature of 210 °C and (ii) the treatment of the freshly reduced catalyst with the organic compound prevented the re-oxidation of metallic copper in air. Thus, the performed treatment made it possible to assess the state of ZnO and Cu species in reduced CuZn catalysts just as at the beginning of a catalytic run. Figure 2A shows that the size of Cu species in the reduced and treated CuZn-R samples before a catalytic run was already larger in comparison with the calcined CuZn-C counterparts. This trend became more pronounced with increasing Cu/Zn ratio in the catalysts, where copper particle size increased from 6.1 nm to 12.6 nm for reduced 0.5CuZn-R and 6CuZn-R, respectively. Figure 2B evidences that the size of ZnO particles also changed after the reduction step, regardless of the chemical composition of the catalysts, slightly increasing from 10.3 nm to 12.8 nm with the increasing Cu/Zn ratio from 0.5 to 6.

2.1.3. Catalyst Surface Area

The textural properties of calcined and reduced samples were investigated using N2 physisorption. The results (Table 1) showed that the values of both BET surface area and total pore volume showed no clear dependence on the Cu/Zn ratio of calcined CuZn-C samples being in the range of 59–65 m2·g−1 and 0.23–0.26 cm3·g−1, respectively. The similarity in textural properties was consistent with XRD data, which indicated no change in CuO and ZnO particle size for CuZn-C samples regardless of a Cu/Zn ratio (Figure 2), which was also observed in our recent work [22]. The BET surface area of both CuO and ZnO was lower in comparison with that of the CuZn mixed oxides as it was shown in our recent article [37], also reflecting the effect of small size for the constituent particles.

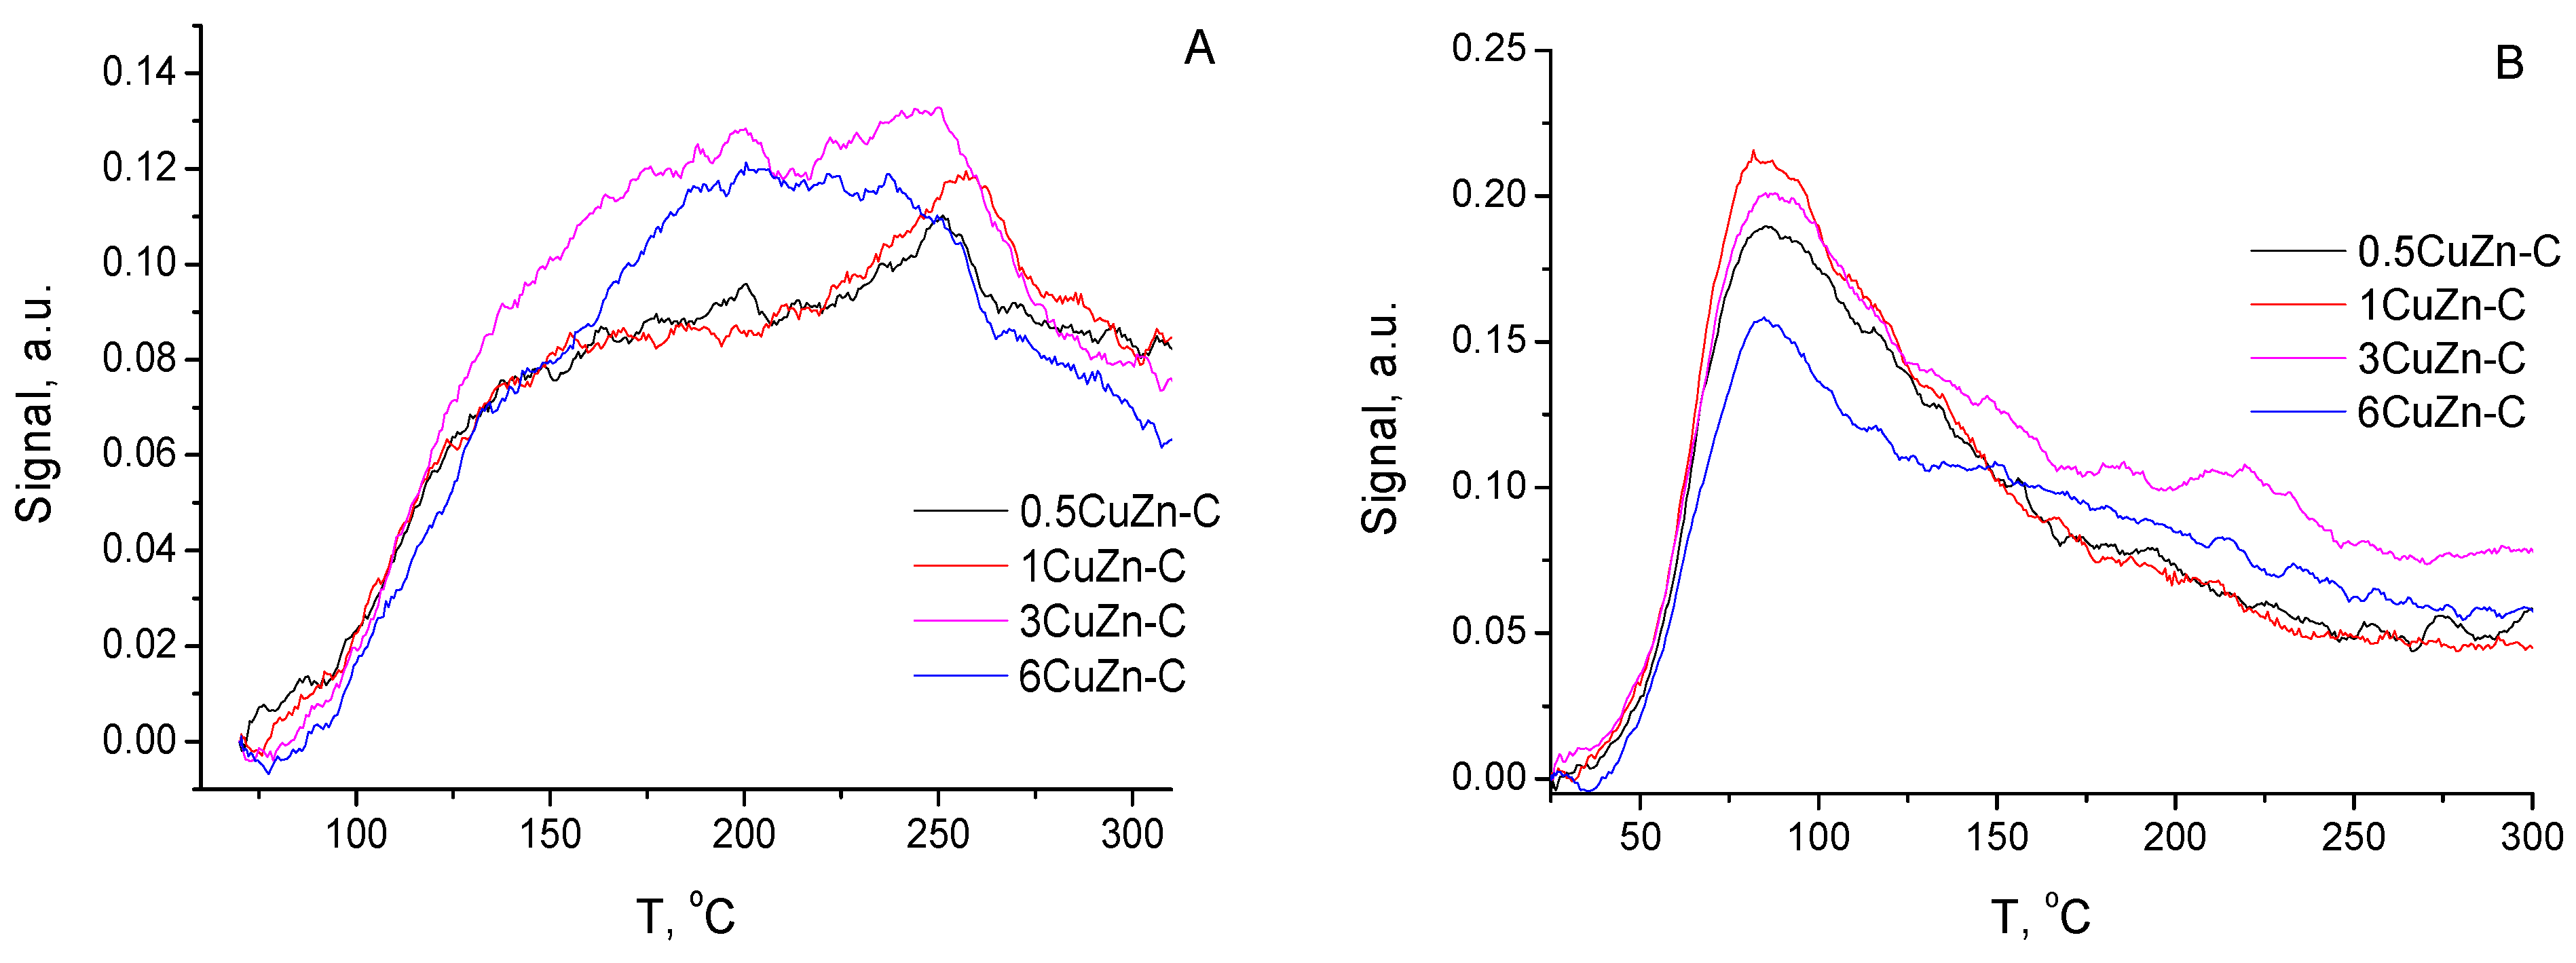
2.1.4. TPD of Adsorbed CO2 and NH3

The acid-base sites of the calcined samples were probed using NH3-TPD and CO2-TPD. Figure 3 depicts the TPD profiles of NH3 and CO2 adsorbed on CuZn-C mixed oxides, while Table 2 shows the number of both basic and acidic sites calculated from the area under the obtained TPD curves.
The number of acid sites in calcined samples was in the range of 0.135–0.168 mmol g−1 and demonstrated an increasing trend with the growth of Cu/Zn ratio in CuZn-C samples from 0.5 to 3 followed by a slight decrease for 6CuZn-C sample. The number of basic sites in the calcined samples was in the range of 0.176–0.237 mmol g−1 and it demonstrated similar dependence on Cu/Zn ratio: the largest concentration of basic sites was observed for 3CuZn-C, while it slightly decreased for other catalysts. In our previous study, it was shown that the concentration of both acidic and basic sites in CuZn mixed oxides was larger than in single-phase ZnO or CuO [29], and it might be due to the high dispersion of individual oxidic species. Therefore, a decrease in the acid-base characteristics of the samples with either low or high Cu/Zn ratio, i.e., when approaching the pure CuO or ZnO phase composition, was in line with the previous findings.

2.1.5. Specific Copper Surface Area

The specific copper surface area was determined using N2O chemisorption. Prior to N2O chemisorption, CuZn-C mixed oxides were reduced, the reduction process was monitored, and hydrogen consumption profiles were recorded. The curves of H2 consumption during the reduction of CuO species in CuZn mixed oxides with different Cu/Zn ratio (see the Supplementary Materials, Figure S1) evidenced that, regardless of the chemical composition of the samples, the reduction of constituent CuO species started at about 150 °C. The total amount of consumed H2 increased with the growth of Cu content in the samples, while calculations showed that CuO content in the catalysts (Table 3) corresponded well to the chemical composition of CuZn-AP precursors determined by XRF (Table 1), only slightly overestimating the actual copper content. Thus, it was confirmed that all catalysts were fully reduced prior to N2O chemisorption experiments.
The specific surface area of copper was evaluated from the N2O chemisorption experiments with the reduced CuZn catalysts. The largest values of specific Cu surface area (SCu) per gram of sample were determined for 1CuZn-R and 3CuZn-R, SCu = 15.1 m2·gcat−1, while the lowest value was obtained for 6CuZn-R, SCu = 11.9 m2·gcat−1 (Table 3). The recalculation of the specific copper area per mass of copper demonstrated a definite declining trend from SCu = 50 m2·gCu−1 to SCu = 17 m2·gCu−1 with the growth in the copper content in the samples (Table 3). Accordingly, Cu dispersion calculated using a formula from [30] also gradually decreased from 3.7% to 1.3% as the Cu/Zn ratio increased from 0.5 to 6. The obtained Cu dispersion values correlated well with the values obtained in other studies on Cu-containing catalysts [22,30,38,39,40].

2.2. Catalysis

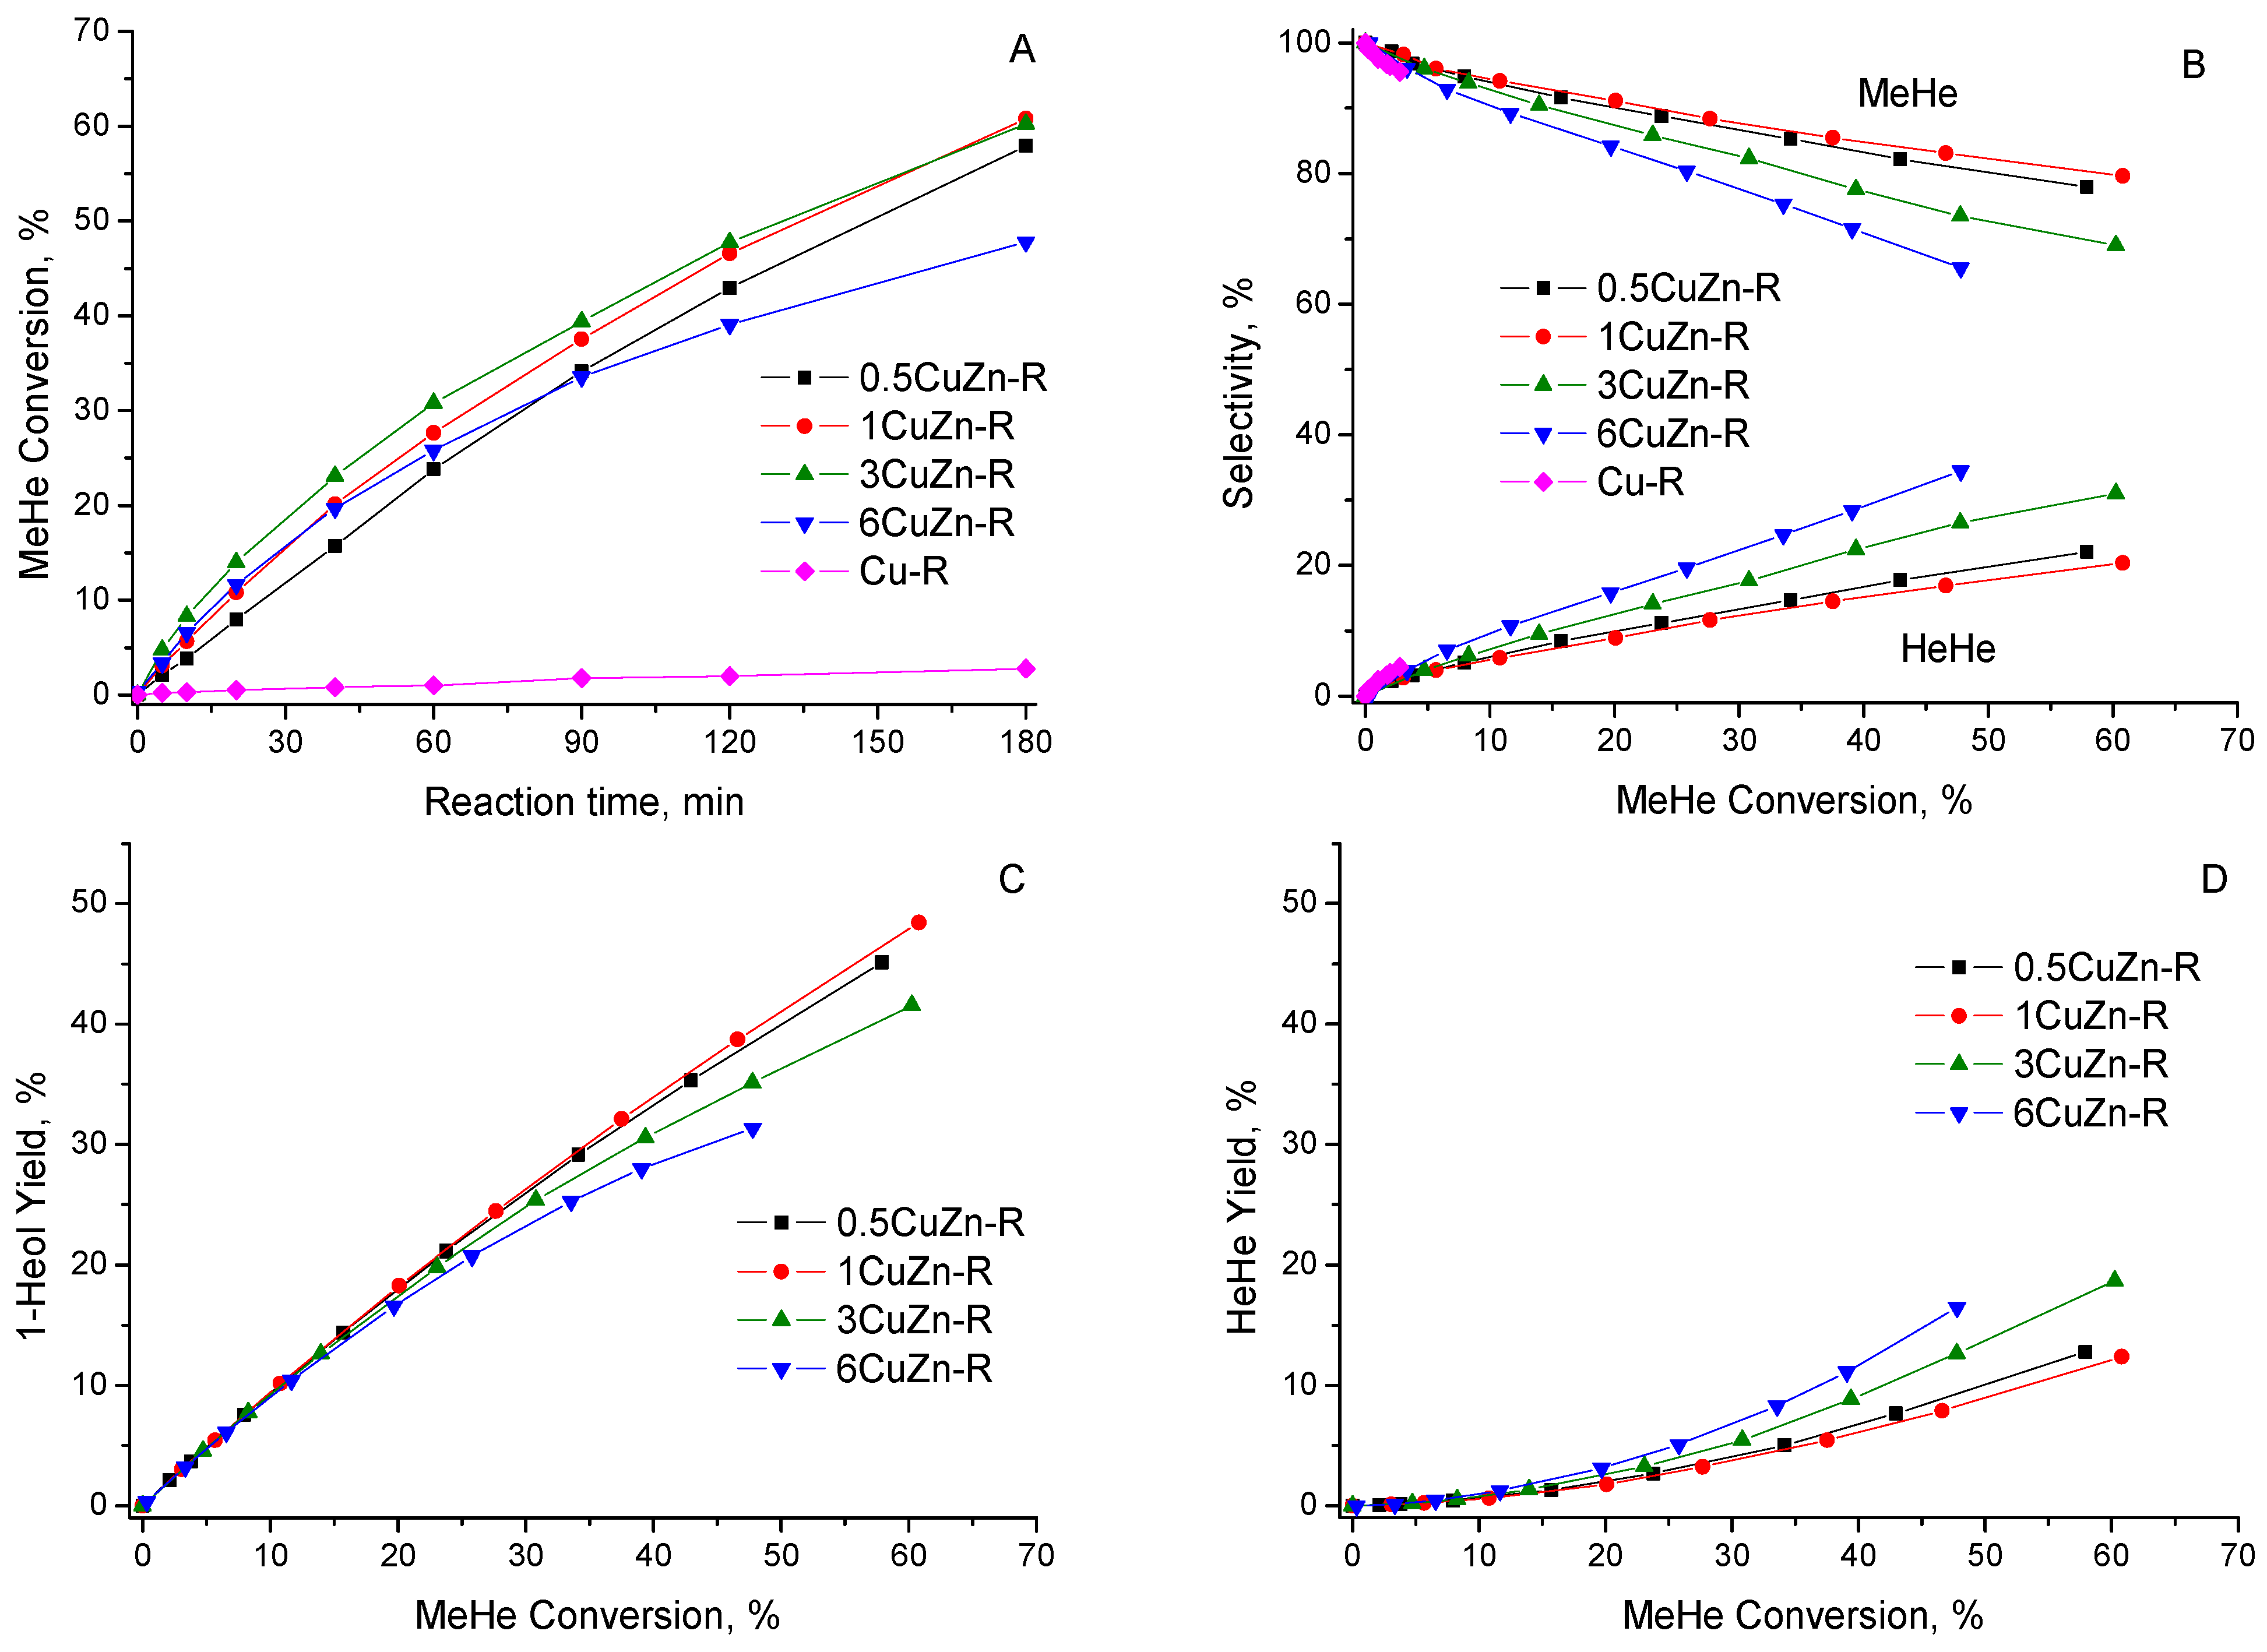
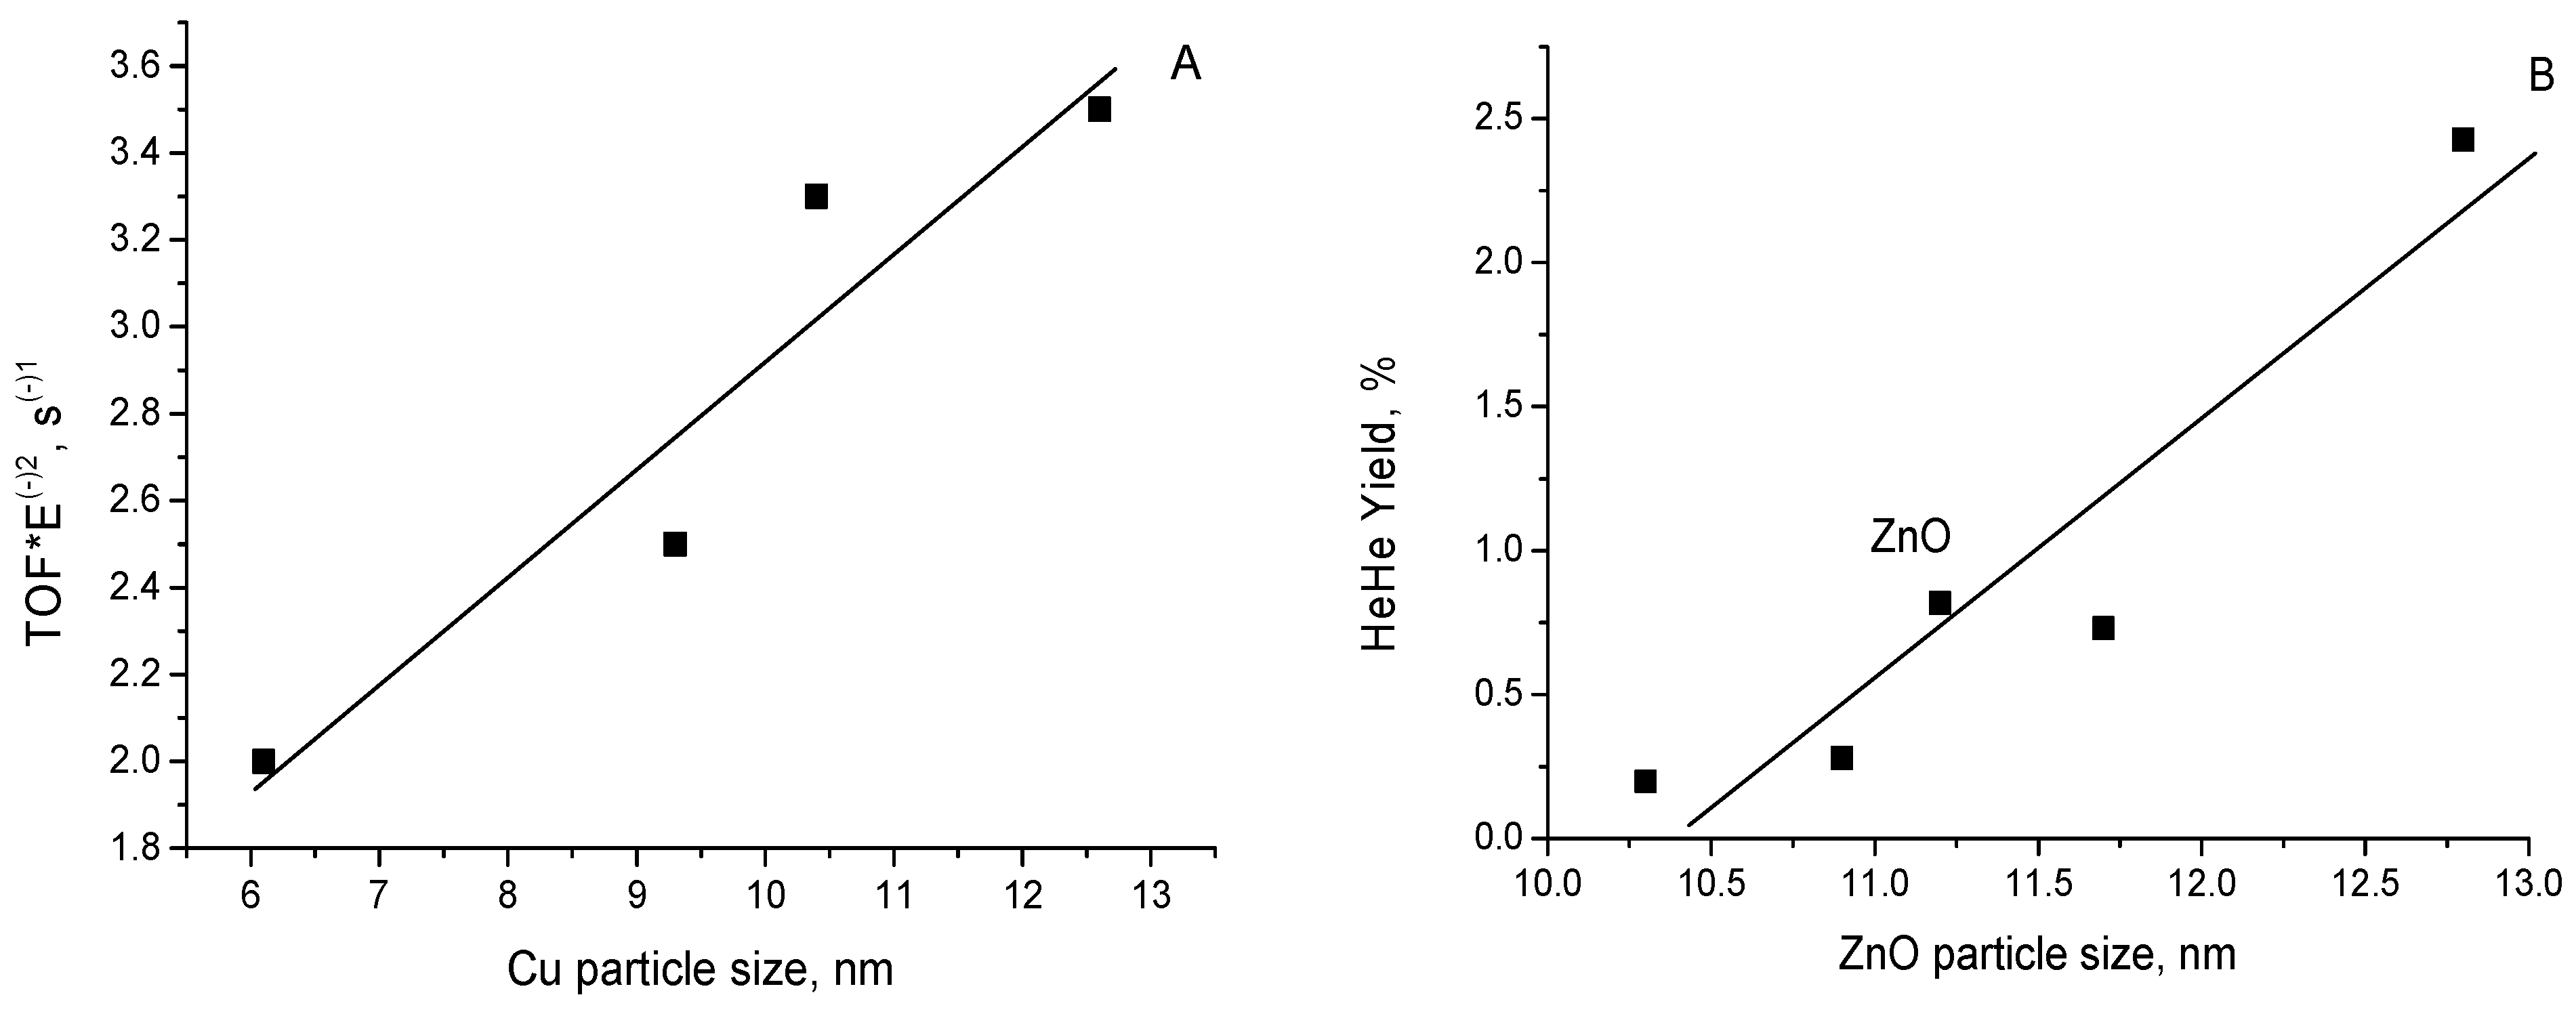
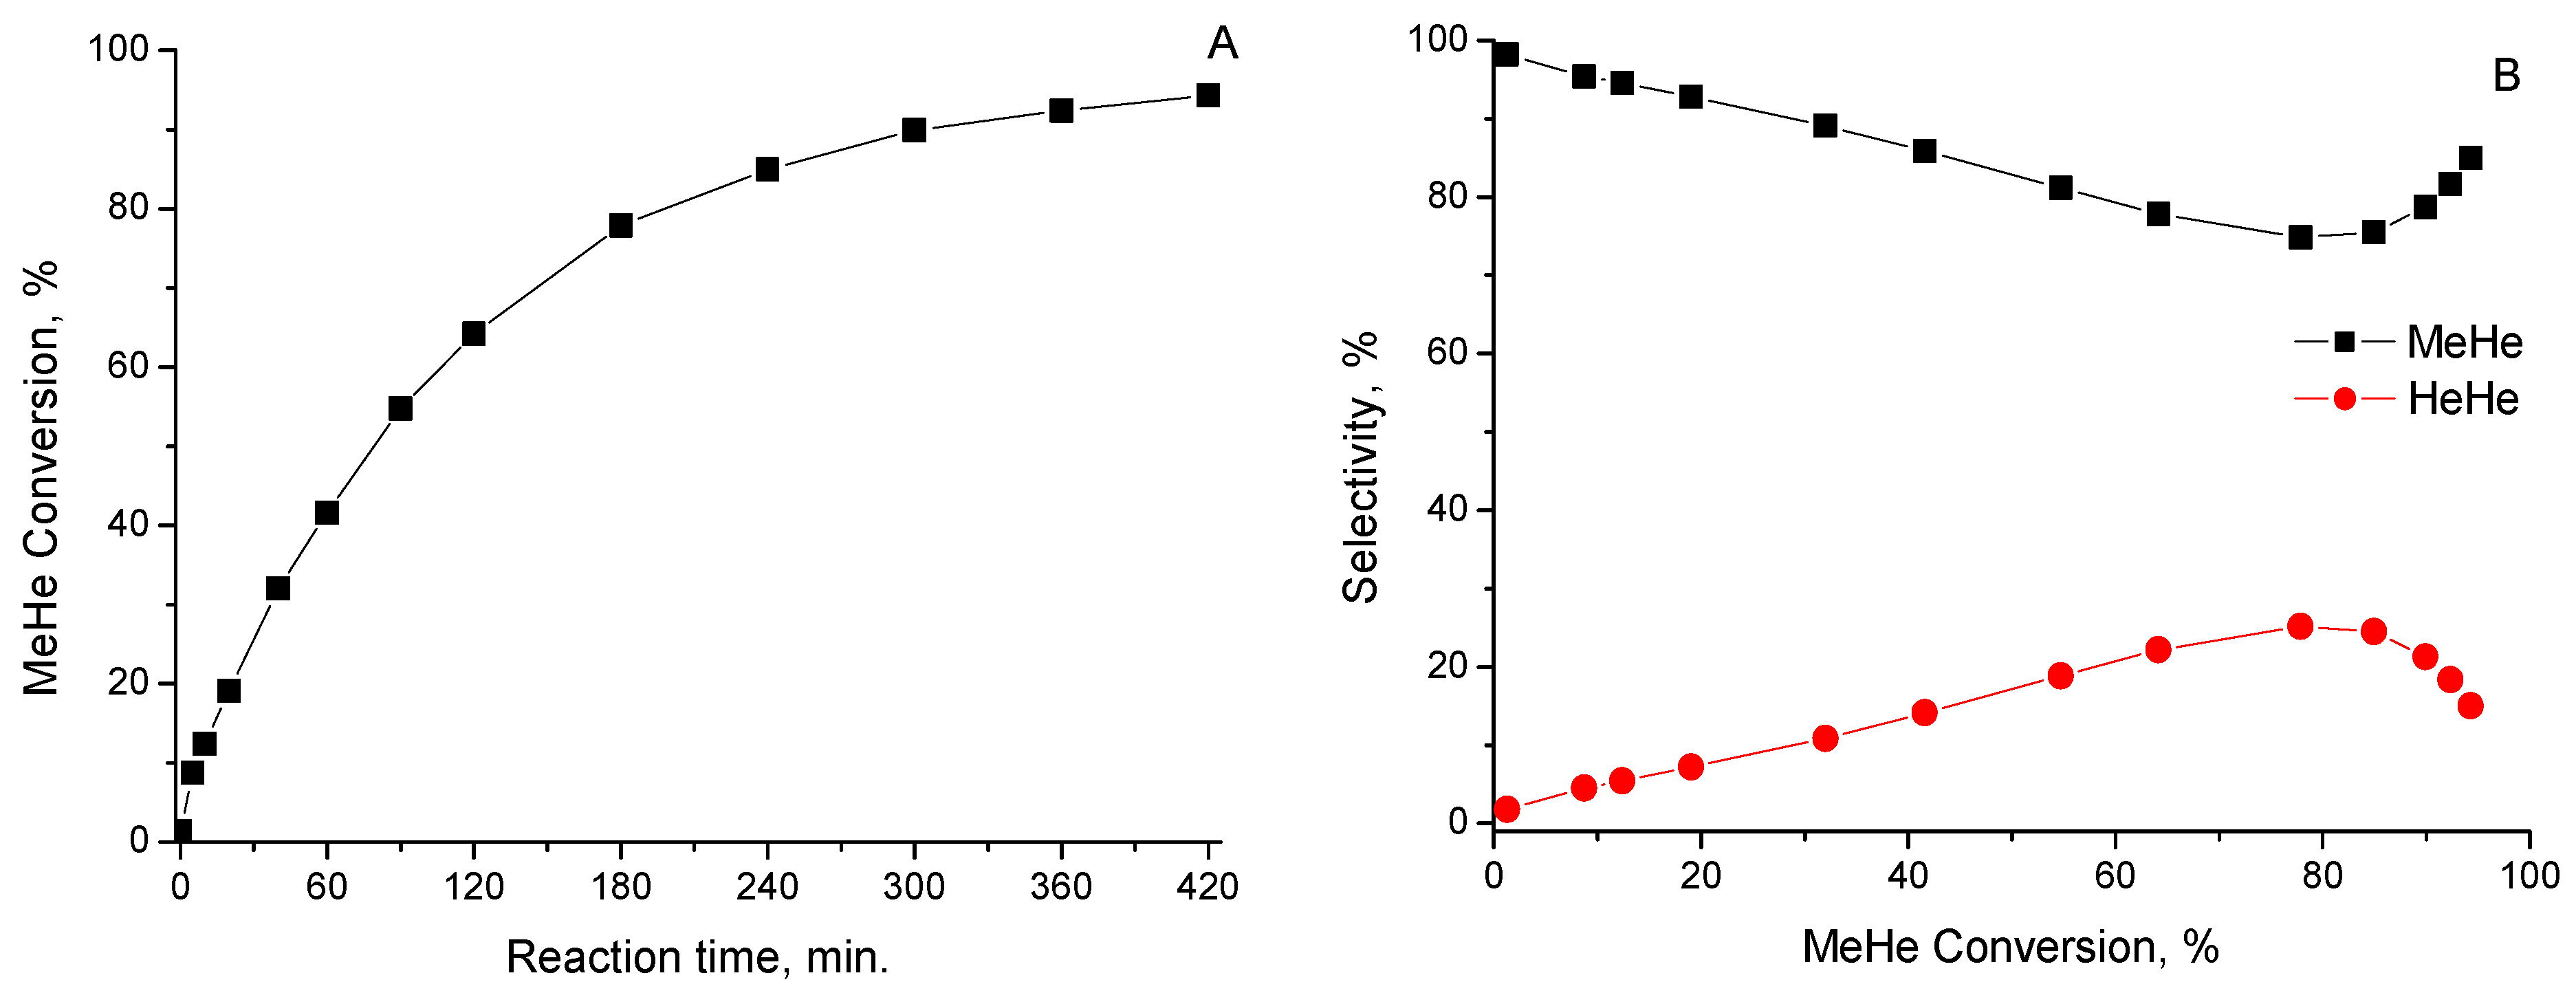
2.2.1. The Hydrogenolysis of Methyl Hexanoate (MeHe) in Presence of CuZn-R Catalysts Varied in Cu/Zn Ratio

The four prepared catalysts and Zn-free Cu catalyst were tested in methyl hexanoate hydrogenolysis (MeHe) at reaction temperature of 210 °C and pH2 = 10 MPa. Figure 4A depicts the change in MeHe conversion in dependence on reaction time. All CuZn-R catalysts exhibited a high conversion of MeHe at chosen reaction conditions, which significantly exceeded that of a single-phase Cu catalyst (Figure 4A). In contrast, a single-phase ZnO catalysts possessed zero activity in the reaction. These results unambiguously proved the promoting effect of ZnO species in the CuZn-R catalysts for the hydrogenolysis of methyl esters, as proposed in [30]. Figure 4A also evidenced that the catalysts performed differently during the reaction, consequently the performance of the catalysts at the beginning and at the end of catalytic runs was compared separately.
The activity of CuZn-R catalysts at the initial 20 min of reaction was evaluated in terms of initial reaction rate, rini. = nMeHe·gcat−1·min−1, where nMeHe stands for the number of MeHe mmoles consumed in this reaction time. The initial reaction rate decreased in the following order 3CuZn-R > 6CuZn-R > 1CuZn-R > 0.5CuZn-R (Table 4). The growth of the initial activity with the growth of Cu/Zn ratio in the catalysts from 0.5 to 3 appeared logical as it concerned with the gradual growth of Cu content in the catalysts, i.e., with an increase in the number of active sites. But the drop of the initial reaction rate observed for 6CuZn-R with the largest Cu content should be considered in detail. To explain the obtained results, it is necessary to consider XRD data for the CuZn samples before and just after a reduction step. The size of both copper and zinc particles in CuZn-R samples considerably increased in comparison with that in CuZn-C, and this effect became more evident with an increase in the Cu/Zn ratio in the catalysts (Figure 2A). Therefore, the observed considerable sintering of Cu species in 6CuZn-R occurred already at reduction step and, accordingly, the small surface area of copper and its low dispersion (Table 3) were responsible for the decreased initial activity of this catalyst in catalytic run. An increase in the size of copper particles at reduction step in 3CuZn-R was less dramatic, which made it possible to maintain the surface area and dispersion of copper at a relatively high level, 15.1 m2·g−1 and 1.85%, respectively. As a consequence, the initial activity of the 3CuZn-R was higher than that of 6CuZn-R (Table 4). With the similar surface area of copper in 1CuZn-R and 3CuZn-R, the dispersion of copper in the former catalyst was larger, 2.73%. Nevertheless, the initial activity of 1CuZn-R was lower than that of 3CuZn-R. Moreover, 0.5CuZn-R had a rather large copper surface area and the highest Cu dispersion among all prepared samples, but the initial activity of this catalyst was even lower than that of 6CuZn-R. The observed discrepancy between the physico-chemical and catalytic results allowed assuming that additional reasons could stand for the decreased initial activity of catalysts with a low Cu/Zn ratio. The poor accessibility of the smaller metallic Cu particles within the excessive ZnO species for the reactant molecules compared to bigger Cu particles could be assumed.
Additionally, the intrinsic activity of copper species in the catalysts varied in Cu/Zn ratio could be evaluated considering their turnover frequency (TOF). Table 4 shows that TOF gradually increased with the growth of Cu content in the catalysts. On the other hand, an increase in the Cu/Zn ratio resulted in an increase in the copper particle size in the reduced catalysts (Figure 2). The combination of these two trends allowed suggesting that an increase in copper particle size in reduced catalysts contributed to TOF increase for MeHe hydrogenolysis (Figure 5A). Thus, an increase in the Cu/Zn ratio in catalysts from 0.5 to 3 resulted both in an increase in the number of copper particles, which was reflected in an increase in the active copper surface area, and in an increase in the size of such particles, which was promotional for an increase in TOF. Accordingly, the initial activity reached the highest values for 3CuZn-R catalyst. A further increase in copper content resulted in a further increase in the size of copper particles with high TOF value. At the same time, the surface and dispersion of copper in 6CuZn-R significantly decreased, and, accordingly, the initial activity of the 6CuZn-R catalyst also slightly decreased even at the largest TOF value calculated for this catalyst.
With increasing reaction time, a difference in the performance of the catalysts became obvious (Figure 4A): the larger the Cu/Zn ratio, the more pronounced drop in the activity of the catalysts at the end of experiments. 0.5CuZn-R was the least active catalyst at the beginning of the reaction but demonstrated the most stable activity with reaction time, while 6CuZn-R with a high copper content was the least stable in the performance. Despite the observed differences in the initial activity of 0.5CuZn-R, 1CuZn-R and 3CuZn-R, the final MeHe conversion for these catalysts was approximately similar in the range of 58–60% (Figure 4A). It could be assumed that the observed difference in the performance of catalysts was concerned with a change in their properties during the reaction, which was demonstrated by a change in the composition of reaction products.
Previously, it was shown that the hydrogenolysis of dimethyl adipate on CuZn catalysts resulted in the formation of 1,6-hexanediol as the targeted product and abundant by-products formed by the transesterification reaction route, with other products being in minor amounts [21,22,29]. In case of MeHe hydrogenolysis, only two main reaction products were observed: hexan-1-ol (1-Heol) as the reaction product formed by hydrogenolysis reaction route, and hexyl hexanoate (HeHe) produced by transesterification route between MeHe and the formed 1-Heol. Figure 4B depicts selectivity to reaction products in dependence on reaction time for different CuZn catalysts. In all cases 1-Heol selectivity gradually decreased and, accordingly, HeHe selectivity increased during the experiments, which was most pronounced for catalysts with a high Cu/Zn ratio, 3CuZn-R, and 6CuZn-R.
Figure 4C shows that the yield of 1-Heol was very similar for all studied catalysts at low MeHe conversion with a linear increasing trend. With further growth in MeHe conversion the linear growth of 1-Heol yield was observed for 0.5CuZn-R and 1CuZn-R, while in the case of 3CuZn-R and 6CuZn-R an obvious deviation from a straight line was observed. On the other hand, HeHe yield progressively increased with a growth in MeHe conversion, and this trend was again the most pronounced for 3CuZn-R and 6CuZn-R (Figure 4D). The observed change in the yield of the reaction products suggested that the properties of active sites in the catalysts responsible for hydrogenolysis and transesterification routes differed. In order to explain the observed trends in the performance of the catalysts, the XRD study of the samples after the reaction was carried out.
A comparison in the size of constituent particles in freshly reduced and spent catalysts evidenced that during the reaction an enlargement of Cuo particles was observed, which was the most obvious for catalysts with high Cu/Zn ratio. The size of copper particles in 6CuZn-R and 6CuZn-AR increased from 12.2 nm to 16.8 nm, while for 0.5CuZn-R and 0.5CuZn-AR this increase was only marginal, from 6.0 nm to 6.5 nm (Figure 2A). Therefore, the degradation in the hydrogenolysis activity observed for CuZn catalysts with high copper content could be explained by the gradual sintering of metallic copper particles during the reaction. These results thus provided additional evidence that the promoting effect of zinc oxide particles was concerned with stabilizing copper particles, and it was most pronounced for catalysts with a high ZnO content, i.e., with Cu/Zn ratio in the range of 0.5–1.
In our recent article [37], we have shown that ZnO particles rather than metallic Cu0 were responsible for the occurrence of the transesterification reaction between the methyl ester and the formed alcohol. In general, the transesterification reaction can proceed with the participation of either acidic or basic sites [41,42,43,44]. Results from Table 2 suggest that the number of both kinds of active sites in the CuZn catalysts increased with the growth in the Cu/Zn atomic ratio from 0.5 to 3, followed by a slight decrease for 6CuZn-R sample. From this point of view, the increased selectivity to HeHe with the increasing Cu/Zn ratio from 0.5 to 3 was not surprising. Nevertheless, the largest selectivity to HeHe observed for 6CuZn-R was hard to explain if considering exclusively the acid-base properties of the catalyst. Then, in addition to the acid-base characteristics of the calcined CuZn-C samples, other reasons for the observed trends in selectivity to hydrogenolysis and transesterification products could be considered. First of all, the study of catalysts after the reaction using N2 physisorption showed that both BET surface area and total pore volume of the spent 0.5CuZn-AR were similar to the values obtained for the freshly calcined 0.5CuZn-C, while both the values were dramatically lower in case of 6CuZn-AR (Table 1). The observed trend in the textural properties of the spent catalysts correlated well with their stability in the reaction and with observed product selectivity. Indeed, the sintering of Cu particles may contribute to a decrease in the total surface area. Additionally, the mesoporous space of the spent catalysts with a high transesterification activity could be occupied by high-molecular weight compounds which were not removed by a simple washing after the reaction.
To get additional information on the transesterification performance of CuZn catalysts, experiments on the mutual processing of MeHe and 1-Heol mixture (2:1 mol/mol) at the same reaction conditions were carried out (see the Supplementary Materials, Figure S2). These experiments demonstrated that the yield of HeHe as a transesterification product formed by a reaction between MeHe and 1-Heol increased with the growth of Cu/Zn ratio in the CuZn-R catalysts. Among them, 6CuZn-R possessed a remarkable transesterification performance (see the Supplementary Materials, Figure S2). For a comparison, the performance of ZnO and reduced Cu catalysts in the conversion of MeHe and 1-Heol mixture was also evaluated (both samples were prepared by the calcination of either Zn or Cu precursors synthesized by the same recipe as was used for CuZn samples). Figure S2B depicts that the yield of HeHe was larger on a single-phase ZnO as compared to CuZn-R catalysts. It allowed suggesting that ZnO component in the CuZn-R catalysts was responsible for the transesterification reaction route in methyl ester hydrogenolysis. Nevertheless, the calculation of the corrected initial rate of HeHe formation based on ZnO content in the catalysts showed that the activity in transesterification route increased with an increase in Cu/Zn ratio in catalysts, and it was even larger for 6CuZn-R than that for a single-phase ZnO (Table 5). Taking into account the XRD data (Figure 2B), the observed trend in the transesterification performance correlated well with the size of ZnO particles in the catalysts (Figure 5B). In addition, the performance of the single-phase ZnO sample also agreed well with a general trend. Based on the obtained results it could be assumed that both the acid-base properties of the CuZn catalysts and the size of the ZnO species were responsible for the performance of CuZn-R catalysts in transesterification step.

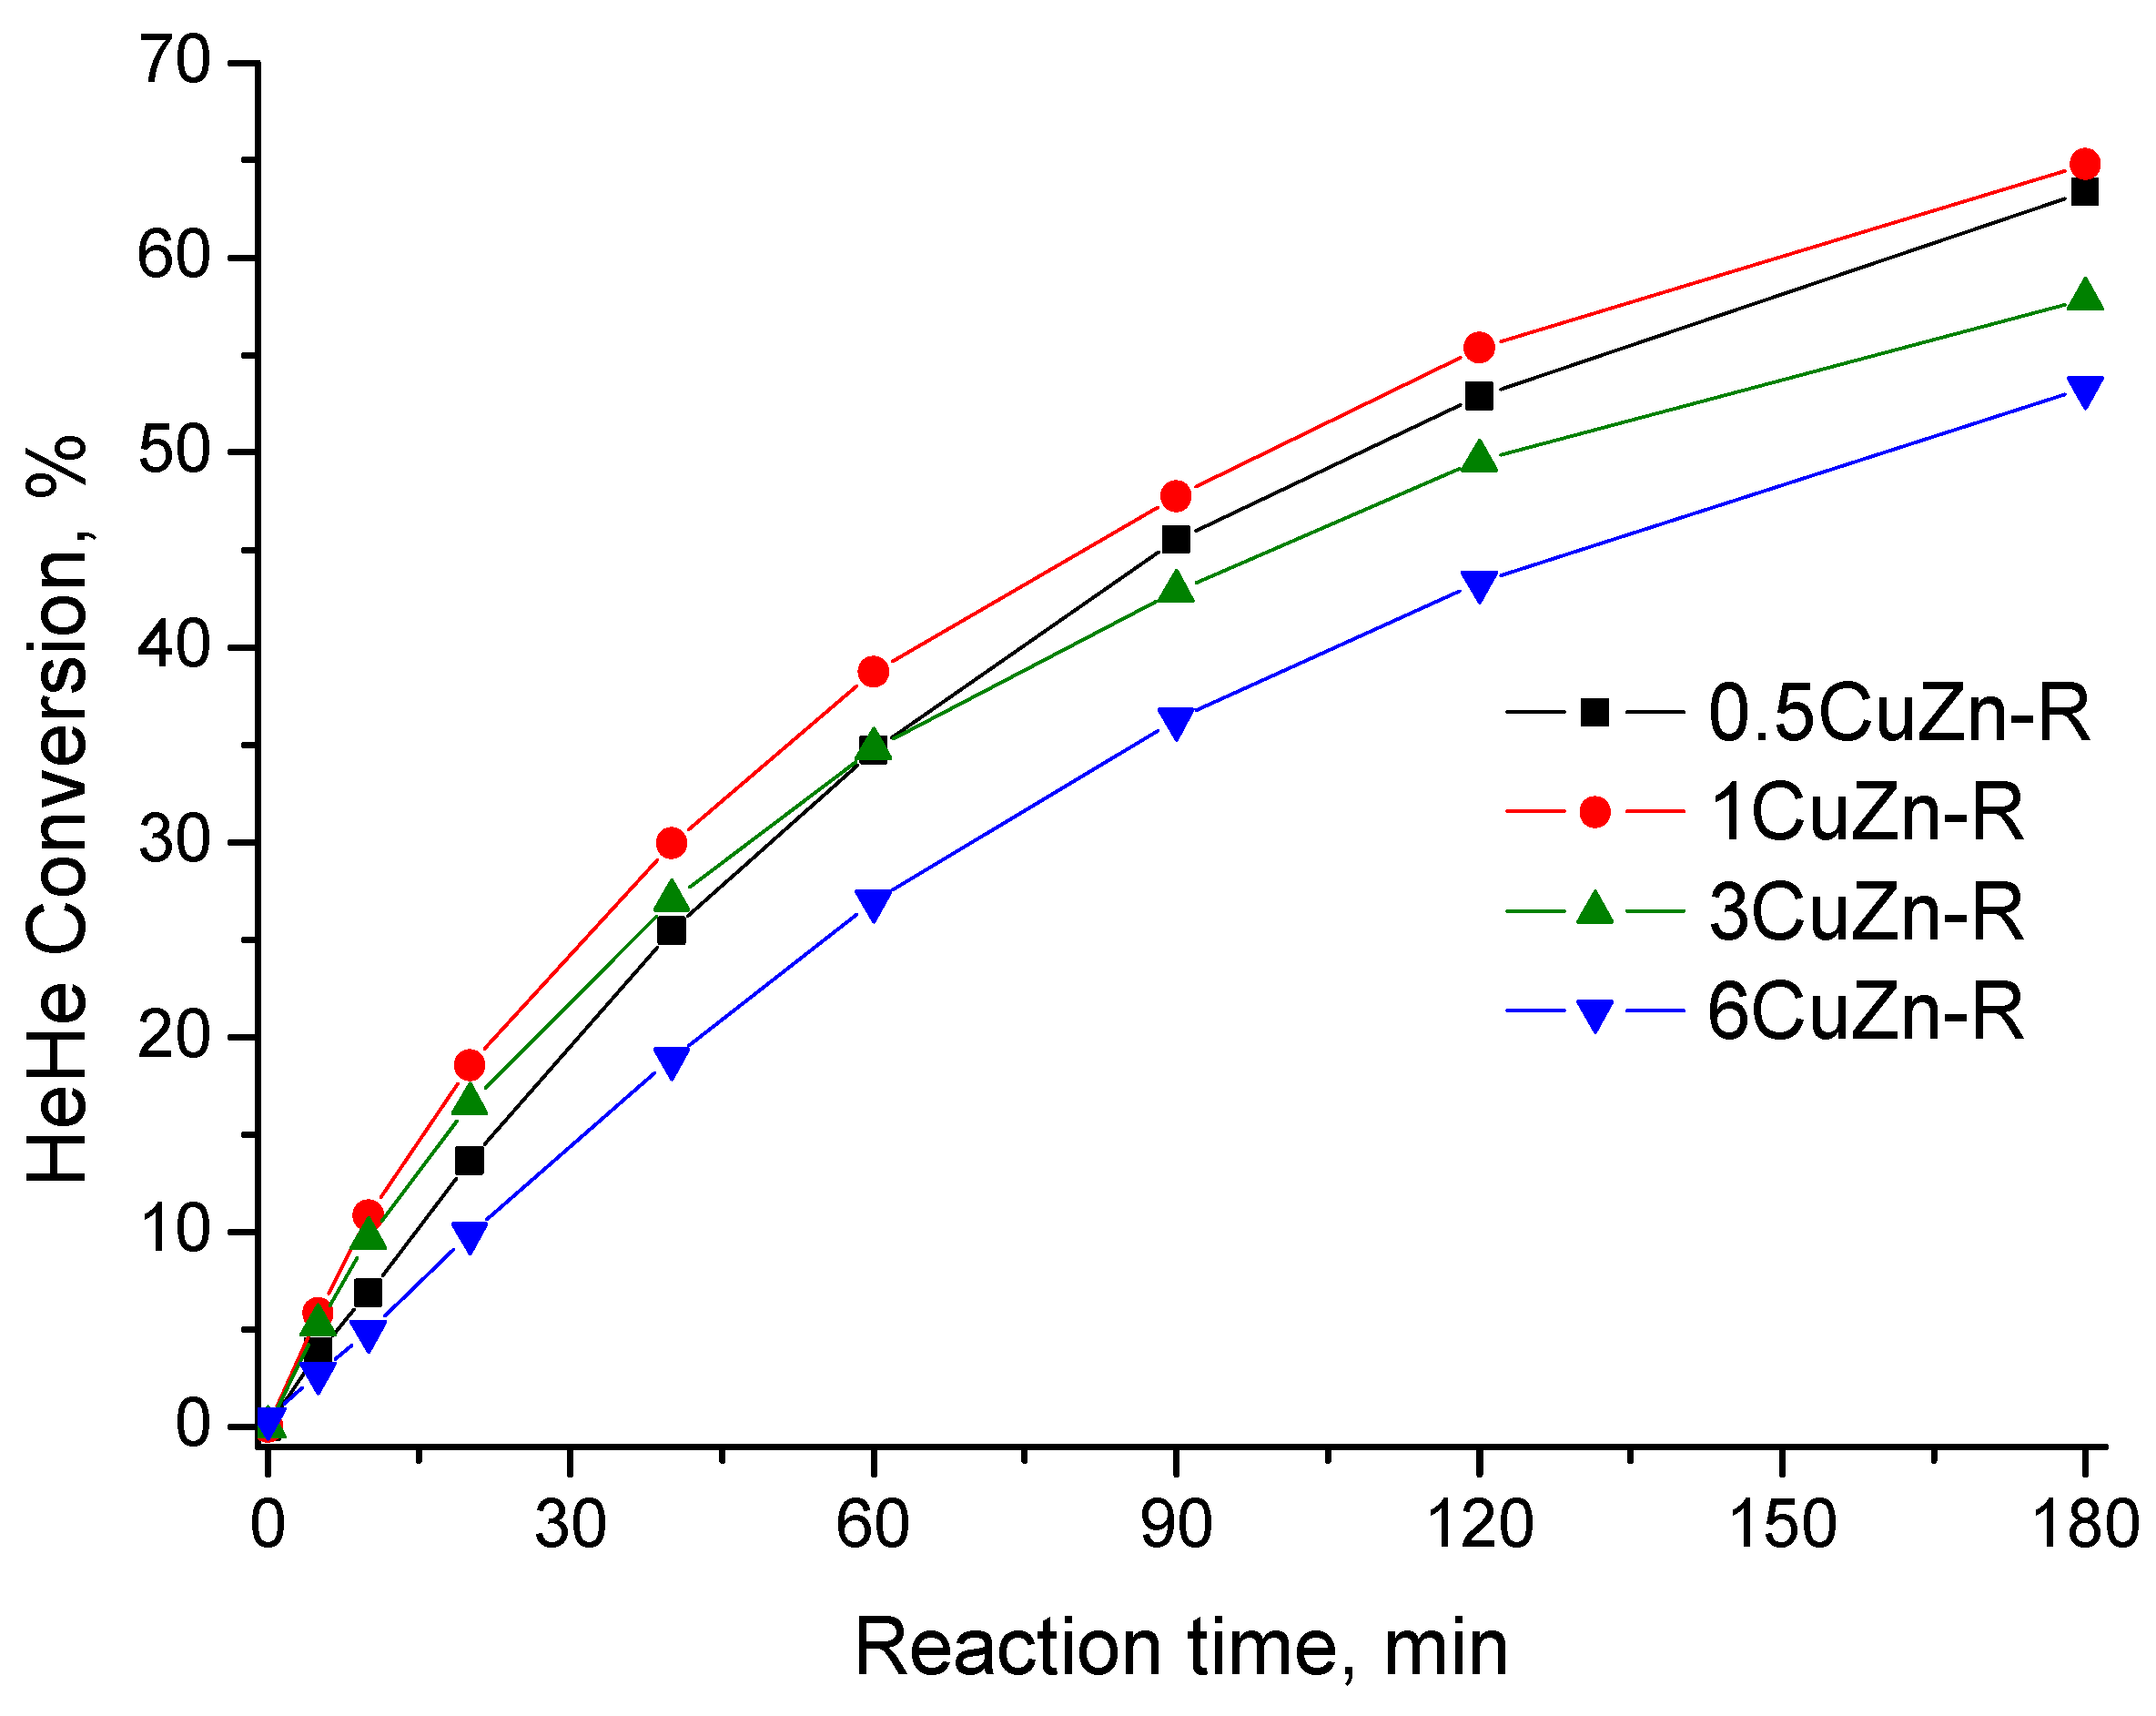
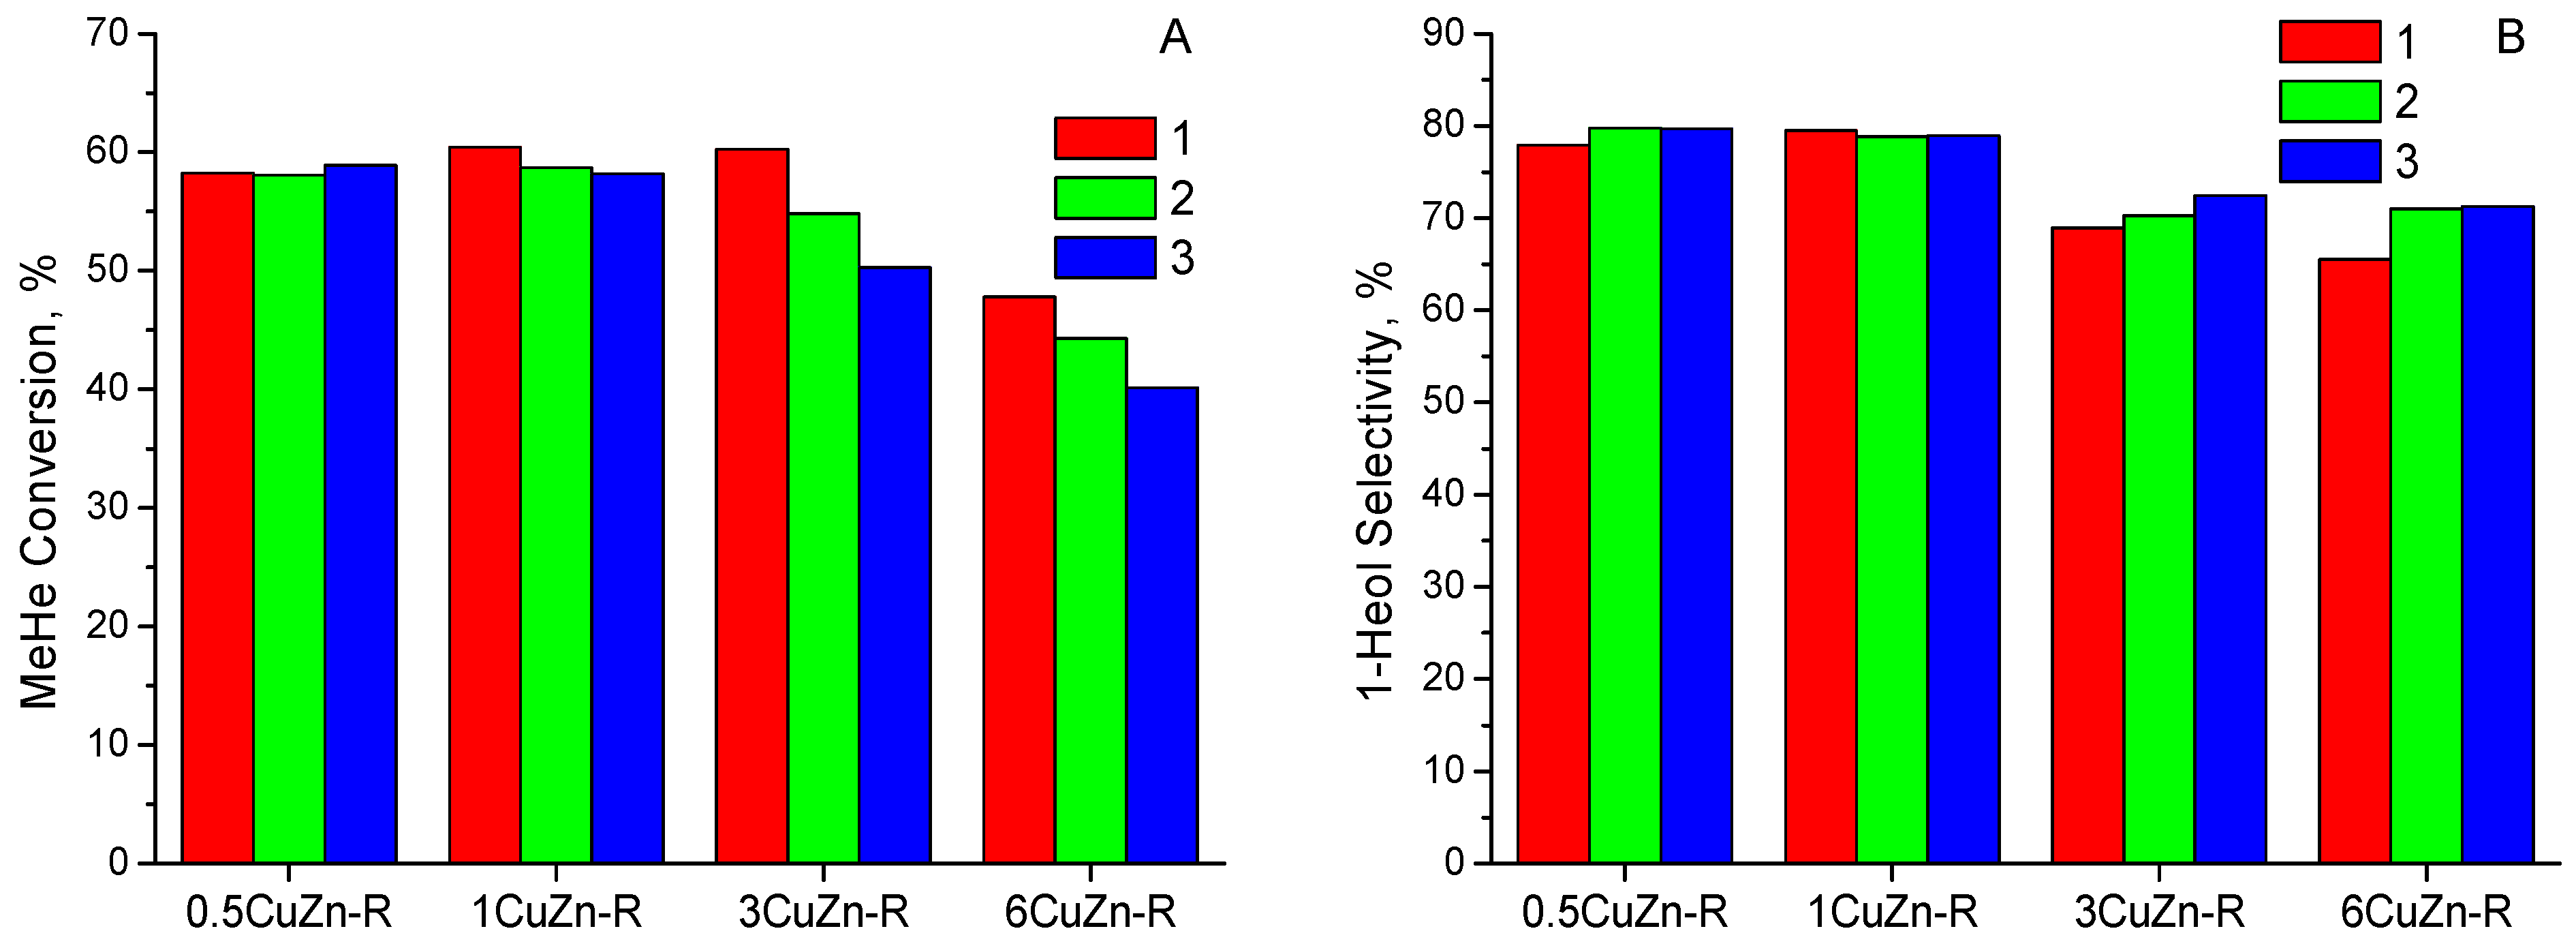
2.2.2. The Hydrogenolysis of Hexyl Hexanoate in Presence of CuZn-R Catalysts with Different Cu/Zn Ratio

Considering the physico-chemical characteristics of CuZn, mixed oxides and their change during the reaction may help in explaining the observed differences in MeHe conversion and product selectivity. But these approaches could not shed light on reasons for a successive increase in the content of HeHe as a transesterification reaction product. The accumulation of HeHe among reaction products with reaction time was puzzling since this compound, also being ester, should also be converted by hydrogenolysis. Therefore, the hydrogenolysis reactivity of MeHe and HeHe should be compared under similar reaction conditions.
Figure 6 demonstrates that, like MeHe, HeHe was effectively transformed by the hydrogenolysis route in presence of all studied CuZn catalysts thus yielding two 1-Heol molecules. HeHe conversion was in the range of 53–65% after 180 min, while a character in the change of HeHe conversion also followed the dependence on Cu/Zn ratio in the catalysts previously observed for MeHe hydrogenolysis. The initial activity of 1CuZn-R and 3CuZn-R in HeHe hydrogenolysis was nearly similar (Table 4), but the activity of the latter significantly slowed down during the reaction (Figure 6). On the other hand, the initial activity of 0.5CuZn-R was lower, but HeHe conversion over this catalyst at the end of the reaction exceeded 60%, i.e., approximately similar to that observed for the most active 1CuZn-R. Finally, HeHe conversion over 6CuZn-R was the lowest independently on reaction time (Figure 6). The comparison of TOF values for either MeHe or HeHe hydrogenolysis showed that TOFMeHe/TOFHeHe ratio was only slightly below 1 for 0.5CuZn-R and 1CuZn-R, while they increased for 3CuZn-R and 6CuZn-R to 1.3 and 1.8, correspondingly (Table 4). The performed calculations evidenced that catalysts with low copper content demonstrated approximately similar performance in the hydrogenolysis of the two esters, while MeHe was converted more effectively compared to HeHe on catalysts with a high Cu/Zn ratio. The obtained TOFMeHe/TOFHeHe values allowed thus explaining the accumulation of HeHe among reaction products formed during MeHe hydrogenolysis on 3CuZn-R and 6CuZn-R. However, the performance of catalysts with a low Cu/Zn ratio requires an additional consideration.
The activity of 1CuZn-R catalyst in the simultaneous conversion of MeHe and HeHe mixture with different MeHe/HeHe ratio (100/0, 85/15, 70/30, 50/50, 30/70, 15/75, and 0/100) was studied under the same reaction conditions. The conversion of the two esters was calculated based on their content in the initial MeHe/HeHe mixtures and after 180 min of the reaction. The conversion of the MeHe constantly increased with decreasing its content in the reaction mixture thus reflecting a concentration effect (Figure 7). In contrast, the conversion of HeHe gradually decreased with decreasing its content (or with increasing the MeHe content) in the MeHe/HeHe mixture. Moreover, at MeHe/HeHe molar ratio of 85/15 the conversion of HeHe had a negative value (Figure 7): this could be interpreted as its additional formation from MeHe by transesterification reaction route rather than its conversion by hydrogenolysis route. Consequently, a decrease in HeHe conversion in other experiments could also be partially explained by the formation of this compound upon the interaction of MeHe with the formed 1-Heol.
Nevertheless, it should be kept in mind that MeHe was converted to 1CuZn-R predominantly to 1-Heol, rather than to HeHe (Figure 4C and Figure 5D). Therefore, both the absence of HeHe conversion at a low HeHe content in the mixture (MeHe/HeHe = 85/15) and a decrease in the HeHe conversion even at a low MeHe content (MeHe/HeHe = 15/85) might also mean that the smaller-size MeHe could introduce an inhibition effect on the conversion of bigger-size HeHe.
This assumption could explain trends in the change of product selectivity observed during the hydrogenolysis of dimethyl adipate (DMA) from our recent studies [21,22,30,37,45,46]. Indeed, selectivity to 1,6-hexanediol was below 20% in a broad range of DMA conversion and it sharply increased only at DMA conversion approaching 100% [37]. Similarly, it was found in a long-time experiment with MeHe as a feed that selectivity to 1-Heol constantly decreased and, in opposite, the selectivity to HeHe increased along with the growth in MeHe conversion up to ≈80%, followed by a sharp increase in 1-Heol selectivity at the expense of the HeHe selectivity (Figure 8). The results suggested that during the hydrogenolysis of methyl esters in presence of CuZn catalysts, a high selectivity to alcohols could not be reached until almost the total conversion of the initial ester was achieved and, consequently, the consumption of a transesterification product would exceed its formation.

2.2.3. The Stability of CuZn Catalysts in Repeating Reaction Cycles

To evaluate the effect of Cu/Zn ratio on the stability of CuZn catalysts in repeated MeHe hydrogenolysis cycles, a reaction mixture after the completion of the first catalytic run was removed from an autoclave through an outlet valve, followed by the addition of a fresh reactant into the reactor. Figure 9 demonstrates MeHe conversion obtained in three consecutive catalytic runs (A) and selectivity to 1-Heol at the end of each experiment in dependence on the Cu/Zn ratio in the catalysts.
Catalysts with lower Cu content, 0.5CuZn and 1CuZn, demonstrated stable performance in three consecutive runs of MeHe hydrogenolysis. In contrast, MeHe conversion gradually decreased in repeating reaction cycles in case of catalysts with higher Cu content, and the decrease in MeHe conversion was the most significant for 6CuZn-R (Figure 9A). Indeed, as evidenced from XRD data, several reaction cycles resulted in further growth in the size of Cu particles in spent catalysts after the third cycle, 3CuZn-AR3 and 6CuZn-AR3 (see the Supplementary Materials, Figure S3), so the gradual decline of their hydrogenolysis performance could be assumed. Nevertheless, the selectivity to 1-Heol at similar MeHe conversion did not change to a great extent in experiments for all the catalysts (Figure 9B) which was consistent with a very small change in size of ZnO particles during the consecutive reaction runs (see the Supplementary Materials, Figure S3). The presented results evidence that CuZn catalysts with the Cu/Zn ratio of 0.5 to 1 demonstrate the remarkable performance in terms of activity, selectivity, and stability in the MeHe hydrogenolysis.

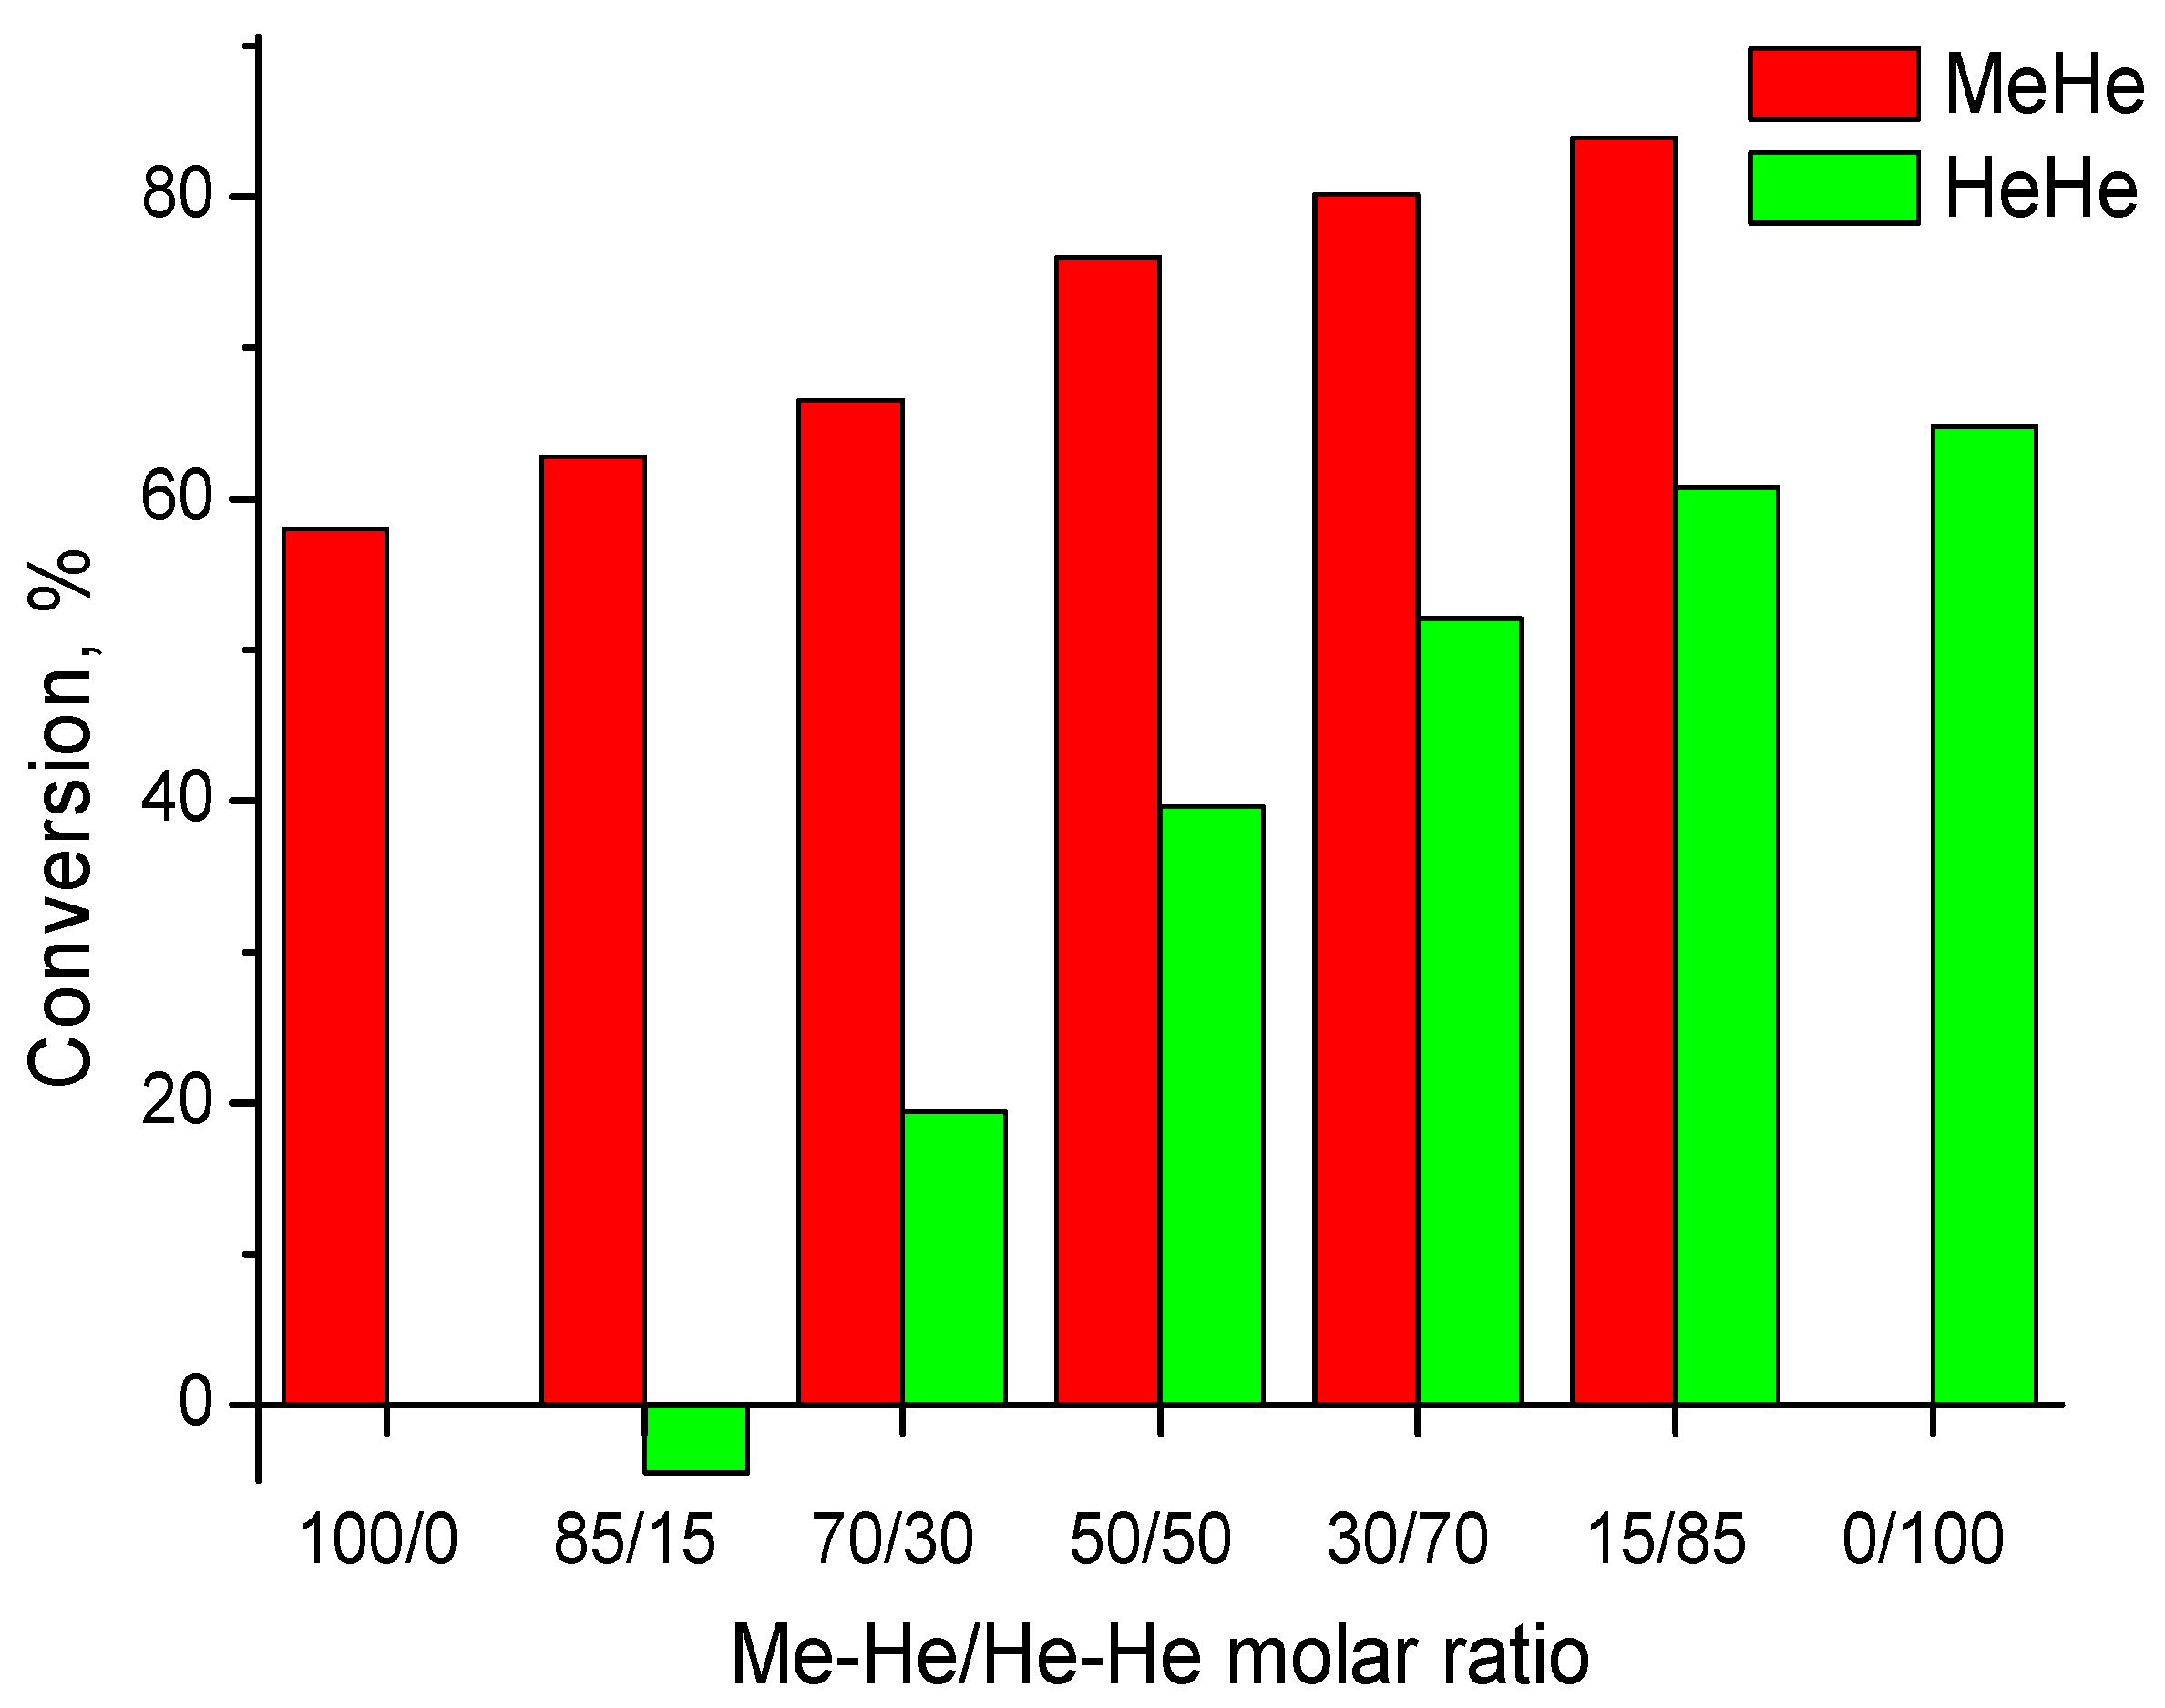
2.2.4. The Hydrogenolysis of Methyl Esters with the Different Length of Carbon Chain

In previous sections we have compared the performance of CuZn catalyst in the hydrogenolysis of two esters with the same C6 acid radical but varied in alcohol radical, i.e., MeHe and HeHe. Consequently, the effect of the size of alkyl chain length in methyl esters on their conversion should also be elucidated. The hydrogenolysis activity of 1CuZn-R catalyst was compared in experiments with methyl hexanoate (MeHe), methyl octanoate (MeOc), methyl laurate (MeLa), and methyl stearate (MeSte). As evidenced from Figure 10A, ester conversion in presence of 1CuZn catalyst gradually decreased from ≈60% in case of both methyl hexanoate and methyl octanoate to ≈47% for methyl stearate. The observed decline in the ester conversion with the growth of a carbon chain could probably be concerned with the increasing struggle of larger molecules for active sites on a catalyst surface. Nevertheless, at the same ester conversion, alcohol selectivity slightly increased with an increase in the carbon chain length (Figure 10B), that could be explained by either a difficulty for large molecules to interact with each other or by the increased hydrogenolysis activity of the resulting ester. Therefore, hydrogenolysis of ester molecules with the increased length of carbon chain prevailed compared with the transesterification step with the participation of two bulky molecules. Nevertheless, the performed experiments evidence the outstanding catalytic performance of CuZn catalysts in the hydrogenolysis of methyl esters varied in their size that allow producing corresponding alcohols with high selectivity.

3. Materials and Methods

3.1. Preparation of Catalysts

Precursors for CuZn catalysts with different copper-to-zinc ratio from 0.5 to 6.0 were prepared by a co-precipitation method based on a recipe described in [21]. An aqueous solution of copper and zinc nitrates, Cu(NO3)2·3H2O (99.0%, Penta, s.r.o., Prague, Czech Republic) and Zn(NO3)2·6H2O (99.6%, Lach:ner, s.r.o., Neratovice, Czech Republic), in a proportion to obtain the desired Cu/Zn ratio and the total concentration of 0.5 mol·L−1 and an aqueous solution of a precipitant Na2CO3 (99.4%, Lach:ner, s.r.o.) with the concentration of 1.0 mol·L−1 were simultaneously dosed into a beaker containing distilled water pre-heated to 60 °C. The temperature of the precipitation was 60 °C, the flow rate of the mixed salt solution was fixed while that of the precipitant solution was continuously adjusted by changing the pump performance to keep a constant pH value of 7 ± 0.1. After completing the precipitation, the mixture was aged for 90 min, the obtained precipitates were filtered, then washed with distilled water and finally, the wet cakes were dried at 60 °C for 24 h. The produced as-prepared precursors were further named as xCuZn-AP, where x stands for Cu/Zn ratio. Calcined samples were produced by the calcination of the precursors at 350 °C in air for 3 h, and named as xCuZn-C.

3.2. Catalyst Characterization

The phase composition of prepared samples and the particle size of the relevant phases present in the catalysts were determined by X-ray diffraction using a diffractometer PANanalytical X’Pert3 Powder (Malvern Panalytical Ltd., Malvern, UK) and Cu Kα radiation. The XRD patterns were recorded in a range of 2θ = 5°–70°. The crystallite sizes were calculated using the Scherrer’s equation, and reflections at 2θ ≈ 31.8°, 43.3°, and 38.6° were used for the particle size calculations for ZnO, Cu, and CuO, respectively [47].
The copper and zinc content in the catalyst precursors was analyzed by XRF using a ARL 9400 XP spectrometer (Thermo ARL, Switzerland) equipped with a rhodium lamp. It was assumed that the Cu/Zn ratio remained the same after the calcination step. The absence of Cu or Zn leaching was confirmed by the analysis of liquid reaction products by AAS using Agilent 280FS AA (Agilent Technologies, Santa Clara, CA, USA), where a mixture of acetylene and air was used as an atomization flame.
Nitrogen physisorption was measured at 77 K using a static volumetric adsorption system (TriFlex analyzer, Micromeritics, Norcross, GA, USA). The samples were degassed at 473 K (12 h) prior to N2 adsorption analysis to obtain a clean surface. The obtained adsorption isotherms were fitted using the Brunauer-Emmett-Teller (BET) method for specific surface area and the BJH method for the distribution of mesopores. The copper surface area was measured by the RFC technique carried out on an Autochem II 2920 (Micromeritics Instrument Corp., Norcross, GA, USA) connected on-line to an RGA 200 quadrupole mass spectrometer (Prevac, Rogów, Poland). The details of the measurements were described previously [21,22].
Temperature-programmed desorption (TPD) of CO2 and NH3 was carried out using a Micromeritics Instrument, AutoChem II 2920 (Micromeritics Instrument Corp., Norcross, GA, USA) equipped with a thermal conductivity detector (TCD) and a quadrupole mass spectrometer MKS Cirrus 2 Analyzer (MKS Instruments, Inc., Andover, MA, USA). Prior to adsorption of CO2, a catalyst was heated under a helium flow (50 mL·min−1) up to 300 °C and kept at this temperature for 60 min to remove impurities from the sample. In the following step, the sample was cooled down to an adsorption temperature of 25 °C and treated with a flow of CO2/He (50%) for 30 min. Then the sample was purged with helium for 90 min to remove physisorbed CO2. Afterwards, the linear temperature program (10 °C·min−1) was started at a temperature of 25 °C and the sample was heated up to a temperature of 450 °C. In experiments on NH3 adsorption, a catalyst was heated under a helium flow (50 mL·min−1) up to 300 °C and kept at this temperature for 60 min to remove impurities from the sample. In the following step, the sample was cooled down to an adsorption temperature of 70 °C and treated with a flow of NH3/He (2.5%) for 30 min. Then the sample was purged with helium for 105 min to remove physisorbed NH3. Afterwards, the linear temperature program (10 °C·min−1) was started at a temperature of 70 °C and the sample was heated up to a temperature of 450 °C.

3.3. Catalyst Testing

All catalytic experiments on the hydrogenolysis of carboxylic acid methyl esters were carried out in a Parr stainless steel autoclave with a reactor volume of 300 mL. Methyl hexanoate (MeHe, SigmaAldrich, ≥99%, Merck Life Science spol. s r.o., Prague, Czech Republic), hexyl hexanoate (HeHe, SigmaAldrich, ≥97%), methyl octanoate (MeOc, SigmaAldrich, 99%), methyl laurate (MeLa, SigmaAldrich, ≥98%) and methyl stearate (MeSte, SigmaAldrich, ≥96%) were used as reactants for the tests. Before a catalytic experiment, a calcined catalyst (usually 1.5 g) was loaded into the autoclave and reduced in situ at 210 °C using H2 (99.9%, SIAD Czech, s.r.o., Prague, Czech Republic). The state of copper and the size of both Cu and Zn particles after the reduction step were determined by unloading the reduced samples from the autoclave. To prevent the re-oxidation of metallic copper species with oxygen in air, hydrogen was replaced with nitrogen after completing the reduction step, the reactor was cooled down to room temperature, methyl hexanoate was added to the reduced sample, and the mixture was stirred for 30 min. Then the sample was separated from the excess of methyl hexanoate by filtration, washed with acetone and dried in ambient temperature. The reduced and treated samples were further named as xCuZn-R.
To start a catalytic experiment, after the reduction step and autoclave cooling, 0.69 mol of a methyl ester was loaded into the reactor. In case of methyl stearate, the mixture of the ester with decalin (decahydronaphthalene, mixture of isomers, Aldrich, 98%) in the volume ratio of 1:2 was used. The reaction temperature was kept at 210 °C, while the hydrogen pressure was kept at 100 bar. The effect of both internal and external diffusion was evaluated by performing catalytic experiments with varying stirring rates and catalyst weights (see the Supplementary Materials, Table S1). Based on these results the stirring rate was kept at 600 RPM. Liquid reaction products were periodically (5, 10, 20, 40, 60, 90, 120, 180 min) withdrawn from the reactor during the experiment, diluted with acetone (1:25 V/V) and analyzed by an Agilent 7820 GC-FID (Agilent Technologies, Santa Clara, CA, USA) using a HP-5 capillary column, 30 m length, 0.32 mm i.d., 0.25 μm thick.
The conversion of methyl esters was evaluated using Equation (1). Due to the absence of cracking reactions (confirmed by the GC analysis of the products), product selectivity was calculated using Equation (2). Methanol was excluded from a consideration because it was present both in liquid and gaseous product streams, which prevented its accurate quantification.
Ester conversion:
(x (t), %) = {(Nester, t = 0 – Nester, t = t)/Nester, t = 0} · 100
Product selectivity:
(S(i), %) = {Nester, i/Nester tot.} · 100,
where Nester, t = 0 stands for the initial number of methyl ester moles, Nester, t = t stands for the number of methyl ester moles at reaction time t, Nester, i stands for the number of methyl ester moles converted to product i, Nester tot. stands for the total number of converted methyl ester moles.
All catalytic experiments were repeated 2–3 times to confirm their reproducibility, and an experimental error was evaluated as ±5%.
In experiments with MeHe, turnover frequency (TOF) was calculated to evaluate the specific activity of copper species in the catalysts with varying Cu/Zn using the equation:
TOF = (MMeHe · xMeHe) · (σCu·NA/mcat ·SCu),
where MMeHe is the amount of MeHe loaded into reactor (mmol), xMeHe is MeHe conversion, NA is Avogadro constant, mcat is the weight of a catalyst (g), and SCu is specific copper area (m2·g−1), σCu is the cross-sectional area of copper equal to 0.0154 nm2.
To follow changes in the characteristics of CuZn samples after catalytic tests, all spent catalysts were separated from a reaction mixture by filtration, washed with acetone, and dried at T = 60 °C for 24 h. The produced spent samples were named as xCuZn-AR.
To understand the stability of the CuZn catalysts in repeated catalytic cycles, their performance was evaluated in three consecutive reaction cycles. For this purpose, the spent catalysts after a catalytic run were separated from the reaction mixture, washed with acetone, dried in ambient temperature, and used in the next experiment without any additional treatments. In this case, spent catalysts after the third catalytic run were named as xCuZn-AR3.

4. Conclusions

The results presented in this study contribute to the understanding of the catalytic performance of CuZn catalysts in the hydrogenolysis of carboxylic acid esters to corresponding alcohols. First, experiments with catalysts differing in the Cu/Zn ratio of 0.5–6 confirmed the positive function of ZnO species in stabilizing metallic copper particles and preventing their sintering. Based on N2O chemisorption and XRD results, it was suggested that the initial activity of the catalysts in the conversion of methyl hexanoate was determined by the surface area of copper particles and their size. As a consequence, the maximum initial activity in the reaction was observed for a catalyst with the Cu/Zn ratio of 3. Nonetheless, during the reaction, the performance of the catalysts changed, and a decrease in their Cu/Zn ratio favored their stability in ester conversion. The high stability of catalysts with the Cu/Zn ratio of 0.5 and 1 in the hydrogenolysis of esters was also confirmed by experiments with three successive reaction cycles. The obtained results were explained considering XRD results on the comparative evaluation of the size of Cu and ZnO particles in calcined, reduced, and spent catalysts. Second, methyl hexanoate conversion resulted in two main products: hexan-1-ol formed via the direct hydrogenolysis of the ester, and hexyl hexanoate as the result of the transesterification reaction of methyl hexanoate with the produced hexanol. Selectivity by transesterification reaction route unexpectedly increased with a decrease in the content of ZnO particles, i.e., the active sites for this reaction step. By correlating the obtained catalytic results with XRD and TPD data it was concluded that the observed transesterification selectivity could be concerned with both the acid-base properties of the CuZn catalysts and the size of the ZnO particles. Third, to explain the excessive formation of the transesterification product, special experiments were carried out on the conversion of either pure hexyl hexanoate and methyl hexanoate or their mixtures. The obtained results demonstrated that the activity of CuZn catalysts in the conversion of both esters was comparable. The accumulation of hexyl hexanoate among the reaction products of methyl hexanoate hydrogenolysis could be explained by the constant formation of the hexyl ester from the methyl ester and by the inhibiting the effect of methyl hexanoate on hexyl hexanoate conversion. As a consequence, selectivity to the latter product constantly increased with a growth in methyl hexanoate conversion, and high selectivity to hexanol as a target reaction product could not be achieved until methyl hexanoate conversion approached 100%. Finally, the investigated CuZn catalyst showed a high efficiency in the conversion of methyl esters with the different lengths of a carbon chain, varying from hexanoate to stearate. Only a slight decrease in the conversion of a starting ester and an increase in alcohol selectivity (at the same conversion level) were observed in the performed experiments, that could be explained by a steric effect. The results obtained in this work can be used in forthcoming studies to optimize the properties of copper-containing catalysts for the selective hydrogenolysis of esters to corresponding alcohols.

Supplementary Materials

The following are available online at https://0-www-mdpi-com.brum.beds.ac.uk/article/10.3390/catal11111417/s1, Figure S1: The profiles of H2 consumption obtained for CuZn mixed oxides with different Cu/Zn ratio, Figure S2: MeHe conversion observed during the conversion of MeHe + 1-Heol mixture in presence of reduced CuZn catalysts with different Cu/Zn ratio as well as single phase ZnO and Cu catalysts, Figure S3: The comparison of Cu (A) and ZnO (B) particle size in spent catalysts after the first (AR) and the third (AR-3) catalytic runs.

Author Contributions

Conceptualization, O.K. and D.K.; methodology, O.K.; investigation, O.K., J.A. and V.P.; data curation, O.K.; writing—original draft preparation, O.K.; writing—review and editing, J.A., V.P. and D.K.; visualization, J.A. and V.P.; supervision, O.K.; project administration, D.K.; funding acquisition, O.K. and D.K. All authors have read and agreed to the published version of the manuscript.

Funding

Financial support from the Ministry of Education, Youth and Sport of the Czech Republic is gratefully acknowledged (project No. LTACH19017).

Data Availability Statement

Not applicable.

Acknowledgments

TPD-CO2 and N2O-RFC characterization results were obtained by using the Large Research Infrastructure ENREGAT supported by the Ministry of Education, Youth and Sports of the Czech Republic (project No. LM2018098). The authors are grateful to Jana Cibulková (UCT Prague, Czech Republic) for XRD analyses, Simona Randáková (UCT Prague, Czech Republic) for XRF analyses, Miloslav Lhotka (UCT Prague, Czech Republic) for N2 physisorption, and Dagmar Fridrichová and Kateřina Karásková for TPD and N2O chemisorption measurements (VSB-TUO, Czech Republic).

Conflicts of Interest

The authors declare no conflict of interest.

References

  1. Turek, T.; Trimm, D.L.; Cant, N.W. The catalytic hydrogenolysis of esters to alcohols. Catal. Rev. Sci. Eng. 1994, 36, 645–683. [Google Scholar] [CrossRef]
  2. Myers, M. Surfactant Science and Technology; John Wiley: New York, NY, USA, 2006. [Google Scholar]
  3. Corma, A.; Iborra, S.; Velty, A. Chemical Routes for the Transformation of Biomass into Chemicals. Chem. Rev. 2007, 107, 2411–2502. [Google Scholar] [CrossRef]
  4. Adkins, H.; Folkers, K. The catalytic hydrogenolysis of esters to alcohols. J. Am. Chem. Soc. 1931, 53, 1095–1097. [Google Scholar] [CrossRef]
  5. Pritchard, J.; Filonenko, G.A.; van Putten, R.; Hensen, E.J.M.; Pidko, E.A. Heterogeneous and homogeneous catalysis for the hydrogenation of carboxylic acid derivatives: History, advances and future directions. Chem. Soc. Rev. 2015, 44, 3808–3833. [Google Scholar] [CrossRef] [Green Version]
  6. Zhu, Y.-M.; Shi, L. Zn promoted Cu–Al catalyst for hydrogenation of ethyl acetate to alcohol. J. Ind. Eng. Chem. 2014, 20, 2341–2347. [Google Scholar] [CrossRef]
  7. Hu, Q.; Fan, G.; Yang, L.; Li, F. Aluminum-Doped Zirconia-Supported Copper Nanocatalysts: Surface Synergistic Catalytic Effects in the Gas-Phase Hydrogenation of Esters. ChemCatChem 2014, 6, 3501–3510. [Google Scholar] [CrossRef]
  8. Huang, C.; Zhang, H.; Zhao, Y.; Chen, S.; Liu, Z. Diatomite-supported Pd–M (M=Cu, Co, Ni) bimetal nanocatalysts for selective hydrogenation of long-chain aliphatic esters. J. Colloid Interface Sci. 2012, 386, 60–65. [Google Scholar] [CrossRef] [PubMed]
  9. Pérez-Cadenas, A.F.; Kapteijn, F.; Zieverink, M.M.P.; Moulijn, J.A. Selective hydrogenation of fatty acid methyl esters over palladium on carbon-based monoliths: Structural control of activity and selectivity. Catal. Today 2007, 128, 13–17. [Google Scholar] [CrossRef]
  10. Figueiredo, F.C.A.; Jordăo, E.; Carvalho, W.A. Adipic ester hydrogenation catalyzed by platinum supported in alumina, titania and pillared clays. Appl. Catal. A General 2008, 351, 259–266. [Google Scholar] [CrossRef]
  11. Pritchard, J.; Ciftci, A.; Verhoeven, M.W.G.M.; Hensen, E.J.M.; Pidko, E.A. Supported Pt-Re catalysts for the selective hydrogenation of methyl and ethyl esters to alcohols. Catal. Today 2017, 279, 10–18. [Google Scholar] [CrossRef]
  12. Echeverri, D.A.; Marín, J.M.; Restrepo, G.M.; Riso, L.A. Characterization and carbonylic hydrogenation of methyl oleate over Ru-Sn/Al2O3: Effects of metal precursor and chlorine removal. Appl. Catal. A General 2009, 366, 342–347. [Google Scholar] [CrossRef]
  13. Luo, G.; Yan, S.; Qiao, M.; Zhuang, J.; Fan, K. Effect of tin on Ru-B/c-Al2O3 catalyst for the hydrogenation of ethyl lactate to 1,2-propanediol. Appl. Catal. A General 2004, 275, 95–102. [Google Scholar] [CrossRef]
  14. Miyake, T.; Makino, T.; Taniguchi, S.; Watanuki, H.; Niki, T.; Shimizu, S.; Kojima, Y.; Sano, M. Alcohol synthesis by hydrogenation of fatty acid methyl esters on supported Ru–Sn and Rh–Sn catalysts. Appl. Catal. A General 2009, 364, 108–112. [Google Scholar] [CrossRef]
  15. Zhang, X.; Chen, S.; Wang, F.; Deng, L.; Ren, J.; Jiao, Z.; Zhou, G. Effect of surface composition and structure of the mesoporous Ni/KIT-6 catalyst on catalytic hydrodeoxygenation performance. Catalysts 2019, 9, 889. [Google Scholar] [CrossRef] [Green Version]
  16. Brands, D.S.; Poels, E.K.; Bliek, A. Ester hydrogenolysis over promoted Cu/SiO2 catalysts. Appl. Catal. A General 1999, 184, 279–289. [Google Scholar] [CrossRef]
  17. Huang, H.; Wang, S.; Wang, S.; Cao, G. Deactivation Mechanism of Cu/Zn Catalyst Poisoned by Organic Chlorides in Hydrogenation of Fatty Methyl Ester to Fatty Alcohol. Catal. Lett. 2010, 134, 351–357. [Google Scholar] [CrossRef]
  18. van de Scheur, F.T.; Staal, L.H. Effects of zinc addition to silica supported copper catalysts for the hydrogenolysis of esters. Appl. Catal. A General 1994, 108, 63–83. [Google Scholar] [CrossRef]
  19. Yuan, P.; Liu, Z.; Zhang, W.; Sun, H.; Liu, S. Cu-Zn/Al2O3 Catalyst for the Hydrogenation of Esters to Alcohols. Chin. J. Catal. 2010, 31, 769–775. [Google Scholar] [CrossRef]
  20. Ding, G.; Zhu, Y.; Zheng, H.; Zhang, W.; Li, Y. Study on the reaction pathway in the vapor-phase hydrogenation of biomass-derived diethyl succinate over CuO/ZnO catalyst. Catal. Commun. 2010, 11, 1120–1124. [Google Scholar] [CrossRef]
  21. Pospelova, V.; Aubrecht, J.; Kikhtyanin, O.; Pacultová, K.; Kubička, D. CuZn Catalysts Superior to Adkins Catalysts for Dimethyl Adipate Hydrogenolysis. ChemCatChem 2019, 11, 2169–2178. [Google Scholar] [CrossRef]
  22. Pospelova, V.; Aubrecht, J.; Pacultová, K.; Lhotka, M.; Kikhtyanin, O.; Kubička, D. Does the structure of CuZn hydroxycarbonate precursors affect the intrinsic hydrogenolysis activity of CuZn catalysts? Catal. Sci. Technol. 2020, 10, 3303–3314. [Google Scholar] [CrossRef]
  23. Fujita, S.-I.; Moribe, S.; Kanamori, Y.; Kakudate, M.; Takezawa, N. Preparation of a coprecipitated Cu/ZnO catalyst for the methanol synthesis from CO2—Effects of the calcination and reduction conditions on the catalytic performance. Appl. Catal. A General 2001, 207, 121–128. [Google Scholar] [CrossRef]
  24. Khassin, A.A.; Jobic, H.; Filonenko, G.A.; Dokuchits, E.V.; Khasin, A.V.; Minyukova, T.P.; Shtertser, N.V.; Plyasova, L.M.; Yurieva, T.M. Interaction of hydrogen with Cu–Zn mixed oxide model methanol synthesis catalyst. J. Mol. Catal. A Chem. 2013, 373, 151–160. [Google Scholar] [CrossRef]
  25. Le Valant, A.; Comminges, C.; Tisseraud, C.; Canaff, C.; Pinard, L.; Pouilloux, Y. The Cu–ZnO synergy in methanol synthesis from CO2, Part 1: Origin of active site explained by experimental studies and a sphere contact quantification model on Cu + ZnO mechanical mixtures. J. Catal. 2015, 324, 41–49. [Google Scholar] [CrossRef]
  26. Van den Berg, R.; Prieto, G.; Korpershoek, G.; van der Wal, L.I.; van Bunningen, A.J.; Laegsgaard-Jorgensen, S.; de Jongh, P.E.; de Jong, K.P. Structure sensitivity of Cu and CuZn catalysts relevant to industrial methanol synthesis. Nat. Commun. 2016, 7, 13057. [Google Scholar] [CrossRef]
  27. Durán-Martín, D.; Granados, M.L.; Fierro, J.L.G.; Pinel, C.; Mariscal, R. Deactivation of CuZn Catalysts Used in Glycerol Hydrogenolysis to Obtain 1,2-Propanediol. Top. Catal. 2017, 60, 1062–1071. [Google Scholar] [CrossRef]
  28. Küksal, A.; Klemm, E.; Emig, G. Reaction kinetics of the liquid-phase hydrogenation of succinic anhydride on CuZnO-catalysts with varying copper-to-zinc ratios in a three-phase slurry reactor. Appl. Catal. A General 2002, 228, 237–251. [Google Scholar] [CrossRef]
  29. Kikhtyanin, O.; Pospelova, V.; Aubrecht, J.; Lhotka, M.; Kubička, D. Effect of Calcination Atmosphere and Temperature on the Hydrogenolysis Activity and Selectivity of Copper-Zinc Catalysts. Catalysts 2018, 8, 446. [Google Scholar] [CrossRef] [Green Version]
  30. Aubrecht, J.; Pospelova, V.; Kikhtyanin, O.; Dubnová, L.; Kubička, D. Do metal-oxide promoters of Cu hydrogenolysis catalysts affect the Cu intrinsic activity? Appl. Catal. A General 2020, 608, 117889. [Google Scholar] [CrossRef]
  31. Yang, X.; Xiang, X.; Chen, H.; Zheng, H.; Li, Y.-W.; Zhu, Y. Efficient Synthesis of Furfuryl Alcohol and 2-Methylfuran from Furfural over Mineral-Derived Cu/ZnO Catalysts. ChemCatChem 2017, 9, 3023–3030. [Google Scholar] [CrossRef]
  32. Millar, G.J.; Holm, I.H.; Uwins, P.J.R.; Drennan, J. Characterization of precursors to methanol synthesis catalysts Cu/ZnO system. J. Chem. Soc. Faraday Trans. 1998, 94, 593–600. [Google Scholar] [CrossRef] [Green Version]
  33. Behrens, M.; Girgsdies, F.; Trunschke, A.; Schlögl, R. Minerals as Model Compounds for Cu/ZnO Catalyst Precursors: Structural and Thermal Properties and IR Spectra of Mineral and Synthetic (Zincian) Malachite, Rosasite and Aurichalcite and a Catalyst Precursor Mixture. Eur. J. Inorg. Chem. 2009, 2009, 1347–1357. [Google Scholar] [CrossRef]
  34. Fujita, S.-i.; Kanamori, Y.; Satriyo, A.M.; Takezawa, N. Methanol synthesis from CO2 over Cu/ZnO catalysts prepared from various coprecipitated precursors. Catal. Today 1998, 45, 241–244. [Google Scholar] [CrossRef]
  35. Kawamura, Y.; Yamamoto, K.; Ogura, N.; Katsumata, T.; Igarashi, A. Preparation of Cu/ZnO/Al2O3 catalyst for a micro methanol reformer. J. Power Sources 2005, 150, 20–26. [Google Scholar] [CrossRef]
  36. Wang, D.; Zhao, J.; Song, H.; Chou, L. Characterization and performance of Cu/ZnO/Al2O3 catalysts prepared via decomposition of M(Cu, Zn)-ammonia complexes under sub-atmospheric pressure for methanol synthesis from H2 and CO2. J. Nat. Gas Chem. 2011, 20, 629–634. [Google Scholar] [CrossRef]
  37. Kikhtyanin, O.; Aubrecht, J.; Pospelova, V.; Kubička, D. On the origin of the transesterification reaction route during dimethyl adipate hydrogenolysis. Appl. Catal. A General 2020, 606, 117825. [Google Scholar] [CrossRef]
  38. Fujitani, T.; Nakamura, J. The effect of ZnO in methanol synthesis catalysts on Cu dispersion and the specific activity. Catal. Lett. 1998, 56, 119–124. [Google Scholar] [CrossRef]
  39. Zhang, S.; Liu, Q.; Fan, G.; Li, F. Highly-Dispersed Copper-Based Catalysts from Cu–Zn–Al Layered Double Hydroxide Precursor for Gas-Phase Hydrogenation of Dimethyl Oxalate to Ethylene Glycol. Catal. Lett. 2012, 142, 1121–1127. [Google Scholar] [CrossRef]
  40. Rønning, M.; Huber, F.; Meland, H.; Venvik, H.; Chen, D.; Holmen, A. Relating catalyst structure and composition to the water–gas shift activity of Cu–Zn-based mixed-oxide catalysts. Catal. Today 2005, 100, 249–254. [Google Scholar] [CrossRef]
  41. Vakros, J. Biochars and Their Use as Transesterification Catalysts for Biodiesel Production: A Short Review. Catalysts 2018, 8, 562. [Google Scholar] [CrossRef] [Green Version]
  42. Meher, L.C.; Vidya Sagar, D.; Naik, S.N. Technical aspects of biodiesel production by transesterification—A review. Renew. Sust. Energ. Rev. 2006, 10, 248–268. [Google Scholar] [CrossRef]
  43. Ataya, F.; Dubé, M.A.; Ternan, M. Acid-Catalyzed Transesterification of Canola Oil to Biodiesel under Single- and Two-Phase Reaction Conditions. Energy Fuels 2007, 21, 2450–2459. [Google Scholar] [CrossRef]
  44. Aransiola, E.F.; Ojumu, T.V.; Oyekola, O.O.; Madzimbamuto, T.F.; Ikhu-Omoregbe, D.I.O. A review of current technology for biodiesel production: State of the art. Biomass Bioenergy 2014, 61, 276–297. [Google Scholar] [CrossRef]
  45. Aubrecht, J.; Pospelova, V.; Kikhtyanin, O.; Veselý, M.; Kubička, D. Critical Evaluation of Parameters Affecting Cu Nanoparticles Formation and Their Activity in Dimethyl Adipate Hydrogenolysis. Catal. Today 2021, in press. [Google Scholar] [CrossRef]
  46. Pospelova, V.; Aubrecht, J.; Kikhtyanin, O.; Kubička, D. Towards efficient Cu/ZnO catalysts for ester hydrogenolysis: The role of synthesis method. Appl. Catal. A General 2021, 624, 118320. [Google Scholar] [CrossRef]
  47. Okamoto, Y.; Fukino, K.; Imanaka, T.; Teranishi, S. Surface characterization of copper(II) oxide-zinc oxide methanol-synthesis catalysts by x-ray photoelectron spectroscopy. 2. Reduced catalysts. J. Phys. Chem. 1983, 87, 3747–3754. [Google Scholar] [CrossRef]
Figure 1. XRD patterns of the as-prepared CuZn precursors (A), calcined mixed oxides (B), samples reduced by a standard method (C), samples reduced and treated with MeHe (D).
Catalysts 11 01417 g001aCatalysts 11 01417 g001b
Figure 2. The crystallite size of CuO or Cu (A) and ZnO (B) determined from XRD patterns of calcined mixed oxides (C), reduced samples (R) and spent catalysts (AR).
Catalysts 11 01417 g002
Figure 3. NH3-TPD (A) and CO2-TPD (B) spectra recorded for calcined CuZn samples varied in Cu/Zn ratio.
Catalysts 11 01417 g003
Figure 4. (A)—Methyl hexanoate (MeHe) conversion in dependence on reaction time for catalysts with different Cu/Zn ratio. (B)—selectivity to hexan-1-ol (1-Heol) and hexyl hexanoate (HeHe) in dependence on MeHe conversion. (C)—The yield of 1-Heol in dependence on MeHe conversion. (D)—The yield of HeHe in dependence on MeHe conversion. Catalyst weight—1.5 g, MeHe load—0.69 mol, Treac. = 210 °C, pH2 = 100 bar.
Catalysts 11 01417 g004
Figure 5. (A). The dependence of TOF in MeHe hydrogenolysis on the size of copper particles in reduced CuZn catalysts. (B). The dependence of HeHe yield in reaction between MeHe and 1-Heol on the size of ZnO particles in reduced CuZn catalysts and a single-phase ZnO.
Catalysts 11 01417 g005
Figure 6. HeHe conversion in dependence on reaction time for different CuZn catalysts. HeHe load—138.2 g (0.69 mol), catalyst weight—1.5 g, Treac. = 210 °C, pH2 = 100 bar.
Catalysts 11 01417 g006
Figure 7. The simultaneous conversion of MeHe and HeHe in their mixture over 1CuZn catalyst. The total amount of esters (MeHe + HeHe) taken for the reaction—0.69 mol, mcat = 1.5 g, Treac. = 210 °C, pH2 = 100 bar.
Catalysts 11 01417 g007
Figure 8. MeHe conversion (A) and selectivity to reaction products (B) observed in a long-time experiment on 1CuZn-R catalyst. The amount of MeHe—0.69 mol, mcat = 3.0 g, Treac. = 210 °C, pH2 = 100 bar.
Catalysts 11 01417 g008
Figure 9. MeHe conversion observed after 180 min in three consecutive runs (numbers 1, 2, and 3 stand for the corresponding reaction runs) in presence of CuZn catalysts (A) and selectivity to 1-Heol at MeHe conversion of 40% (B). Catalyst weight—1.5 g, MeHe load—0.69 mol, Treac. = 210 °C, pH2 = 100 bar.
Catalysts 11 01417 g009
Figure 10. (A) Catalytic performance of 1CuZn catalyst in the hydrogenolysis of methyl esters varied in the length of a carbon chain. (B) Alcohol selectivity at ester conversion of ≈45%. T = 210 °C, pH2 = 100 bar, reaction time—3 h, catalyst weight—1.5 g, ester load—0.69 mol (in case of experiment with Me-Ste catalyst weight was reduced to 0.5 g, while 0.23 mol of the ester was dissolved in decalin), Treac. = 210 °C, pH2 = 100 bar.
Catalysts 11 01417 g010
Table 1. The physico-chemical characterization of CuZn as-prepared samples, calcined mixed oxides, and spent catalysts.
SampleAs-Prepared SamplesCalcined SamplesSpent Catalysts
Targeted Cu/Zn RatioCuO by XRF, wt.%ZnO by XRF, wt.%Cu/Zn Ratio by XRFBET
Surface Area, m2·g−1
Pore Volume, cm3·g−1BET
Surface Area, m2·g−1
Pore Volume, cm3·g−1
0.5CuZn
1CuZn
3CuZn
6CuZn
0.5
1
3
6
35.2
51.4
75.8
85.9
64.8
48.6
24.2
14.1
0.54
1.05
3.12
6.08
59
61
64
60
0.23
0.26
0.26
0.25
53
46
34
16
0.22
0.19
0.15
0.04
Table 2. The number of acid and basic sites determined from TPD profiles of adsorbed NH3 and CO2, respectively.
SampleNumber of Acid Sites, mmol·g−1Number of Basic Sites, mmol·g−1
0.5CuZn-C
1CuZn-C
3CuZn-C
6CuZn-C
0.135
0.136
0.168
0.151
0.176
0.187
0.237
0.190
Table 3. H2-TPR and N2O chemisorption data for CuZn mixed oxides.
SampleCuO Content (wt.%) by XRFConsumed H2
(mmol·g−1)
CuO Content (wt.%)
Calculated from Adsorbed H2
SCu,
m2·gcat−1
SCu,
m2·gCu−1
Cu
Dispersion, %
0.5CuZn-C
1CuZn-C
3CuZn-C
6CuZn-C
35.2
51.4
75.8
85.9
4.62
7.03
10.10
11.42
36.8
55.9
80.4
90.9
14.0
15.1
15.1
11.9
50
37
25
17
3.65
2.73
1.85
1.29
Table 4. Initial reaction rates and TOF values calculated for CuZn catalyst in MeHe hydrogenolysis.
CatalystMeHe HydrogenolysisHeHe HydrogenolysisTOFMeHe/
TOFHeHe
Initial Reaction Rate,
rini (nMeHe·gcat−1·min−1)
TOF × 10−2
(s−1)
Initial Reaction Rate,
rini (nHeHe·gcat−1·min−1)
TOF × 10−2
(s−1)
0.5CuZn-R
1CuZn-R
3CuZn-R
6CuZn-R
1.83
2.49
3.23
2.70
2.0
2.5
3.3
3.5
1.99
2.70
2.49
1.49
2.2
2.5
2.8
1.9
0.9
0.9
1.3
1.8
Table 5. The initial rate of HeHe formation calculated for initial 40 min of a reaction between MeHe and 1-Heol on xCuZn-R catalysts. The content of ZnO in the catalysts was taken from Table 1.
SampleZnO Content in Catalysts, gHeHe Yield (%) after 40 minFormation Rate, mmolHeHe·gcat−1·min−1Corrected
Formation Rate,
mmolHeHe·gZnO−1·min−1
ZnO
0.5CuZn-R
1CuZn-R
3CuZn-R
6CuZn-R
0.75
0.97
0.72
0.36
0.20
4.45
1.40
1.46
1.89
3.61
0.82
0.13
0.13
0.17
0.33
0.82
0.20
0.28
0.73
2.43
Publisher’s Note: MDPI stays neutral with regard to jurisdictional claims in published maps and institutional affiliations.

