Article

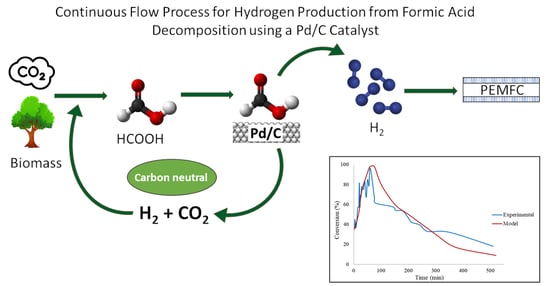
Decomposition of Additive-Free Formic Acid Using a Pd/C Catalyst in Flow: Experimental and CFD Modelling Studies

1
Division of Chemical & Energy Engineering, School of Engineering, London South Bank University, London SE1 0AA, UK
2
Cardiff Catalysis Institute, School of Chemistry, Cardiff University, Main Building, Park Place, Cardiff CF10 3AT, UK
3
Environment & Life Sciences Research Centre, Kuwait Institute for Scientific Research, P.O. Box: 24885, Safat 13109, Kuwait
4
Dipartimento di Chimica, Universitá degli Studi di Milano, via Golgi, 20133 Milan, Italy
5
Department of Chemical Engineering, University College London, London WCIE 7JE, UK
6
Dipartimento di Chimica Industriale e dei Materiali, ALMA MATER STUDIORUM Università di Bologna, Viale Risorgimento 4, 40136 Bologna, Italy
7
Department of Chemical Engineering Cyprus University of Technology, 57 Corner of Athinon and Anexartisias, Limassol 3036, Cyprus
*
Author to whom correspondence should be addressed.
These authors contributed to the work equally.
Submission received: 30 January 2021 / Revised: 1 March 2021 / Accepted: 2 March 2021 / Published: 7 March 2021

Abstract

:
The use of hydrogen as a renewable fuel has gained increasing attention in recent years due to its abundance and efficiency. The decomposition of formic acid for hydrogen production under mild conditions of 30 °C has been investigated using a 5 wt.% Pd/C catalyst and a fixed bed microreactor. Furthermore, a comprehensive heterogeneous computational fluid dynamic (CFD) model has been developed to validate the experimental data. The results showed a very good agreement between the CFD studies and experimental work. Catalyst reusability studies have shown that after 10 reactivation processes, the activity of the catalyst can be restored to offer the same level of activity as the fresh sample of the catalyst. The CFD model was able to simulate the catalyst deactivation based on the production of the poisoning species CO, and a sound validation was obtained with the experimental data. Further studies demonstrated that the conversion of formic acid enhances with increasing temperature and decreasing liquid flow rate. Moreover, the CFD model established that the reaction system was devoid of any internal and external mass transfer limitations. The model developed can be used to successfully predict the decomposition of formic acid in microreactors for potential fuel cell applications.

Graphical Abstract

1. Introduction

The use of conventional fossil fuels for energy production have led to serious climate and environmental concerns. The steep rise in energy demand will result in global fossil fuel consumption rate to double in the next 30 years, leading to faster depletion of these fuels. This has led to the development of alternative technologies to obtain renewable fuels. Hydrogen (H2) is a prime example of such fuels which gained increasing attention because of its high energy density and efficiency. H2 can also be used for proton exchange membrane fuel cells (PEMFC). H2 as a clean alternative energy source can be obtained from water electrolysis, hydrogenase, biomass, and formic acid (FA) [1].
Formic acid has been considered as a desirable source of H2 due to its high H2 density (≈4.4 wt.%), non-toxicity, stability, and sustainability. H2 production from formic acid decomposition typically occurs via two pathways, the common path being dehydrogenation of formic acid which generates and carbon dioxide (CO2) as a by-product. On the other hand, the dehydration of formic acid is another route which can produce water (H2O) and undesirable carbon monoxide (CO) [2]. The catalysts employed for the dehydrogenation of formic acid can be classified into two distinct categories which are homogeneous and heterogeneous ones. The former type is often based on Ir [3], Ru [4], and Fe [5] complexes, and typically have high selectivity and catalytic activity. Heterogeneous catalysts are often based on Pt [6], Au [7], Pd [8,9], Ag [10], Co nanoparticles [11], and allow and provide ease of separation, better control, and are recyclable [12].
The catalysts gaining increasing attention in current studies are Pd-based and those with Pt-group metals. These catalysts are distinguished by their high activity and selectivity’s [13]. The heterogeneous decomposition of formic acid takes place in gas phase due to the high reaction temperature (373 K). Subsequent research focused on the development of efficient heterogeneous catalysts to perform the liquid phase decomposition of formic acid [1]. Sanchez et al. [9] studied the performance of a commercial 5 wt.% Pd/C catalyst for the catalytic, additive-free decomposition of formic acid at mild conditions. The catalyst demonstrated an excellent 99.9% H2 selectivity and a high catalytic activity (TOF = 1136 h−1) at 30 °C toward the selective dehydrogenation of formic acid to H2 and CO2.
It has been reported that the H2 production rate of formic acid decomposition can be significantly increased by using Pd-Au binary alloy nano-catalysts. Choi et al. [14] developed an approach to produce Pd-Ag bimetallic core–shell nano catalysts with synergistic regulation of the ligand and strain effects of Ag. The prepared octahedral PdAg@Pd core–shell nanocrystals showed a noticeable catalytic performance towards hydrogen production from formic acid decomposition. The maximum catalytic activity was attained with PdAg@Pd nanocrystals comprising of PdAg alloy cores with an average Pd/Ag atomic ratio of 3.5:1 and 1.1 atomic layer of Pd shells, which revealed a high turnover frequency of 21,500 h−1 at 50 °C. It was concluded that the catalytic activity was a result of enhanced combination of the electronic promotion and lattice strain effects of Ag on Pd. A study conducted by Akbayrak [15] investigated the decomposition of formic acid using tungsten (VI) oxide supported AgPd nanoparticles. Bimetallic AgPd nanoparticles supported on WO3 were successfully prepared for this study. The activity of AgPd/WO3 catalysts with different Ag loading was tested in dehydrogenation of FA in presence of sodium formate at 50.0 ± 0.1 °C. Ag0.25Pd/WO3 catalyst with a TOF value of 683 h−1 exhibited high activity in this reaction.
Zhao et al. [16] investigated the H2-generating behaviour of Pd-decorated gold nanoparticles (Pd-on-Au NPs) via formic acid decomposition. It was found that the Pd-on-Au NPs were catalytically active, with a reaction rate constant as high as 137 mL-H2/gPd/min (corresponding to an initial turnover frequency TOF of 123 h−1) at a Pd loading of 300 surface coverage, sc%. On the other hand, Au NPs were inactive, and Pd NPs were somewhat active (5 mL-H2/gPd/min and TOF of 38 h−1). Furthermore, the formation of CO was hindered at a Pd loading of 300 sc%, indicating that three-dimensional Pd ensembles benefited the preferred dehydrogenation pathway whereas single-atom and small two-dimensional Pd ensembles are active for the undesired dehydration pathway. Recently, the photocatalytic production of H2 from formic acid has attracted great attention. Duan et al. [17] investigated the efficient photocatalytic hydrogen production from formic acid on inexpensive and stable phosphide/Zn3In2S6 (ZIS6) composite photocatalysts under mild conditions. Ni2P and MoP were used as co-catalysts and the results showed photocatalytic H2 production rates of the optimised 1.5 wt.% Ni2P/ZIS6 (45.73 μmol·h−1) and 0.25 wt.% MoP/ZIS6 (92.69 μmol·h−1) were 3.5 times and 7.2 times higher than that of the pure ZIS6 (12.88 μmol·h−1), respectively. In addition, it was observed that the notable improvement of the H2 production performance is accredited to the introduction of the phosphide cocatalysts, which can act as a charge separation centre as well as an active site for photocatalytic hydrogen production from the decomposition of formic acid.
The practical application of H2 production via formic acid decomposition is highly dependent on the design of highly efficient and cost-effective catalysts. Alamgholiloo et al. [18] investigated the formation and stabilisation of colloidal ultra-small palladium nanoparticles on diamine-modified Cr-MIL-101. Here, ultra-small nano-sized palladium particles were effectively stabilised within the pores of diamine groups grafted open metal site metal-organic frameworks of Cr-MIL-101; coordinated diamine groups of ethylene diamine (ED) and propyl diamine (PD) on the active site of chromium units of Cr-MIL-101. The Cr-MIL-101 stabilized ultra-small Pd nanoparticles, Pd@(ethylene diamine)/Cr-MIL-101, and Pd@(propyl diamine)/Cr-MIL-101, displayed catalytic activity for clean dehydrogenation of formic acid and generation of hydrogen at room temperature. The results demonstrated that the Pd@ED/Cr-MIL-101 catalyst displays high catalytic activity with TOF of 583 h−1 at 328 K, as opposed to majority of the reported catalysts, including Pd@PD/Cr-MIL-101 with TOF 532 h−1. The study allows the investigation of novel techniques to the design of an ultra-small metal nanoparticle for the catalytic dehydrogenation of formic acid.
Luo et al. [19] dispersed ultrafine and electron-rich IrPdAu alloy nanoparticles with a size of 1.4 nm on amine-modified mesoporous SiO2 (NH2-SBA-15) and applied it as a highly active and selective catalyst for fast H2 production from formic acid. The synthesized IrPdAu/NH2-SBA-15 holds exceptional catalytic activity and 100% selectivity towards H2 with an initial TOF of 6316 h−1 with the additive of sodium formate (SF) and 4737 h−1 devoid of SF at 298 K, as opposed to most effective heterogeneous catalysts. The excellent performance of IrPdAu/NH2-SBA-15 was not only attributed to the amalgamation of the electronic synergistic effect of trimetallic alloys and the strong metal–support interaction effect, but also credited to the amine (−NH2) alkaline groups grafted on SBA-15, which are beneficial to boost the split of the O-H bond of formic acid.
Studies investigating the decomposition of formic acid in batch reactors are unable to produce a continuous stream of H2 for fuel cell applications. In addition, these types of reactors do not allow a detailed study of the catalyst lifetime to give an indication of its long-term performance. Therefore, the study of formic acid decomposition in continuous flow reactors is imperative to the extensive understanding of this reaction. The decomposition of formic acid has been explored using homogeneous and heterogeneous catalysts in continuous stirred tank reactors (CSTR) [20,21,22]. However, in these studies, the stoichiometric equivalent of amines was utilised. As a result, there is a requirement to investigate the additive-free dehydrogenation of formic acid under mild conditions in a continuous flow system. Furthermore, other types of continuous reactors—such as packed bed reactors—are yet to be explored in detail for this study due to their widespread presence in other fuel production systems, and the benefits they offer when compared to CSTR systems.
Microreactors have been utilised for renewable fuel production due to various advantages such as enhanced mass transfer, better temperature control leading to improved heat transfer and larger surface area-to-volume ratios [23,24,25,26]. The collective advantages of microreactors allow the process to be greener and more environmentally sustainable. Recently microreactors for H2 production have been employed to provide an on-line H2 source for polymer electrolyte membrane fuel cells (PEMFCs). Consequently, microreactors have exhibited a favourable outlook for H2 production [27]. Packed bed microreactors can be categorised as having channel dimensions of up to 10 mm [24]. Several studies have investigated fuel production in packed bed microreactors [28,29,30,31].
The studies mentioned have proved that the decomposition of formic acid is often investigated on an experimental basis. Performing numerical studies using CFD software are beneficial as it provides an understanding of parameter optimisation for the decomposition of formic acid reaction for H2 production. The CFD modelling of microreactor systems for this reaction has not yet been established for this reaction, making the current work highly novel. H2 production from additive-free formic acid decomposition using a 5 wt.% Pd/C catalyst was investigated using a packed bed microreactor in this study. The characterisation of the catalyst series (fresh and used) was studied in detail using transmission electron microscopy (TEM). A computational fluid dynamic (CFD) packed bed microreactor model was developed to gain an understanding of the mass transfer and heterogeneous reaction occurring within the model. A validation of the experimental results with the CFD model is shown, and a good model validation was obtained. Further studies of comparison between the performance of a batch reactor with the continuous packed bed reactor are conducted herein.

2. Results and Discussion

2.1. Model Results

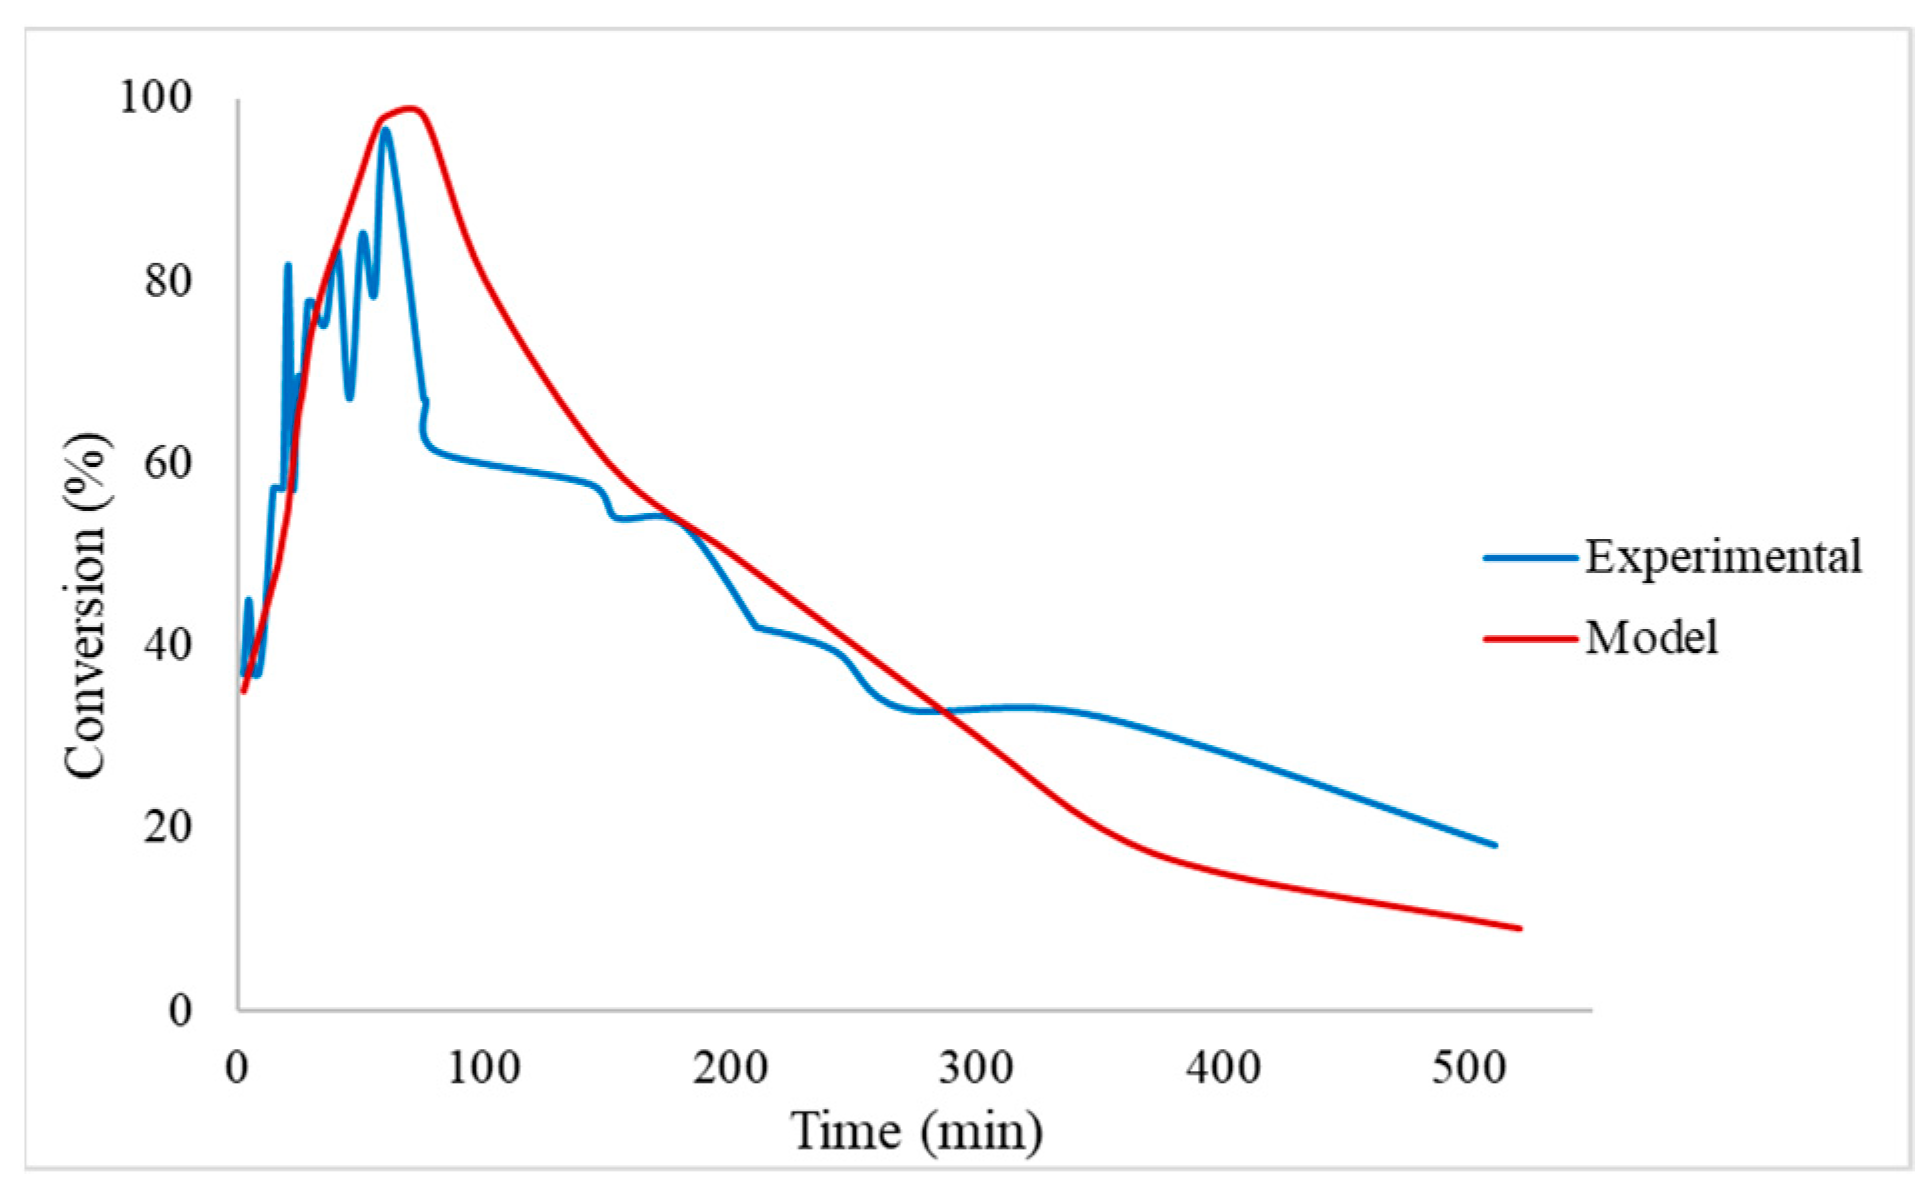
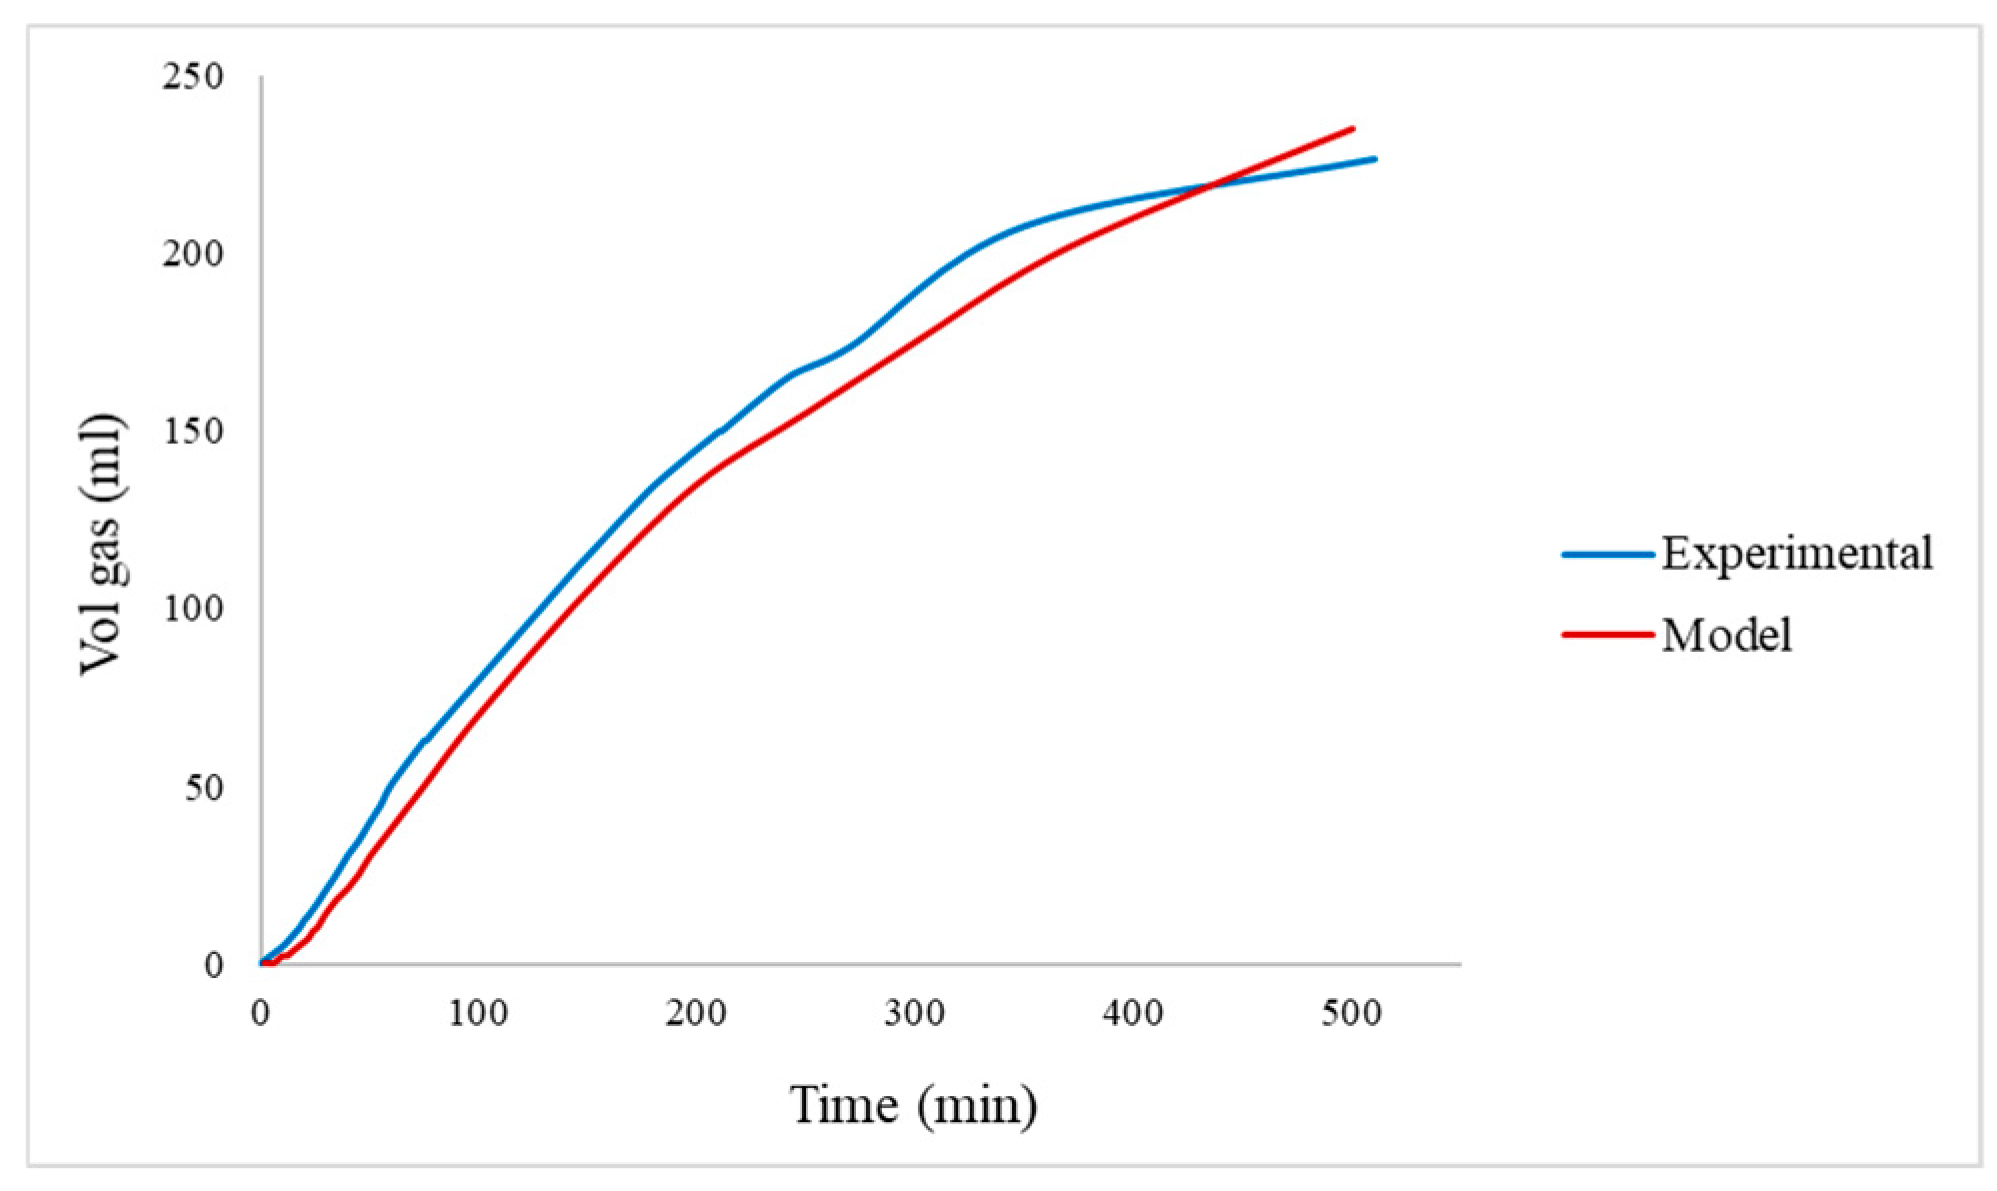
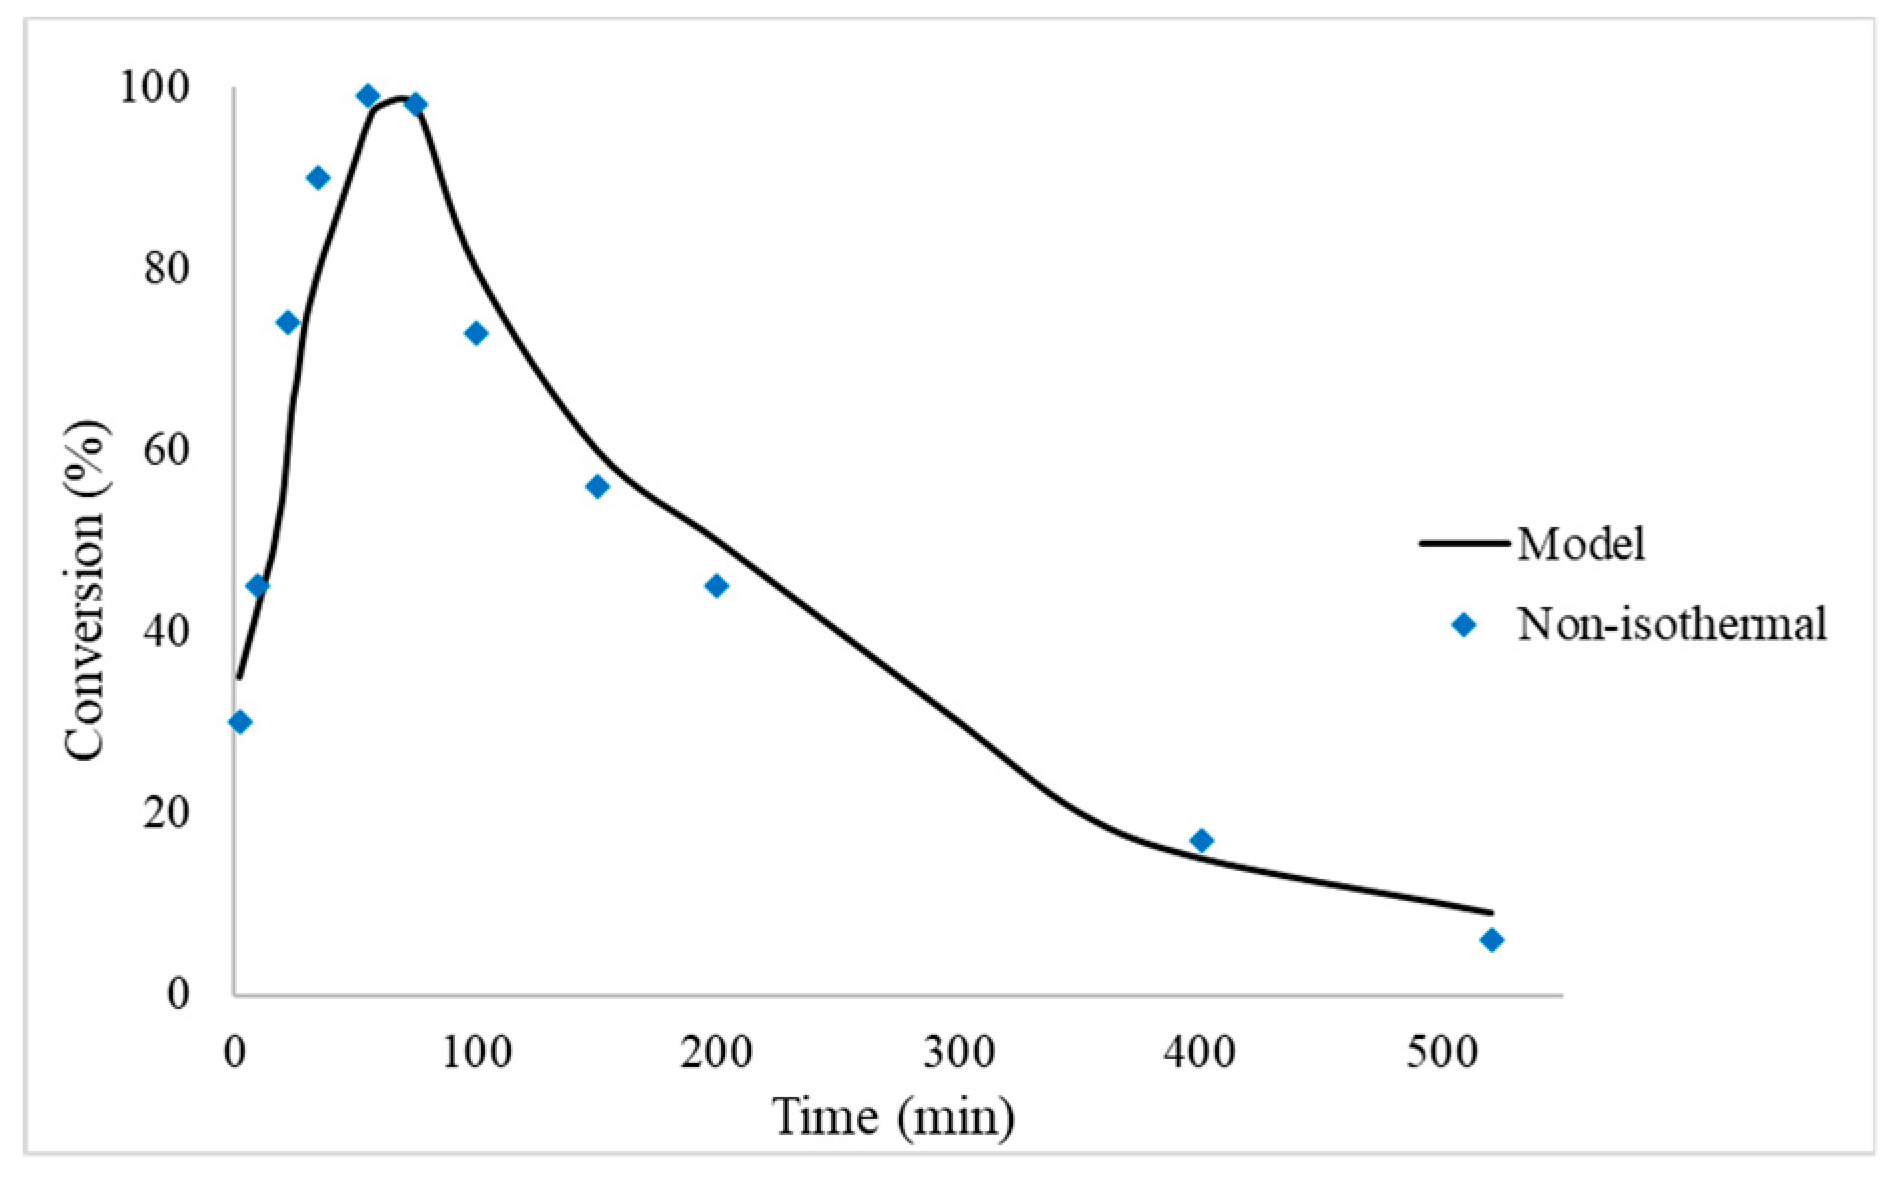
2.1.1. Model Validation

The results obtained from the CFD packed bed microreactor model were compared to the experimental data to assess their validity. Figure 1 demonstrates the comparison between the experimental and modelling results at constant reaction conditions for both studies. The results show that the conversion of formic acid initially increases with time reaching a maximum conversion at approximately 75 min. However, the conversion decreases rapidly after a certain time (75 min) and then continues to do so steadily with time which is due to possible deactivation of the Pd/C catalyst, which is consistent with the time found for the modelling study. The factors that can reduce the active of the Pd/C catalyst are, the increment of mean particle size, oxidation of the catalyst by formation of PdO and strong chemisorption of intermediates or products such as CO and H2 [32]. This last factor has previously been assumed as the cause for the inhibition effect [33]. It can be observed that there is a good agreement between the experimental and modelling results.
The main issue with the Pd/C catalyst is its loss of partial or complete activity. Possible causes of deactivation may be poisoning, fouling, sintering, erosion, and coking [34]. The main reason for deactivation of the Pd/C catalyst is poisoning of the catalyst [35]. The majority of research groups have proposed that the CO is the poisoning molecule [36,37,38,39]. CO can adsorb stronger on Pd than CO2 and H2, [40] and it has been shown by using Attenuated Total Reflection Infrared Spectroscopy (ATR-IR). CO is chemisorbed on the Pd based catalyst [41]. Furthermore, the formation of palladium hydride has been suggested as a possible reason for deactivation [42]. Moreover, for continuous flow reactor studies, the blockage of pores of the catalysts and eventually loss of surface area has been reported [31]. Another main cause of deactivation of the Pd/C catalyst may be sintering [35]. Here, the metal particles migrate across the support leading to the aggregation of metal particles, and often results in permanent damage. Frequent poisons include elements from VA, VIA, VIIA, toxic heavy metals, etc. However, both coking and sintering take place at much higher temperatures than the mild reaction temperature used in our study.
This loss of activity, or catalytic deactivation, introduces another level of complexity to modelling the catalytic reaction. The activity of the catalyst at time t, a(t), can be defined as the ratio of the rate of reaction on a catalyst that has been used for a time t to the rate of reaction on a fresh catalyst (t = 0) [35]:
a ( t ) = r A ( t ) r A ( t = 0 )
Due to the catalyst decay, the catalytic activity decreases with time and the curve of the activity can be observed in Figure 2. By obtaining the relevant activity parameters, the deactivation of the catalyst was modelled and demonstrated a sound validation with the experimental findings.
The deactivation of the Pd/C catalyst has widely been investigated and poisoning species have been reported. Hu et al. [43] investigated the decomposition of aqueous formic acid solution in a batch reactor using a Pd/C catalyst. It was found that the catalyst lost activity continuously with reaction time and deactivation is attributed to the loss of active sites by proton, CO2, H2O, and HCOO intermediate. Nonetheless, the deactivation of Pd is reversible and the formation of HCOO on Pd is a key deactivation step, which should be taken into consideration when designing a Pd-based catalyst with enhanced stability. Additionally, Sanchez et al. [9] investigated the stability of the Pd/C catalyst in a batch reactor under mild conditions. It was concluded that the decrease in activity could be the result of factors such as, strong adsorption of formic acid on the catalytic surface, poisoning from CO, agglomeration of the Pd nanoparticles, or decrease of Pd loading by leaching.
Studies have shown that Pd/C catalysts, enriched with the active ingredient of more than 5%, are unstable and deactivate quickly [44]. Despite this, the reasons for deactivation have rarely been studied. Troitskii et al. [45] conducted a novel investigation to determine the reasons for deactivation of the Pd/C catalyst. Highly dispersed palladium catalysts containing 4% of Pd deposited on a sibunite carbon support were synthesised, and their physicochemical and catalytic properties were studied for initial samples and for those after the debenzylation–acylation reaction conducted in soft conditions (atmospheric pressure of hydrogen, 25 °C). The analytical results showed that the surface area of Pd decreases due to the catalyst deactivation. Further results indicated that the sintering of the particles of the active component, and the removal of Pd from the support, are not solely responsible for the catalyst deactivation. It was found that an approximate 10-fold decrease in activity during the reaction, is because of catalyst carbonisation caused by the formation of a nanoscale graphite phase on the surface of the active component particles. This observed low-temperature carbonisation was discovered for the first time. Earlier, it was reported for high-temperature catalytic reactions only (300 °C and above).
Vinayakumar et al. [46] investigated the reactivation of a deactivated Pd/C catalyst (due to the passing of fresh H2S through fresh Pd/C) by exploring different methods. The study showed that reactivation can be achieved by extracting the metal in a suitable media and subsequent re-impregnation on the carbon support, followed by liquid media reduction. Additionally, another method explored was the suitable surface treatment of the deactivated catalyst. The results from the XPS spectra show that the oxidation state of Pd varies, depending on the reducing agent. Furthermore, it was found that a small amount of the poisoning species is still present despite the surface treatment. Nonetheless, the amount of the poisoning species decreased as the strength of the reducing species increased. CO breakthrough studies were performed for the reactivated catalyst both in the presence and absence of moisture. It was observed, that as the intensity of the sulphur peaks decreases, the CO removal activity of reactivated Pd/C increases and moisture remains necessary for the catalysts to work (100% activity) for both HCHO reduced and NaBH4 reduced catalysts. Even though the process is lengthy, the activity of the deactivated Pd/C catalyst can be redeemed by the extraction of Pd followed by its re-impregnation. As a result, using simple wet chemical routes, the effects of H2S poisoning can be reversed without affecting the support. Furthermore, the methods are cost-effective and scalable to be adapted in an industrial set-up.
At lower reaction temperatures of 30 °C, a small amount of CO, approximately 6 ppm, is produced [9]. The comprehensive CFD model can be utilised to predict the catalyst activity based on the concentration of CO accumulated during the reaction, since, poisoning of the catalyst by CO could be one of the reasons for the decrease in catalytic activity. Figure 3 depicts the conversion of formic acid against time. At the point of deactivation, the decrease in conversion observed after 75 min is modelled based on the CO concentration produced, and the activity parameter
a ( t ) = 1 λ × C C O
From Figure 3, there is a good agreement between the modelling and the experimental data. This suggests that the loss in activity of the Pd/C catalyst can be attributed to the accumulation of CO during the decomposition of formic acid for hydrogen production reaction. Furthermore, the comprehensive CFD model can successfully predict the deactivation of the Pd/C catalyst based on the poisoning species CO.
Further validation between the two sets of data was performed by comparing the volume of gas produced with time. Figure 4 depicts the volume of gas produced with respect to time, and it can be observed that as the reaction time increases, the volume of H2 and CO2 also increases. Depending on the temperature, formic acid decomposition may follow dehydration pathway which produces CO and water instead of dehydrogenation. At 30 °C, the extent to which dehydration pathway is followed is very limited and CO concentration has been reported to be approximately 4–6 ppm [9]. Initially the production of gas increases linearly; however, as the reaction progresses, the rate of hydrogen production is slower and at the end of the reaction the production of gas has reached a plateau. These results agree with the reaction profile of conversion of formic acid where the conversion has reached a maximum and then follows a progressive decrease due to deactivation. Furthermore, the CFD modelling results have exhibited a good validation with the experimental data, implying that the packed bed microreactor model can predict the hydrogen production from formic acid and the reaction profile during the reaction.

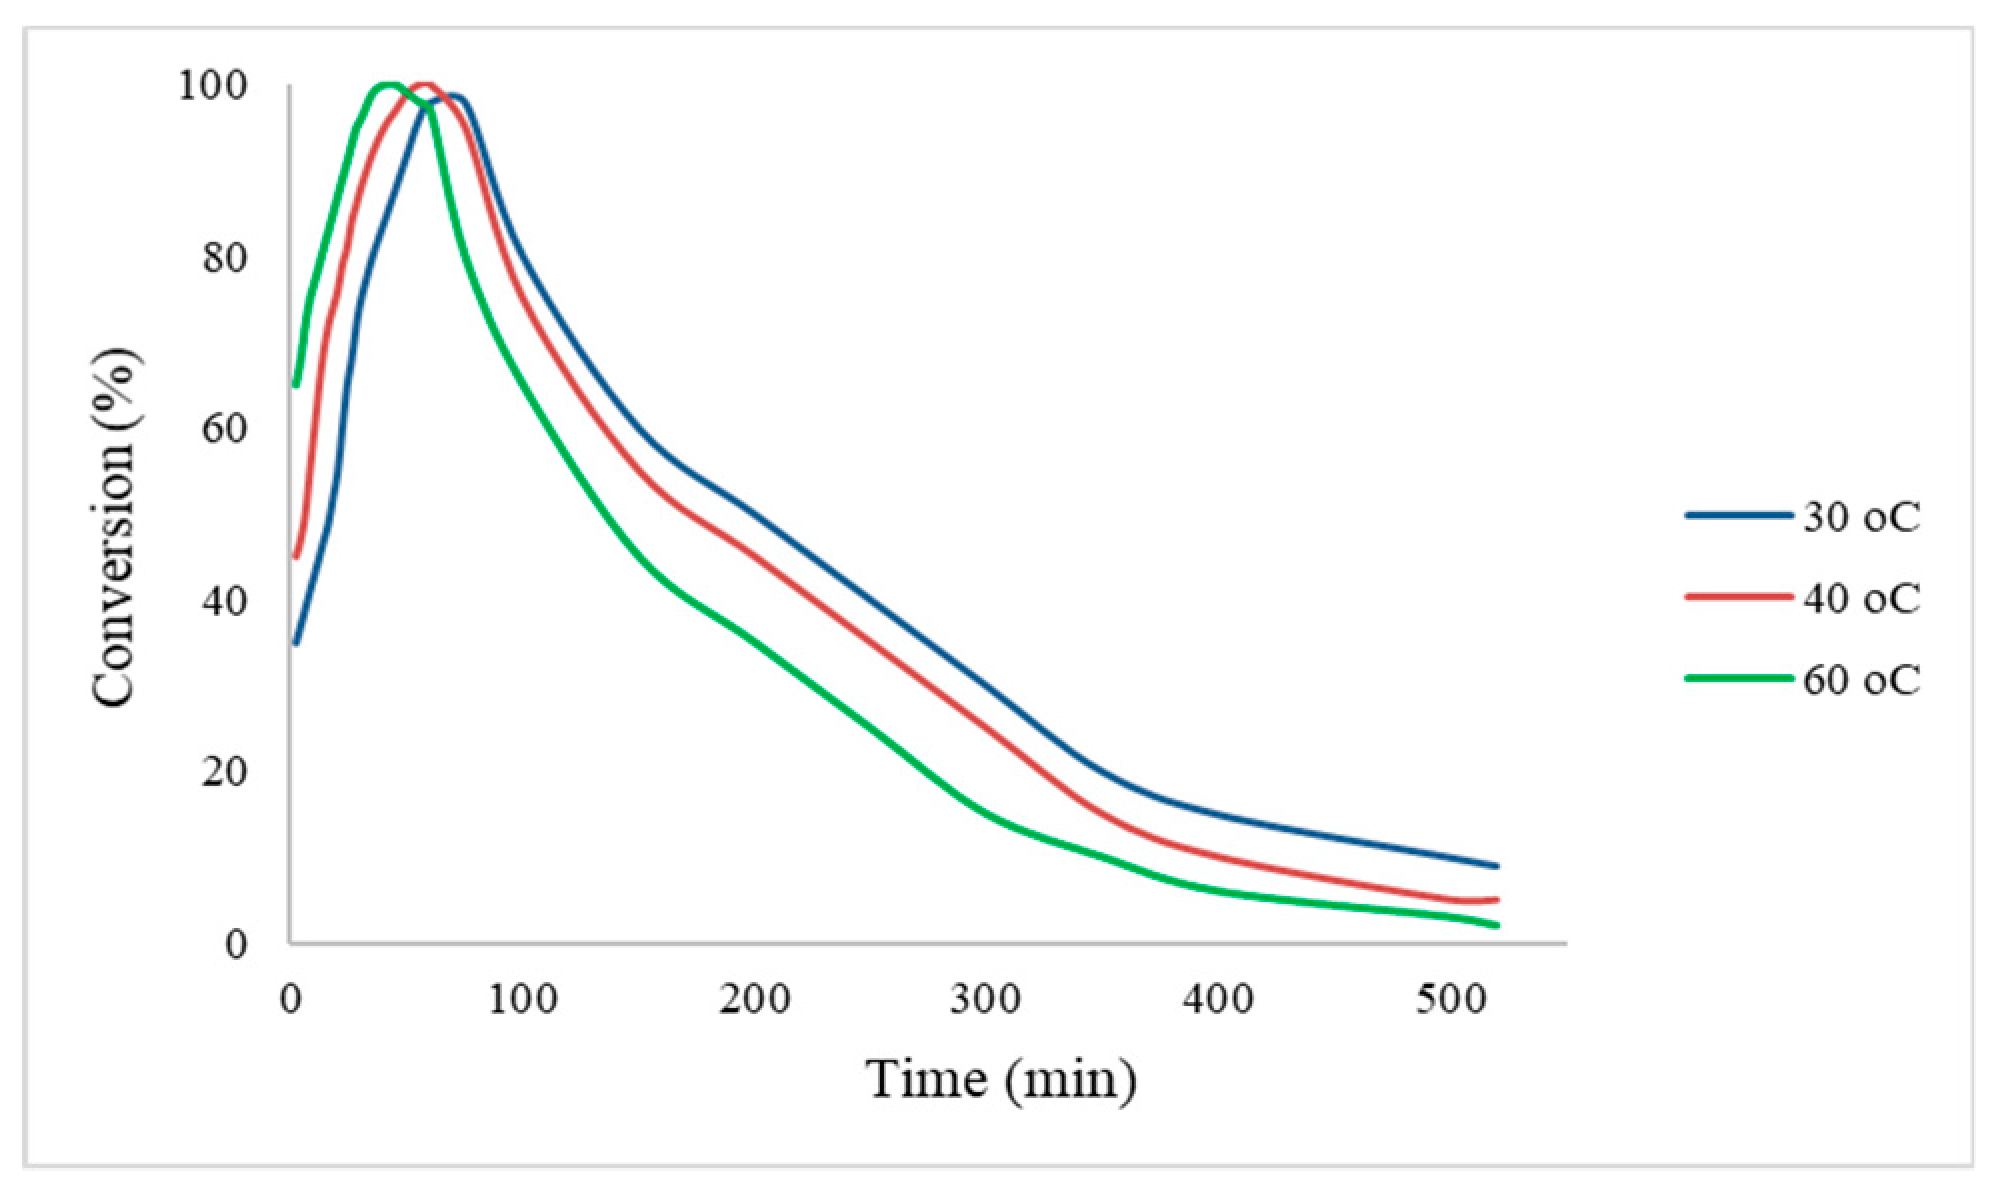
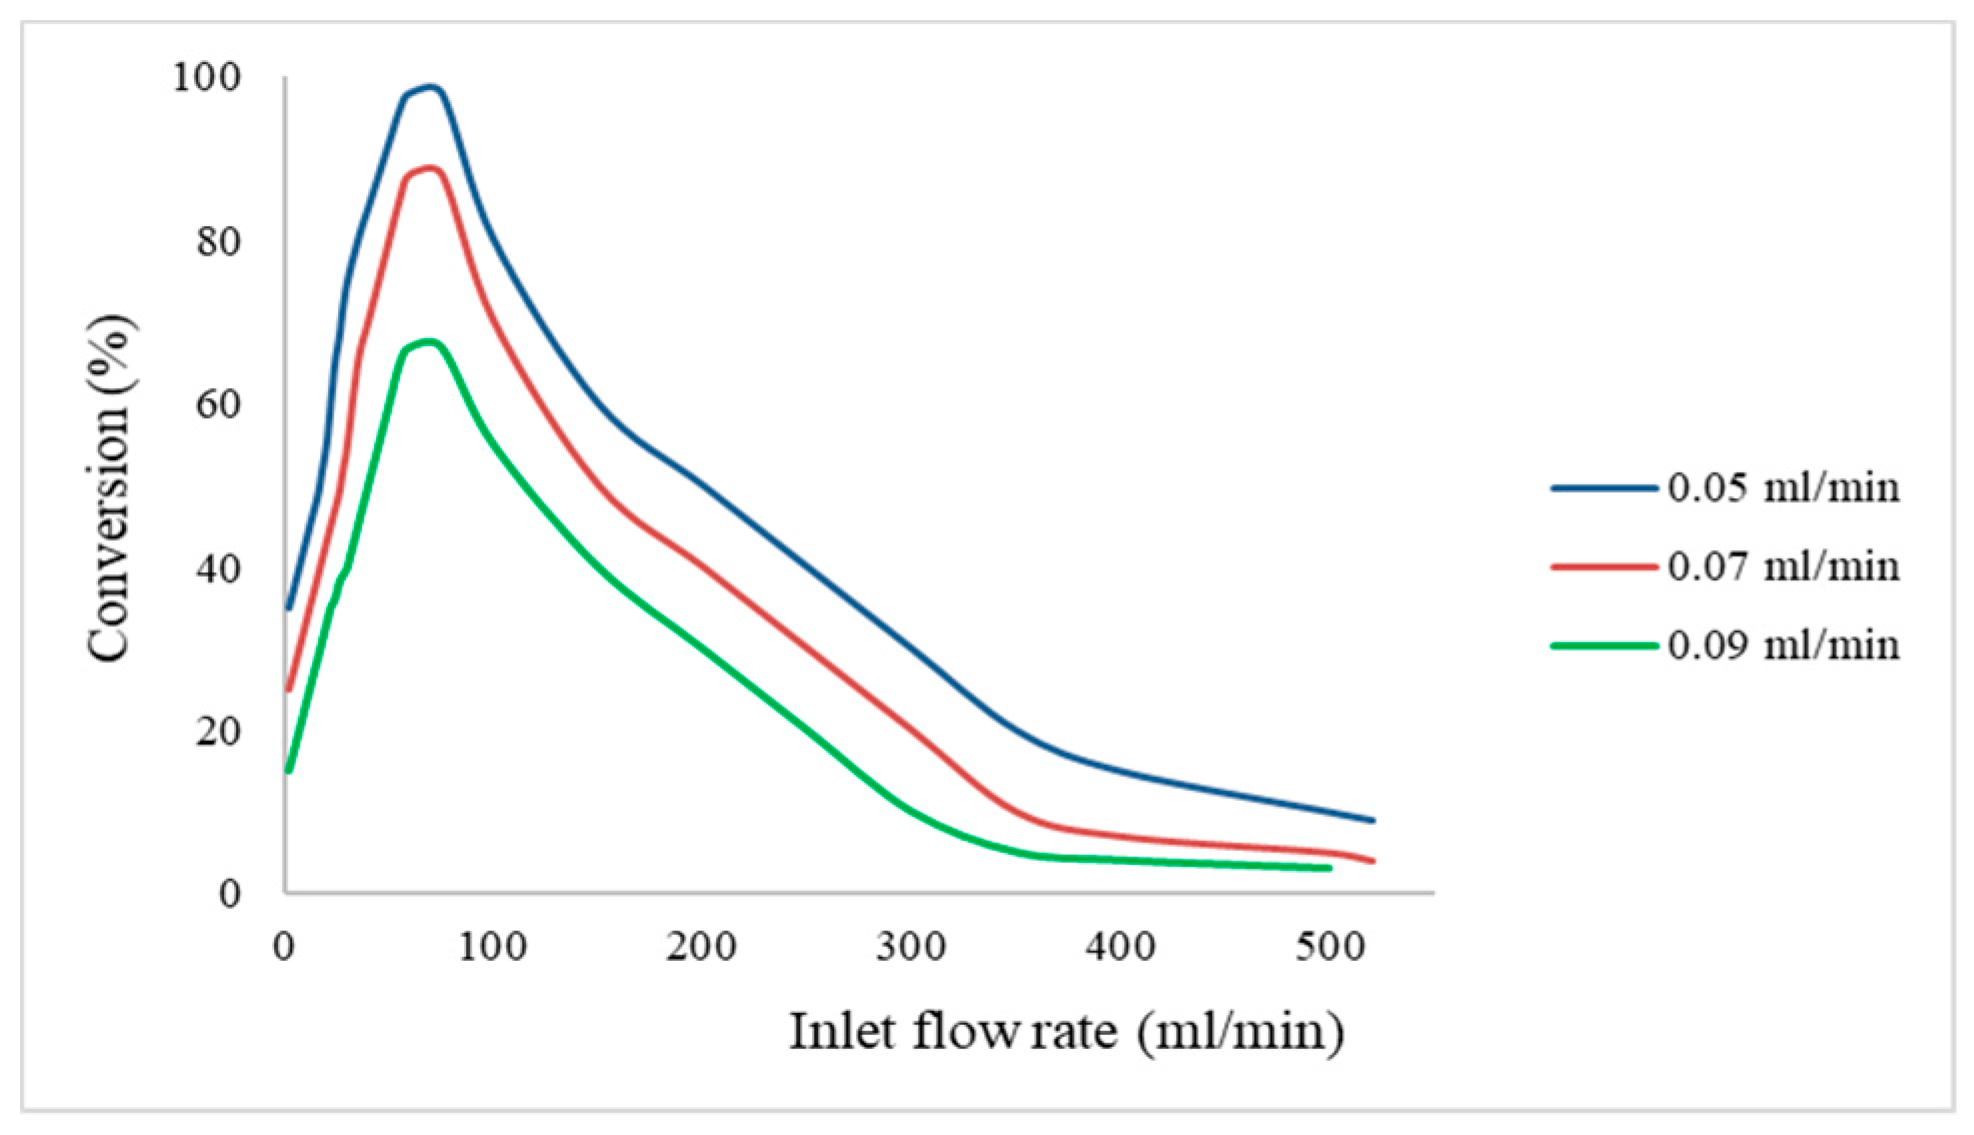
2.1.2. Effects of Temperature and Liquid Flow Rate

The effects of temperature on the decomposition of formic acid were investigated which is observed in Figure 5. As the reaction temperature increases, the conversion of formic acid also increases as expected. Typically, temperatures more than 60 °C are not studied since portable devices which employ formic acid fuel cells require milder operating conditions. According to the Arrhenius expression, k = A e E a R T , an apparent activation energy of 39 kJ/mol was reported for this reaction with a monometallic Pd catalyst for a batch reactor configuration [9]. The catalytic deactivation is stronger at higher temperatures; therefore, higher reaction temperatures promote the pathway of dehydration and CO formation causing the catalyst to deactivate faster.
Although the packed bed microreactor model operates isothermally at 30 °C, non-isothermal conditions were also investigated to determine any heat transfer effects. The new conditions were achieved by including an energy balance for the microreactor. The results in Figure 6 depict an insignificant difference in formic acid conversion between the isothermal and non-isothermal configurations. This suggests that, for this specific reaction and reaction conditions, heat transfer effects are eliminated in the packed bed microreactor.
The effects of the inlet flow rate of formic acid on the conversion was also investigated at a reaction temperature of 30 °C. The liquid flow rate varied from 0.05–0.09 mL/min and the remaining operating conditions were kept constant. Figure 7 depicts that as the inlet flow rate of formic acid increases, the conversion decreases. This is because the reacting fluids spend lesser time within the packed bed microreactor with an increasing liquid flow rate, subsequently leading to lower reactant conversion. This is consistent with the dependence of conversion of a reactant upon the space velocity.

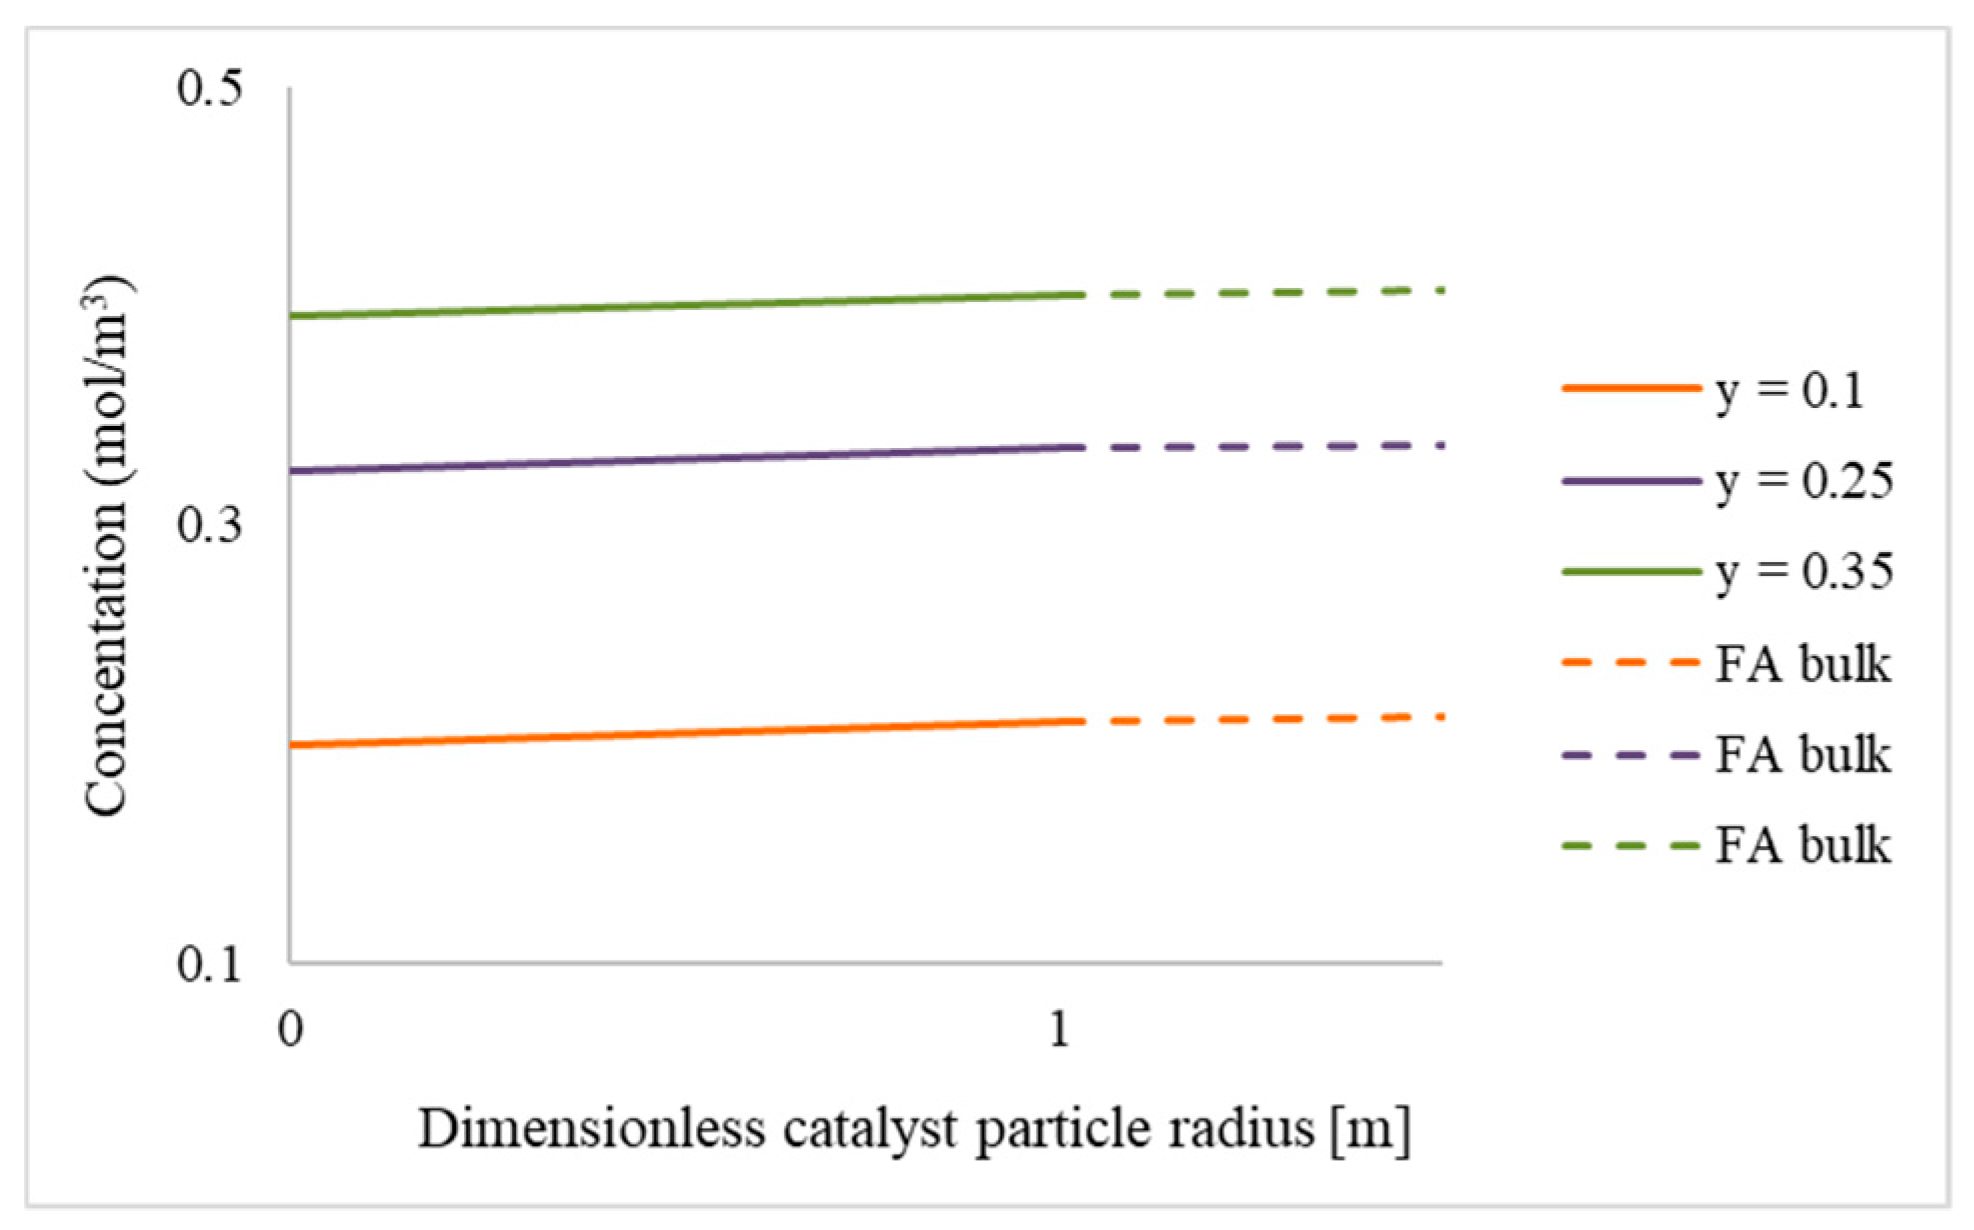
2.1.3. Internal and External Mass Transfer Resistances

During a heterogeneous reaction, the mass transfer of reactants begins from the bulk fluid to the external surface of the catalyst particle, followed by the diffusion of the reactants from the external surface into the pores of the pellet. The internal pore diffusion limitations of the model are investigated by observing the resistances occurring between the reacting fluids or products which take place between the external pellet surface and the inside of the pellet. Utilising the model to investigate the internal mass transfer resistances can lead to an understanding of whether the internal diffusion limits the overall rate of reaction, or if the surface reaction is rate-limiting. This will enable a greater understanding of which parameters improve or lessen the mass transfer rates (affecting the apparent rate of reaction). Therefore, facilitating the optimisation of the formic acid decomposition reaction.
Figure 8 displays the concentration profiles inside the catalyst pellet from r = 0 (centre) to r = 1. The results were achieved at an axial length of x = 1.25 cm, and varying reactor heights of y = 0.1, 0.25, and 0.35 cm. It can be observed that there is a negligible difference in concentration (less than 5%) from the pellet surface to the pellet centre for the catalyst particle size used in this study. A significant difference in concentration would be the result of internal pore diffusion limitations. However, from Figure 8, it can be concluded that internal mass transfer resistances are negligible. This was confirmed by calculating the Thiele Modulus (Φ) for a first-order reaction assuming solid spherical particles [33]
Φ = R × k D e
where R is the catalyst particle radius, k is the reaction rate constant and De is the catalyst particle diffusivity. For this reaction, the value of the Thiele Modulus was found to be significantly less than 1, which corresponds to an effectiveness factor value of one. Hence, it can be recognised that the reaction is surface-reaction-limited.
The external mass transfer resistances were determined by comparing the concentrations of the bulk fluid and the surface of the catalyst particle. The external mass transfer involves the diffusion of the reactants or products from the bulk fluid to the surrounding area of the pellet. From Figure 9, it can be observed that there is negligible difference in concentration from the catalyst particle surface to the bulk fluid. A steep difference in concentration would be the result of external mass transfer resistances. From this study, it can be concluded that there are negligible external mass transfer resistances.

2.1.4. Comparison of Packed Bed Microreactor and Batch Stirred Reactor

The performance of the packed bed microreactor for the liquid phase decomposition of formic acid was compared to the performance of a stirred batch reactor [9]. The reaction conditions were same for both scenarios, with the only exception being the type of reactor used. The comparison was based on reactant conversion at constant space times (STs) in both reactors. The ST can be generated according to [47]:
For the packed bed microreactor,
S T = m a s s   o f   c a t a l y s t   ( g c a t ) f o r m i c   a c i d   m a s s   f l o w   r a t e   ( g F A s )
and the batch reactor,
S T = m a s s   o f   c a t a l y s t   ( g c a t ) m a s s   o f   f o r m i c   a c i d   ( g F A ) × r e a c t i o n   t i m e   ( s )
When obtaining the space times for the packed bed microreactor, the mass of catalyst was varied by packing the catalyst bed at different lengths. Although this method of obtaining the space times should typically occur experimentally, the current study did not have the data available to do so. Since the comparison between the experimental results and CFD modelling results are in good agreement, it is possible to utilise the model to obtain space times to compare with the batch reactor [47]. The space times for the batch reactor were acquired by changing the reaction time. Typically, 10 mL of the 0.5 M aqueous formic acid solution was placed into the stirred batch reactor, and once the target temperature of 30 °C was reached, 5.3 mg of catalyst was added to initiate the reaction. The liquid phase decomposition of formic acid took place in a batch reactor with constant space times at 30 °C. Once the desired temperature was obtained, the reaction was initiated by stirring (750 rpm).
Figure 10 demonstrates the comparison in performance between the packed bed microreactor and the batch reactor. Although the packed bed reactor depicts slightly higher conversions, it can be observed that the difference in conversion between the two reactor configurations are relatively small (less than 10%); therefore, the performance of the batch reactor and continuous flow packed bed microreactor are similar for the formic acid decomposition reaction.
It should be noted that most studies investigating the liquid phase decomposition of formic acid are often carried out in batch reactor systems. Continuous flow reactors have some advantages when compared to batch reactors, such as their ability to handle much higher reactant concentrations because of enhanced heat transfer capacity. Furthermore, continuous systems permit greater separation between reactants and products, enabling the process to become more flexible [48]. Caiti et al. [32] investigated the continuous generation of H2, including kinetic studies, via low temperature additive-free dehydrogenation of formic acid over heterogeneous Pd/C. The results showed that a combination of pore fouling and poisoning by formate ions lead to deactivation of the catalyst during continuous operation. Despite these factors causing extensive deactivation in plug flow mode, optimistic results can be obtained by reducing the steady state concentration of formic acid by operating in continuous flow mode. As a result, continuous operation of the system, without a loss in activity for more than 2500 turnovers, is achieved under mild conditions.

2.2. Experimental Results

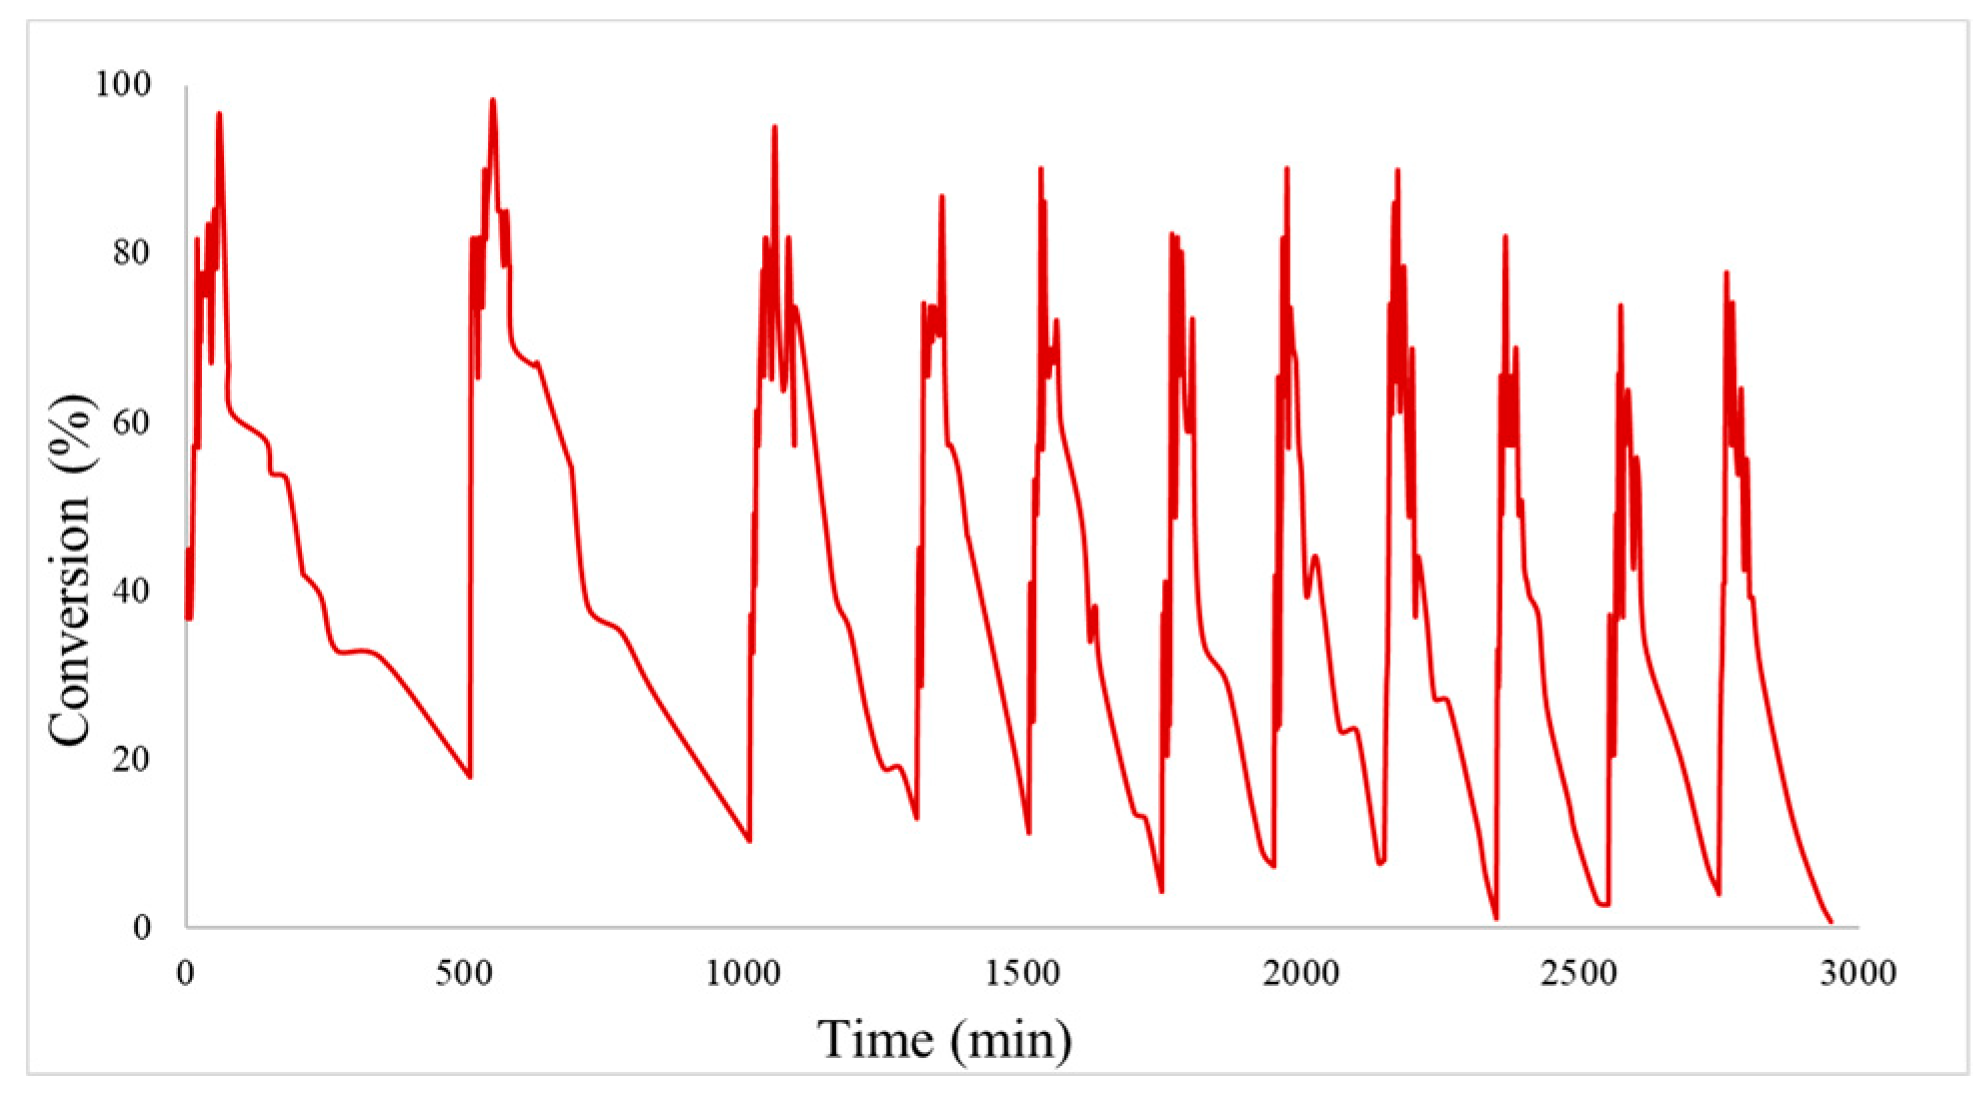
2.2.1. Catalyst Reusability

The loss of activity as previously explained, may be described by deactivation of the catalyst. Since deactivation is inherent to the reaction in aqueous media, it cannot be avoided. For this purpose, a simple procedure for the reactivation of the catalyst was developed. As the reaction takes place in aqueous media, water may be at least one of the species adsorbed on the catalyst surface reducing the reusability properties of the catalyst. Consequently, facilitating the desorption of this species could lead to the liberation of active sites which would be then available for formic acid to be decomposed in subsequent cycles of the reaction.
A standard experiment was started under the conditions previously presented and, once the rate of reaction decreased by 10–20% of the initial value, the pump was switched off and the furnace temperature was increased to 180 °C for 1.5 h for desorbing possible chemical species from the catalyst surface. After completion, the temperature was decreased to 30 °C and the decomposition reaction begun again. Figure 11 depicts the reusability experiment performed using the packed bed microreactor. From the graph it can be observed that following ten reactivation processes, the catalyst offers an analogous catalytic behaviour when compared to that of the fresh sample. This may be due to species absorbed on the active site such as, water or formate, CO, H2, reaching a higher degree of desorption and subsequently allowing reactivation to be achieved. Furthermore, after the first cycle, there is a slight increase in gas generation most probably due to the reduction of PdII and Pd0 caused by hydrogen production as we have been previously observed [9]. The resulting decrease in catalytic activity for the subsequent run may be caused by the following: (a) agglomeration of nanoparticles caused by the high temperature treatment at 180 °C, and (b) increase in strength of the adsorbed species.
Although a heating temperature of 180 °C cannot produce noticeable changes in the structure of the catalyst, the coupling of the cycling liquid-phase formic acid decomposition and subsequent temperature changes can potentially alter the catalyst structure. This leads to an increase of the Pd mean particle size and decreases the long-term reusability of the catalyst. The temperature of 180 °C was selected based on preliminary experimental results which indicated a substantially lower reactivation for lower temperatures, implying that 180 °C was the minimum temperature required to desorb the species without significantly changing the morphology of the catalyst. Under these conditions, desorption of most of the adsorbed species occurred. Nonetheless, the results suggest that after 10 regenerations, the initial activity of the catalyst can be fully restored for a period indicating a very promising catalytic regeneration for the dehydrogenation of formic acid under mild conditions.

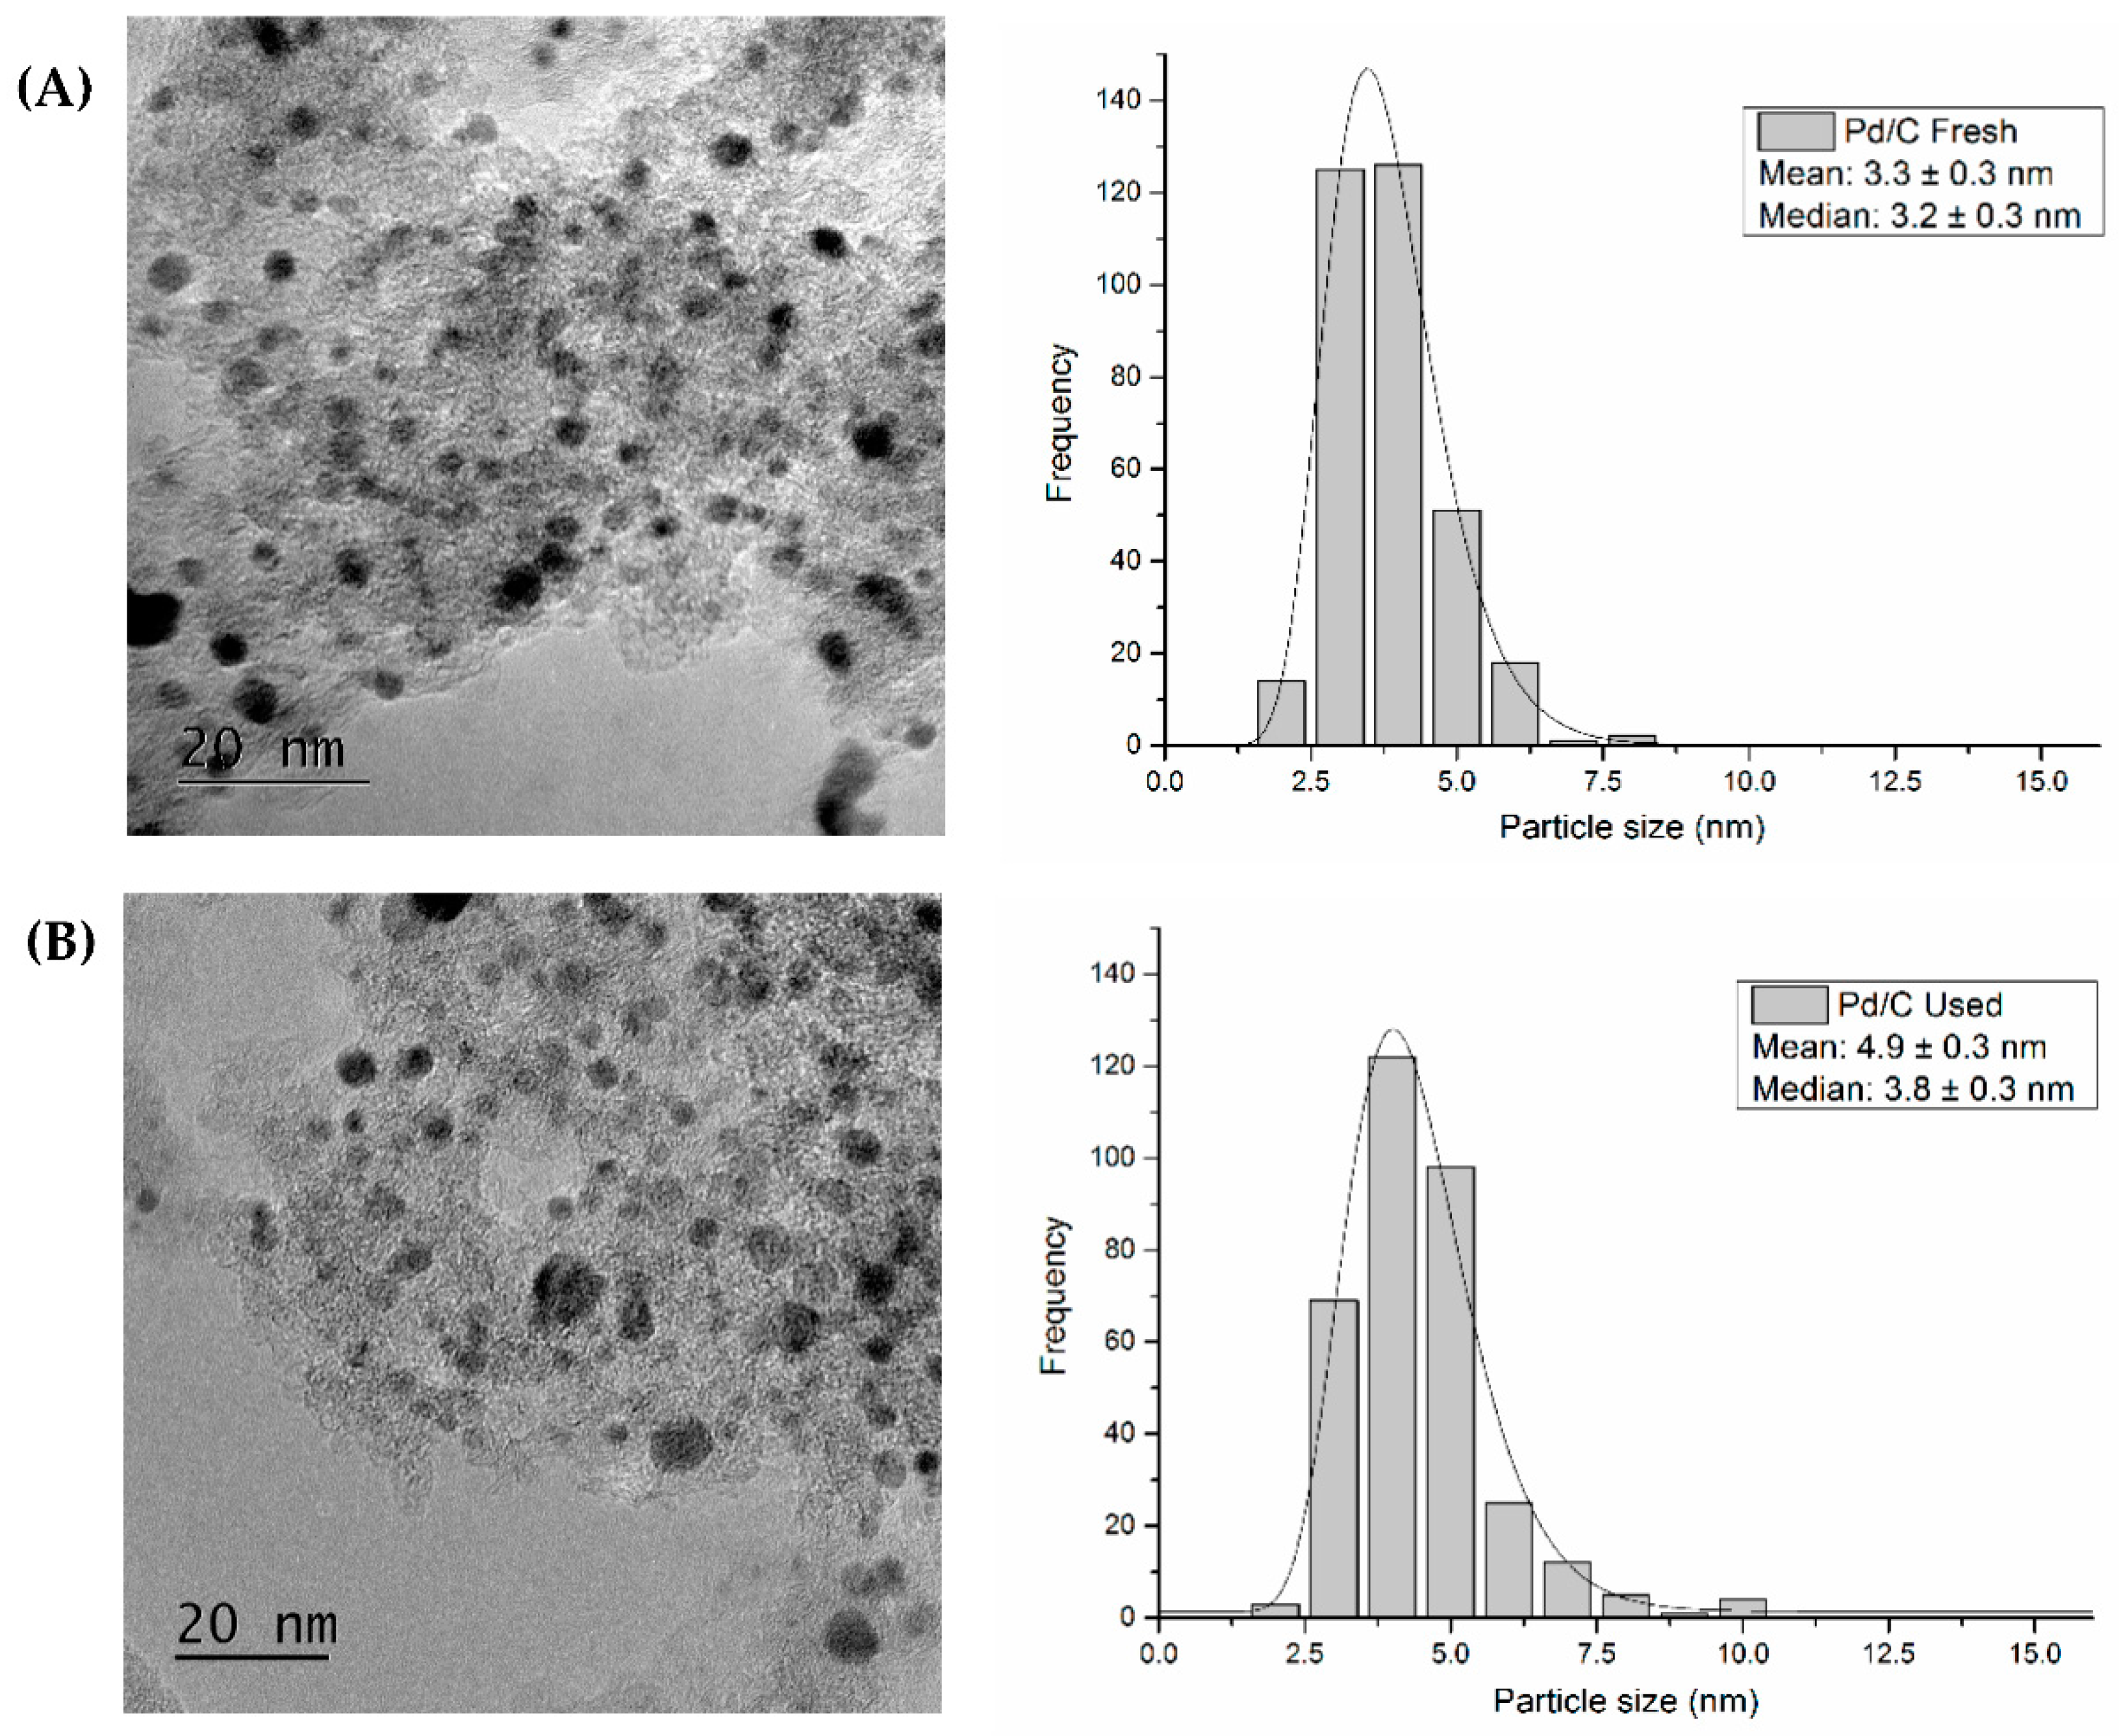
2.2.2. Catalyst Characterisation

Transmission electron microscopy (TEM) analysis was conducted to assess the mean particle size of the fresh and used Pd/C catalysts after 11 cycles. The images from the analysis are displayed in Figure 12. The particle size ranges 2–6 nm for the fresh catalyst and 3–15 nm for the used. The mean particle size of Pd nanoparticles increased from 3.3 ± 0.3 nm to 4.9 ± 0.3 nm for the used catalyst. The increase in particle size is the result of agglomeration which can be a factor for the decrease in catalytic activity after subsequent runs.
XPS provides quantitative information about the catalyst surface composition and the oxidation state of the metals which are of great importance and influence the catalytic performance. Besides this, the study of chlorine impurities by XPS is necessary as these impurities promote catalyst sintering or act as catalysts poison by occupying active sites [49,50]. XPS analysis of the fresh Pd/C catalyst is reported in our previous work [9]. This range of binding energy shows the Pd(3d) region. Pd species display two doublets due to the Pd 3d5/2 and Pd 3d3/2 transitions corresponding to the peaks at 335.4 and 340.7 eV respectively and are assigned to the presence of metallic Pd. The peaks at 337.0 and 342.3 eV are assigned to PdII being PdO the most probable species. Total metallic Pd on the surface accounts for approximately 60%. Previous studies of formic acid decomposition in batch reactor show that total metallic Pd on the surface increases for the used catalyst suggesting a reduction of PdII to metallic Pd while using the catalyst, due to the hydrogen evolution from formic acid decomposition [9]. A negligible Cl content on the surface of the catalyst of 0.1% was observed. Thorough characterisation of the fresh and used catalyst for the catalytic studies, using a batch reactor, have been published previously [9].

3. Experimental Methodology

3.1. Materials and Chemicals

The 5 wt.% Palladium on activated carbon catalyst (Pd/C) was purchased from Sigma-Aldrich (Cat. 20, 568-0). Formic acid (98%) was obtained from Fischer Scientific and succinic acid (99%) from Sigma-Aldrich (Cat. S3674-100G). Deionised (DI) water was used as reaction solvent.

3.2. Catalyst Characterisation

X-ray photoelectron spectra (XPS) was recorded on a Kratos Axis Ultra DLD spectrometer using a monochromatic Al Kα X-ray source. X-ray source (75–150 W) and analyser pass energies of 160 eV (for survey scans) or 40 eV (for detailed scans). Samples for examination by TEM were prepared by dispersing the catalyst powder in high purity ethanol using ultra-sonication. 40 µL of the suspension was dropped on to a holey carbon film supported by a 300-mesh copper TEM grid before the solvent was evaporated. The samples for TEM were then examined using a JEOL JEM 2100 TEM model operating at 200 kV.

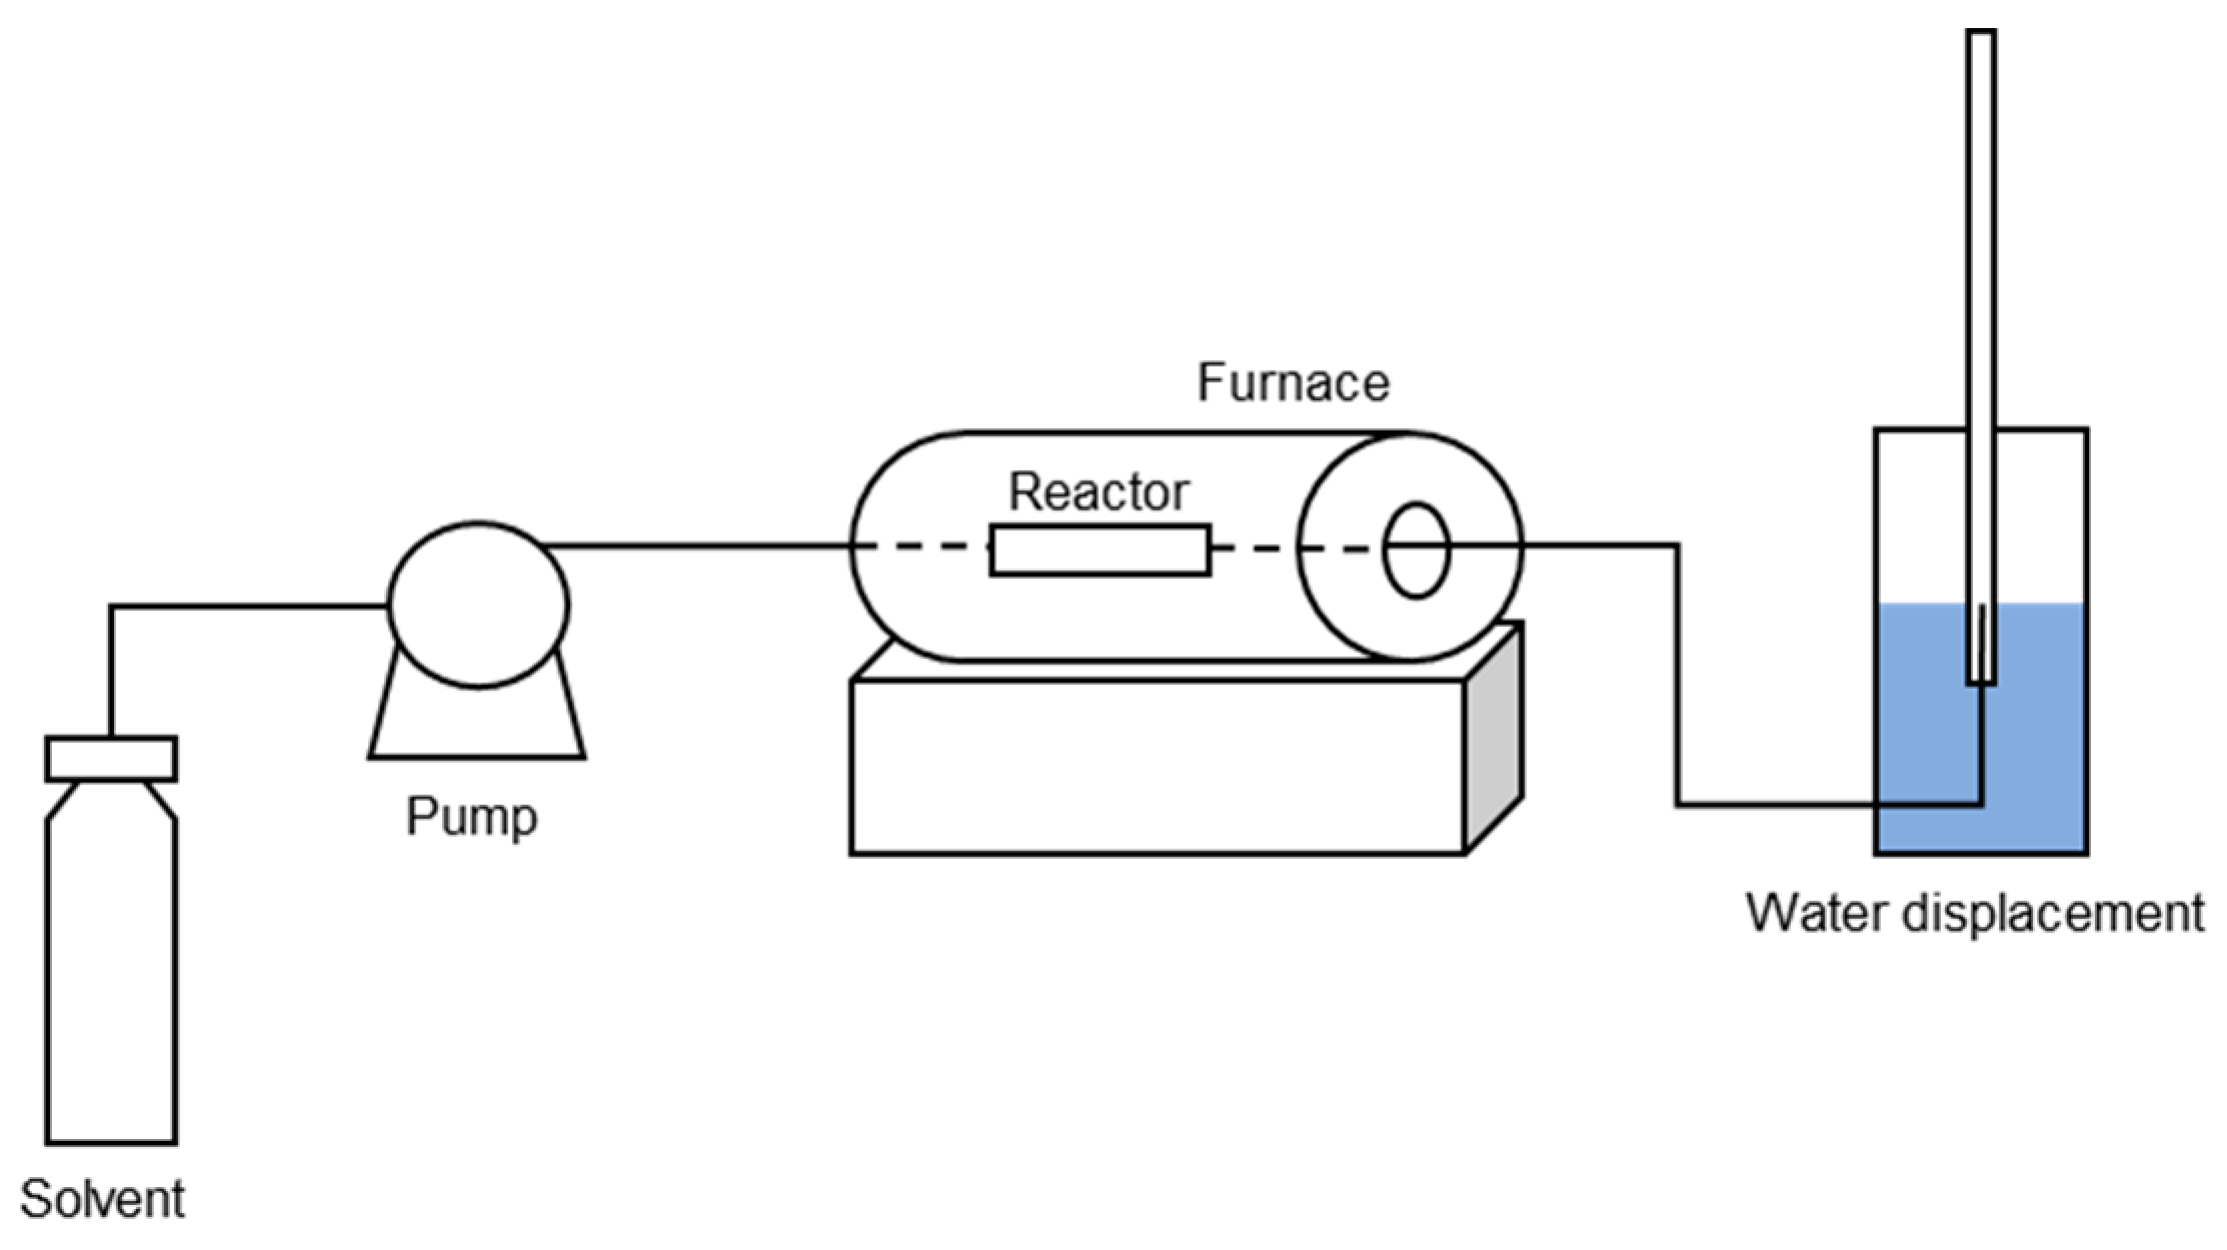
3.3. Experimental Set-Up

The liquid-phase decomposition of formic acid was conducted in a stainless-steel packed bed microreactor, and the reaction temperature was monitored by the furnace. The temperature of 30–60 °C was maintained at the reactor surface. Once the desirable temperature was reached, 0.05 mL/min of aqueous formic acid (0.5 M) was pumped into the reactor. Approximately 0.1 g of the catalyst was packed by glass wool towards the centre of the reactor. The length of the catalyst bed was approximately 2–3 cm and the reactor had an internal diameter of 0.4–0.5 cm. The produced gases were collected and measured using a gas burette by measuring the water displacement. After a certain amount of time (1–2 min depending on rate of reaction), the volume of gas generated was used to calculate the reaction rate and conversion, xa, using the equation
x a = P · V g 2 R T · C 0 · F 0
where P is the atmospheric pressure, Vg is the rate of gas produced, R is the universal gas constant, T is the room temperature, and C0 and F0 are the initial concentration and inlet flow rate of formic acid, respectively. Figure 13 depicts a schematic representation of the continuous flow set up for the experiments.

4. Modelling of Packed Bed Microreactor

CFD was utilised to predict the heterogeneous particle-fluid transport phenomena within the microreactor using finite element methodology. This type of modelling can provide comprehensive information regarding space-time variations in fluid component flows, temperatures, and concentrations in an effortless manner. As opposed to experimental work which can often be time consuming and costly. Hence, CFD is a promising approach/methodology in calculating the parameters thus, facilitating a thorough study of the physicochemical processes involved [24,30]. CFD is an integrated methodology in the package that was employed and can further facilitate the design of experimental studies.
The packed bed microreactor was modelled as 2D under the assumption that mass, temperature, and velocity profiles occur in the radial and axial directions only. The packed bed microreactor model is established upon further assumptions (a) application of unsteady-state and laminar flow; (b) the microreactor operates isothermally; (c) ideal gas behaviour is applicable for fluids in the gas phase; (d) the axial fluid velocity is constant with uniform physical properties and transport coefficients. The solid catalyst used is Pd/C in the form of solid spherical particles, and deionised water is used as a reaction solvent. Figure 14 shows a schematic of the microreactor used for the CFD studies.

4.1. Reaction Kinetics

The decomposition of formic acid can occur via two possible pathways depending on the type of catalyst used, reaction temperature and reactant concentrations [1]
H C O O H C O 2 + H 2
H C O O H C O + H 2 O
The former reaction represents the dehydrogenation of formic acid and produces CO2 and H2. The latter reaction demonstrates the dehydration of formic acid and is often an undesirable pathway due to its production of CO which poisons the solid Pd catalysts.
The rate of reaction for the decomposition of formic acid via dehydrogenation can be estimated using the power law method of
r = k × C n
where r is the reaction rate, k is the kinetic rate constant, C is the concentration of formic acid, and n is the order of reaction [9].

4.2. Numerical Procedure

The mass balance equation incorporates the diffusion and convection for the components in the packed bed, and is depicted as
c i t + · J i S b + u · c i = R
where ci is the concentration of the reacting fluids (mol/m3), R is the reaction rate expression for the species (mol/(m3·s)), u is the velocity (m/s), and Ji is the molar flux diffusive vector (mol/(m2·s)). The active specific surface area, Sb, is the area of the catalyst pellet exposed to the reacting fluids in the packed bed and can be estimated using
S b = 3 r p e ( 1 ε b )
where rpe is the size of the catalyst particle (m) and εb is the void fraction of the packed bed.
The molar flux, Ji, can be rate determined and is relative to the mass balance and accounts for the particle-fluid boundary conditions. This can be expressed based on the external mass transfer coefficient
J i = h i ( c i c i , p s )
h i = S h · D i 2 r p e
S c = μ ρ M · D i
R e = 2 r p e · ρ · u x μ
S h = 2 + 0.552 R e 1 2 S c 1 3
where hi is the external mass transfer coefficient (m/s), ci,ps is the concentration of the fluid at the surface of the catalyst particle, Di represents the bulk diffusivity (m2/s), µ and ρ are the viscosity (Pa.s) and density (kg/m3) of the reacting fluids respectively. Schmidt (Sc), Reynolds (Re), and Sherwood (Sh) numbers are dimensionless parameters related to the mass transfer occurring at the pellet–fluid interface.
The bulk molecular diffusion coefficient of the reactant in the fluid phase was obtained using the Reddy-Doraiswamy correlation [51]
D i = 1 × 10 16 ( T M i μ V i 2 3 )
where T is the temperature in K, Mi is the molecular mass of the fluid (g/mol), μ is the viscosity (Pa·s), and Vi is the molar volume at normal boiling point (m3/kmol).
The heterogeneous chemical reaction which takes place within the catalyst particles is integrated with the mass balances using the Reactive Pellet Bed feature in COMSOL®. The mass balance across a spherical shell at rdim and a predefined 1D extra dimension on the normalised radius of the catalyst pellet particle (r = rdim/rpe) is given by
4 π N { r 2 r p e 2 ε p e c p e , i t + · ( r 2 D i , e f f c p e , i ) = r 2 r p e 2 R p e }
where N is the number of pellets per unit volume of the packed bed, Di,eff is the effective diffusion coefficient of the reacting fluid within the pores of the catalyst particle, and Rpe is the reaction rate term in mol/(m3·s) per unit volume of pellet.
The effective diffusivities of the fluids into the pores of the catalyst pellet are generated by relating the diffusion coefficient to either the bulk or the Knudsen diffusivity
D i , e f f = D i Φ p σ c τ
where Φ p , σ c , and τ are the pellet porosity, constriction factor, and tortuosity, respectively. Typical values of these are, σ c = 0.8, τ = 3.0, and Φ p = 0.4 [33].
The hydrodynamics of the microreactor are modelled using the Navier–Stokes equation. The continuity equations demonstrating the conservation of mass and momentum are given by
ρ t + · ( ρ u ) = 0
ρ u t + ρ ( u · ) u = · [ P I + τ ] + F
where P is pressure (Pa), τ is the viscous stress tensor (Pa), and F is the volume force vector (N/m3).
The boundary conditions of the packed bed microreactor are given per
at   x   =   0 ;   c i =   c i , i n ,   u y   =   0 ,   u x   = u i n   δ 2 P δ x 2 = 0
at   x = x 1 ;   δ c i δ x = 0 ,   u y   =   0 ,   δ u x δ x = 0 ,   P = P out
at   y = 0 ;   c i =   0 ,   u r   =   0 ,   δ u x δ y = 0 ,   δ P δ y = 0
at   r = 1 ;   c i , p   =   c i , ps
at   r = 0 ;   δ c i , p δ r = 0
The modelling assumptions combined with the appropriate mass balances and governing boundary conditions were computed using COMSOL Multiphysics® software version 5.3. The characteristics of the hardware used were an Intel® Core™ i7-1065G7 processor and a 16 GB RAM. A grid sensitivity analysis was conducted to assess any effects the mesh size may have on the accuracy of the simulated numerical solution. The grid numbers utilised for the study were 406118, 812236, and 1218354. The effects of mesh size were determined by comparing the conversion of formic acid at the end of the reaction (Table 1). It can be observed, for the packed bed microreactor, that a grid number of 406,118 generates the smallest difference between the tested numbers. Therefore, the finalised packed bed microreactor model consisted of a mesh containing 406,118 domain elements and 2320 boundary elements, with 94,364 degrees of freedom. The results were found to be mesh independent and had a computational time of approximately 40 s. Table 2 displays the parameters used for the CFD modelling studies.

5. Conclusions

The decomposition of formic acid to produce hydrogen using a 5 wt.% Pd/C catalyst has been investigated using a continuous flow reactor. The studies were performed experimentally and a comprehensive CFD model was developed to validate the findings. The CFD study showed a very good validation with the experimental work. The results show that the conversion of formic acid reached a maximum of 97%; however, the activity of the Pd/C catalyst diminishes after approximately 75 min. The CFD model was able to predict the catalyst activity initially using a generalised activity function. Nevertheless, studies have shown that the catalyst deactivation can be caused by various factors, such as poisoning due to CO production. The CFD model could successfully depict the catalytic activity based on CO concentration, and further demonstrated a sound validation with the experimental work. A very good match between the catalyst activity function and the CO concentration was obtained, confirming that CO is the poisoning molecule. The CFD model can be utilised to aid understanding of parameter optimisation for the formic acid decomposition reaction. This CFD model is the first of its kind to demonstrate a sound validation with the experimental data for this reaction, as well as the deactivation by the poisoning species CO.
The catalyst reusability studies demonstrated that after 10 reactivation processes, the preliminary activity of the catalyst can be restored to offer a similar performance to that of a fresh sample of the catalyst. This signifies a promising catalytic regeneration for the dehydrogenation of formic acid under mild conditions. A limitation of the Pd/C catalyst is the deactivation observed either in batch or continuous flow system. However, one of the main advantages is the high activity of the Pd catalysts and high selectivity towards the production of hydrogen. Moreover, understanding the structural properties of the monometallic Pd catalyst in relation to the catalytic activity with the aid of computational work (DFT and CFD modelling) helps us to think towards a new direction of synthesising supported bimetallic catalysts based on Pd and the addition of metals—such as Au, Ag, Cu, and Zn—for improving the activity. However, also to minimise the production of CO, which despite the relatively low (ppm) concentration, about 15 ppm, is not desirable for the utilisation in fuel cell technology.
Further CFD studies showed that the conversion of formic acid is enhanced with temperature, and any temperature effects which may be present are diminished within the microreactor used in this study leading to isothermal operation. Moreover, the formic acid conversion decreases with increasing liquid flow rate. The heterogeneous CFD model was able to evaluate the reaction-coupled transport phenomena taking place within the microreactor. A study of internal and external mass transfer limitations was presented by generating concentration profiles between the bulk fluid and within the catalyst particle. From the study, it was determined that there are negligible internal and external mass transfer limitations present in the microreactor used in this work. The CFD model created in this study has proven the ability to predict the liquid phase decomposition of aqueous formic acid under mild conditions in microreactors. Future research could be directed towards investigating the scalability of microreactors for hydrogen production, as well as enhancing the catalyst activity by avoiding the production of CO.

Author Contributions

Conceptualization, A.C. and N.D.; Methodology, F.S., A.V., and N.D.; Software, S.H. and G.M.; Theoretical validation, S.H., G.M., and A.C.; Formal analysis, S.H., G.M., A.C., N.D., F.S., and A.V.; Investigation, N.D. and F.S.; Resources, N.D., A.V., and F.S.; Writing—original draft preparation, S.H. and S.M.A.-S.; Writing—review and editing, S.H., F.S., and S.M.A.-S.; Visualization, S.H. and F.S.; Supervision, A.C.; Project administration, A.C. and N.D.; Funding acquisition, A.C. and N.D. All authors have read and agreed to the published version of the manuscript.

Funding

This research received no external funding.

Acknowledgments

The authors would like to thank London South Bank University, School of Engineering for the PhD fund that supports the work of Sanaa Hafeez.

Conflicts of Interest

The authors declare no conflict of interest.

References

  1. Wang, X.; Meng, Q.; Gao, L.; Jin, Z.; Ge, J.; Liu, C.; Xing, W. Recent progress in hydrogen production from formic acid decomposition. Int. J. Hydrog. Energy 2018, 43, 7055–7071. [Google Scholar] [CrossRef]
  2. Kim, Y.; Kim, D.H. Understanding the effect of Pd size on formic acid dehydrogenation via size-controlled Pd/C catalysts prepared by NaBH4 treatment. Appl. Catal. B Environ. 2019, 244, 684–693. [Google Scholar] [CrossRef]
  3. Barnard, J.H.; Wang, C.; Berry, N.G.; Xiao, J. Long-range metal-ligand bifunctional catalysis: Cyclometallated iridium catalysts for the mild and rapid dehydrogenation of formic acid. Chem. Sci. 2013, 4, 1234–1244. [Google Scholar] [CrossRef]
  4. Gao, Y.; Kuncheria, J.K.; Jenkins, H.A.; Puddephatt, R.J.; Yap, G.P. The interconversion of formic acid and hydrogen/carbon dioxide using a binuclear ruthenium complex catalyst. J. Chem. Soc. Dalton Trans. 2000, 18, 3212–3217. [Google Scholar] [CrossRef]
  5. Zell, T.; Butschke, B.; Ben-David, Y.; Milstein, D. Efficient Hydrogen Liberation from Formic Acid Catalyzed by a Well-Defined Iron Pincer Complex under Mild Conditions. Chem. Eur. J. 2013, 19, 8068–8072. [Google Scholar] [CrossRef]
  6. Marcinkowski, M.D.; Liu, J.; Murphy, C.J.; Liriano, M.L.; Wasio, N.A.; Lucci, F.R.; Flytzani-Stephanopoulos, M.; Sykes, E.C.H. Selective formic acid dehydrogenation on Pt-Cu single-atom alloys. ACS Catal. 2017, 7, 413–420. [Google Scholar] [CrossRef]
  7. Mielby, J.; Kunov-Kruse, A.J.; Kegnæs, S. Decomposition of formic acid over silica encapsulated and amine functionalised gold nanoparticles. J. Catal. 2017, 345, 149–156. [Google Scholar] [CrossRef] [Green Version]
  8. Li, J.; Chen, W.; Zhao, H.; Zheng, X.; Wu, L.; Pan, H.; Zhu, J.; Chen, Y.; Lu, J. Size-dependent catalytic activity over carbon-supported palladium nanoparticles in dehydrogenation of formic acid. J. Catal. 2017, 352, 371–381. [Google Scholar] [CrossRef]
  9. Sanchez, F.; Motta, D.; Roldan, A.; Hammond, C.; Villa, A.; Dimitratos, N. Hydrogen generation from additive-free formic acid decomposition under mild conditions by Pd/C: Experimental and DFT studies. Top. Catal. 2018, 61, 254–266. [Google Scholar] [CrossRef] [PubMed] [Green Version]
  10. Chen, Y.; Zhu, Q.-L.; Tsumori, N.; Xu, Q. Immobilizing highly catalytically active noble metal nanoparticles on reduced graphene oxide: A non-noble metal sacrificial approach. J. Am. Chem. Soc. 2015, 137, 106–109. [Google Scholar] [CrossRef]
  11. Tang, C.; Surkus, A.E.; Chen, F.; Pohl, M.M.; Agostini, G.; Schneider, M.; Junge, H.; Beller, M. A stable nanocobalt catalyst with highly dispersed CoNx active sites for the selective dehydrogenation of formic acid. Angew. Chem. 2017, 129, 16843–16847. [Google Scholar] [CrossRef]
  12. Du, Y.; Shen, Y.-B.; Zhan, Y.-L.; Ning, F.-D.; Yan, L.-M.; Zhou, X.-C. Highly active iridium catalyst for hydrogen production from formic acid. Chin. Chem. Lett. 2017, 28, 1746–1750. [Google Scholar] [CrossRef]
  13. Zacharska, M.; Bulusheva, L.G.; Lisitsyn, A.S.; Beloshapkin, S.; Guo, Y.; Chuvilin, A.L.; Shlyakhova, E.V.; Podyacheva, O.Y.; Leahy, J.J.; Okotrub, A.V.; et al. Factors influencing the performance of Pd/C catalysts in the green production of hydrogen from formic acid. ChemSusChem 2017, 10, 720–730. [Google Scholar] [CrossRef] [PubMed]
  14. Choi, B.-S.; Song, J.; Song, M.; Goo, B.S.; Lee, Y.W.; Kim, Y.; Yang, H.; Han, S.W. Core-shell engineering of Pd–Ag bimetallic catalysts for efficient hydrogen production from formic acid decomposition. ACS Catal. 2018, 9, 819–826. [Google Scholar] [CrossRef]
  15. Akbayrak, S. Decomposition of formic acid using tungsten(VI) oxide supported AgPd nanoparticles. J. Colloid Interface Sci. 2019, 538, 682–688. [Google Scholar] [CrossRef]
  16. Zhao, Z.; Heck, K.N.; Limpornpipat, P.; Qian, H.; Miller, J.T.; Wong, M.S. Hydrogen-generating behavior of Pd-decorated gold nanoparticles via formic acid decomposition. Catal. Today 2019, 330, 24–31. [Google Scholar] [CrossRef]
  17. Duan, S.; Zhang, S.; Chang, S.; Meng, S.; Fan, Y.; Zheng, X.; Chen, S. Efficient photocatalytic hydrogen production from formic acid on inexpensive and stable phosphide/Zn3In2S6 composite photocatalysts under mild conditions. Int. J. Hydrog. Energy 2019, 44, 21803–21820. [Google Scholar] [CrossRef]
  18. Alamgholiloo, H.; Rostamnia, S.; Hassankhani, A.; Liu, X.; Eftekhari, A.; Hasanzadeh, A.; Zhang, K.; Karimi-Maleh, H.; Khaksar, S.; Varma, R.S.; et al. Formation and stabilization of colloidal ultra-small palladium nanoparticles on diamine-modified Cr-MIL-101: Synergic boost to hydrogen production from formic acid. J. Colloid Interface Sci. 2020, 567, 126–135. [Google Scholar] [CrossRef]
  19. Luo, Y.; Yang, Q.; Nie, W.; Yao, Q.; Zhang, Z.; Lu, Z.-H. Anchoring IrPdAu Nanoparticles on NH2-SBA-15 for Fast Hydrogen Production from Formic Acid at Room Temperature. ACS Appl. Mater. Interfaces 2020, 12, 8082–8090. [Google Scholar] [CrossRef]
  20. Boddien, A.; Loges, B.; Junge, H.; Gärtner, F.; Noyes, J.R.; Beller, M. Continuous hydrogen generation from formic acid: Highly active and stable ruthenium catalysts. Adv. Synth. Catal. 2009, 351, 2517–2520. [Google Scholar] [CrossRef]
  21. Majewski, A.; Morris, D.J.; Kendall, K.; Wills, M. A Continuous-Flow Method for the Generation of Hydrogen from Formic Acid. ChemSusChem 2010, 3, 431–434. [Google Scholar] [CrossRef]
  22. Sponholz, P.; Mellmann, D.; Junge, H.; Beller, M. Towards a practical setup for hydrogen production from formic acid. ChemSusChem 2013, 6, 1172–1176. [Google Scholar] [CrossRef]
  23. Constantinou, A.; Barrass, S.; Pronk, F.; Bril, T.; Wenn, D.; Shaw, J.; Gavriilidis, A. CO2 absorption in a high efficiency silicon nitride mesh contactor. Chem. Eng. J. 2012, 207, 766–771. [Google Scholar] [CrossRef]
  24. Hafeez, S.; Manos, G.; Al-Salem, S.; Aristodemou, E.; Constantinou, A. Liquid fuel synthesis in microreactors. React. Chem. Eng. 2018, 3, 414–432. [Google Scholar] [CrossRef]
  25. Sun, X.; Constantinou, A.; Gavriilidis, A. Stripping of acetone from isopropanol solution with membrane and mesh gas-liquid contactors. Chem. Eng. Process. Process Intersif. 2011, 50, 991–997. [Google Scholar] [CrossRef]
  26. Wu, G.; Cao, E.; Ellis, P.; Constantinou, A.; Kuhn, S.; Gavriilidis, A. Continuous flow aerobic oxidation of benzyl alcohol on Ru/Al2O3 catalyst in a flat membrane microchannel reactor: An experimental and modelling study. Chem. Eng. Sci. 2019, 201, 386–396. [Google Scholar] [CrossRef] [Green Version]
  27. Zhou, W.; Tang, Y.; Pan, M.; Wei, X.; Chen, H.; Xiang, J. A performance study of methanol steam reforming microreactor with porous copper fiber sintered felt as catalyst support for fuel cells. Int. J. Hydrog. Energy 2009, 34, 9745–9753. [Google Scholar] [CrossRef]
  28. Zhuang, X.; Xia, X.; Xu, X.; Li, L. Experimental investigation on hydrogen production by methanol steam reforming in a novel multichannel micro packed bed reformer. Int. J. Hydrog. Energy 2020, 45, 11024–11034. [Google Scholar] [CrossRef]
  29. Hafeez, S.; Aristodemou, E.; Manos, G.; Al-Salem, S.; Constantinou, A. Computational fluid dynamics (CFD) and reaction modelling study of bio-oil catalytic hydrodeoxygenation in microreactors. React. Chem. Eng. 2020, 5, 1083–1092. [Google Scholar] [CrossRef]
  30. Hafeez, S.; Aristodemou, E.; Manos, G.; Al-Salem, S.; Constantinou, A. Modelling of packed bed and coated wall microreactors for methanol steam reforming for hydrogen production. RSC Adv. 2020, 10, 41680–41692. [Google Scholar] [CrossRef]
  31. Karim, A.; Bravo, J.; Gorm, D.; Conant, T.; Datye, A. Comparison of wall-coated and packed-bed reactors for steam reforming of methanol. Catal. Today 2005, 110, 86–91. [Google Scholar] [CrossRef]
  32. Caiti, M.; Padovan, D.; Hammond, C. Continuous production of hydrogen from formic acid decomposition over heterogeneous nanoparticle catalysts: From batch to continuous flow. ACS Catal. 2019, 9, 9188–9198. [Google Scholar] [CrossRef]
  33. Bulushev, D.A.; Beloshapkin, S.; Ross, J.R. Hydrogen from formic acid decomposition over Pd and Au catalysts. Catal. Today 2010, 154, 7–12. [Google Scholar] [CrossRef]
  34. Bartholomew, C.H.; Butt, J.B. Catalyst Deactivation 1991; Elsevier: Amsterdam, The Netherlands, 1991. [Google Scholar]
  35. Fogler, H. Chapter 10: Catalysis and Catalytic Reactors. In Elements of Chemical Reaction Engineering, 5th ed.; Pearson: London, UK, 2016; pp. 454–456. [Google Scholar]
  36. Lv, Q.; Meng, Q.; Liu, W.; Sun, N.; Jiang, K.; Ma, L.; Peng, Z.; Cai, W.; Liu, C.; Ge, J.; et al. Pd–PdO interface as active site for HCOOH selective dehydrogenation at ambient condition. J. Phys. Chem. C 2018, 122, 2081–2088. [Google Scholar] [CrossRef]
  37. Navlani-García, M.; Salinas-Torres, D.; Cazorla-Amorós, D. Hydrogen production from formic acid attained by bimetallic heterogeneous PdAg catalytic systems. Energies 2019, 12, 4027. [Google Scholar] [CrossRef] [Green Version]
  38. Wang, Y.; Qi, Y.; Zhang, D.; Liu, C. New insight into the decomposition mechanism of formic acid on Pd(111): Competing formation of CO2 and CO. J. Phys. Chem. C 2014, 118, 2067–2076. [Google Scholar] [CrossRef]
  39. Yurderi, M.; Bulut, A.; Zahmakiran, M.; Kaya, M. Carbon supported trimetallic PdNiAg nanoparticles as highly active, selective and reusable catalyst in the formic acid decomposition. Appl. Catal. B Environ. 2014, 160, 514–524. [Google Scholar] [CrossRef]
  40. Peter, M.; Adamovsky, S.; Camacho, J.M.F.; Schauermann, S. Energetics of elementary reaction steps relevant for CO oxidation: CO and O2 adsorption on model Pd nanoparticles and Pd(111). Faraday Discuss. 2013, 162, 341–354. [Google Scholar] [CrossRef] [Green Version]
  41. Jiang, K.; Xu, K.; Zou, S.; Cai, W.-B. B-Doped Pd catalyst: Boosting room-temperature hydrogen production from formic acid-formate solutions. J. Am. Chem. Soc. 2014, 136, 4861–4864. [Google Scholar] [CrossRef]
  42. Ruthven, D.; Upadhye, R. The catalytic decomposition of aqueous formic acid over suspended palladium catalysts. J. Catal. 1971, 21, 39–47. [Google Scholar] [CrossRef]
  43. Hu, C.; Pulleri, J.K.; Ting, S.-W.; Chan, K.-Y. Activity of Pd/C for hydrogen generation in aqueous formic acid solution. Int. J. Hydrog. Energy 2014, 39, 381–390. [Google Scholar] [CrossRef]
  44. Simakova, I.L.; Prosvirin, I.P.; Kriventsov, V.V.; Parmon, V.N. The effect of preparation conditions on the catalytic and physical-chemical properties of Pd/C in reductive debenzylation of hexabenzylhexaazaisowurtzitane. J. Sib. Fed. Univ. Chem. 2012, 5, 239–250. [Google Scholar]
  45. Troitskii, S.Y.; Nartova, A.; Moroz, E. Low-temperature carbonization of active centers is the reason of Pd/C catalysts deactivation. J. Struct. Chem. 2021, 62, 163–170. [Google Scholar] [CrossRef]
  46. Vinayakumar, K.; Palliyarayil, A.; Prakash, P.S.; Nandakumar, S.; Kumar, N.S.; Sil, S. Studies on the deactivation and activation of palladium impregnated carbon catalyst for environmental applications. Mater. Today Proc. 2020, 31, 631–639. [Google Scholar] [CrossRef]
  47. Cao, E.; Sankar, M.; Firth, S.; Lam, K.F.; Bethell, D.; Knight, D.K.; Hutchings, G.J.; McMillan, P.F.; Gavriilidis, A. Reaction and Raman spectroscopic studies of alcohol oxidation on gold-palladium catalysts in microstructured reactors. Chem. Eng. J. 2011, 167, 734–743. [Google Scholar] [CrossRef]
  48. Hu, C.; Ting, S.-W.; Tsui, J.; Chan, K.-Y. Formic acid dehydrogenation over PtRuBiOx/C catalyst for generation of CO-free hydrogen in a continuous-flow reactor. Int. J. Hydrogen Energy 2012, 37, 6372–6380. [Google Scholar] [CrossRef]
  49. Bueres, R.F.; Asedegbega-Nieto, E.; Díaz, E.; Ordóñez, S.; Díez, F.V. Performance of carbon nanofibres, high surface area graphites, and activated carbons as supports of Pd-based hydrodechlorination catalysts. Catal. Today 2010, 150, 16–21. [Google Scholar] [CrossRef]
  50. Zhao, Y.; Jia, L.; Medrano, J.A.; Ross, J.R.; Lefferts, L. Supported Pd catalysts prepared via colloidal method: The effect of acids. ACS Catal. 2013, 3, 2341–2352. [Google Scholar] [CrossRef]
  51. Reddy, K.; Doraiswamy, L. Estimating liquid diffusivity. Ind. Eng. Chem. Fundam. 1967, 6, 77–79. [Google Scholar] [CrossRef]
Figure 1. Comparison between experimental data and CFD modelling results. Reaction conditions: temperature = 30 °C; pressure = 1 bar; inlet flow = 0.05 mL/min; 0.1g catalyst of 5 wt.% Pd on Carbon.
Catalysts 11 00341 g001
Figure 2. Catalyst activity parameter a(t) as a function of time. Reaction conditions: temperature = 30 °C; pressure = 1 bar; inlet flow = 0.05 mL/min; 0.1 g catalyst of 5 wt.% Pd on Carbon.
Catalysts 11 00341 g002
Figure 3. Conversion of formic acid against time with catalytic activity correlated to CO concentration in microreactor. Reaction conditions: temperature = 30 °C; pressure = 1 bar; inlet flow = 0.05 mL/min; 0.1 g catalyst of 5 wt.% Pd on Carbon.
Catalysts 11 00341 g003
Figure 4. Volume of gas produced with respect to time. Reaction conditions: temperature = 30 °C; pressure = 1 bar; inlet flow = 0.05 mL/min; 0.1 g catalyst of 5 wt.% Pd on Carbon.
Catalysts 11 00341 g004
Figure 5. Effect of temperature on the conversion of formic acid. Reaction conditions: pressure = 1 bar; inlet flow = 0.05 mL/min; 0.1 g catalyst of 5 wt.% Pd on Carbon.
Catalysts 11 00341 g005
Figure 6. Effect of isothermal and non-isothermal conditions obtained from modelling on the conversion of formic acid. Reaction conditions: pressure = 1 bar; inlet flow = 0.05 mL/min; 0.1 g catalyst of 5 wt.% Pd on carbon.
Catalysts 11 00341 g006
Figure 7. Effect of inlet liquid flow on the conversion of formic acid. Reaction conditions: temperature = 30 °C; pressure = 1 bar; 0.1 g catalyst of 5 wt.% Pd on carbon.
Catalysts 11 00341 g007
Figure 8. Concentration of formic acid within the catalyst particles at x = 1.25 cm, generated from modelling. Reaction conditions: temperature = 30 °C; pressure = 1 bar; inlet flow = 0.05 mL/min; 0.1 g catalyst of 5 wt.% Pd on Carbon.
Catalysts 11 00341 g008
Figure 9. Concentration of formic acid within the catalyst particles and in the bulk fluid at x = 1.25 cm, generated from modelling. Reaction conditions: temperature = 30 °C; pressure = 1 bar; inlet flow = 0.05 mL/min; 0.1 g catalyst of 5 wt.% Pd on carbon.
Catalysts 11 00341 g009
Figure 10. Comparison of a batch reactor and packed bed microreactor. Reaction conditions: Packed bed microreactor: temperature = 30 °C; pressure = 1 bar; inlet flow = 0.05 mL/min; 0.1 g catalyst of 5 wt.% Pd on Carbon. Batch stirred reactor: temperature = 30 °C; pressure = 1 bar; stirring rate = 750 rpm, formic acid = 12 g, 5.3 mg catalyst 5% Pd on carbon).
Catalysts 11 00341 g010
Figure 11. Conversion versus time plot for the reusability study performed in continuous flow. Reaction conditions: temperature = 30 °C; pressure = 1 bar; inlet flow = 0.05 mL/min; 0.1 g catalyst of 5 wt.% Pd on carbon.
Catalysts 11 00341 g011
Figure 12. Characterisation of fresh and used 5 wt.% Pd/C catalyst and corresponding histograms of the particle size distributions. Magnification: ×250 k, (A) Fresh 5 wt.% Pd/C, (B) Used 5 wt.% Pd/C.
Catalysts 11 00341 g012
Figure 13. Diagram of continuous flow set up.
Catalysts 11 00341 g013
Figure 14. Schematic representation of the packed bed microreactor used for the CFD studies.
Catalysts 11 00341 g014
Table 1. Grid sensitivity analysis study for the packed bed microreactor used in this study. Reaction conditions: temperature = 30 °C; pressure = 1 bar; inlet flow = 0.05 mL/min; 0.1 g catalyst of 5 wt.% Pd on carbon.
Number of Elements4061188122361218354
XHCOOH0.09120.09110.0931
Table 2. Parameters used for the CFD modelling study based on the experimental work.
SymbolValueUnitsDescription
cFA 0.5 mol m−3Concentration of reacting gases
y1 4 × 10 3 mHeight of packed bed
x1 2.5 × 10 2 mCatalyst loading length of packed bed
mc 1 × 10 4 kgMass of catalyst
υ 0.05 mL min−1Volumetric inlet flow rate
T303–333KReaction temperature
dpe 4 nmSize of catalyst pellet
ε0.4-Catalyst bed porosity
ρb1300kg m−3Catalyst density
R8.314J mol−1 K−1Ideal gas constant
DFA 1.52 × 10 9 m2 s−1Bulk fluid diffusion coefficient
DFA,p 1.62 × 10 10 m2 s−1Effective diffusion coefficient
Publisher’s Note: MDPI stays neutral with regard to jurisdictional claims in published maps and institutional affiliations.

