1. Introduction
Dyes are important industrial raw materials and are widely used in textiles, papermaking, plastics, medicine, and other fields. Simultaneously, they are common organic pollutants in the industrial wastewater generated by these fields. They are toxic, causing allergic reactions and carcinogenesis, and also affect biological photosynthesis [
1,
2,
3]. Dye molecules contain conjugated structures that can absorb visible light, such as aromatic structures, and some auxochrome groups, including sulfo and amino groups. These structures lead to the capacity of dye molecules to develop color properties [
4]. Dyes are primarily divided into azo dyes, anthraquinone dyes, triphenylmethane dyes, sulfur dyes, etc., in accordance with their chemical structures. Among them, the azo dyes are the most diverse and widely used. These dyes contain several azo keys (N=N), which can obtain electrons and exhibit a certain degree of oxidation [
5]. The common treatment methods for azo dyes include adsorption [
6,
7,
8], advanced oxidation [
9,
10], electrochemical methods [
11], metals and their compounds catalysis [
12,
13], and biological methods [
14,
15]. The composition of printing and dyeing wastewater is complex, usually containing a certain amount of sulfur that emanates from the dye itself or dyeing auxiliaries. Higher-valence sulfur is decomposed to sulfide ions under anaerobic conditions and may even release hydrogen sulfide into the air, causing pollution to water bodies, soil, and air. However, sulfide is also a common reducing agent. The idea of using sulfides to mitigate dye has merit, but the reaction between the two is usually very slow. Research has shown that quinones [
16], humic acid [
17], and certain microorganisms [
18] can accelerate the reduction of dye by sulfur by promoting the transfer of electrons.
In recent years, many types of carbon materials, especially those with regular structures, large specific surface areas, abundant pores, rich functional groups, good electrochemical performance, and ease of modification, have been developed and used, including activated carbon, graphene, and multiwalled carbon nanotubes (CNTs), as well as mesoporous carbon materials. These are widely used in life sciences, chemical engineering, materials science, environmental engineering, and other applications [
19,
20]. However, compared with these commercial carbon materials, the advantages of biochar include a wide range of sources, environmental friendliness, low cost, and simple preparation process, and therefore, it has drawn attention [
21,
22]. Biochar is a carbon-rich solid produced by the pyrolysis of biomass with little or no oxygen and usually features abundant pores, a sufficient specific surface area, and diversified surface functional groups, such as hydroxyl and carboxyl groups. Moreover, it can be used as a platform for the synthesis of various functional carbon materials. Therefore, biochar materials have more advantages than traditional commercial carbon materials in terms of sensing [
23], electrocatalysis [
24], and energy storage [
25], and they are widely used. With the difference in pyrolysis temperature, heating time, preparation of raw materials, and other factors, the properties of biochar will differ, its functions will be more abundant, and its development potential is virtually unlimited [
26,
27,
28,
29]. In the pollutant treatment process, these carbon materials, including commercial carbon materials, biochar, and its modified materials, exhibit a wide range of effective applications for the treatment of halogenated hydrocarbons [
30,
31], benzene series [
32,
33], heavy metals [
34,
35], and other pollutants. As a matter of course, these series of carbon materials can be applied to the treatment of dyes, most of which feature adsorption and advanced oxidation [
36,
37], but few have been used as catalysts for the sulfide-based reduction of dyes.
Agricultural wastes such as rice chaff and straw, if improperly handled, can cause air pollution and aggravate the greenhouse effect. Using these agricultural wastes as biomass, which is rich in cellulose and lignin, to prepare biochar materials is one of the effective ways of fostering environmental protection and recycling resources [
21,
38,
39]. This study set out to prepare several kinds of biochar using agricultural waste materials (i.e., rice chaff, corn stalks, and bean stalks) to promote the reduction reaction of sulfide ions on azo dyes, avoiding the problem of adsorbent treatment induced by adsorption methods and the possible environmental impacts of the secondary pollution of metal catalysts. Through research on the promotion effect of the sulfide reduction of azo dyes by biochar materials, the kinetic characteristics of the reaction process, the raw materials, and the temperatures suitable for biochar preparation, the influence of pH and other conditions on the degradation effect of different azo dyes, and the possible reaction mechanisms, are discussed.
2. Results
2.1. Characterization of the Carbon Materials
2.1.1. Elemental Analysis and Energy-Dispersive X-ray Spectroscopy (EDS) Analysis
The elemental analysis (EA) results (shown in
Table 1) indicate that the main component of biochar is carbon, and it also contains oxygen and a small amount of nitrogen, indicating that the material may contain oxygen and nitrogen functional groups. The carbon content of biochar RCB800 accounts for 50.49% and contains oxygen (5.26%) and a small amount of nitrogen (0.30%). The carbon contents of BSB800 (bean stalk biochar material prepared at 800 ° C) and CSB800 (corn stalk biochar material prepared at 800 °C) are similar (82.94% and 79.19%) and higher than that of RCB800. The remaining, undetected component should be silicon. The reason for this is that rice chaff and straw biomass contain a certain quantity of ash that contains silicon, and rice chaff has high ash content [
40]. Additionally, we observed that RCB800 has the least H/C, indicating that of the three biochar materials, RCB800 had the largest aromatic cluster structure and graphitization degree. An EDS analysis (
Figures S1–S4) was consistent with the EA results. Simultaneously, the silicon element on the surface of the biochar was detected. The RCB800 silicon element accounted for 8.38%, whereas the silicon element content of BSB800 and CSB800 was relatively low, accounting for only 0.91% and 0.89%, respectively. Calcium was also detected, accounting for 3.65% and 0.24%, respectively. The EDS analysis results revealed that the used RCB800 (RCB800-2) was attached to some sulfur elements (accounting for 7.56%) and a small amount of sodium elements (accounting for 0.30%), indicating that a certain amount of sulfide as a reducing agent was attached to the material, which proves that the material had a strong adsorption capacity for sulfide ions. In addition, studies have demonstrated that sulfide ions can form special structures or functional groups on biochar, which provides the possibility of sulfur-modified biochar, and even other carbon materials [
41,
42].
2.1.2. Results of Scanning Electron Microscopy (SEM), Transmission Electron Microscopy (TEM), and N2 Adsorption/Desorption Isotherm Analysis
As is shown in
Figure 1a–c, the three kinds of biochar materials are similar in morphology, taking the form of massive accumulation, with a minimum diameter of approximately 100 nm; there were also pores of different sizes between the blocks. The surface of the material was rough, providing a large specific surface area, which had the ability to adsorb sulfides and dyes and carry a sufficient quantity of functional groups.
As is shown in TEM images (
Figure S5a–c), biochar materials had block structures of different sizes. The surface of biochars was rough and contained pores, including mesopores and micropores, and the edges could be observed to be derived from plant lignified tissue, which indicated that the surface of biochars was rich in pores and the specific surface area was large, which was consistent with the observation of SEM images. The BET (Brunauer–Emmett–Teller) specific surface areas of the three materials shown in
Table 2 were similar, of which RCB800 was the largest at 246.92 m
2/g, and the specific surface areas (SA
BET) of CSB800 and BSB800 were 210.99 m
2/g and 225.35 m
2/g, respectively. The materials had a relatively large specific surface area, which could provide loading space for functional groups and enhance the contact between the materials and the reactants. The BJH (Barrett-Joyner-Halenda) test results showed that the average pore size of the three materials was within the mesoporous range (2–50 nm) close to the micropores. Combined with the results of electron microscopy analysis, it could be considered that the materials in this experiment had a rich mesoporous structure.
2.1.3. Results of the X-ray Diffraction (XRD), X-ray Photoelectron Spectroscopy (XPS), and Fourier Transform Infrared Spectroscopy (FTIR) Analyses
The XRD spectra of RCB800, BSB800, CSB800, and CNTs are shown in
Figure S6. The biochar materials RCB800, BSB800, and CSB800 have a broad diffraction peak at 2θ = 23° and 2θ = 44°. The diffraction signals corresponding to both the (002) crystal plane and (100) crystal plane of the graphite structure feature the structural characteristics of graphitized carbon [
43,
44]. Simultaneously, the wide diffraction signal of the material indicates that it features a certain degree of graphitization, primarily the amorphous structure of carbon. Multiwalled CNTs have two broad diffraction peaks, at 2θ = 26° and 2θ = 44°, which also correspond to the diffraction signals of the (002) crystal plane and (100) crystal plane of the graphite structure. The diffraction peak at 2θ = 26° is the typical Bragg peak of the CNTs [
45]. The XRD results showed that the biochar materials and commercial carbon materials have a similar crystal structure and may have a similar mechanism and degradation effect with respect to the dye treatment.
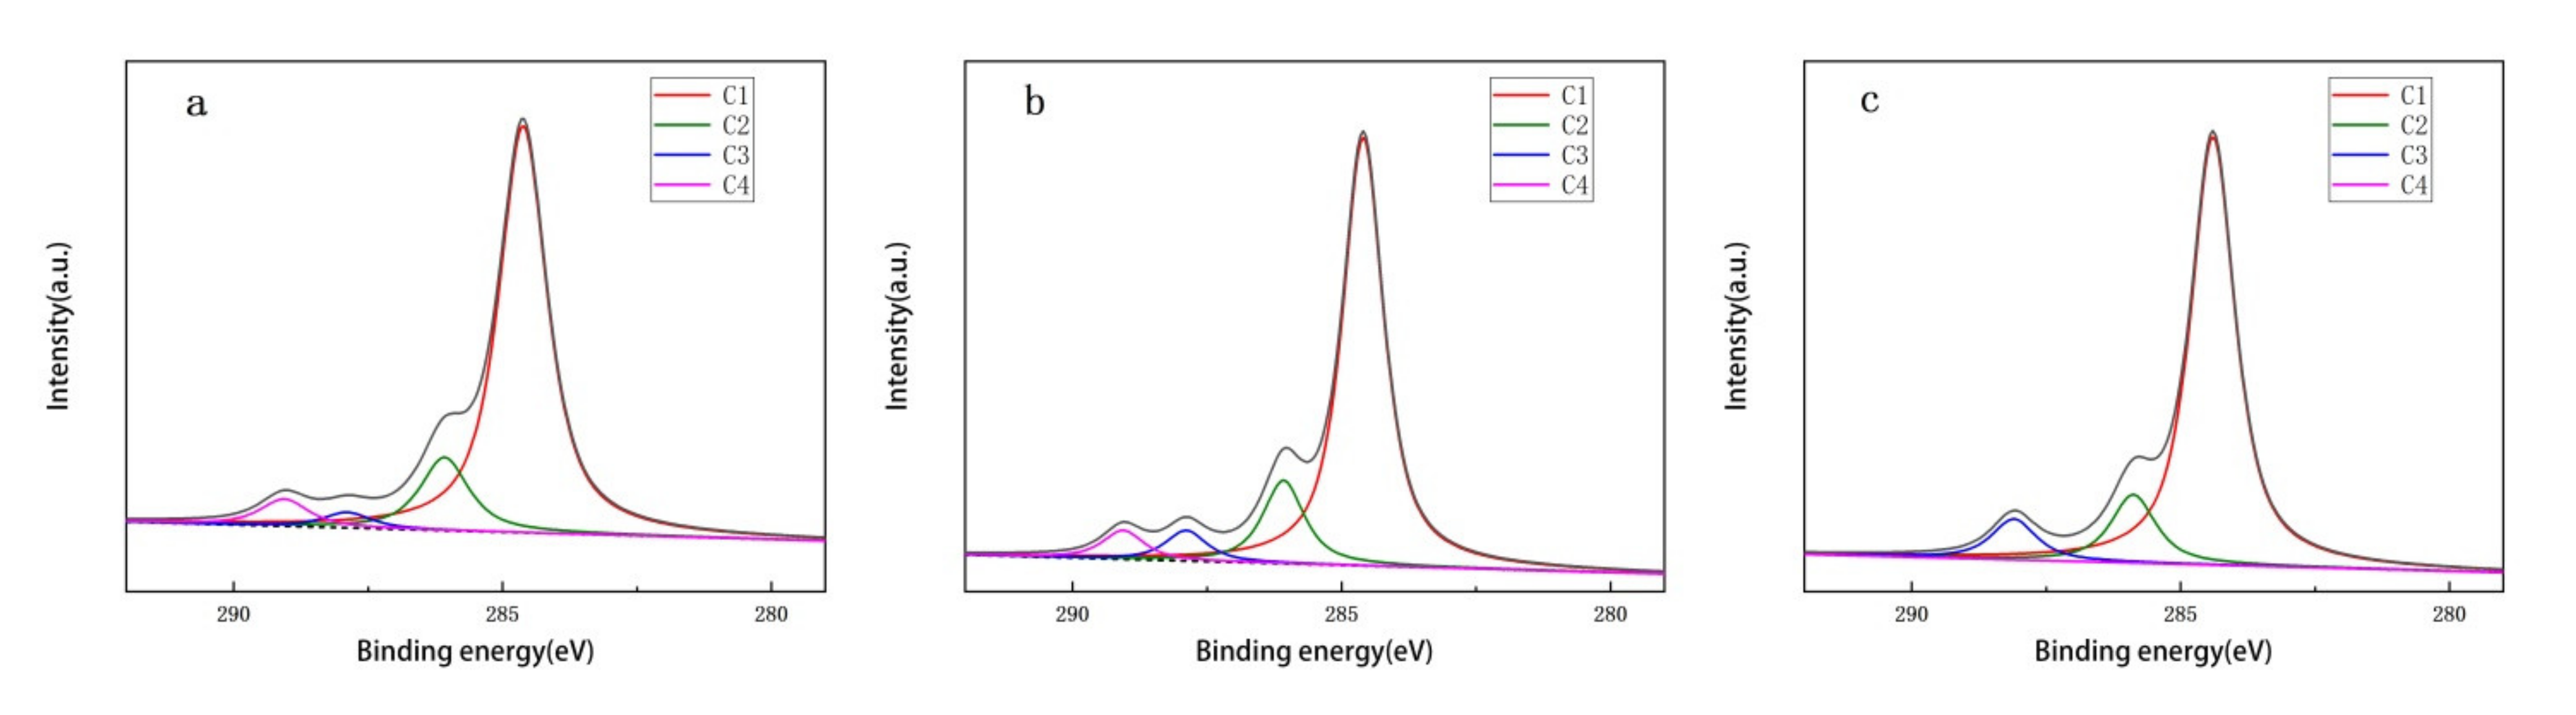
XPS was used to analyze the surface functional groups of biological carbon.
Figure 2 shows the C1s XPS spectra of three kinds of biochar, fitted to four peaks (C1, C2, C3, and C4). The binding energy of peak C1 was near 284.59 eV, representing C–C/C–H/C=C. The binding energy of peak C2 was located at 285.88–286.27 eV, representing C–OH/C–O–C. The binding energy of peak C3 was located at 287.66–288.12 eV, representing carbonyl C=O, and the binding energy of peak C4 was located at 288.70–289.43 eV, representing the carboxyl group or ester (O=C–O). Simultaneously,
Figure 3 shows the O1s XPS spectra of the three biochar materials, fitted to three peaks (O1, O2, and O3). The binding energies of peak O1 are located near 531.50 eV, representing the carbonyl group (C=O). The binding energies of peak O2 are located near 532.60 eV, representing the phenol groups (C–OH) and/or C–O–C ether groups. The binding energies of peak O3 are located near 533.70 eV, representing the carboxylic group (COOH) [
46,
47]. Their abundances are presented in
Tables S1 and S2. The characterization results of the C1s XPS and O1s XPS spectra are consistent, indicating that the surfaces of biochar materials may contain a variety of oxygen-containing functional groups, including quinone, carboxyl, and hydroxyl.
Figure S7 presents the FTIR spectra of the biochar materials. The main functional groups in these three kinds of biochar include 3440 and 3332 cm
−1 (the stretching vibrations of the hydroxyl group, C–OH), 1660 cm
−1 (the stretching vibrations of C=O), 1598 cm
−1 (aromatic skeletal vibration), 1500 cm
−1 (C–C stretching of aromatic skeletal vibration), 1453 cm
−1 (stretching of aromatic skeletal vibration), 1402 cm
−1 (aromatic skeletal vibrations combined with C–H in-plane deformation), 1073 cm
−1 (stretching vibration of fatty ether, C–O–C), 1164 cm
−1 (band of saturated ester, C–O), and 785 cm
−1 (out-plane bending vibration of C–H) [
41,
48,
49,
50]. The characterization results indicate that the material has an aromatic structure and contains oxygen-containing functional groups on the surface, which corresponds to the characterization results of XPS and XRD.
2.2. Efficiency of Carbon Materials for Azo Dye Degradation
2.2.1. Calculation
The improved Gompertz model (Equation (1)) was used to simulate the redox reaction of sulfide and dye [
51,
52].
Ct represents the concentration of dye in the system at time t, C0 represents the initial concentration of the dye, and the parameter P (dimension 1) represents the ratio of the final degradation of MO (methyl orange) to the initial MO concentration in the experiment, which reflects the potential of dye degradation. The parameter k (min−1) represents the degradation rate of the unit’s initial concentration of MO in the rapid degradation stage, whereas the parameter λ (min) represents the lag time of the degradation reaction.
2.2.2. The Promoting Effect of Biochar on the Sulfide-Mediated Reduction of Azo Dyes
As is shown in
Figure 4 and
Table S3, when biochar materials were added without sulfide, it was observed that, under the experimental conditions, biochar materials had almost no ability to absorb and degrade the dye. There were many reports indicating that some carbon materials have dye-adsorbing effects in theory and that the dye concentrations described in these reports were much lower than those in this experiment; that is, the dye concentration in this experiment was much higher than the adsorption capacity of the material for azo dyes, as well as the carbon material. The properties and structure of the materials also differed, whereby biochar materials had a poor adsorption effect at higher concentrations [
7,
53,
54]. When only adding sulfide, MO could be degraded, and the degradation process could be easily fitted using the Gompertz model with a correlation coefficient of R
2 = 0.99954. After adding biochar materials, the reduction effect of sulfide on the MO increased significantly, with the specific manifestation that the lag time λ was greatly advanced from 59.677 to 14.488 min taking RCB800 as an example, and the degradation rates of the rapid degradation stage were 0.156 and 0.182 min
−1, which were on the same order of magnitude. For the entire degradation process, we believe that the rapid degradation rate of MO in the aforementioned two experiments was relatively similar. Regardless of whether the material was added, the degradation potential of MO was close to 1, indicating that the sulfide could theoretically completely mitigate the dye under the physical and chemical conditions of the experiment. The aforementioned experiments indicate that the biochar materials, with a large specific surface area, rich oxygen-containing functional groups, graphitized structure, and a partial mesoporous structure, have a strong promotion effect on the reduction of azo dyes by sulfides. For the degradation effect of the biochar materials from the different raw materials, the order of degradation capability was as follows: RCB800 (rice chaff) > CSB800 (corn stalks) > BSB800 (bean stalks). Because RCB800 had the best catalytic effect, this material was used for comparison purposes and as the benchmark experimental condition for the subsequent experiments. Combined with the BET results (shown in
Table 2), the specific surface area of the biochar was positively correlated with its catalytic effect. It was also noted that the order of the degradation performance of the three types of biochar was negatively correlated with their hydrocarbon ratios (displayed in
Table 1), indicating that the aromatic clusters and graphitized structure of the materials were beneficial to the degradation of the dyes by biochar. As shown in
Figure S8 and
Table S3, the catalytic effect of the washed carbon material was stronger than that of the unwashed carbon material. The reason for this was that the washing eluted impurities, such as soluble inorganic salts, and improved the material’s pore structure, making the unit mass of the washed carbon material stronger than that of the unwashed one.
2.3. The Influence of pH and Temperature on the Reaction
As shown in
Figure 5a and
Table S4, with the increase in temperature, the degradation rate increased from 0.128 to 0.226 min
−1, and the lag time was shortened from 16.952 to 8.900 min, indicating that the increase in temperature accelerated the movement of particles and enhanced the collision probability between the reactant molecules or ions, and therefore, the reaction rate increased and the time was reduced.
Figure 5b and
Table S5 display the degradation of dyes at different pH levels. Parameter k changed significantly with the pH, and when the pH was 10.2, the MO would not degrade within 80 min. At pH = 6.2, the degradation rate was k = 0.053 min
−1, and in the range of pH = 6.2–8.1, the higher the pH, the longer the lag time. When the pH was 6.2, the lag time was λ = 12.064 min, and when it was 8.1, the lag time was extended to λ = 21.719 min. However, the fastest rate of change differed. When pH = 7.4, the degradation time was 0.182. At this point, the increase and decrease in pH would reduce the degradation rate. When the pH was 8.1 and 6.2, k was 0.105 and 0.053 min
−1, respectively. The reduction process of the azo dyes was accompanied by the addition of hydrogen ions and the cleavage of azo bonds. The increase in pH led to a decrease in hydrogen ions in the system, and the reduction reaction of the dyes lacked reactants, which slowed the reaction or even prevented it within a short time. The lower pH value would convert more sulfide ions into hydrogen sulfide molecules, reducing the concentration of the sulfide ions and thereby weakening the reduction process of the azo dyes.
2.4. The Influence of Polysulfide, Zeolite, and Quinones on the Reaction
As shown in
Figure 6a and
Table S6, polysulfide had an extreme effect on the degradation of azo dyes, even without the effect of any catalyst. The degradation rate was k = 0.332 min
−1, whereas the lag time was λ = 1.756 min, which indicates that it was more effective than biochar RCB800. Zhao et al. reported that the production of polysulfide during the reaction between the sulfides and dyes led to the rapid degradation of the latter [
51].
As shown in
Figure 6a and
Table S7, the reaction rate and lag time of the experimental group with added zeolite were similar to those of the experimental group with biochar material RCB800, indicating that zeolite could also significantly promote the reaction between sulfides and azo dye, and their catalytic mechanism could be similar, as the developed pore structure of zeolite, including mesopores, is similar to biochar and some carbon materials, such as ordered mesoporous carbon materials.
Quinone compounds have a catalytic effect on the reduction of azo dyes by sulfides. In this experiment, the common electron transporter AQDS (anthraquinone-2,6-disulfonic acid disodium salt) was selected for comparison in order to explore the effect of quinone compounds and biochar on reducing azo dyes by means of sulfides [
55]. The specifics are shown in
Figure 6b and
Table S8, which indicate that AQDS was effective in the degradation of MO by means of sulfide, and with the increased amount of AQDS, the catalytic effect was enhanced. It is generally believed that the material with the quinone structure in it plays an important role in electron transfer in the reduction process. The experimental results indicate that the catalytic performance of the same amount of biochar material was superior to that of the electron-mediated substance containing the quinone structure, and the biochar material had a stronger dye degradation effect than the AQDS. Combined with the results of the EDS, XPS, and EA, the quinone group of the carbon material RSB800 was no more than 4%, whereas the quinone oxygen in the AQDS accounted for 7.77%, and the quinone structure may not be the only influencing factor for biochar. On the basis of the results and discussion in the previous section, the pore structure of the material, as well as the surface functional groups, can be considered important factors that affect the catalytic reaction.
2.5. The Influence of the Sulfide Concentration and MO Concentration on the Reaction
As shown in
Figure 7a and
Table S8, the rate of the sulfide with a sulfur concentration of 8 mmol/L was similar to that with 6 mmol/L. When the sulfide level was decreased from 4 to 2 mmol/L, the reduction rate was also significantly reduced, and the lower the content, the more obvious the decline rate became, and the lag time would also be extended. Noting that the sulfide content in this experimental system was excessive, it can be concluded that the aforementioned phenomenon was because the dosage of the sulfide as a reactant was reduced to a certain level. In addition, with the decrease in sulfide dosage, the degradation potential of azo dyes in the system decreased.
As shown in
Figure 7b and
Table S9, the concentration of MO in this experimental system had little effect on the reaction parameters, and the complete degradation potential at a similar time was close to 1. The 0.5 mmol/L MO lag time was 14.488 min, and when the concentration of MO was 0.1 mmol/L, the lag time was slightly shortened to 12.880 min. The degradation rate parameter k was close, from 0.182 to 0.149 min
−1, and in this group of experiments, the degradation rate per unit initial concentration decreased slightly for the different initial concentrations of MO.
2.6. Recycling and Applicability of Biochar
Figure S9 and
Table S10 display the reusability of the material, which was recycled and reused in order to investigate its catalytic performance. Their reaction rates were close (0.182, 0.184, and 0.153 min
−1), and the lag time was slightly extended (from 14.488 to 16.629 min). During the use of the material, the surface functional groups and pore structures would be changed, which would in turn affect the catalytic effect. Generally speaking, the material had good reusability.
Figure S10 and
Table S11 show the effect of biochar catalyzing the reduction of methyl red (MR) by means of sulfide. Similar to the degradation effect of MO, the degradation rate without biochar was faster, at up to 0.252 min
−1, and the lag time was shorter, at 47.834 min, indicating that the sulfide had a better degradation effect on MR, and simultaneously, compared with the system without RCB800 material, the lag time was greatly shortened to 7.461 min, but the degradation rate (0.252 min
−1) was similar, indicating that the biochar material had a good promoting effect on the process of sulfide reduction of azo dyes with simple structures.
Because of the high cost of commercial carbon materials and the complex preparation required, the process of reducing azo dyes with biochar was more economical and affordable. As shown in
Figure S11 and
Table S3, the biochar material RCB800 and commercial carbon material multiwalled CNTs had similar effects, as their catalytic performances were very similar, and the degradation trend of the CNTs was in line with the Gompertz model.
2.7. The Mechanism of Biochar-Mediated Sulfide Degradation of Azo Dyes
The degradation of azo dyes by sulfides is a reduction process. The most important part of this process is the rupture of the azo bond (N=N). For the total reaction, 1 mol of MO molecule contains an azo bond and receives 4 mol of electrons, so the azo bond is cleaved into two amino groups. Correspondingly, 2 mol of the sulfide ion loses 4 mol of electrons to convert to zero-valent sulfur; that is, 2 mol of the sulfide ion can reduce 1 mol of the azo bonds, as is shown in
Scheme 1③. However, according to the experimental results, this process clearly does not typically conform to the first-order reaction kinetics of azo dye degradation. In most cases, azo dyes hardly degrade, or only do so very slowly. In the initial stage of the reaction, after reaching lag time λ, the degradation rate of the dye rapidly increases to k, after which the rate slows down until the end of the reaction. This indicates that a certain substance that causes autocatalysis is produced during the reaction. Zee et al. used sulfide to reduce the azo dye Acid Orange 7 and believed that the dye degradation product 1-amino-2-naphthol could be converted into amino acid containing a quinone structure, which can then be used as an electron mediator, similar to AQDS, to initiate the autocatalytic process [
56]. However, the MO and MR in this experiment could not produce products containing phenol or quinone structures, and similar reaction kinetics also occurred; therefore, other substances may cause autocatalysis. Polysulfides, including disulfides and trisulfides, are produced during the reaction between dyes and sulfides [
51]. A portion of the sulfides will be reduced to polysulfides in the initial stage of the degradation of dye by the sulfide, and different catalyst materials also exhibit different effects at this stage (
Scheme 1①). The reduction capacity of the polysulfides was stronger than that of the sulfide, and the production of polysulfides rapidly increased the degradation rate (
Scheme 1②). This was formed by the sulfides and the polymerization of the elemental sulfur generated by oxidized sulfide (
Scheme 1④). The resulting polysulfides had stronger reducibility than the sulfides, accelerating the reduction reaction and the polymerization of elemental sulfur, with additional polysulfides forming. As the reaction progresses, the azo dye is gradually degraded, with the reaction rate decreasing until the end. The experimental results also show that polysulfides have a strong capacity to degrade azo dyes, leading to various catalysts having little effect on
Scheme 1②.
Therefore, when combining the experimental results of using biochar, commercial materials, electron mediator AQDS, and zeolite, these materials shorten the lag time λ and can accelerate the degradation of dyes by promoting the production of polysulfides. Specifically, the quinone structure contained in AQDS can promote electron mediation between reactants and shorten the generation time of the sulfides. The XPS and FTIR characterization results reveal that the surface of the biochar material contains such oxygen-containing functional groups, which can promote electron transfer. Furthermore, the characterization and experimental results were compared, and other oxygen-containing functional groups such as hydroxyl, ether, carboxyl, or ester may also play a positive role in the reduction process. However, the surface functional groups are not the only determinant.
Second, the experiment showed that zeolite has a catalytic effect on the reaction, and the kinetic process of degradation by zeolite is the same as that by other materials, indicating that the material may be conducive to the production of polysulfides, and the promotion mechanism of the sulfide reduction of azo dye is the same. Zeolite, a silicoaluminate mineral with a porous structure that can be used as a molecular sieve, is a common occurrence due to polysulfide and polysulfide free radicals in nature, such as lazurite [
57]. It usually contains a large number of mesoporous-level pores. The BET and SEM characterization results showed that biochar has a certain mesoporous structure that can enhance the generation and retention time of polysulfides and even polysulfide free radicals, which are one of the factors that can effectively catalyze the sulfide-driven reduction of azo dyes.
Moreover, the specific surface area of the material enhances its capacity to adsorb reactants and increases the surface distribution of oxygen-containing functional groups, prompting the material to exert its catalytic effect. Biochar RCB800, with its larger specific surface area, has been shown to have a stronger catalytic capacity than other biochars.
Finally, in addition to the catalyst, the pH, temperature, and sulfide concentration all exert an effect on the catalytic reaction. Too low a pH will cause the concentration of sulfide ions in the system to decrease and in turn affect the reduction reaction. A high temperature will increase the overall rate of the sulfide-driven reduction of azo dyes. The change in sulfide in the system will directly affect the generation rate and the quantity of polysulfides, which in turn affects the degradation process of azo dyes.
3. Materials and Methods
3.1. Materials
Methyl orange (MO, 98%), methyl red (MR, 95%), sodium sulfide nonahydrate (>98%), disodium hydrogen phosphate (AR), sodium dihydrogen phosphate (AR), and anthraquinone-2,6-disulfonic acid disodium salt (AQDS, 98%) were purchased from Sinopharm Chemical Reagent Co., Ltd. (Shanghai China); multiwalled CNTs (>99%) were acquired from XFNANO Materials Tech Co., Ltd. (Nanjing, China); zeolite (ZSM-5, SiO2/Al2O3 (mole ratio) = 40–50) was purchased from Macklin Biochemical Co., Ltd. (Shanghai, China); high purity nitrogen was purchased from Juyang Gas Co. Ltd. (Changchun, China); and agricultural rice chaff, corn stalk, and bean stalk waste were sourced from a farm in Heilongjiang Province, China.
3.2. Experimental Method
3.2.1. Material Preparation
Three common agricultural wastes, namely, corn stalk, rice chaff, and bean stalk, were used as the raw materials for preparing the biochar materials. The raw materials were washed three times with deionized water and dried in an oven at a temperature of 80 °C. The cleaned biochar raw materials were then weighed and calcined in a tube furnace (OTF-1200X, KejingTech, Hefei, China) at a high temperature while passing high purity nitrogen at a flow rate of 60 cm3/min. The heating rate was 15 °C/min, the calcination temperature was 800 °C, the calcination time was 4 h, and the materials were taken out after cooling to room temperature. The biochar was ground using a planetary ball (YXQM-2L, MITR Tech, Changsha, China) mill rotating at 300 rpm for 30 min and passed through a 140-mesh screen. A portion of the selected biochar particles was extracted and retained, and the other part was washed three times with deionized water and dried in a vacuum drying oven at a temperature of 80 °C. The material should be sealed and protected from light after being taken out. These samples were named CSB800, RCB800, and BSB800 in accordance with the different raw materials.
3.2.2. Batch Experiment
Before the experiment, a phosphate-buffered saline solution with a concentration of 0.2 mol/L was preconfigured. The concentration of the dye mother liquor was 1 mM, and the volume was adjusted with a buffer salt. The concentration of the mother liquor of sodium sulfide was 0.4 mol/L; 9.6 g of sodium sulfide nonahydrate was weighed, and its volume was diluted to 100 mL with deoxygenated and deionized water. All batch tests had to be operated under anaerobic conditions, and the above solution should be prepared with deoxygenated ultrapure water. The biochar material was placed in a 100-mL headspace bottle, added to the buffered salt solution, and then ultrasonically dispersed for 10 min. A certain amount of dye mother liquor was then added to the system; after which, the sodium sulfide mother liquor was added after it had been uniformly mixed. The reaction system was placed in a 200-rpm shaker, and samples were regularly taken. The samples were filtered through a 0.22-μm microporous membrane, diluted to 0.1 times, and the concentration of dyes in the samples was tested with a UV–Vis spectrophotometer (UV-2600i, Shimadzu, Japan). In addition, the used biochar material was washed three times with water and stored at 5 °C.
The batch experiment series was as follows: Series 1: The self-made biochar materials, CSB800, RCB800, and BSB800, were used to investigate the influence of different biochar materials on the reaction and the molecular structure, particle size, pores, and functional groups of carbon materials on the properties of the materials. Series 2: The effects of different pH values on the reaction were investigated with experiments conducted under the conditions of pH = 6.2, 7.4, 8.1, and 10.2. Series 3: The effects of different temperatures on the reaction were investigated with experiments conducted under the conditions of 20, 30, and 40 °C. Series 4: Experiments on the degradation of dyes by polysulfides and the use of quinone compounds and zeolite as catalysts were carried out in order to study the role of polysulfides in the reaction, as well as the influence of the oxygen-containing groups and porous structure of the catalyst materials on the degradation reaction. Series 5: Certain concentration gradients of sulfide ions (2, 4, 6, and 8 mM) were employed to investigate the influence of sulfide ion concentration on the reaction rate and set as a blank to investigate the adsorption effect of the material on the dye. Series 6: Certain concentration gradients of the dyes (0.1, 0.2, 0.3, 0.4, and 0.5 mM) were employed to investigate the influence of different dye concentrations on the degradation reaction. Series 7: Different types of dyes (MO and MR) were used to explore their effects on the degradation process.
The absorption peak of MO was measured at 464 nm and that of MR was measured at 430 nm.
Figure S12 displays the UV–Vis spectra of the aforementioned two dyes under the basic conditions. A standard curve was drawn to determine the relationship between the absorbance and concentration.
3.3. Material Characterization
The elemental content of the biochars was measured using an elemental analyzer (CHNS Element Analyzer, vario EL cube, Elementar, Langenselbold, Germany). The specific surface area of the material was determined using the Brunauer–Emmett–Teller (BET) model, and the pore size distributions were calculated using the Barrett–Joyner–Halenda model in accordance with the desorption branches of nitrogen isotherms. The surface morphology of the biochar was observed using a scanning electron microscope (SEM)–energy-dispersive X-ray spectrometer (EDS, JSM-5600, JEOL, Tokyo, Japan) and field emission transmission electron microscope (FETEM, TECNAIF20, FEI, Hillsboro, OR, USA). The crystalline structures of the biochar were recorded using X-ray diffraction (XRD, D8 ADVANCE, Bruker, Karlsruhe, Germany), and its spectral characteristics were analyzed using Fourier transform infrared spectroscopy (FTIR, Nicolet iS5, Thermo Fisher Scientific, Waltham, MA, USA). The functional groups on the surfaces of the biochar were evaluated with an X-ray photoelectron spectrometer (XPS, ESCALAB250, Thermo Fisher Scientific, Waltham, MA, USA).
4. Conclusions
This experiment utilized agricultural waste rice chaff, bean stalk, and corn straw as raw materials to extract biochar materials. Among these, the biochar with the rice chaff as raw material, calcined at 800 °C, exhibited the best effect. The experimental results revealed that the aforementioned materials can promote the redox reaction between azo dyes and sulfides, with the degradation process conforming to the Gompertz model. During the degradation process itself, the graphitized structure, mesoporous structure, and oxygen-containing functional groups play important roles. The biochar material prepared for this experiment could be used in the disposal of wastewater that is rich in sulfides and azo dyes without the addition of other types of agents. Simultaneously, the materials are economical and environmentally friendly, make use of agricultural waste, and feature a simple preparation process. Therefore, they offer new ideas and potential directions for the treatment of azo dyes and sulfides in wastewater.


