Article

Development of an Iron-Based Fischer—Tropsch Catalyst with High Attrition Resistance and Stability for Industrial Application

National Institute of Clean-and-Low-Carbon Energy, Beijing 102211, China
*
Authors to whom correspondence should be addressed.
Submission received: 1 July 2021 / Revised: 21 July 2021 / Accepted: 24 July 2021 / Published: 27 July 2021
(This article belongs to the Special Issue CO and CO2 Conversion over Heterogeneous Catalysts)

Abstract

:
In order to develop an iron-based catalyst with high attrition resistance and stability for Fischer–Tropsch synthesis (FTS), a series of experiments were carried out to investigate the effects of SiO2 and its hydroxyl content and a boron promoter on the attrition resistance and catalytic behavior of spray-dried precipitated Fe/Cu/K/SiO2 catalysts. The catalysts were characterized by means of N2 physisorption, nuclear magnetic resonance (NMR), X-ray diffraction (XRD), Raman spectrum, X-ray photoelectron spectroscopy (XPS), H2-thermogravimetric analysis (H2-TGA), temperature-programmed reduction and hydrogenation (TPR and TPH), and scanning and transmission electron microscopy (SEM and TEM). The FTS performance of the catalysts was tested in a slurry-phase continuously stirred tank reactor (CSTR), while the attrition resistance study included a physical test with the standard method and a chemical attrition test under simulated reaction conditions. The results indicated that the increase in SiO2 content enhances catalysts’ attrition resistance and FTS stability, but decreases activity due to the suppression of further reduction of the catalysts. Moreover, the attrition resistance of the catalysts with the same silica content was greatly improved with an increase in hydroxyl number within silica sources, as well as the FTS activity and stability to some degree. Furthermore, the boron element was found to show remarkable promotion of FTS stability, and the promotion mechanism was discussed with regard to probable interactions between Fe and B, K and B, and SiO2 and B, etc. An optimized catalyst based on the results of this study was finalized, scaled up, and successfully applied in a megaton industrial slurry bubble FTS unit, exhibiting excellent FTS performance.

1. Introduction

Fischer–Tropsch synthesis (FTS) is the major route for converting syngas (CO+H2) made from coal or natural gas into a wide variety of hydrocarbons. The products are further processed to obtain fuel and chemicals. Increasingly stringent environmental regulations are pushing the drive for clean fuels (low-sulfur, low-aromatics), and concerns about the huge consumption of liquid fuel make FTS an environmentally friendly and promising route for coal- or gas-rich regions.
The industrial catalysts for FTS are mainly iron- and cobalt-based catalysts [1]. Iron-based catalysts are relatively inexpensive, possess reasonable activity for FTS, and have lower sensitivity towards poisons and excellent water gas shift (WGS) activity compared with cobalt catalysts, which makes iron-based catalysts the preferred catalysts for hydrocarbon production via FTS using coal-derived syngas [1,2,3,4]. Iron-based catalysts can be divided into precipitated iron catalysts for low-temperature FTS and molten iron catalysts for high-temperature FTS, according to different synthetic routes. Precipitated catalysts can be utilized at 230–280 °C, which is suitable for producing diesel oil and wax, and molten catalysts can be used to produce low-carbon olefins and gasoline at 320–340 °C [1]. The application of a slurry bubble column reactor (SBCR) for liquid-phase FTS using a precipitated iron-based catalyst is advantageous because of the excellent control of the highly exothermic reaction heat in large-scale industrial operation. Nevertheless, the use of iron catalysts in the most economical SBCR has been limited by their high rate of attrition to ultrafine particles leading to catalyst loss, difficulty in wax/catalyst separation, and product contamination, resulting in mass transfer limitations and downstream processing unit shutdown [5,6]. Several literature works have reported that operational difficulties, caused by catalyst breakup (attrition), were encountered during an F–T demonstration run in an SBCR at LaPorte Texas. The filtering system was plugged after one day of operation, and the external catalyst/wax separation in a settling tank was inefficient, resulting in gradual loss of the catalyst from the reactor, using a precipitated iron catalyst [7,8,9]. The problems were attributed to breakup of the original catalyst particles into fine particles. Also, researchers at Sasol in South Africa reported that an Fe F–T catalyst, used in fixed-bed reactors at Sasol, may be structurally too weak for use in the SBCR and that solid/wax separation was a major developmental challenge in the commissioning of a semi-commercial-scale SBCR (2500 barrels of liquid product per day) [10,11]. It is believed that the attrition process of iron catalysts for F−T synthesis includes both fracture (the fragmentation of particles) and abrasion/erosion (the process by which particle surface layers or corners are removed) [12,13]. Particle erosion is particularly serious as it generates more fine particles because the catalysts undergo various stresses during the F−T reaction, such as collision, friction, pressure, thermal and chemical stresses. Therefore, the attrition property of the F–T catalyst must be improved before its industrial application. In order to overcome this obstacle, numerous researchers have launched studies on catalyst optimization through fundamental structure design and novel preparation technology, etc.
SiO2 was used as a binder to improve the strength of iron-based coprecipitated catalyst for a slurry bed and to protect iron grains from sintering during F–T reaction [1,14]. Many researchers have researched the effect of SiO2 on the attrition resistance of catalysts [15]. Goodwin et al. investigated the adding process and the amount of added SiO2 and found that the attrition resistance of the catalyst prepared by adding binder SiO2 after precipitation was better than that prepared by adding precipitated SiO2 during precipitation [16]. In addition, the authors also found that the higher the particle density, the better the attrition resistance property [17]. Therefore, the attrition resistance got worse with higher content of SiO2, as it lowers the particle density of the catalyst. However, precipitated SiO2 can be used in the preparation of attrition-resistant spray-dried iron catalysts when present in a suitable amount less than 12 wt%, as long as appropriate precipitation and spray drying techniques are employed. Bukur et al. [18] investigated the effect of precipitated SiO2 and binder SiO2 on the attrition resistance, and also the effect of different SiO2 sources (silica sol, ethyl orthosilicate, potassium silicate). The increase in the fraction of particles smaller than 10 μm for the three catalysts after ~300 h of FTS reaction was 0.7%, −3.4%, and −0.3%, respectively. The CO+H2 conversion after 150 h of FTS reaction was 72%, 74–78%, and 72%, while the CH4 selectivity was 3.4%, 2.6%, and 2.0–2.4%, respectively. The results showed that the catalyst prepared from silica sol had the best attrition resistance, but the worst activity and selectivity. Hou et al. [19] observed the morphologies of catalysts with different SiO2 contents before and after reaction by SEM, and found that the attrition resistance of the catalysts improved as SiO2 content was increased from 100Fe/5Cu/4.2K/15SiO2 to 100Fe/5Cu/4.2K/40SiO2, while the reduction and carbonization of the fresh catalysts were inhibited. For 100Fe/5Cu/4.2K/15SiO2, the CO conversion at 300 h and 500 h are 48.41% and 47.82%, respectively, while for 100Fe/5Cu/4.2K/40SiO2, the CO conversion at 300 h and 500 h are 31.68% and 32.55%, respectively. Chang Hai et al. [20] studied the effect of SiO2 addition parameters (temperature, pH value, and aging time) on the structure and performance of an Fe/Cu/K/SiO2 catalyst prepared by a coprecipitation method. This work shows that 55 °C is the best addition temperature for the lowest deactivation rate as well as the best selectivity, and it is beneficial to improve attrition resistance by prolonging the aging time within 150 min. With the decrease in pH, the attrition resistance is strengthened whereas the reduction of the catalyst becomes more difficult.
Researchers have mainly studied the effects of SiO2 addition method, content, source type, and process conditions on the attrition resistance of precipitated iron catalysts and its activity and selectivity. However, the relationship between attrition resistance and catalyst reaction stability have been rarely reported yet.
In addition to the attrition resistance property, the FTS reaction stability of the precipitated iron catalyst is also key to the stable operation of the industrial plant. Generally, the deactivation of Fischer–Tropsch catalysts is attributed to poisoning [21], oxidation [22], sintering [23], and coking [24]. The deactivation from S poisoning is mainly due to the insufficient purity of syngas and can be solved by purification [1]. For the other types of deactivation, many researchers avoid iron grain sintering and oxidation by adjusting the interaction between Fe and Si or by adding Mn, Zn, and Zr additives [25,26,27,28,29]. However, in view of catalyst deactivation from coking, although some research results have shown that the coke is formed on the catalyst surface due to a Boudouard reaction, and the addition of K promoter will make the coking more obvious [30,31,32], there is few work reported about the effect of promoters on anti-coking during FTS reaction as well to make further improvement of catalyst stability based on it.
It is suggested that a suitable iron catalyst for SBCR application requires excellent resistance to not only physical fracture/abrasion but also chemical erosion which occurs with coking, causing deactivation under reaction conditions. An integrated study on catalyst physical attrition resistance and reaction stability is presented herein. In this paper, the effects of SiO2 content and silanol content within the silica sources on the attrition resistance, FTS stability, and performance of an as-prepared iron catalyst were investigated. Based on the proposition that the CO adsorption and dissociation can be controlled and the Boudouard reaction can be restrained by adjusting the electron density on the catalyst surface, a novel catalyst design with a novel promoter was developed to restrain coking, and it demonstrated excellent FTS stability for industrial application.

2. Results and Discussion

2.1. Effect of Silica Content on Attrition Resistance and Stability of Catalyst

Based on the conclusions of previous research works, an increase in silica content in the catalyst improves the attrition resistance and stability of the catalyst [19]. As a primary comparison of this present research, a group of model precipitated iron catalysts were prepared (see Table 1) with the traditional formula 100Fe2O3: 4.4CuO: 3.5K2O: 17.5SiO2, and various SiO2 contents at the fixing ratio of Fe/Cu/K. The correlation between the silica content and the attrition index, stability, and reaction performance was investigated. As can be seen from Figure 1, the attrition index of the catalyst decreases with the increase in silica content, indicating the attrition resistance is improved. Moreover, the FTS deactivation rate of the catalyst decreases with the increase in silica content, i.e., the FTS stability is enhanced. Furthermore, the FTS reaction performance data (Table 2) showed that the CO conversion rate of the catalyst decreased with the increase in silica content, while the methane selectivity increased, which was consistent with the law obtained by Cheng-Hua Zhang et al. [33].
For a further understanding, H2-TG tests were carried out for the above catalysts with different SiO2 contents. The results (Table 3) demonstrated that the reduction process under H2 atmosphere is basically divided into two stages: the first stage is from Fe2O3 reduced to Fe3O4, and the second stage is from Fe3O4 to FeO or Fe. The results show the reduction degree during the first stage differs insignificantly for all samples, from 30% to 35%. However, it is significant for the second stage. The reduction degree of the whole process was found to be lowered with the increase in silica content in the catalyst. It can be explained that the increase in silica content results in more Fe-O-Si within the catalyst, hence strengthening the interaction between Fe and Si, leading to the difficulty of catalyst reduction and easiness of activation. For example, the catalyst SFT-4 with 20% SiO2 content has a reduction degree of 66.66% under H2 reduction process from 120 °C to 1200 °C, and as a result, it led to a lower activity. Therefore, although the catalytic stability is improved by increasing the SiO2 content, the negative effect is to sacrifice the FTS activity related to the lowered reduction degree. It is suggested to find a suitable SiO2 content for the optimized catalyst through synthetically balancing FTS performance, stability, and attrition resistance.
Among the above catalysts (Table 1), SFT-3 with silica content of 17.5% shows the best performance in view of integrated FTS. However, the deactivation rate of 0.24‰/h predicts that the CO conversion is 24% lower after 1000 h of reaction, and the significant activity loss is far away from the requirements of industrial application. As a comparison, an attrition index test was launched over the SFT-3 sample under simulated FTS reaction conditions in a CSTR with extra high stir speed. The results (Table 4 and Figure 2) indicate that the SFT-3 sample with an attrition index of 6.15 wt%/h is still very fragile in the simulated reaction attrition test.

2.2. Effect of Silanol Content on Attrition Resistance and Stability of Catalyst

As revealed from the above results, the increase in silica content in the catalyst improved its physical attrition resistance and FTS stability. By proposing that the attrition resistance and stability are mainly attributed to the silica content in the catalyst, the content of silanol groups that interact with Fe increases with silica content, and so does the Fe–Si interaction. A catalyst with high attrition resistance and stability can be obtained by increasing the silanol content within the silica source without changing the silica content in the catalyst. A series of experiments were launched from the preparation of model catalysts with the traditional formula 100Fe2O3: 4.4CuO: 3.5K2O: 17.5SiO2, using five types of silica source with different silanol contents. The silanol content of different silica sources was calculated by 29Si NMR tests (Figure 3 and Table 5). The physical attrition index was tested by the standard method, and the FTS performance of the catalysts was investigated.
The five peaks from left to right of each spectral line in Figure 3 represent the peaks of Si with four hydroxyl groups, three hydroxyl groups, two hydroxyl groups, a single hydroxyl group, and no hydroxyl groups, denoted as Q4, Q3, Q2, Q1, and Q0, respectively [34]. The content of hydroxyl groups in these silica sources obtained by fitting is shown in Table 5. After the calculation based on analysis data, the molar number of hydroxyl per 100 mol Si in the five kinds of silica sources is 142, 117, 111, 103, and 44, respectively.
Table 6 and Table 7 show the FTS performance and structural parameters of the catalysts prepared with different SiO2 sources. Figure 4 shows the attrition index and deactivation rate of the as-prepared catalysts. It was noted that the attrition index decreased as the content of silanol groups used in the preparation was increased, indicating that an increment in the content of silanol groups was beneficial to enhance attrition resistance. In comparison with the SFT-3 prepared from KSi-5 with the least silanol groups, the deactivation rate of the catalyst prepared from KSi-1 to KSi-4 remained stable at a lower attrition index. It was found to contradict the above results shown in Figure 1, indicating that there was no significant correlation between attrition index and reaction stability once the attrition index was lower than a certain value, although enhancement of attrition resistance is expected to improve the reaction stability (Figure 1).
The textural properties of the catalysts shown in Table 6 reveal that the difference in silanol content causes less change in the catalyst texture. The XRD spectra of these five catalysts prepared from five different silica sources are shown in Figure 5. It can be seen that the peaks of these spectra are relatively diffuse, indicating fine crystal grains of the samples. The characterization by means of TEM for Cat-1 and SFT-3 catalysts prepared from KSi-1 and KSi-5 is shown in Figure 6. It can be seen that the catalyst prepared with KSi-1 has smaller grain size and uniform distribution, while the catalyst prepared with KSi-5 shows larger mean grain size and wider distribution. According to the Oswald ripening rule, better uniformity of catalyst grains is conducive to inhibiting metal particle sintering and improving the stability of catalysts [35].
The results indicated that a silica source with more silanol groups was helpful to forming more Fe-O-Si bonds and building a stronger skeleton, hence improving the attrition resistance of the catalyst. The enhancement of the Fe–Si interaction promotes the uniform distribution of iron oxide particles in the silica matrix and the good dispersion of Fe grains, further improving the stability of the catalyst [33].
Cat-1 possessed high attrition resistance and FTS stability, and its performance was further tested under FTS conditions in a high-speed stirred CSTR. The results (Table 8 and Figure 7) show that the catalyst still maintained perfect morphology after 200 h of testing, and the content of fine powder caused by catalyst attrition in liquid phase was significantly reduced from 627 ppm to 22 ppm in comparison with SFT-3 (see Table 4).
Figure 8 shows the FTS reaction performance with reaction time for the five prepared catalysts. The trends indicate that there was a gradual deactivation for around 500–600 h reaction time. CO conversion decreased to lower than 60%, while CO2 and CH4 selectivities increased to above 20% and 3.5%, respectively.

2.3. Anti-Carbon Deposition Formula Design

Raman spectroscopy was performed on the catalyst Cat-1 after running in a slurry bed for 200 h and 500 h, as shown in Figure 9. The scattering peaks of 1360 cm−1 and 1580 cm−1 in the figure indicate a certain amount of carbon deposition on the catalyst. It is believed that carbon deposition tends to cover the active sites on the catalyst surface, resulting in a deactivation of the catalyst; meanwhile, the growth of carbon deposition weakens the interaction of catalyst grains. For exothermic reactions such as FTS, due to the poor thermal conductivity of deposited carbon, the thermal inhomogeneity of the catalyst particles increases and results in thermal stress and poor stability of the catalyst. Generally, it is believed that carbon deposition on Fischer–Tropsch synthesis catalysts is formed through CO Boudouard reaction. The existence of K will intensify the trend of carbon deposition; this is because the potassium will provide electrons to iron, which will make the iron more conducive to the chemical adsorption of CO and weak H2 dissociation adsorption on catalyst surface; CO is easier to dissociate and adsorb, which makes carbon deposition easier to form [30,31,32].
To relieve the carbon deposition on the catalyst, there is a method of adding electronegativity-strong, non-metallic elements that effectively adjust the electron density of active phases. On the other hand, the said interaction between non-metallic oxides and SiO2 in the catalyst can be adjusted to indirectly affect the electron-donating capacity of K. It is recognized as a novel way to improve the anti-carbon deposition capability of the catalyst.
An XPS test was carried out on the prepared catalysts. Figure 10a shows that the binding energy of B 1s in Cat-1B is around 191.8 eV, which belongs to the peak of B3+ in B2O3 [36]. Figure 10b compares the binding energies of Cat-1 and catalyst Cat-1B in Si 2p, in which the peak of 103.5 eV corresponds to the binding energy of Si in Si-O-Si, and 101.9 eV is the binding energy of Si affected by Fe3+ ions. It can be seen that the proportion of peak at 101.9 eV decreases obviously after adding B, indicating that B2O3 combines with SiO2, and the electron-absorbing ability of B increases the binding energy of SiO2, while the overall Si 2p peak position also shifts towards the direction of high binding energy after adding B [37,38]. The peak at 711.2 eV corresponds to the Fe3+ binding energy of Fe 2p3/2, and the peak at 724.4 eV corresponds to the Fe3+ binding energy of Fe 2p1/2. The two peaks of Fe 2p in Cat-1B are shifted towards higher binding energy than those in Cat-1. This indicates that there is a certain interaction between B2O3 and Fe, and the electron absorption of B leads to the stronger binding energy of Fe3+ in the 2p orbital [36]. In Figure 10c, the peaks of 293.1 eV and 295.9 eV correspond to the peak positions of K 2p3/2 and K 2p1/2, respectively. The K 2p peak of Cat-1B showed in Figure 10d shifts to the direction of high binding energy relative to that of Cat-1, indicating that B2O3 has an electron-absorbing effect on K [39].
An in situ XRD test was carried out to investigate the crystal-phase changes in the catalysts at 265 °C and syngas as reducing atmosphere with H2/CO = 20/1, collecting data per hour for 9 h. It can be seen from Figure 11 that reduction/carbonization bands appeared in the range of 2θ 39–47° for the two catalysts during the initial 1 h of reduction, while the majority of the sample is still iron oxide hydrate. After 3 h of reduction, obvious iron carbide crystal forms appeared. Comparing with the standard card (PDF 89-2544), it was revealed that the generated iron carbide is mainly Fe5C2. By calculating the crystal face peak at 40.8° (−112), the grain size at different reduction periods was obtained, as shown in Table 9. It can be seen that the grain size of Fe5C2 in Cat-1 is larger than Cat-1B from the 4 h. After 5 h, the grain size of the catalyst basically varied less until the reduction after 9 h. The grain sizes of Cat-1 and Cat-1B are 21.7 nm and 15.5 nm, respectively, indicating that a complete reduction/carbonization was obtained within 5 h under the above conditions. The grain size variation of the experimental catalysts during the reduction process (Table 9) indicated there is an interaction between promoter B and Fe, which is in accordance with the former results based on XPS analysis. Thus, it is expected to form smaller iron carbide grains.
For the sake of further verification, an H2-TPR test was carried out on Cat-1 and Cat-1B and is illustrated in Figure 12. The characteristic peaks of CuO reduced to Cu and iron oxide hydrate reduced to Fe3O4 that usually occur at 290 °C partially overlap with the temperature corresponding to Fe3O4→FeO reduction peak, which formed the peak pattern with the characteristics of forward extension. The obvious reduction peak in the range of 320–450 °C corresponds to the Fe3O4→FeO reduction process. It was found that the reduction peak can be divided into two parts at higher temperatures above 450 °C. The reduction peak at 450–750 °C is attributed to FeO→α-Fe, while the reduction of Fe3+/Fe2+ oxide interacting with SiO2 occurs at 750 °C. The whole H2 reduction process of the catalyst is consistent with previously reported studies [19,40]. For a comparison between Cat-1 and Cat-1B, the reduction temperature of the catalyst after B addition shifted to a higher temperature. It was demonstrated that Fe interacts with B, which has been shown in XPS and in situ XRD previously.
Temperature-programmed hydrogenation (TPH) was carried out over used Cat-1 and Cat-1B catalysts in order to compare the anti-carbon deposition performance. The fitted TPH curves are shown in Figure 13. The peak at 270–390 °C is the α-carbon release peak. The peak at 420–455 °C is the hydrogenation peak of β carbon. These two carbon species can be considered as reactive carbon species on the catalyst surface. The peak at 480–688 °C is γ carbon, which is the hydrogenation peak of carbon in iron carbide. The peak at 600–750 °C is δ carbon, which is the hydrogenation peak of deposited carbon on the surface of the catalyst [41]. The calculated contents of different carbon species are shown in Table 10. It can be seen that Cat-1B has less δ carbon and more active carbon species than Cat-1, which also indicates that Cat-1B has better reaction performance.
The textural properties of the two catalysts are shown in Table 11, and the reaction performance of Cat-1 and Cat-1B in CSTR is shown in Figure 14 and Table 12. From the results in Table 11, the addition of B does not have a significant impact on the attrition resistance of the catalyst, but the specific surface area decreases, the average pore size increases, and the stability of the catalyst is significantly improved, with the deactivation rate reduced to 0.012‰/h. The stability improvement of Cat-1 B comes from the addition of B. XPS data show that the interaction of B and Fe reduces the electron density of Fe active phase. TPH results show that the carbon deposition of the catalyst after the reaction is less than that of the catalyst without B, which indicates that B can improve the anti-carbon deposition ability of the catalyst by regulating the electron density of the active phase of Fe. In situ XRD results show that B is beneficial to stabilize smaller grains of iron carbide. All these effects are beneficial to the improvement of the stability of the catalyst. B reduces the specific surface area and increases the average pore size, which is because the B–SiO2 interaction modifies the properties of SiO2 and then changes the texture characteristics of the catalyst, although B has no significant effect on the attrition resistance of the catalyst.

2.4. Industrial Application of Catalyst with Highly Attrition Resistant and Stability

Based on sample Cat-1B, a number of steps were executed, including formula and preparation process optimization, scaling up, and long-term stability test. The finalized iron-based FTS catalyst (reported as CNFT-1) was successfully manufactured (Figure 15) and evaluated at industrial trial scale. The ton-scale products have a uniform particle size distribution and ideal morphology, while the FTS reaction performance was in accordance with the laboratory catalyst.
Subsequently, the CNFT-1 catalyst was applied in a megaton FTS synthesis plant. The excellent attrition resistance was verified in the industrial unit, illustrated by the lower iron content of the wax product, and much cleaner oil products and wax products (Figure 16). The FTS plant data confirmed that the CNFT-1 catalyst has excellent industrial application performance (see Table 13) with high attrition resistance and activity, low CH4 selectivity, and high wax-to-oil ratio.

3. Materials and Methods

3.1. Materials

H2 (99.9%) and CO (99.9%) were purchased from Beijing AP BAIF gases industry Co., Ltd., and were desulfurized (up to <0.05 μg/g), deoxidized, and dehydrated before use. Fe(NO3)3·9H2O, Cu(NO3)2·3H2O, K2CO3, H3BO3, and Na2CO3 were purchased from Sinopharm Chemical Reagent Co. Ltd. All chemicals were used as received.

3.2. Catalyst Preparation

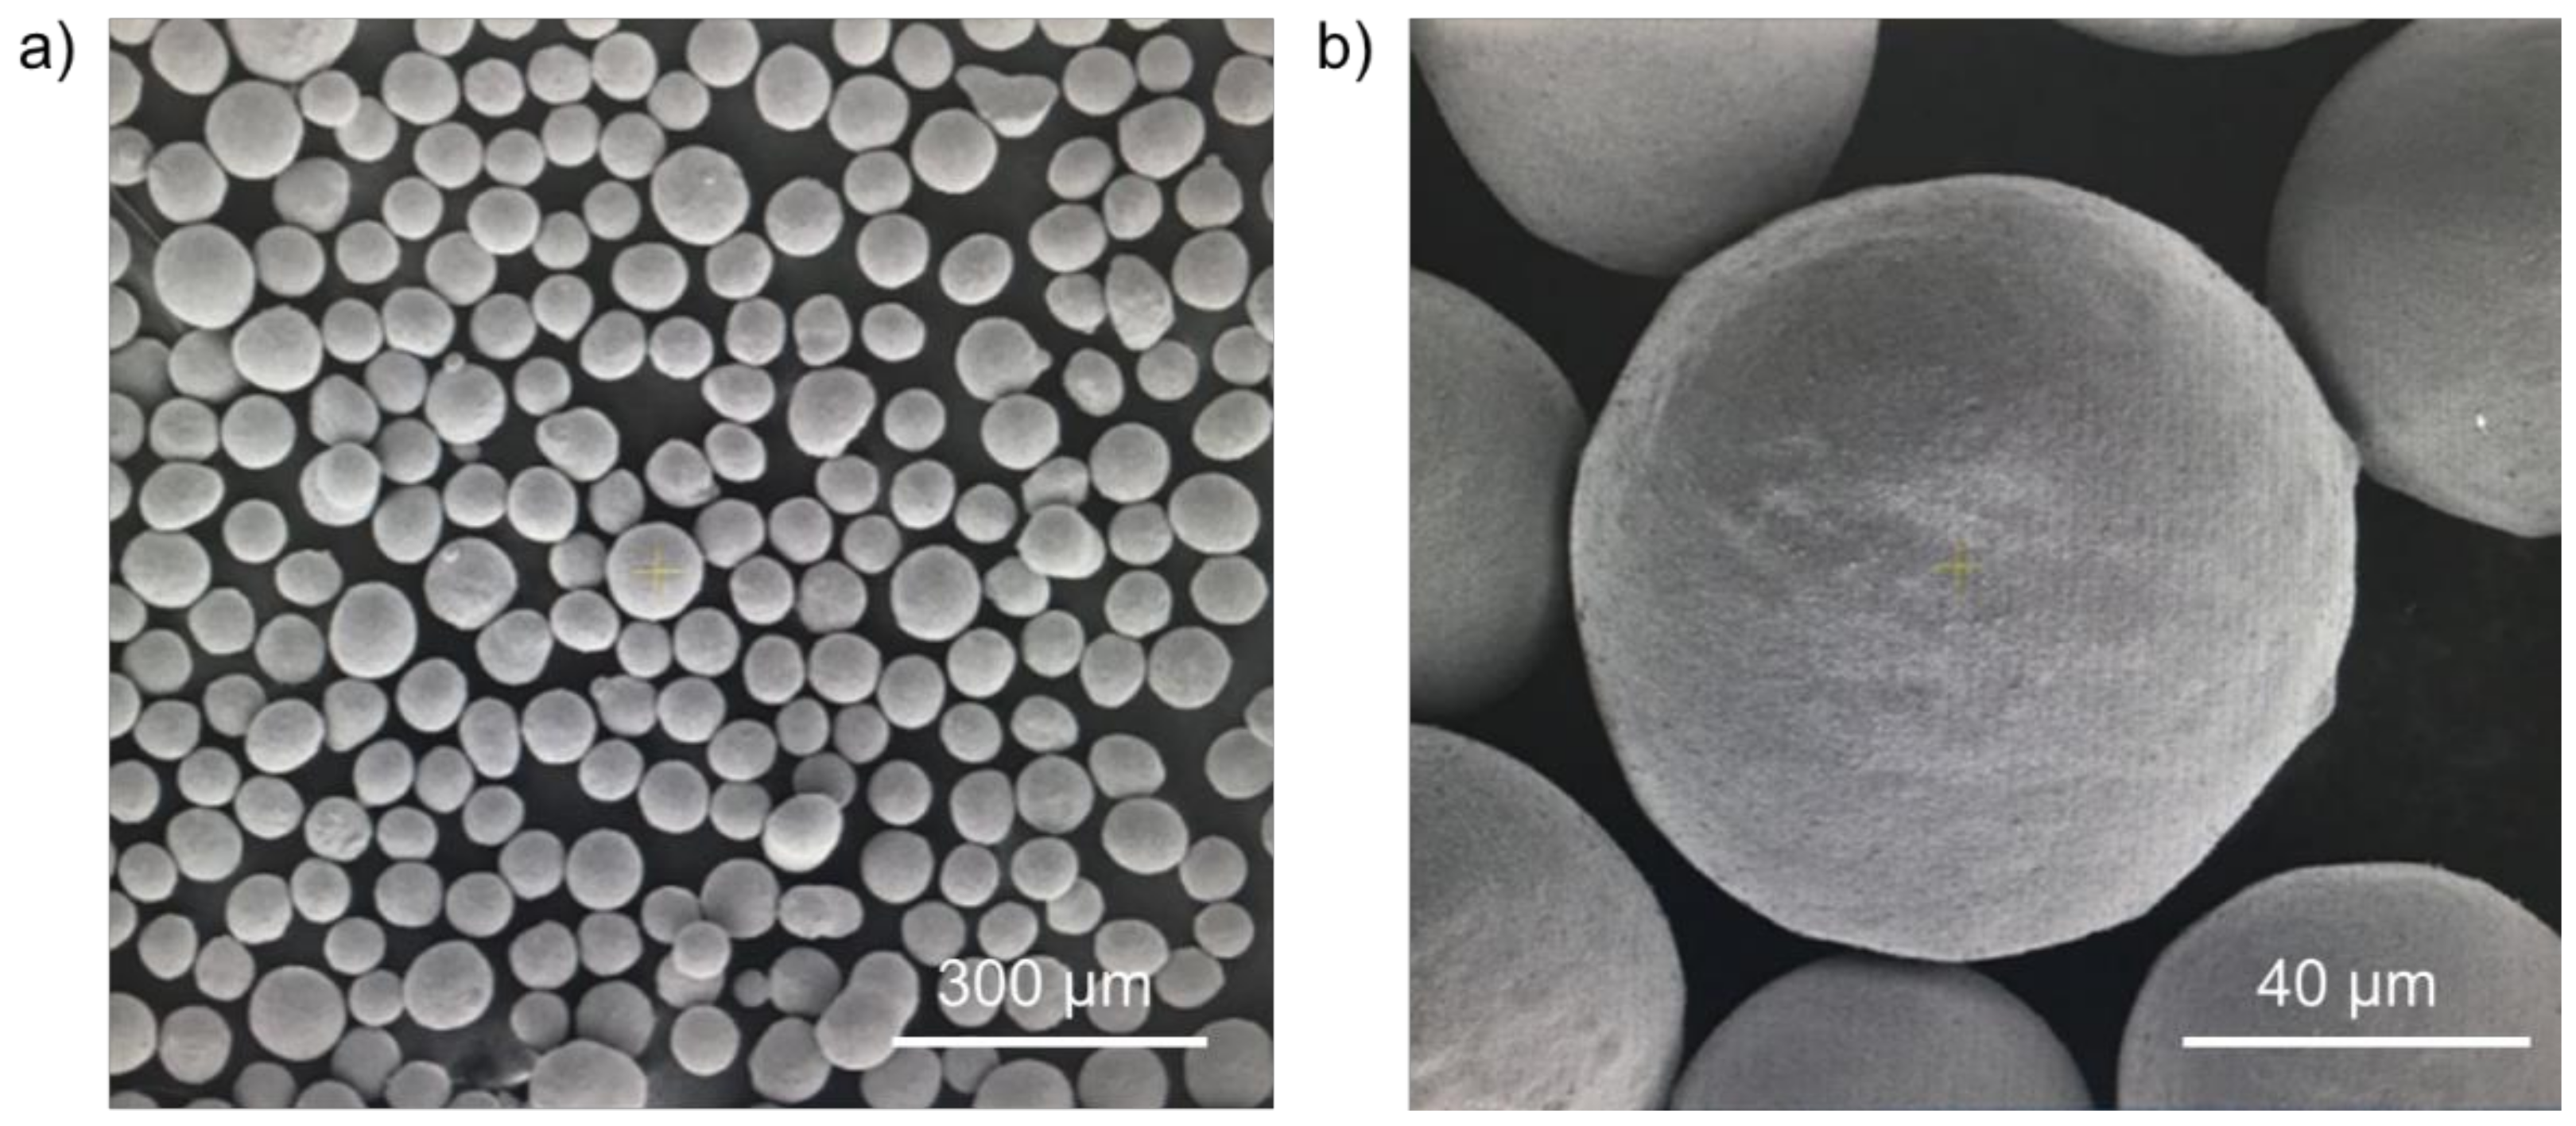
Catalysts were prepared by a patented method (CN101602000). In brief, the solution of Fe(NO3)3·9H2O and Cu(NO3)2·3H2O at appropriate Fe/Cu ratio was co-precipitated with sodium carbonate solution at pH = 7 and T = 70 °C. The precipitation was centrifuged and fully washed. After the cake was slurried, an appropriate amount of K2SiO3 was added into the slurry and the pH value was adjusted. After centrifugation, the cake was re-slurried with desired K2CO3 and de-ionized water, and the mixture was spray-dried at 200 °C. Finally, the catalyst was dried at 100 °C overnight and calcinated at 500 °C for 6 h.
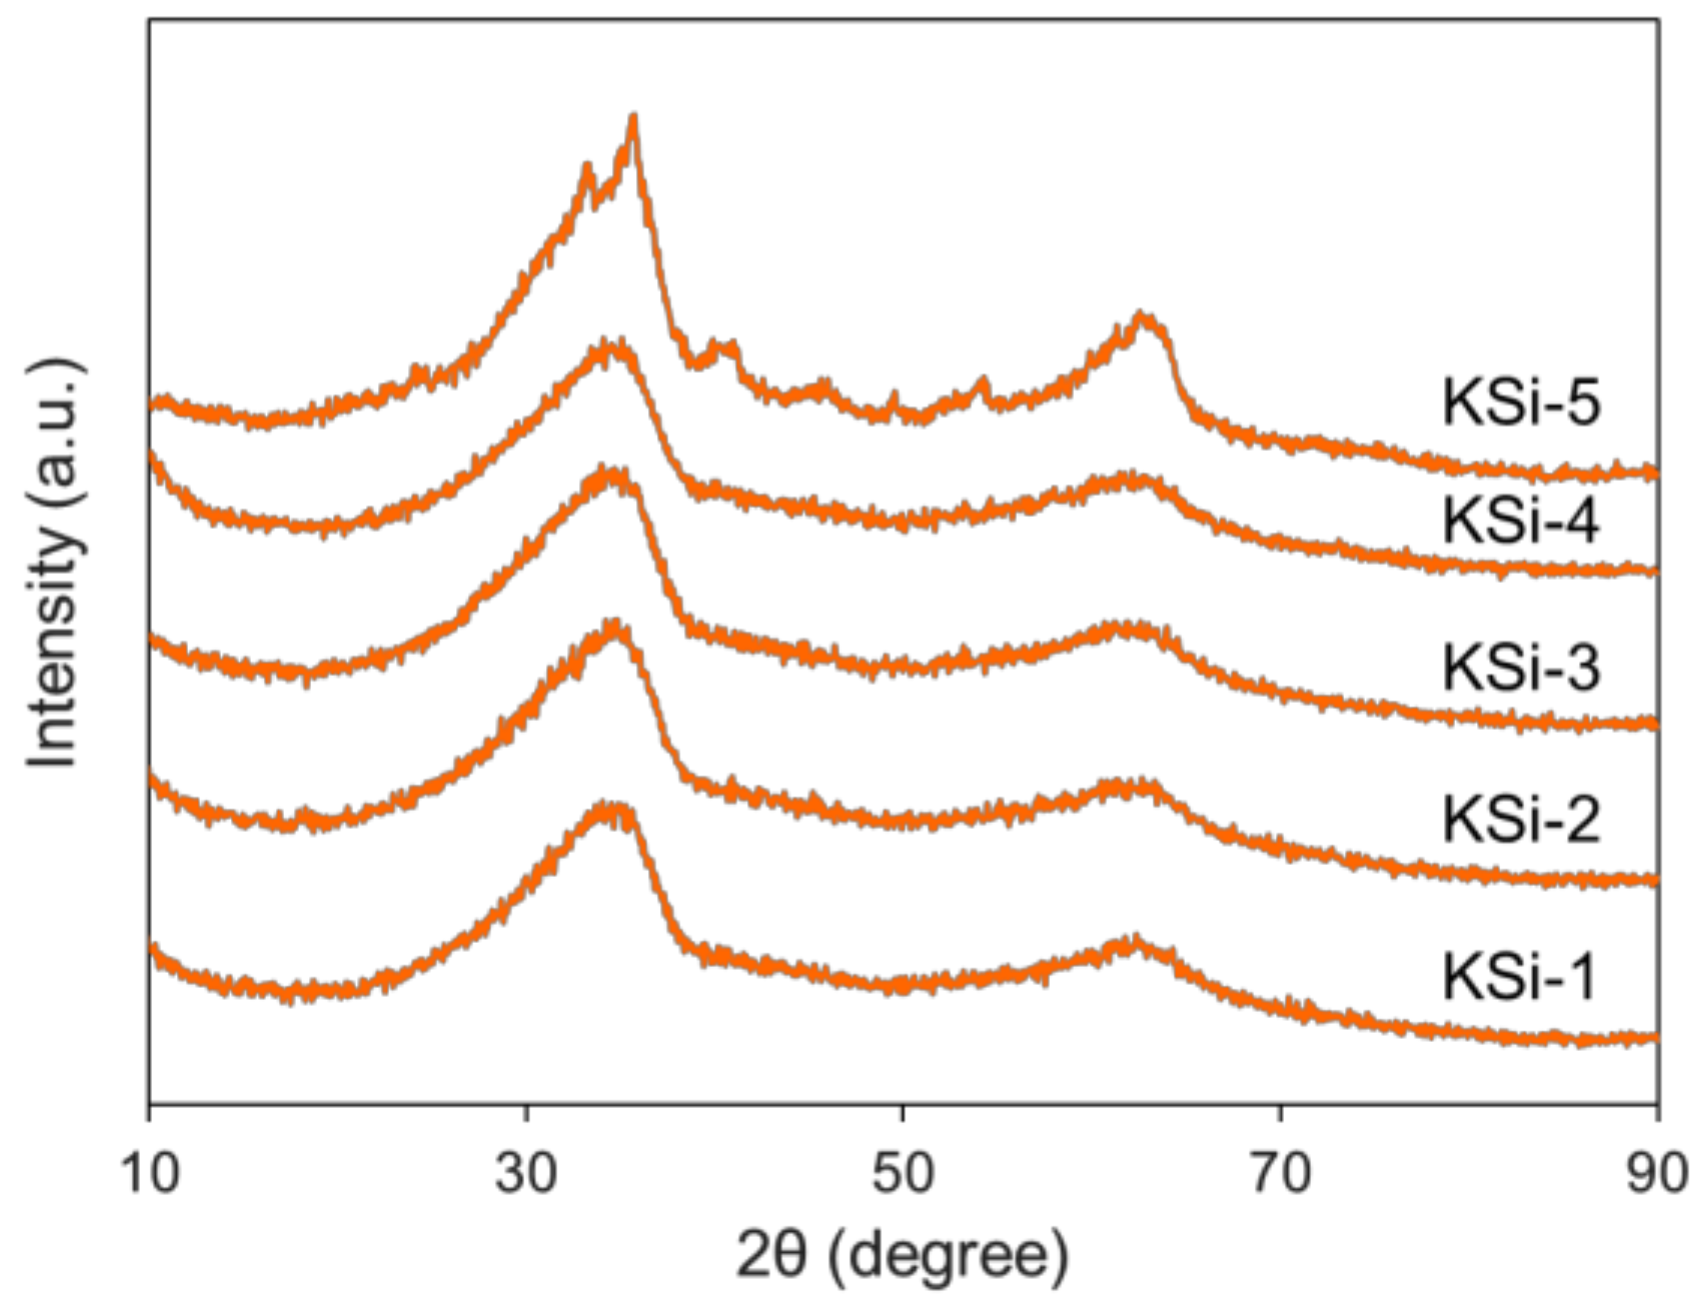
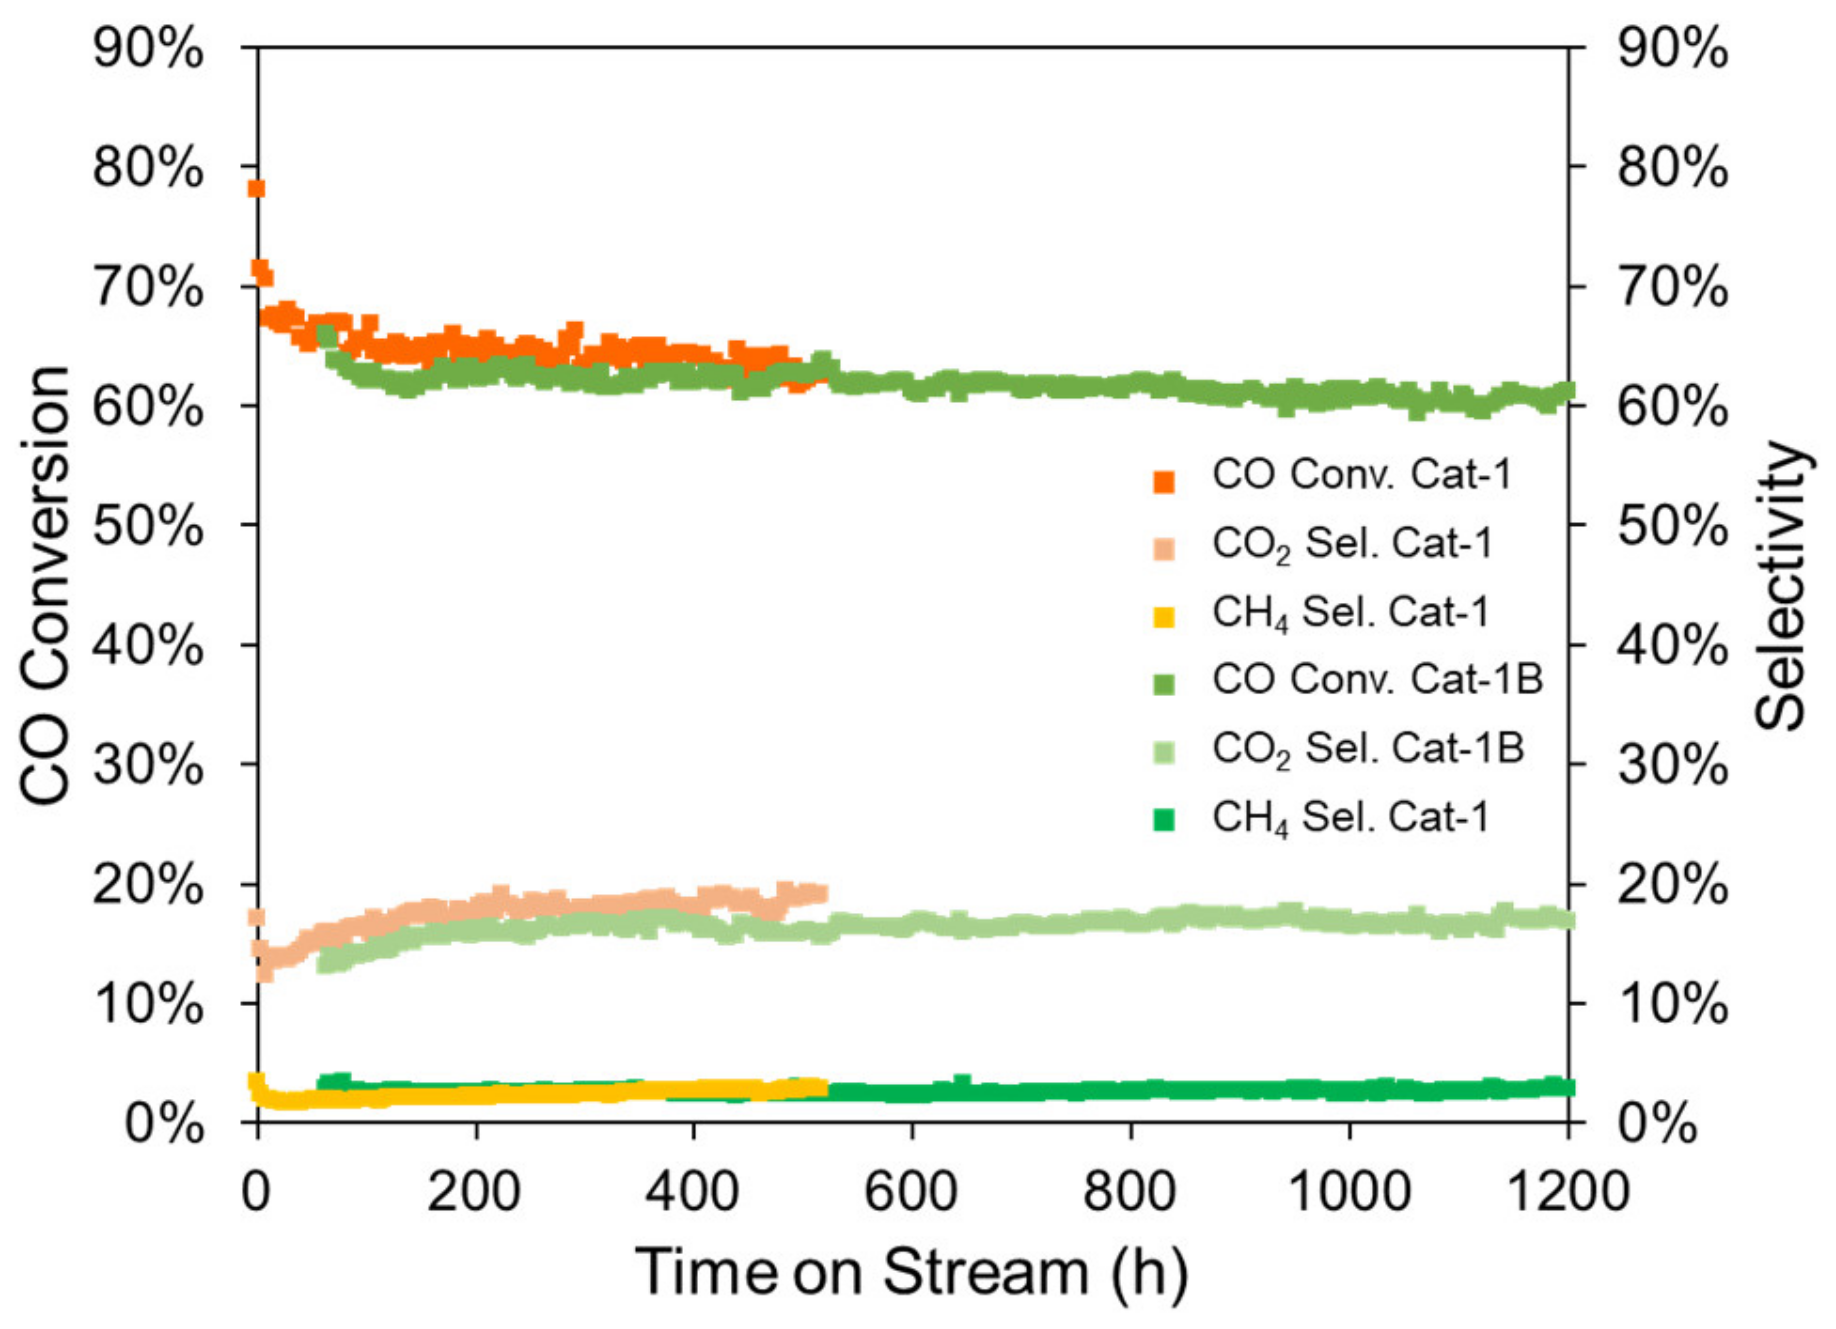
The catalysts prepared with potassium silicate (KSi-5) were named SFT-1/2/3/4, corresponding to SiO2/Fe2O3 mass ratios of 12.5/100, 15/100, 17.5/100, and 20/100. The ratio of Fe2O3/CuO/K2O in catalysts is in accordance with the mass ratio of 100:4.4:3.5:17.5. The catalysts prepared with different amounts of potassium silicate (KSi-1/2/3/4/5) were successively named as Cat-1/2/3/4/5. The ratio of Fe2O3/CuO/K2O/Si2O in catalysts is in accordance with the mass ratio of 100:4.4:3.5:17.5. Preparation and formulation of Cat-1B were the same as for Cat-1, except that H3BO3 was added during the re-slurrying process at a B2O3/Fe2O3 ratio of 4.8/100.

3.3. Catalyst Characterization

3.3.1. Nitrogen Adsorption/Desorption

BET surface area, pore volume, and average pore diameter measurements were determined by nitrogen isothermal physisorption at liquid nitrogen temperature using a Micromeritics ASAP 3020. Before the adsorption measurements, samples were degassed under vacuum at 90 °C for 1 h and 350 °C for 3 h.

3.3.2. Nuclear Magnetic Resonance (NMR)

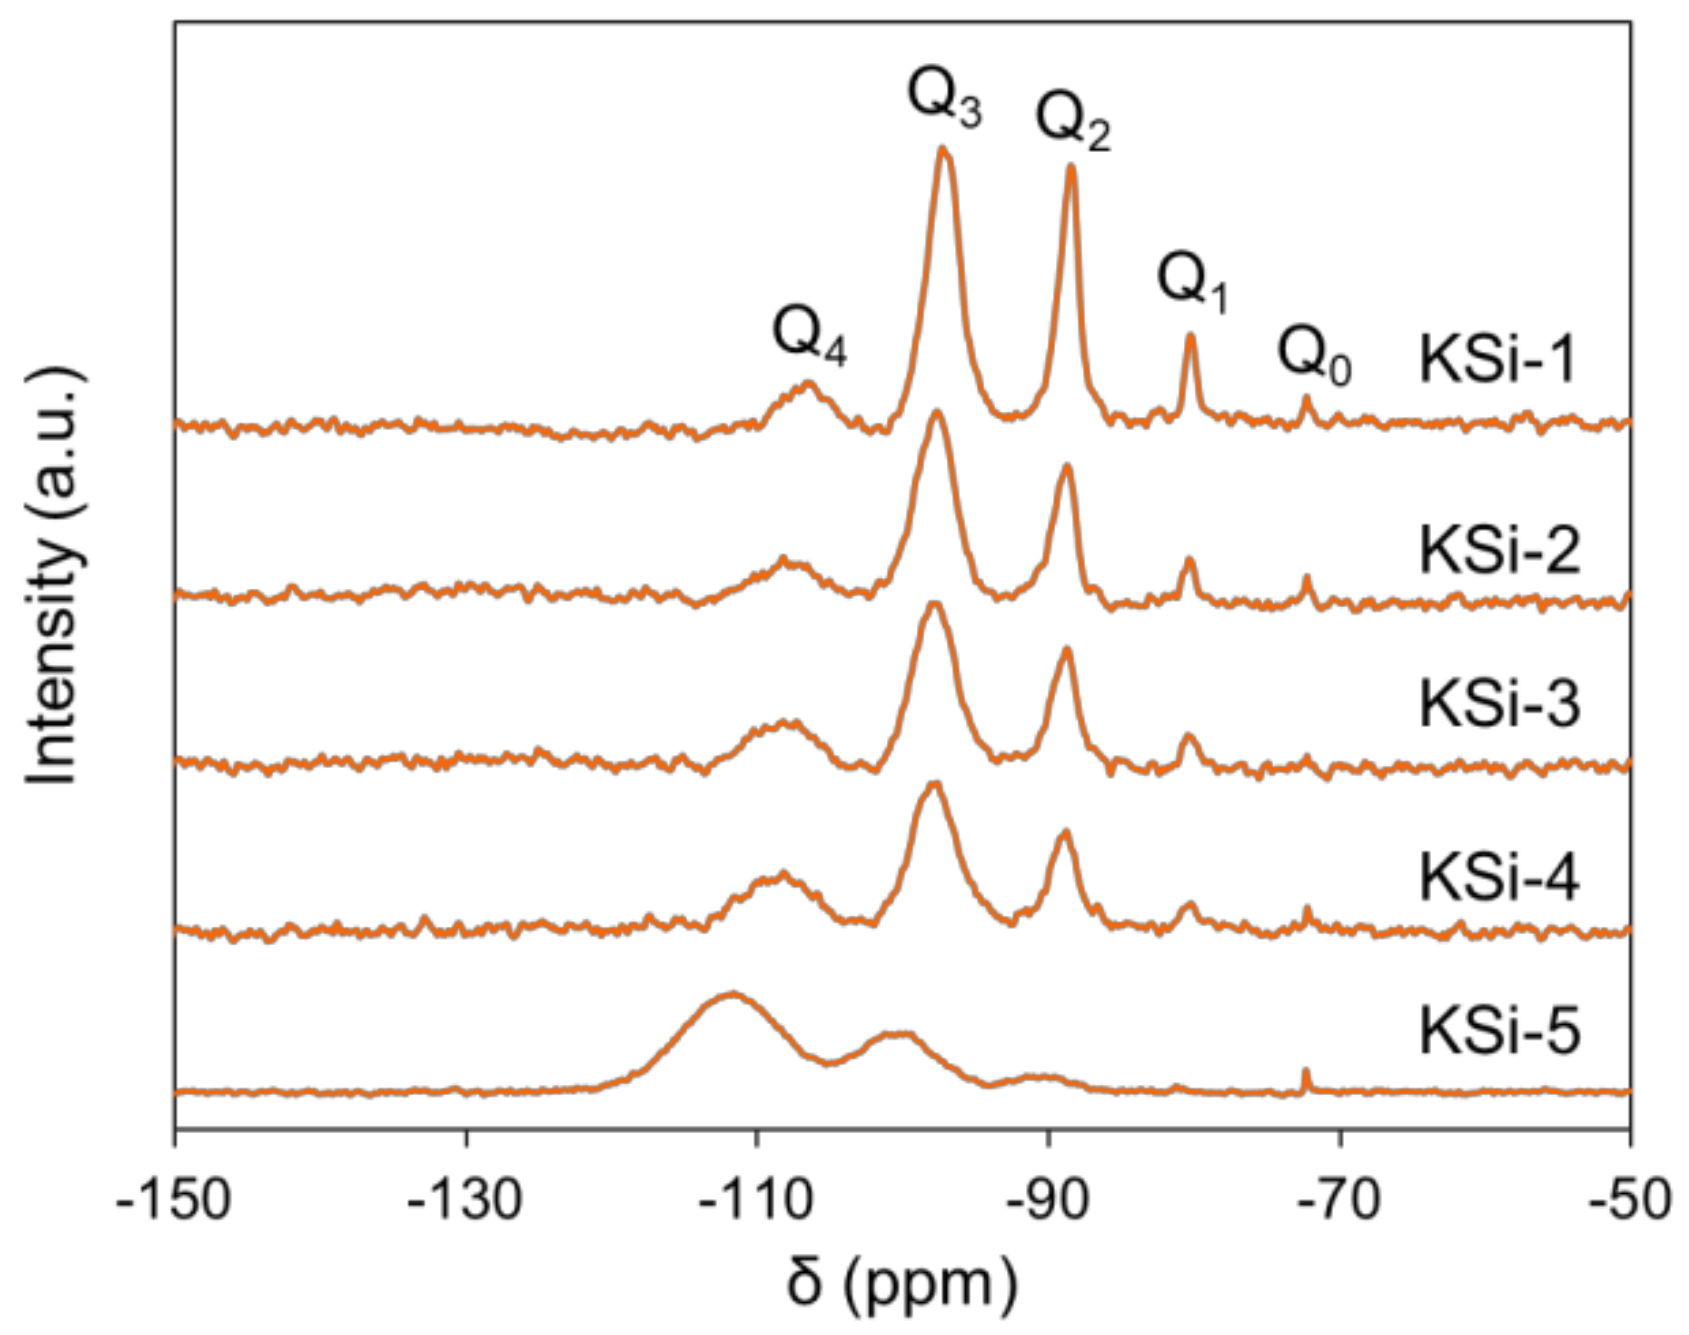
29Si NMR of liquid K2SiO3 samples placed in 10 mm PTFE tubes was conducted with an Si-free probe on an Advance III 400 MHz spectrometer (Bruker, Karlsruhe, Germany).

3.3.3. X-ray Diffraction

Powder X-ray diffraction (XRD) was carried out on a Bruker D8 ADVANCE X-ray diffractometer (Bruker, Karlsruhe, Germany) with Cu Kα radiation source (λ = 0.154 nm, operating at 40 kV, 40 mA). The scan range was 10–80°.
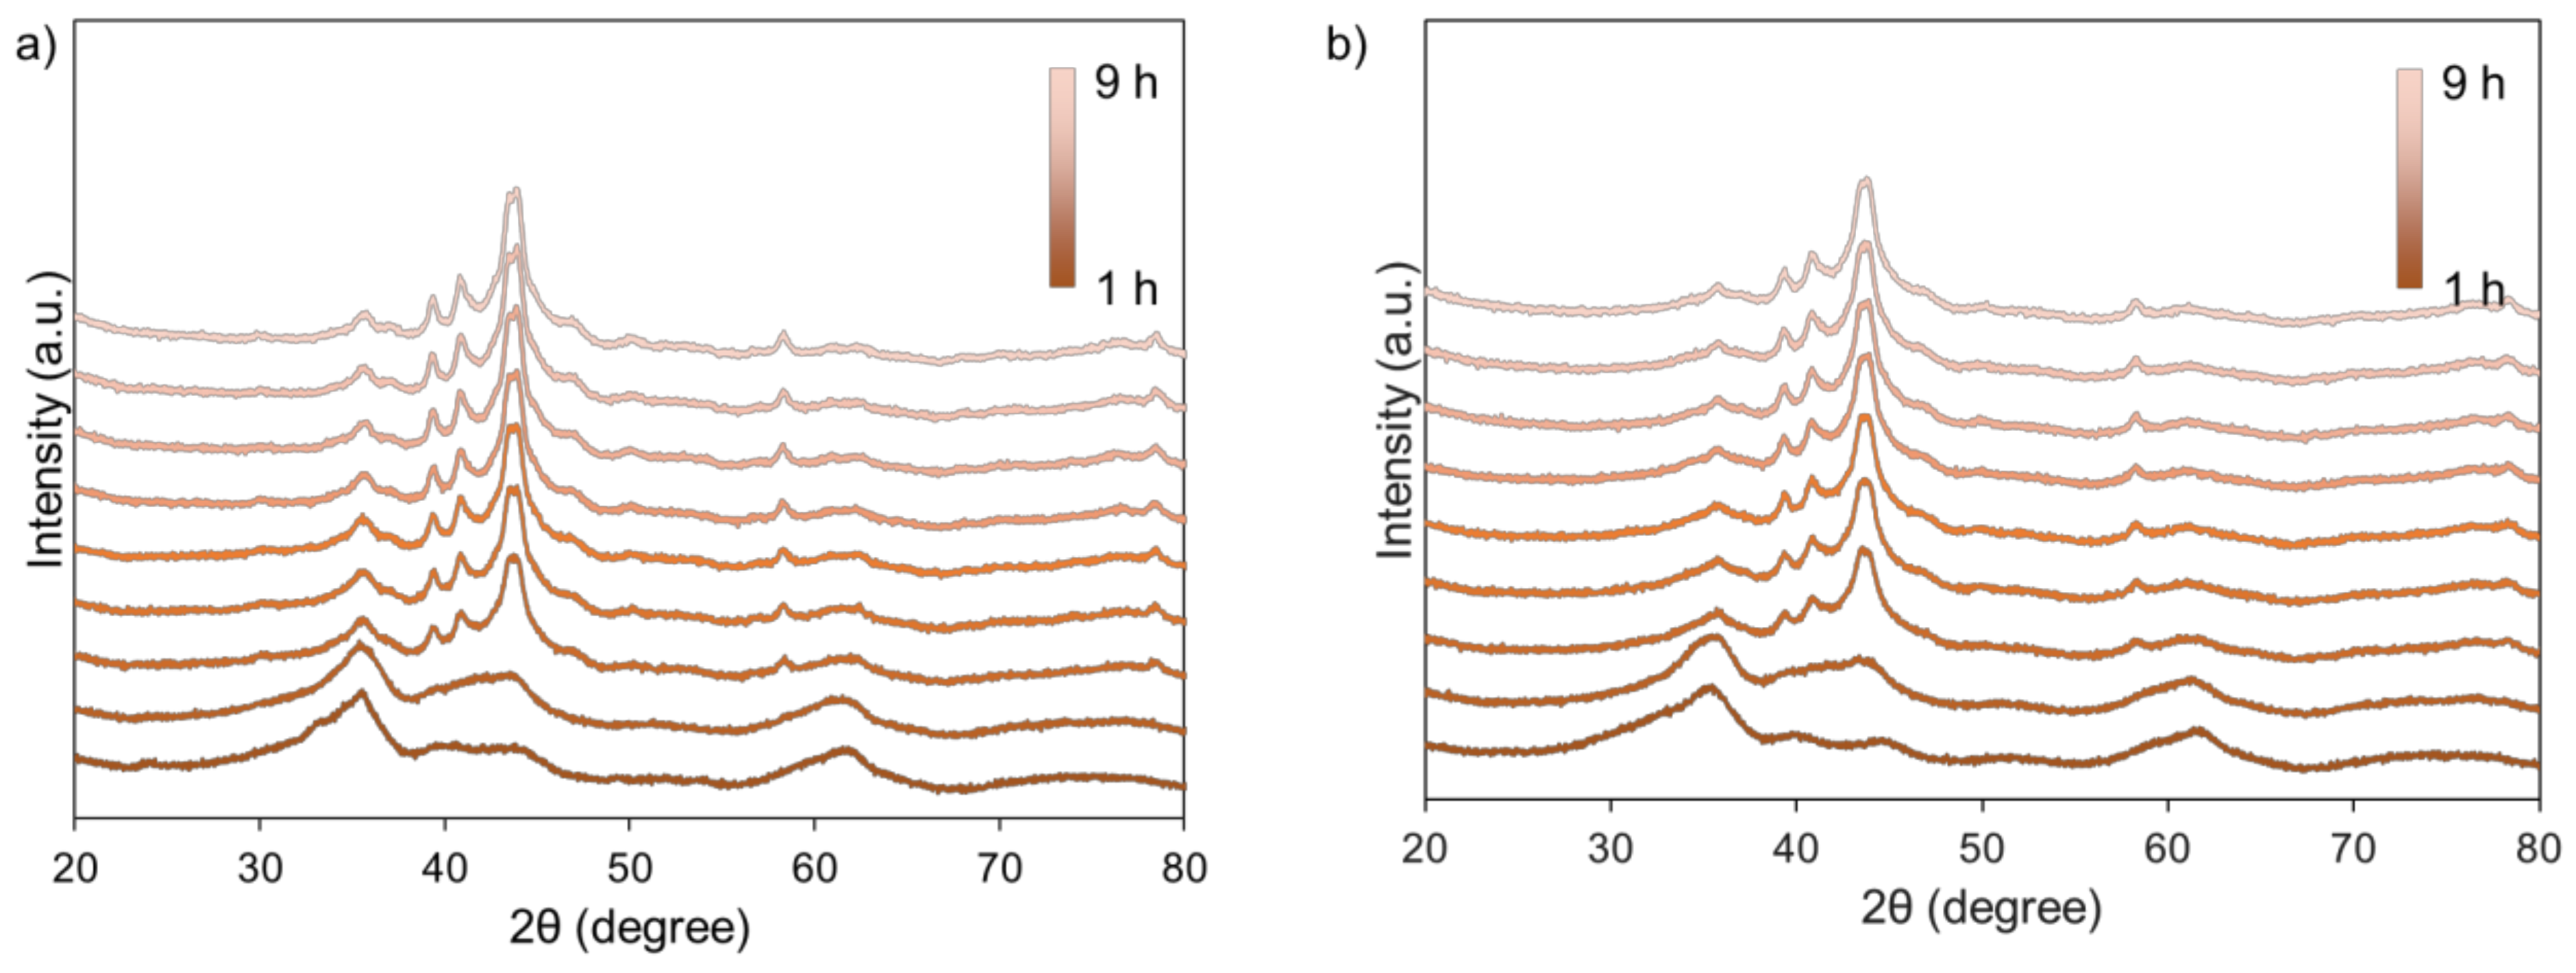
In situ XRD was carried out on a Rigaku D/max-2600/PC apparatus (Rigaku, Tokyo, Japan) equipped with a D/teX ultra-high-speed detector and scintillation counter. The X-ray generator consisted of a Cu rotating anode target with a maximum power of 9 kW. All the tests were operated at 40 mA and 40 kV. In situ XRD patterns were recorded in an Anton Paar XRK-900 cell equipped with a H2/CO = 20 gas system.

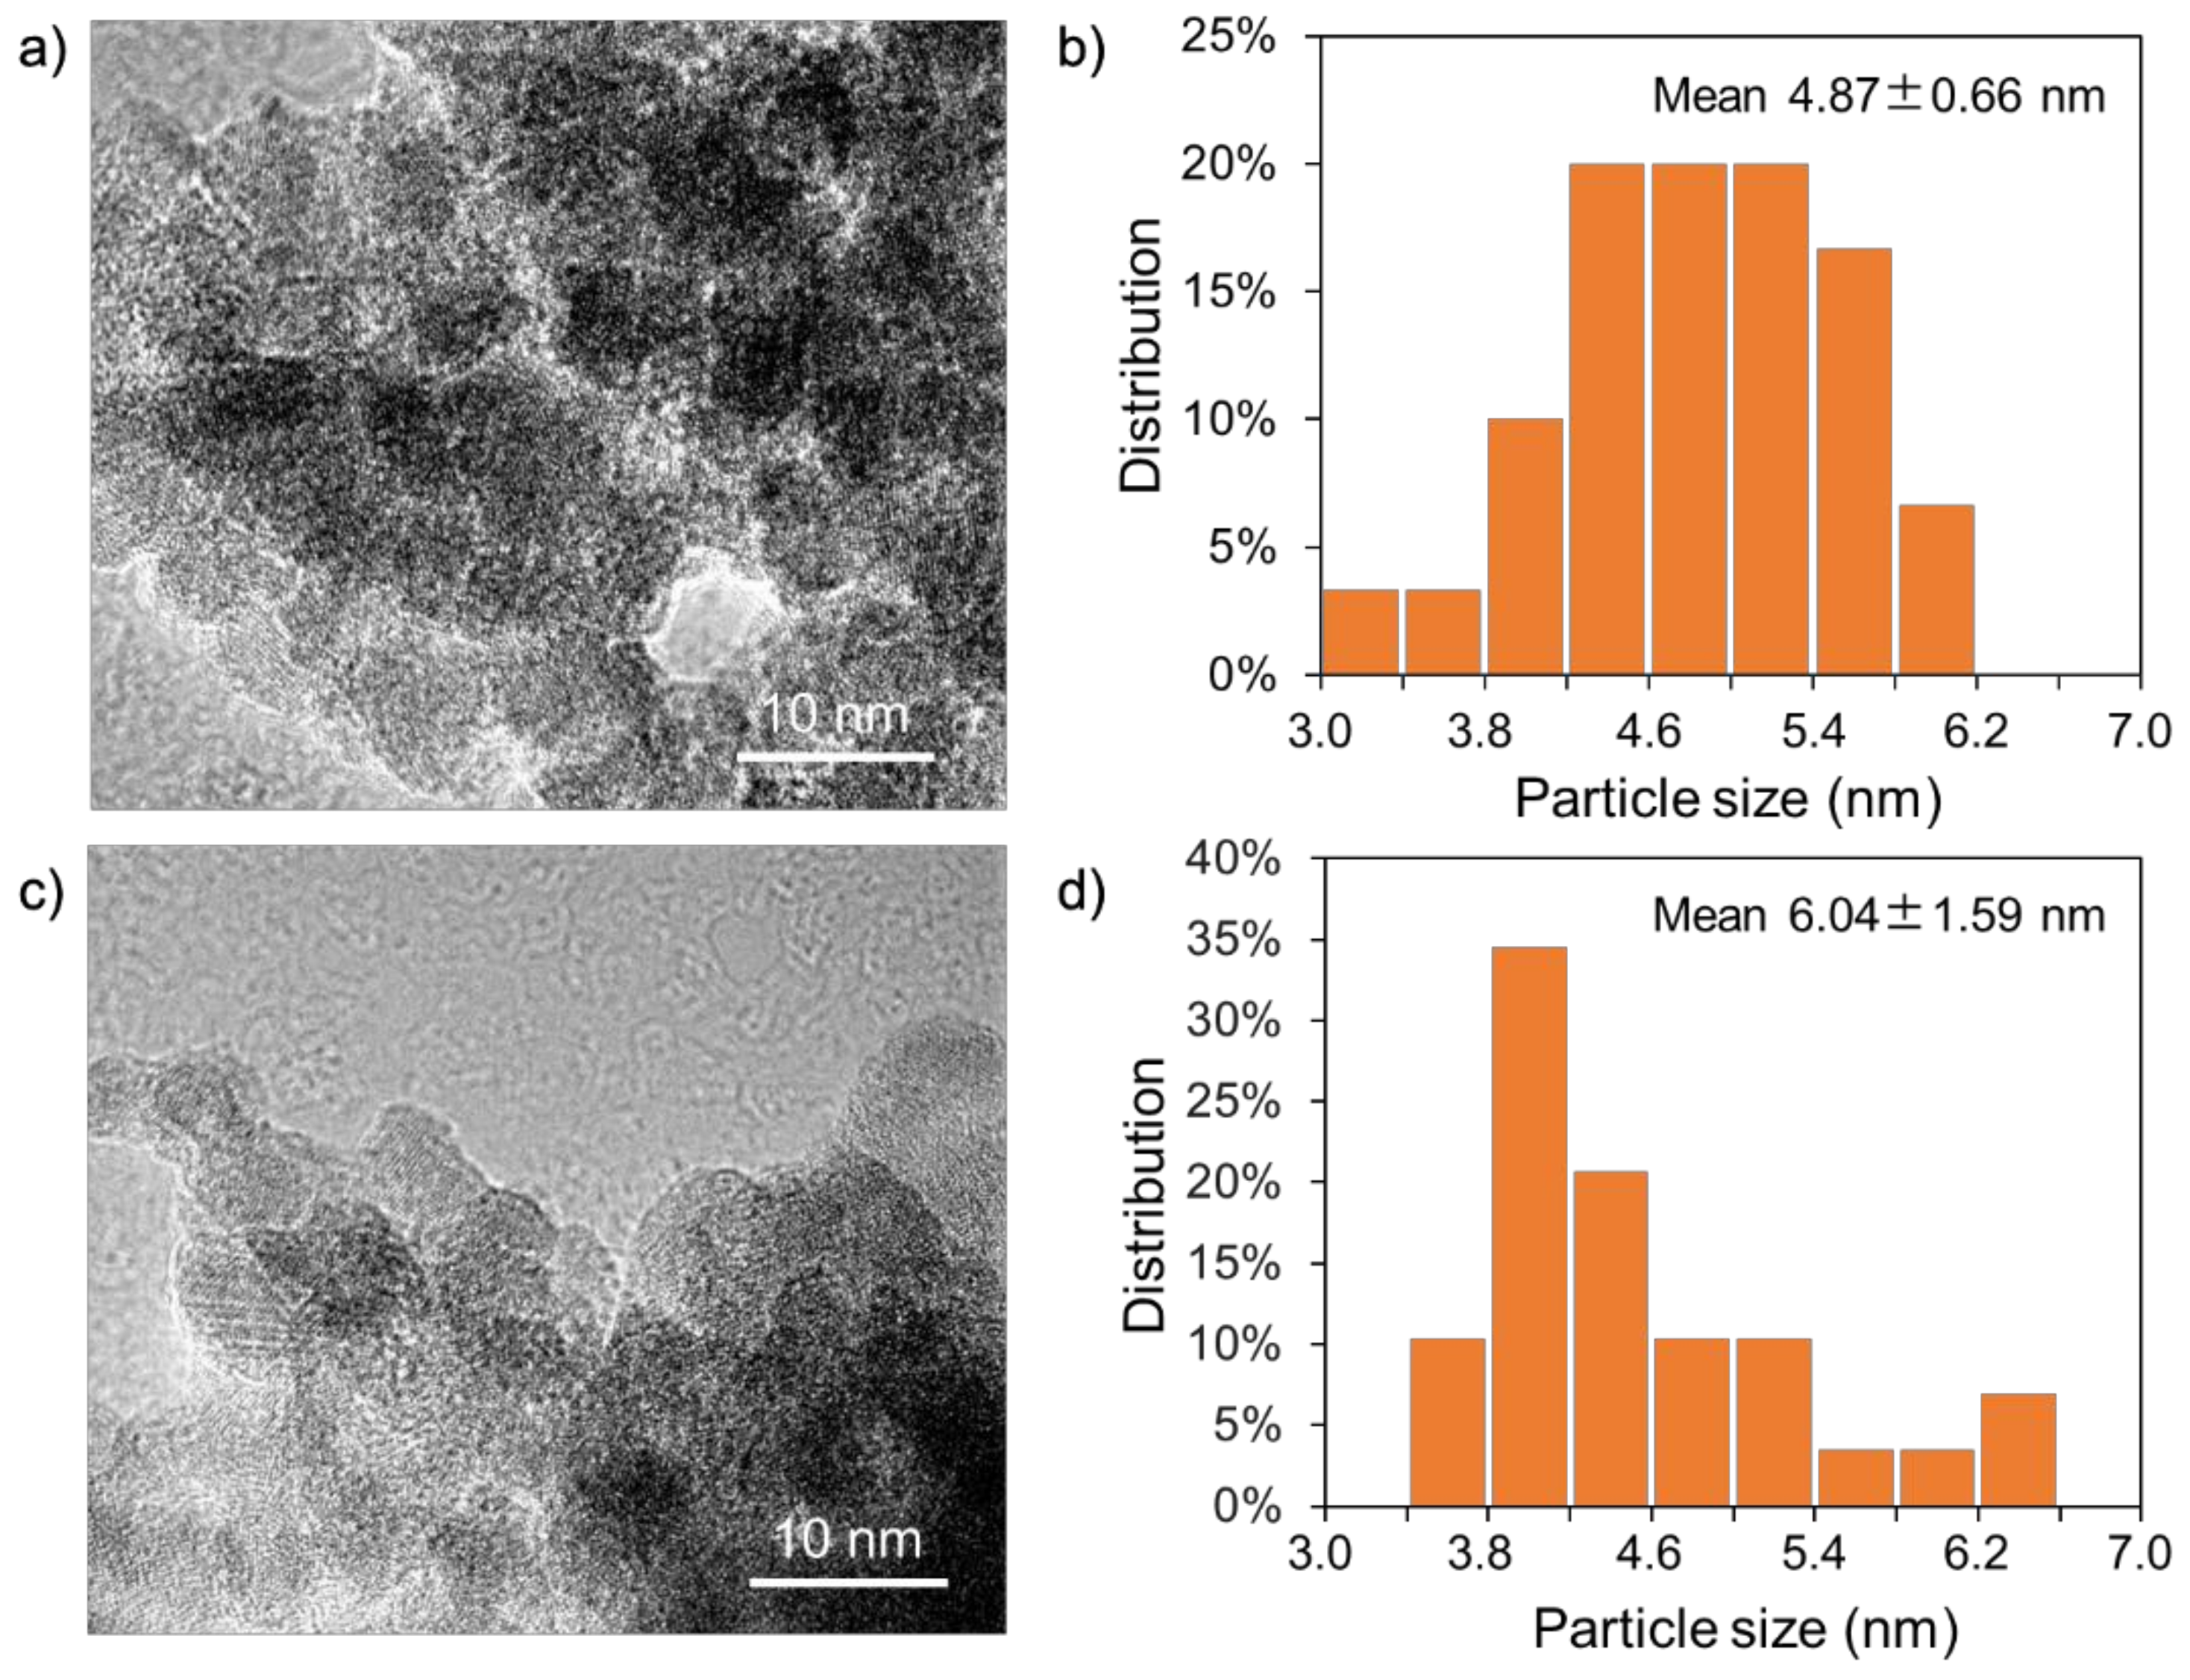
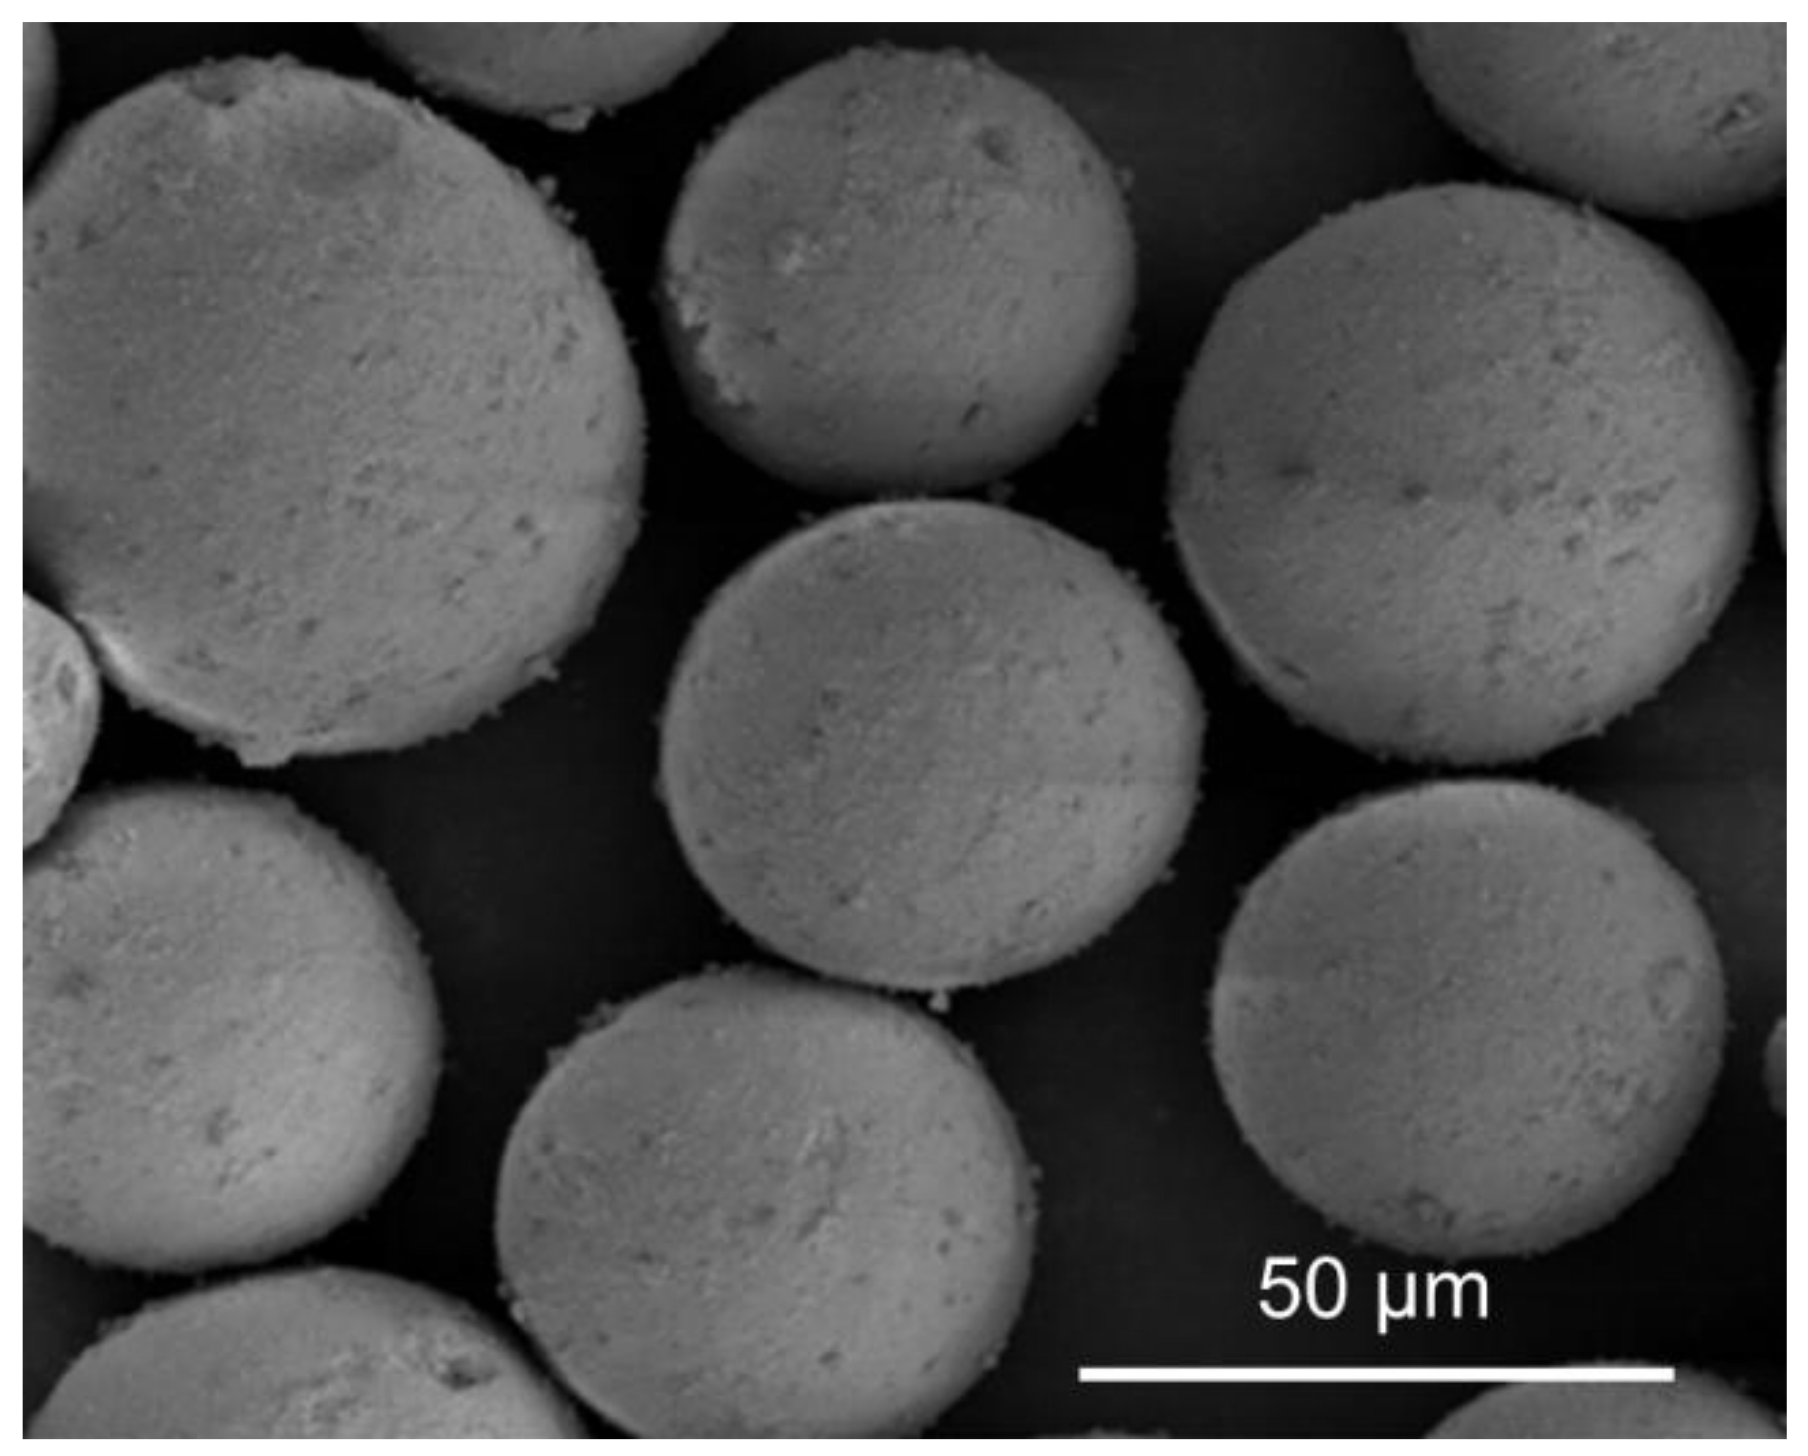
3.3.4. Scanning and Transmission Electron Microscopy

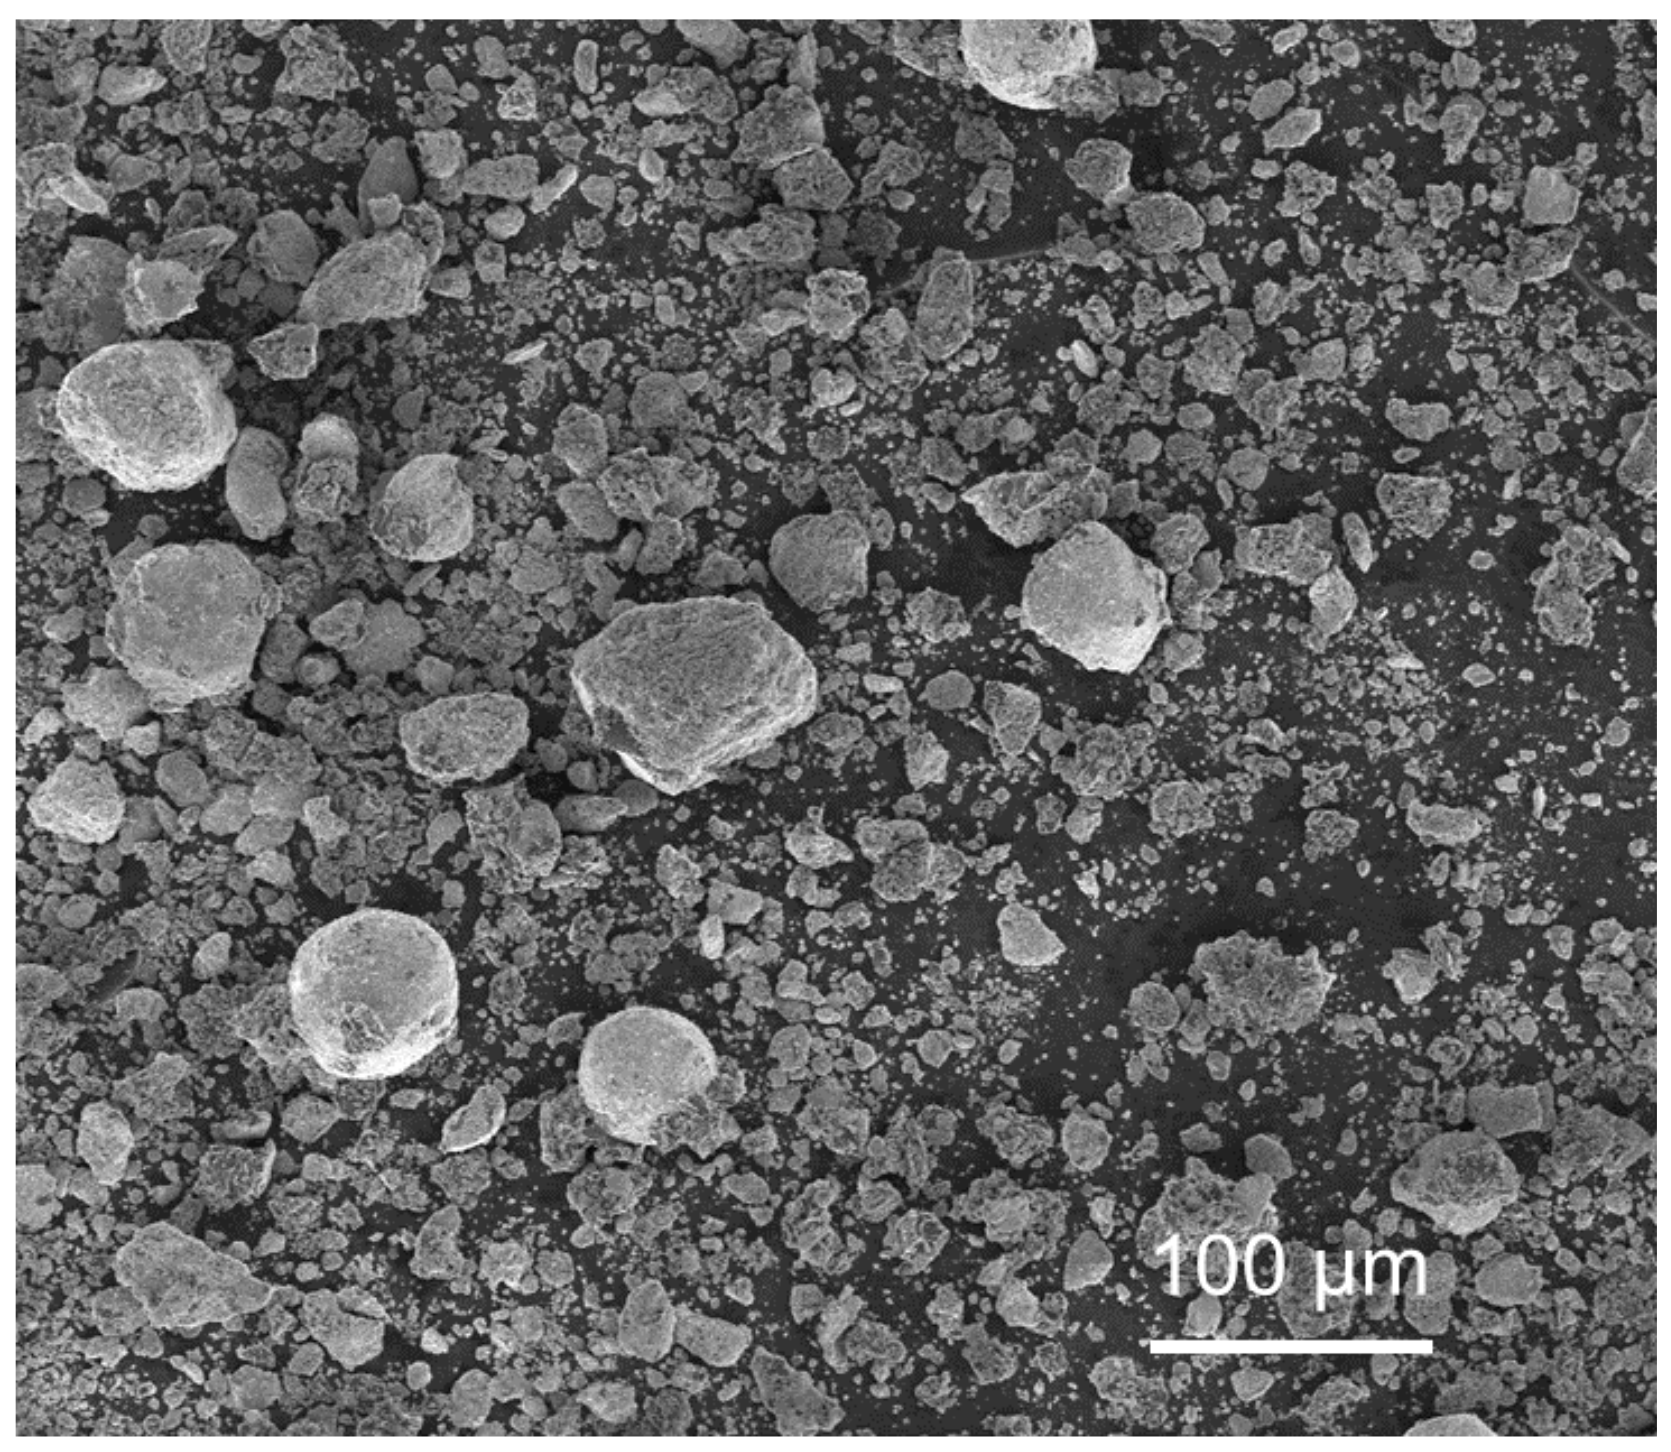
The scanning electron microscopy (SEM) images were collected on a Nova NanoSEM 450 scanning electron microscope (FEI, Hillsboro, OR, USA). The transmission electron microscopy (TEM) images were collected on an ARM200F electron microscope (JEOL, Tokyo, Japan) operated at 200 kV.

3.3.5. X-ray Photoelectron Spectroscopy (XPS)

XPS measurements were recorded using a Thermo Escalab 250Xi (Thermo Scientific, Waltham, MA, USA) system at base pressure of 1 × 10⁻⁹ mbar. Samples were excited with monochromatized Al Kα radiation (hν = 1486.6 eV). The analyzer was operating in a constant pass energy mode (20 eV). The C 1s peak of adventitious carbon (284.8 eV) was used as a reference for estimating the binding energy.

3.3.6. Raman Spectrum

The Raman spectrum was obtained on HR-800 laser confocal spectrometer (Horiba, Kyoto, Japan).

3.3.7. Temperature-Programmed Reduction (TPR)

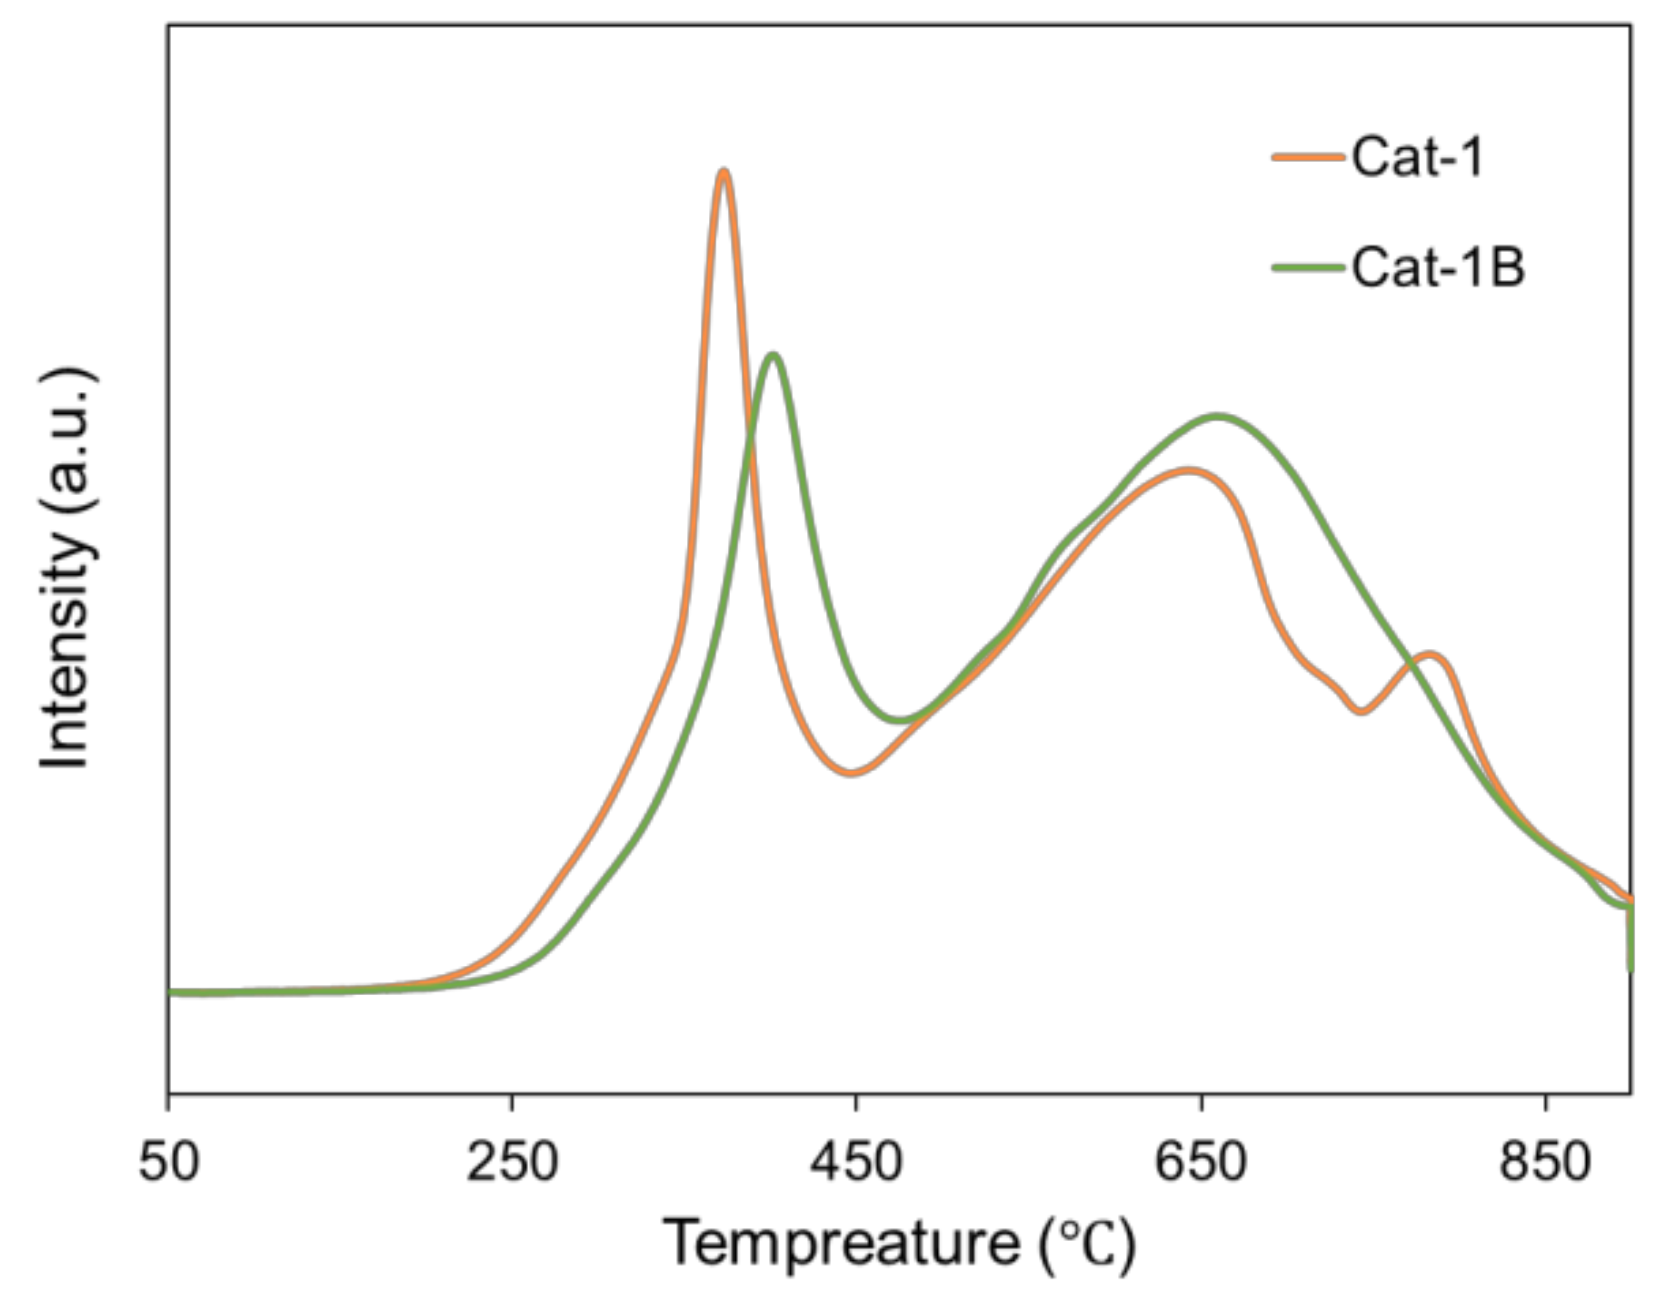
H2-TPR experiments were conducted using a Micromeritics Autochem II 2920 auto adsorption apparatus (Micromeritics, Norcross, GA, USA). First, 100 mg of sample was degassed and reduced in 10 vol% H2/Ar with a flow rate of 50 mL/min. The temperature was ramped linearly from 50 °C to 900 °C at 10 °C/min. The H2 consumption was detected by a thermal conductivity detector (TCD) during the run.

3.3.8. Temperature-Programmed Hydrogenation (TPH)

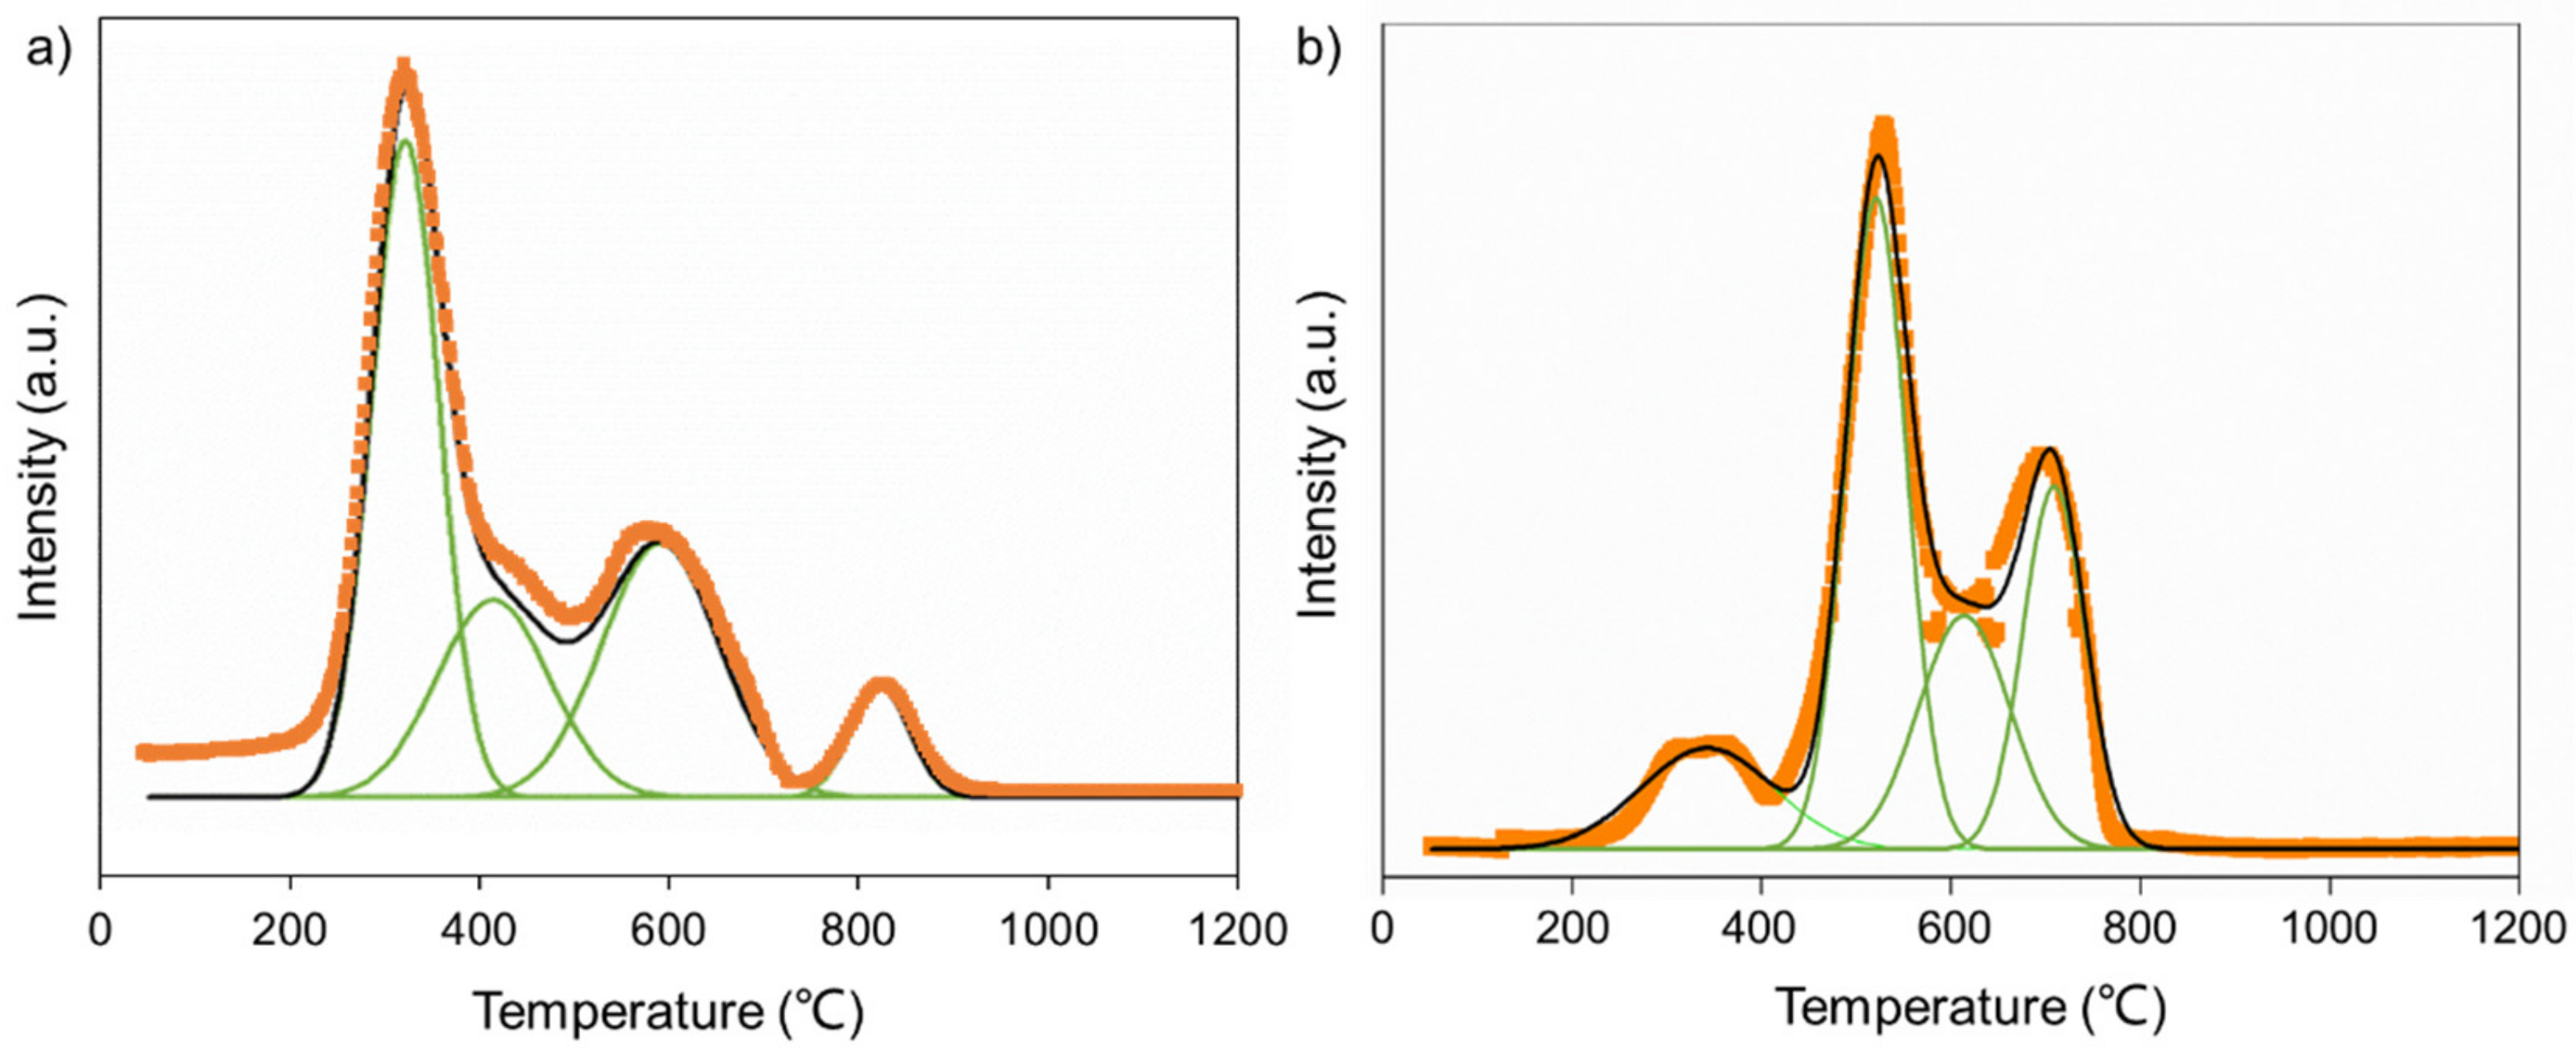
TPH was conducted in a quartz tube reactor equipped with a mass spectrometer. Typically, 50 mg of the sample was in situ reduced and carburized before the TPH experiment. During the TPH, the temperature was increased from room temperature to 820 °C at a rate of 10 °C/min in 20 vol% H2/Ar flow (50 mL/min in total).

3.3.9. H2-Thermogravimetric Analysis (H2-TGA)

A NETZSCH STA449C Thermal Analyzer was used for gravimetric measurement. The catalyst powders (approximately 10 mg) were put into an alumina crucible, Ar was introduced at RT into the Thermal Analyzer, and temperature was increased to 120 °C at a temperature ramp of 5 °C/min, purging for 1 h, and then H2/Ar (H2:Ar = 5:95) gaseous mixture was introduced and temperature was increased to 1200 °C, keeping a temperature ramp of 5 °C/min.

3.3.10. Attrition Index

The attrition index was measured on an air jet cup attrition index tester. The calcined catalysts were sieved with standard sieves of 53 and 120 μm before attrition index testing. The sieving process was applied until particles no longer passed through. The attrition index of the iron-based catalysts was tested using an ASTM D5757-95 method in a 3-hole attrition index tester. In the jet cup test, 50 g of each sample was used with an air jet having a flow rate of 10 L/min (with a relative humidity of 60 ± 5%) at room temperature for 5 h. The fines were collected with a thimble filter at the outlet of the jet cup chamber. The weight of the fines collected was divided by the weight of the total sample recovered to calculate the weight percentage of fines lost, then divided by 5 to obtain the weight loss hourly.

3.3.11. Attrition Test under Reactive FTS Conditions

Catalyst attrition strength was tested in a 1 L vigorously stirred tank reactor under reactive FTS conditions. In each run, 10 g catalyst and 500 mL liquid paraffin were added into the reactor. The syngas used was mixed from pure H2 and CO; the H2/CO ratio was adjusted by multiple mass flow meters. Before FTS tests, the catalyst was reduced with H2/CO = 5:1 syngas under 260 °C, 2.3 MPa, 5000 mL/(g-cat·h) GHSV for 24 h. After reduction, the temperature of the reactor was adjusted to 265 °C, the H2/CO was set to 3.0, the GHSV was raised to 20,000 mL/(g-cat·h), and the agitation speed was adjusted from 800 rpm to 2000 rpm. The liquid products were collected with a cold trap and a hot trap. The tail gas flow was vented. After 200 h of reaction, the reactor was depressurized to normal pressure and purged with nitrogen to cool down to 130 °C, then the stirring was stopped and the sample started settling at 130 °C. After settling for 30 min and 60min, 10 g of upper liquid phase sample was taken respectively to test the solid content in slurry.

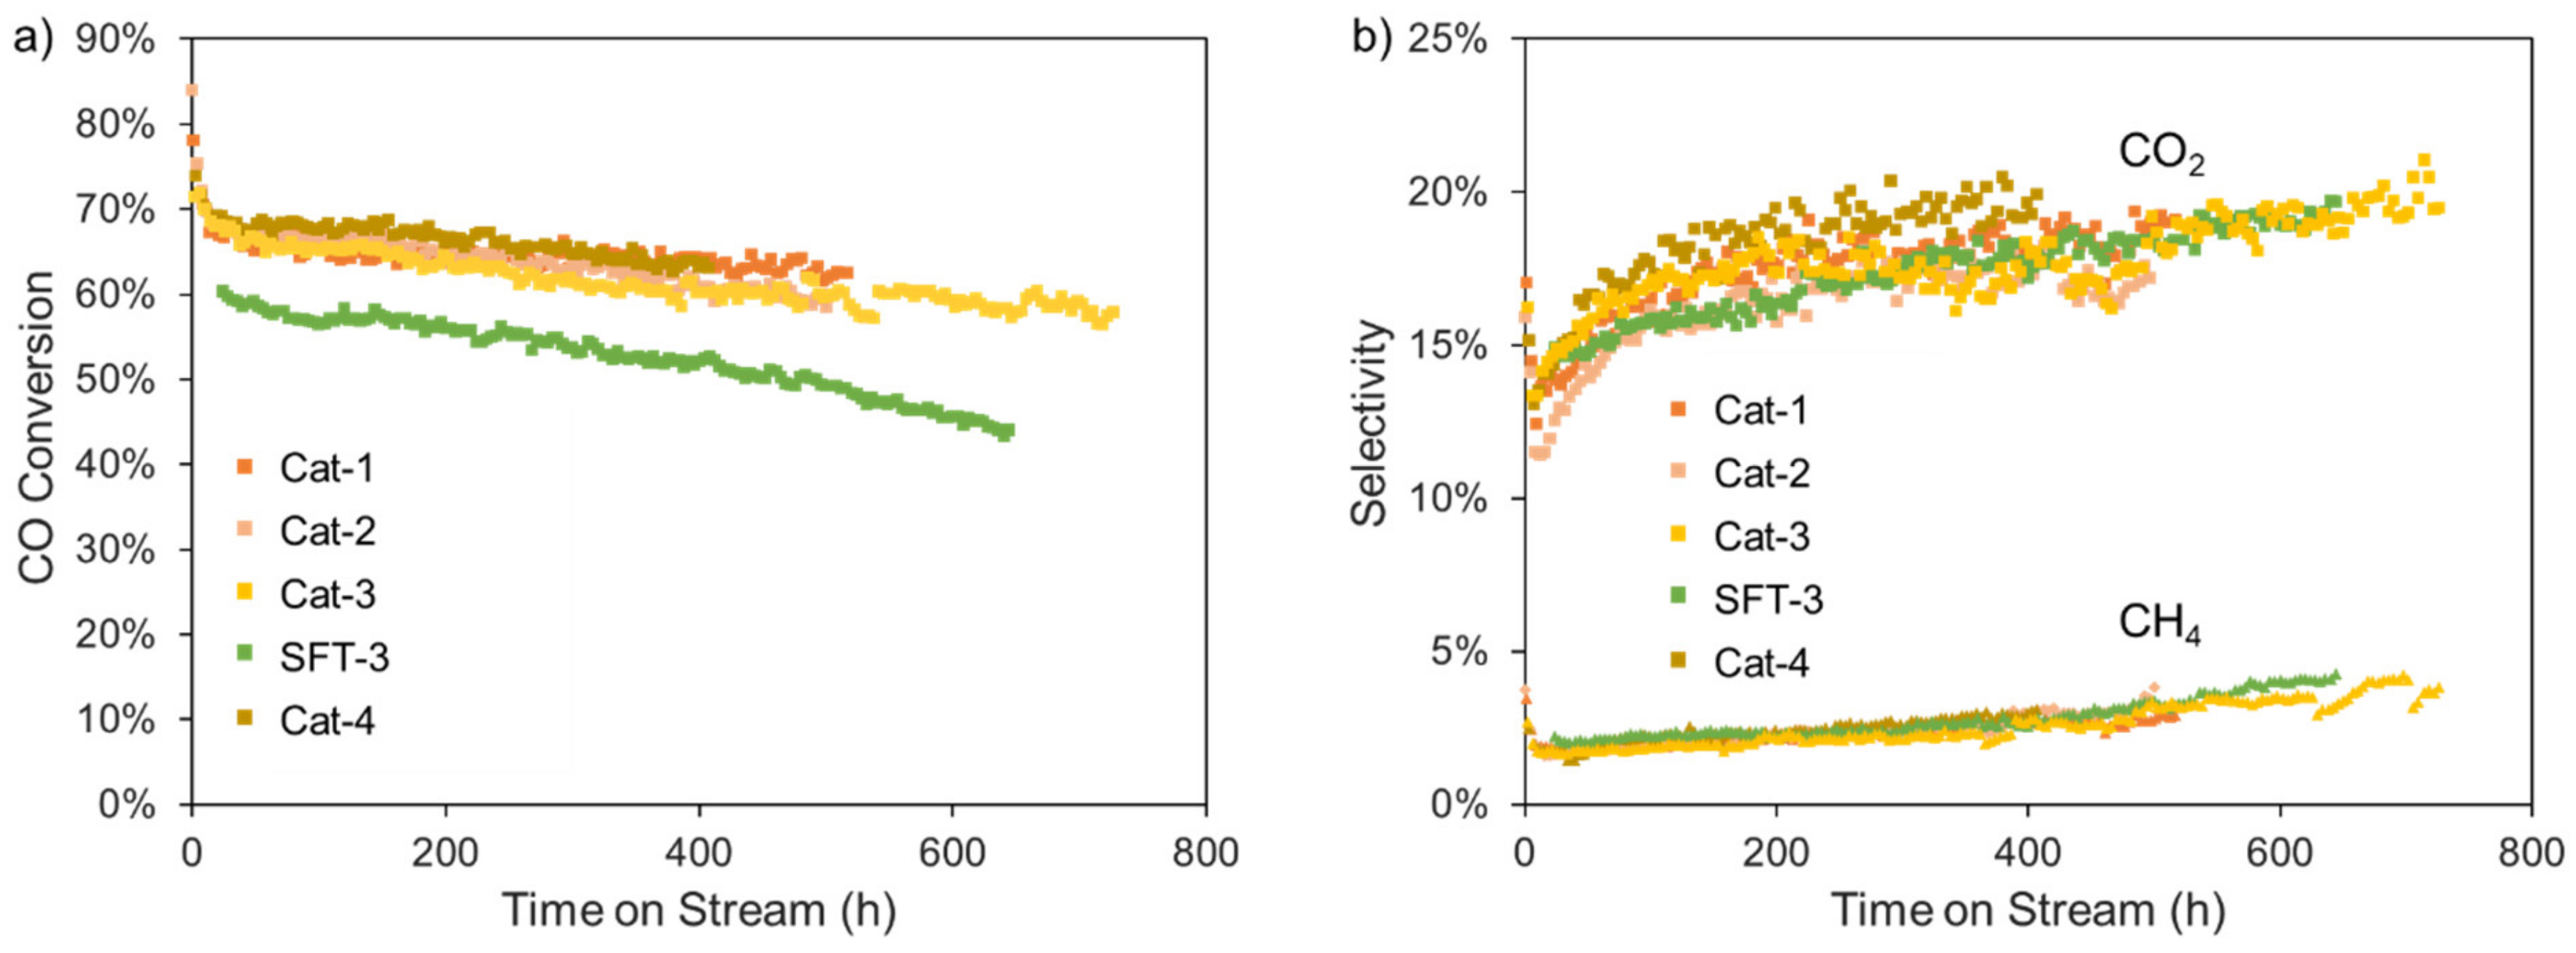
3.4. Fischer–Tropsch Synthesis Performance Test

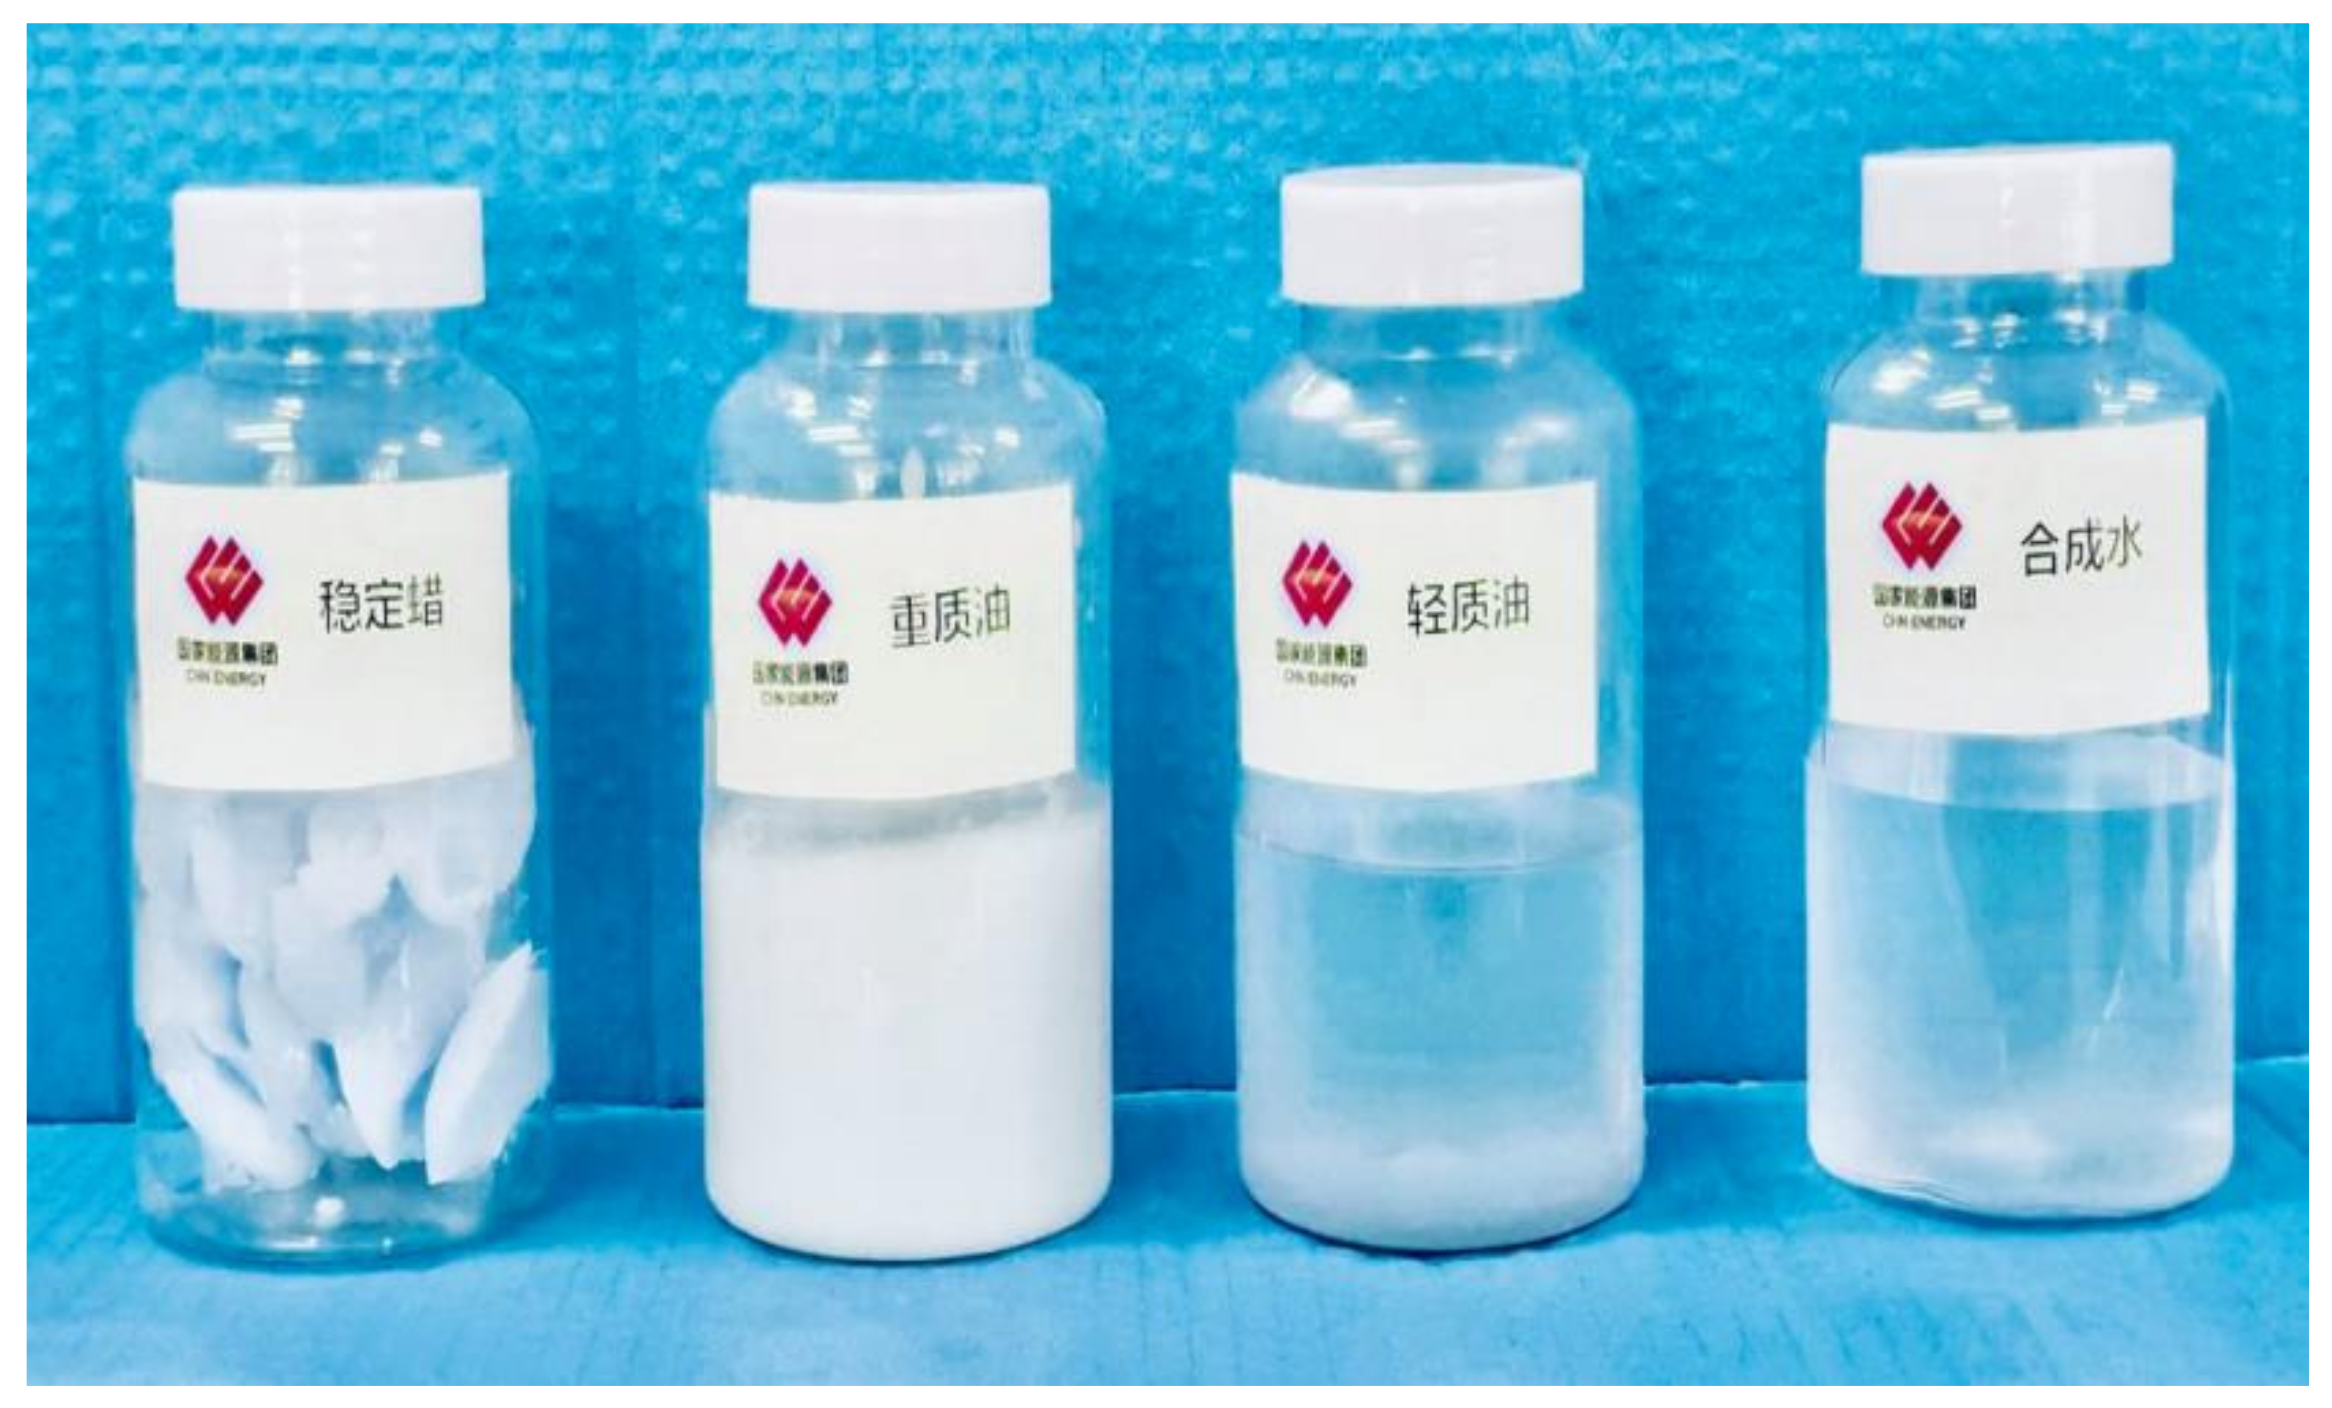
The Fischer–Tropsch synthesis (FTS) performance of the catalyst was tested in a 1 L stirred-tank reactor. In each run, 10 g catalyst and 500 mL liquid paraffin were added into the reactor. The syngas used was mixed from pure H2 and CO; the H2/CO ratio was adjusted by multiple mass flow meters. Before FTS tests, the catalyst was reduced with H2/CO = 5:1 syngas under 260 °C, 2.3 MPa, 5000 mL/(g-cat·h) GHSV for 24 h. After reduction, the temperature of the reactor was adjusted to 265 °C, the H2/CO was set to 3.0, and the GHSV was raised to 20,000 mL/(g-cat·h). The liquid products were collected with a cold trap and a hot trap. The tail gas flow was measured with a wet gas meter before being vented. The CO conversion and the selectivity of the gaseous products were acquired by 7890A gas chromatograph (Agilent, Santa Clara, CA, USA). H2 and CO were separated on a Porapak N (2 m) column with Ar as the carrier gas, and were quantified by a TCD detector. CO2 and CH4 were separated by CHX after 13X (2 m) column, with Ar as the carrier gas, and were detected by the subsequent TCD detector. C1-C5 hydrocarbons were analyzed using an Al2O3 elastic quartz capillary column (50 m × 0.53 mm), with N2 as the carrier gas and FID as the detector. The amounts of oil, wax, and aqueous products were also measured by weighting.

4. Conclusions

The present work provides a demonstration of commercial iron FTS catalyst development. Firstly a systematic research on physical attrition resistance and reaction stability has been carried out, then a novel catalyst with highly attrition resistance and stablity based on binder and promoter optimization has been developed and verified by industrial-scale performance.
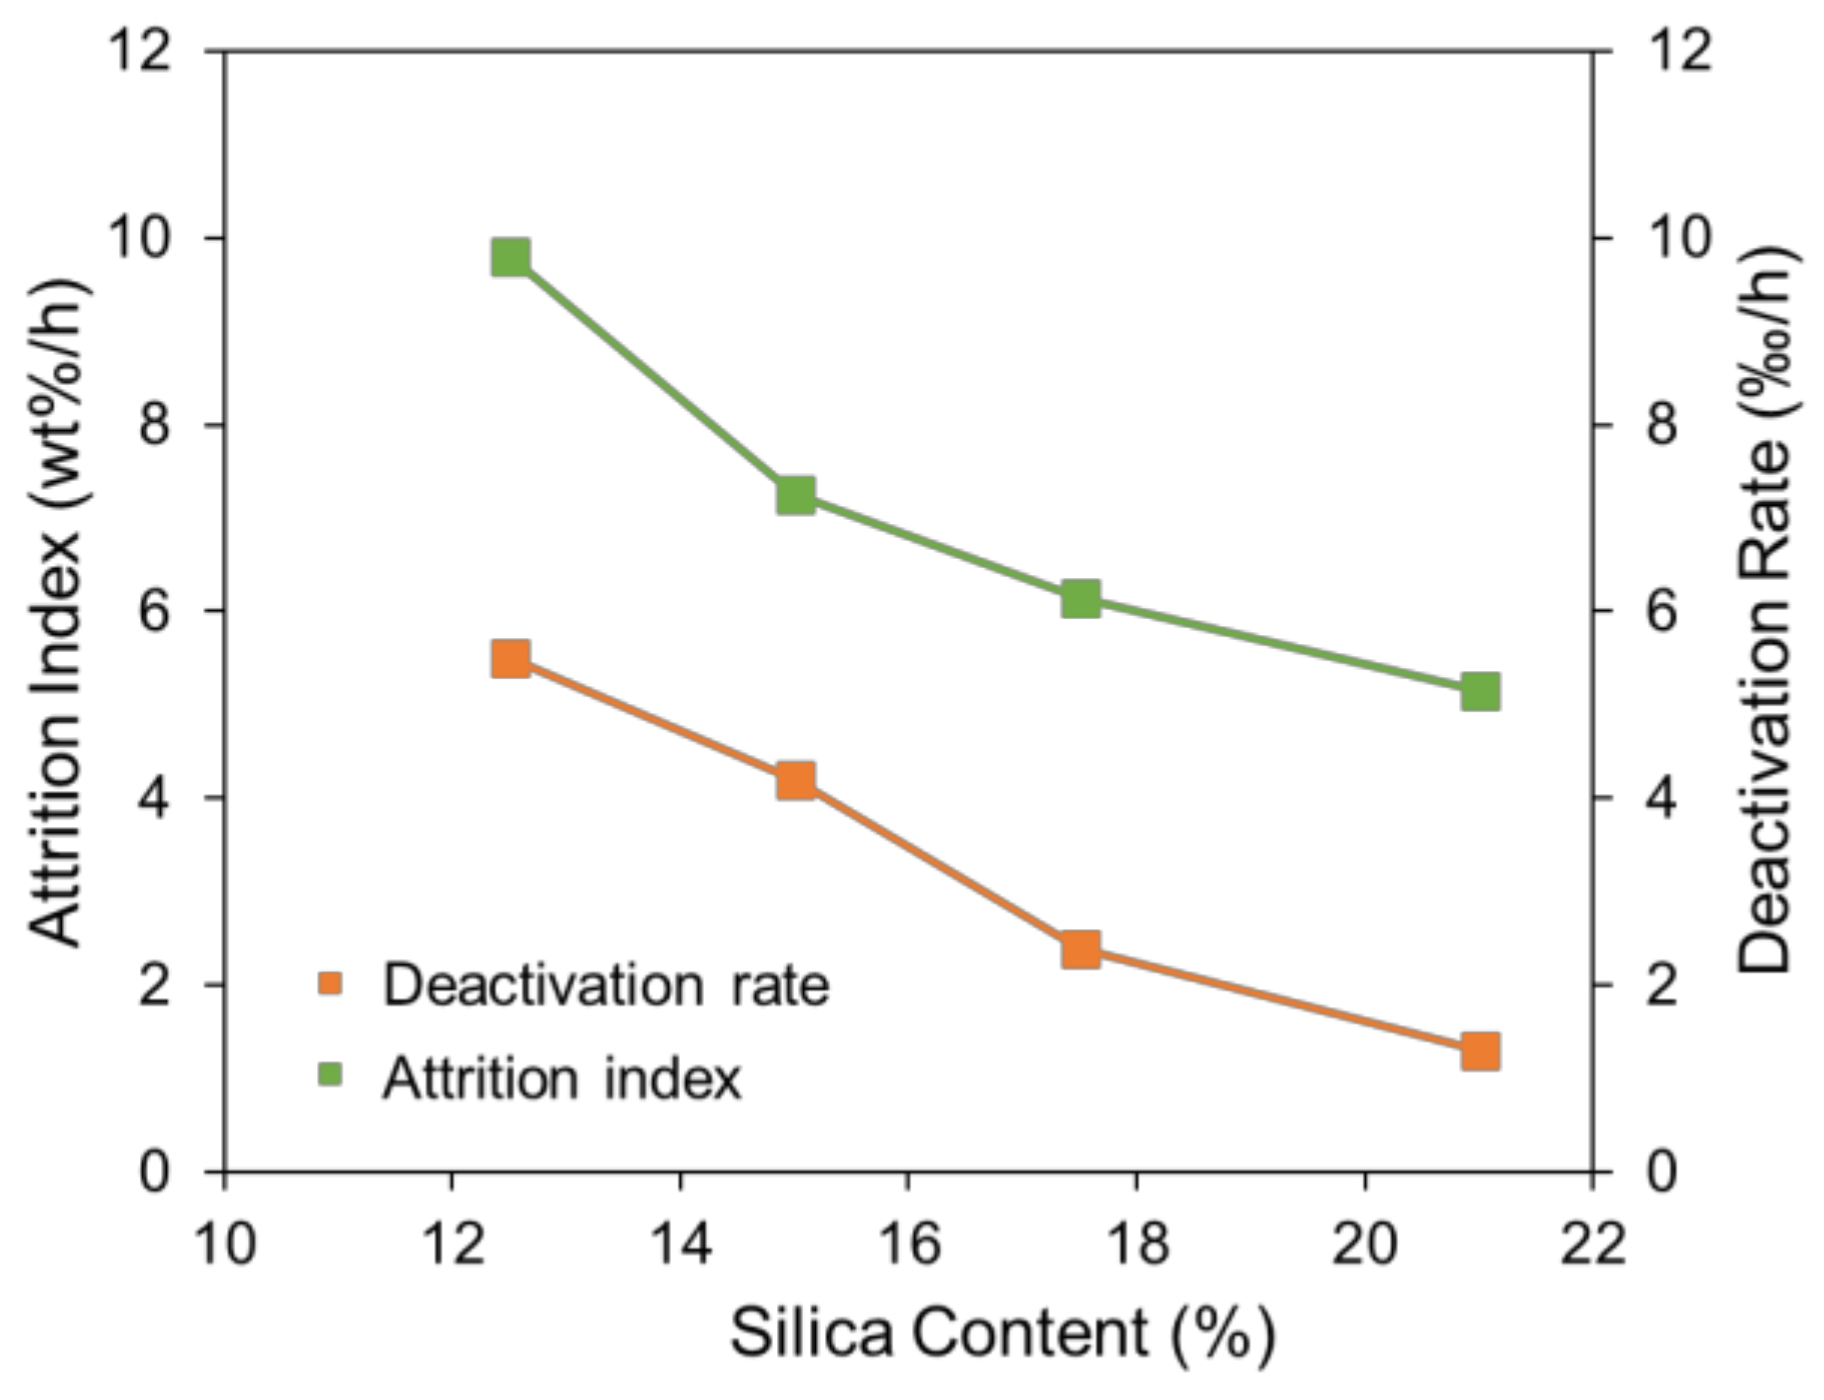
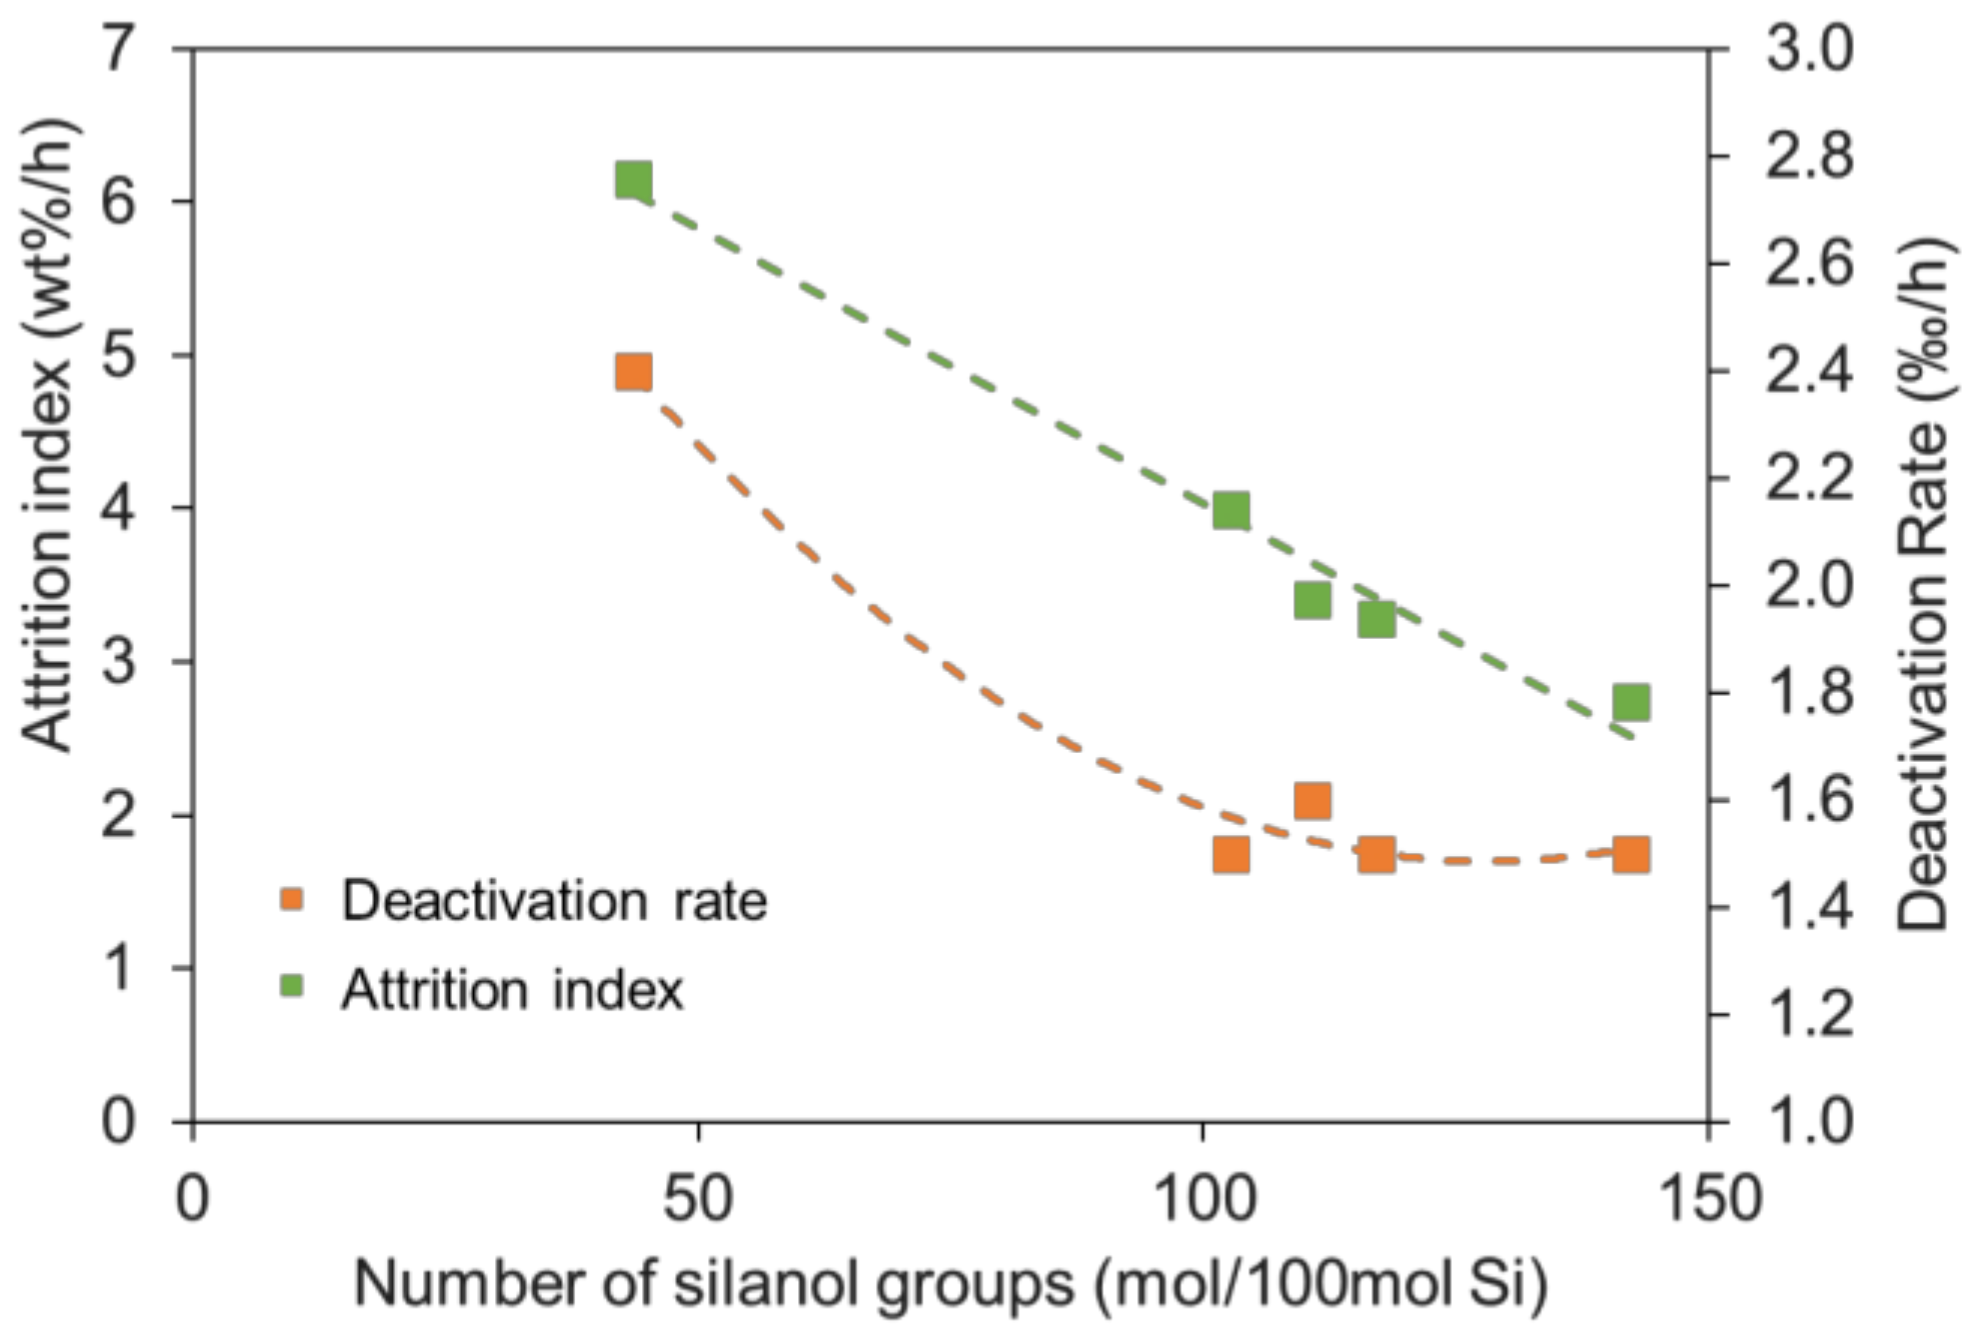
It was revealed that the contents of silica and related hydroxyls have a significant influence on the attrition resistance of the catalysts. With the increase in silica, the attrition resistance and reactive stability of the catalysts are enhanced, while the activity falls because the higher the silica content, the lower the reduction degree. Attrition resistance is further raised by increasing the content of silanol within the silica source, without activity loss. There is a suitable range for a linear relationship between reactive stability and attrition resistance.
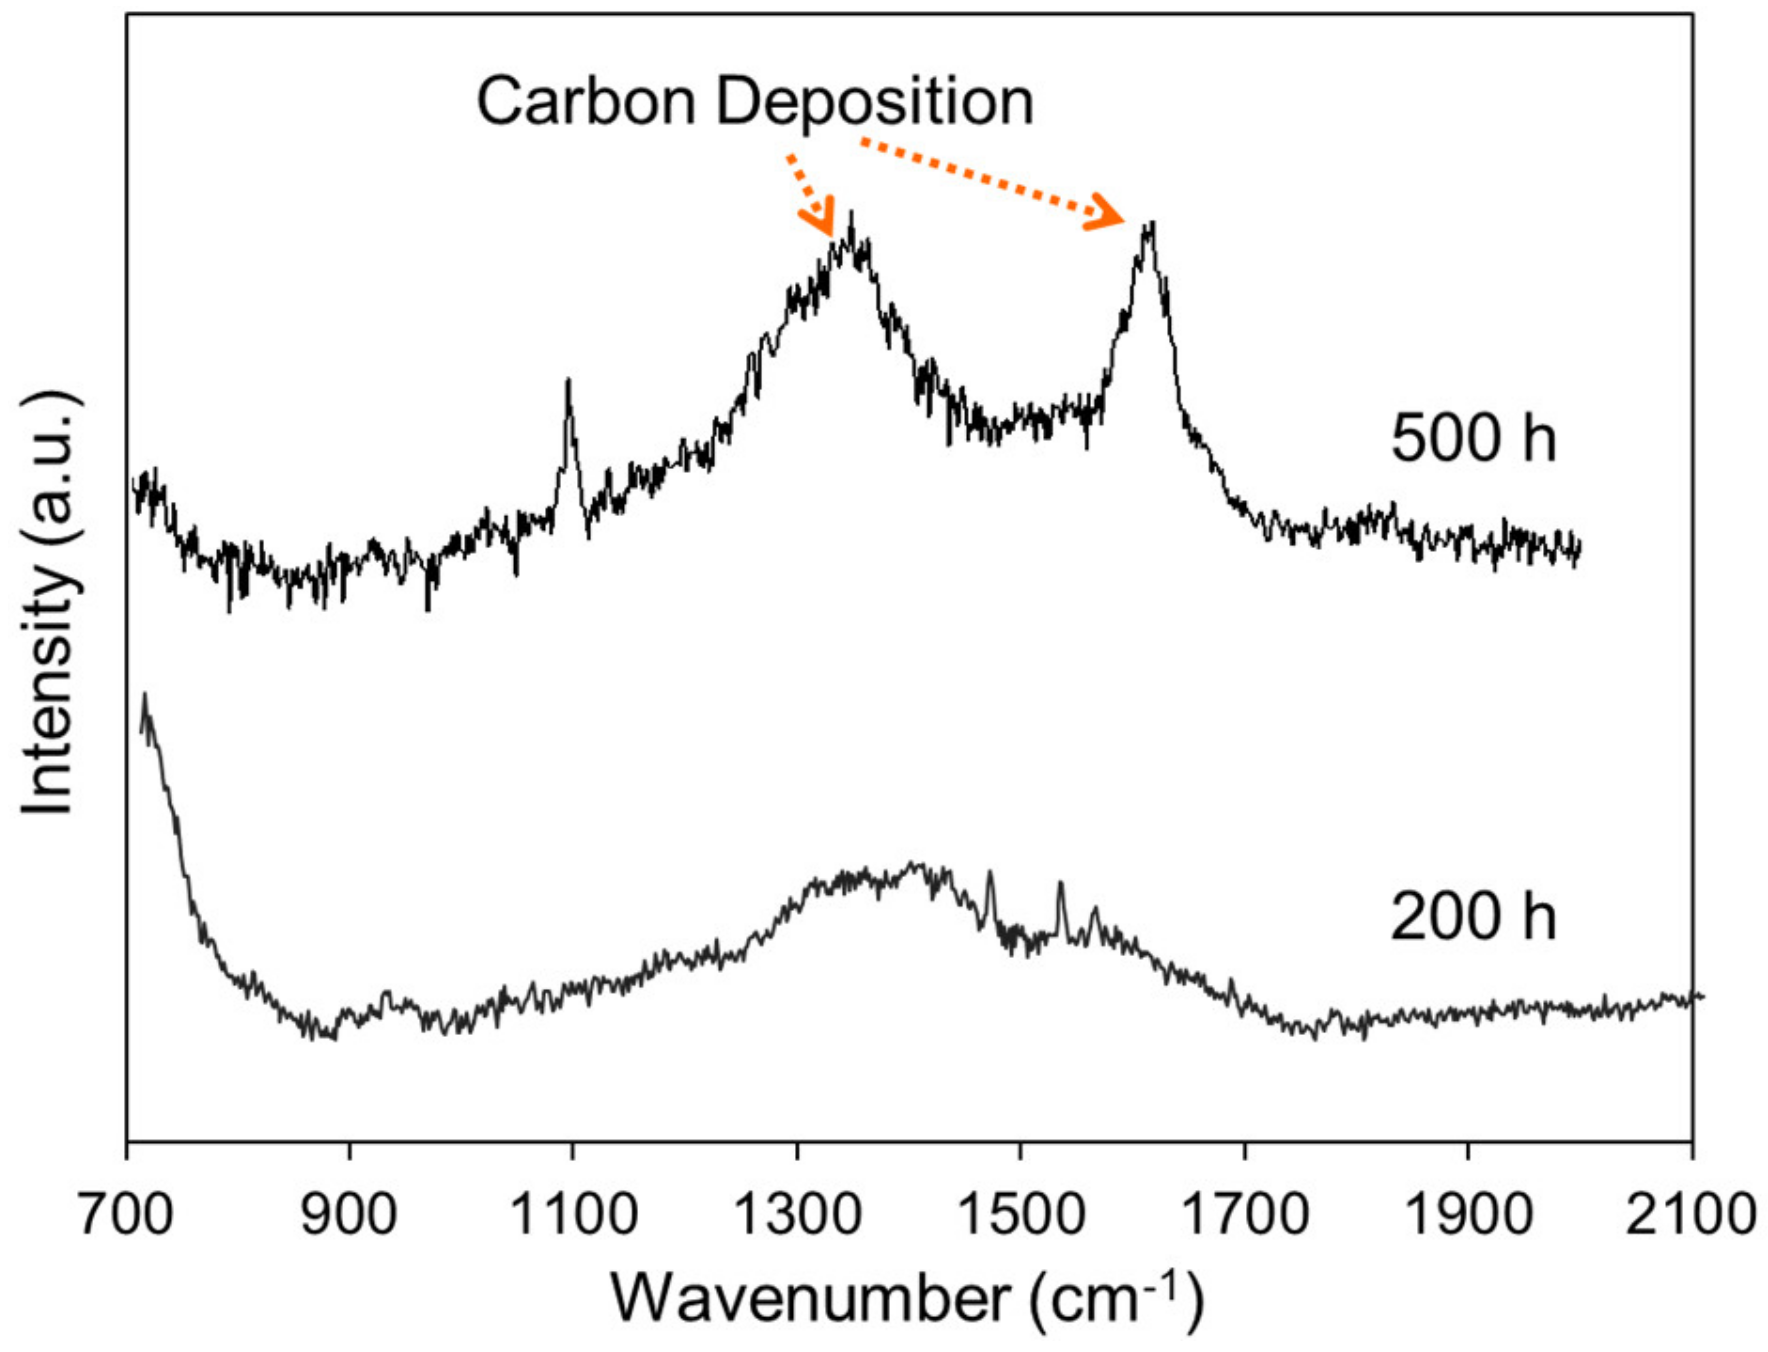
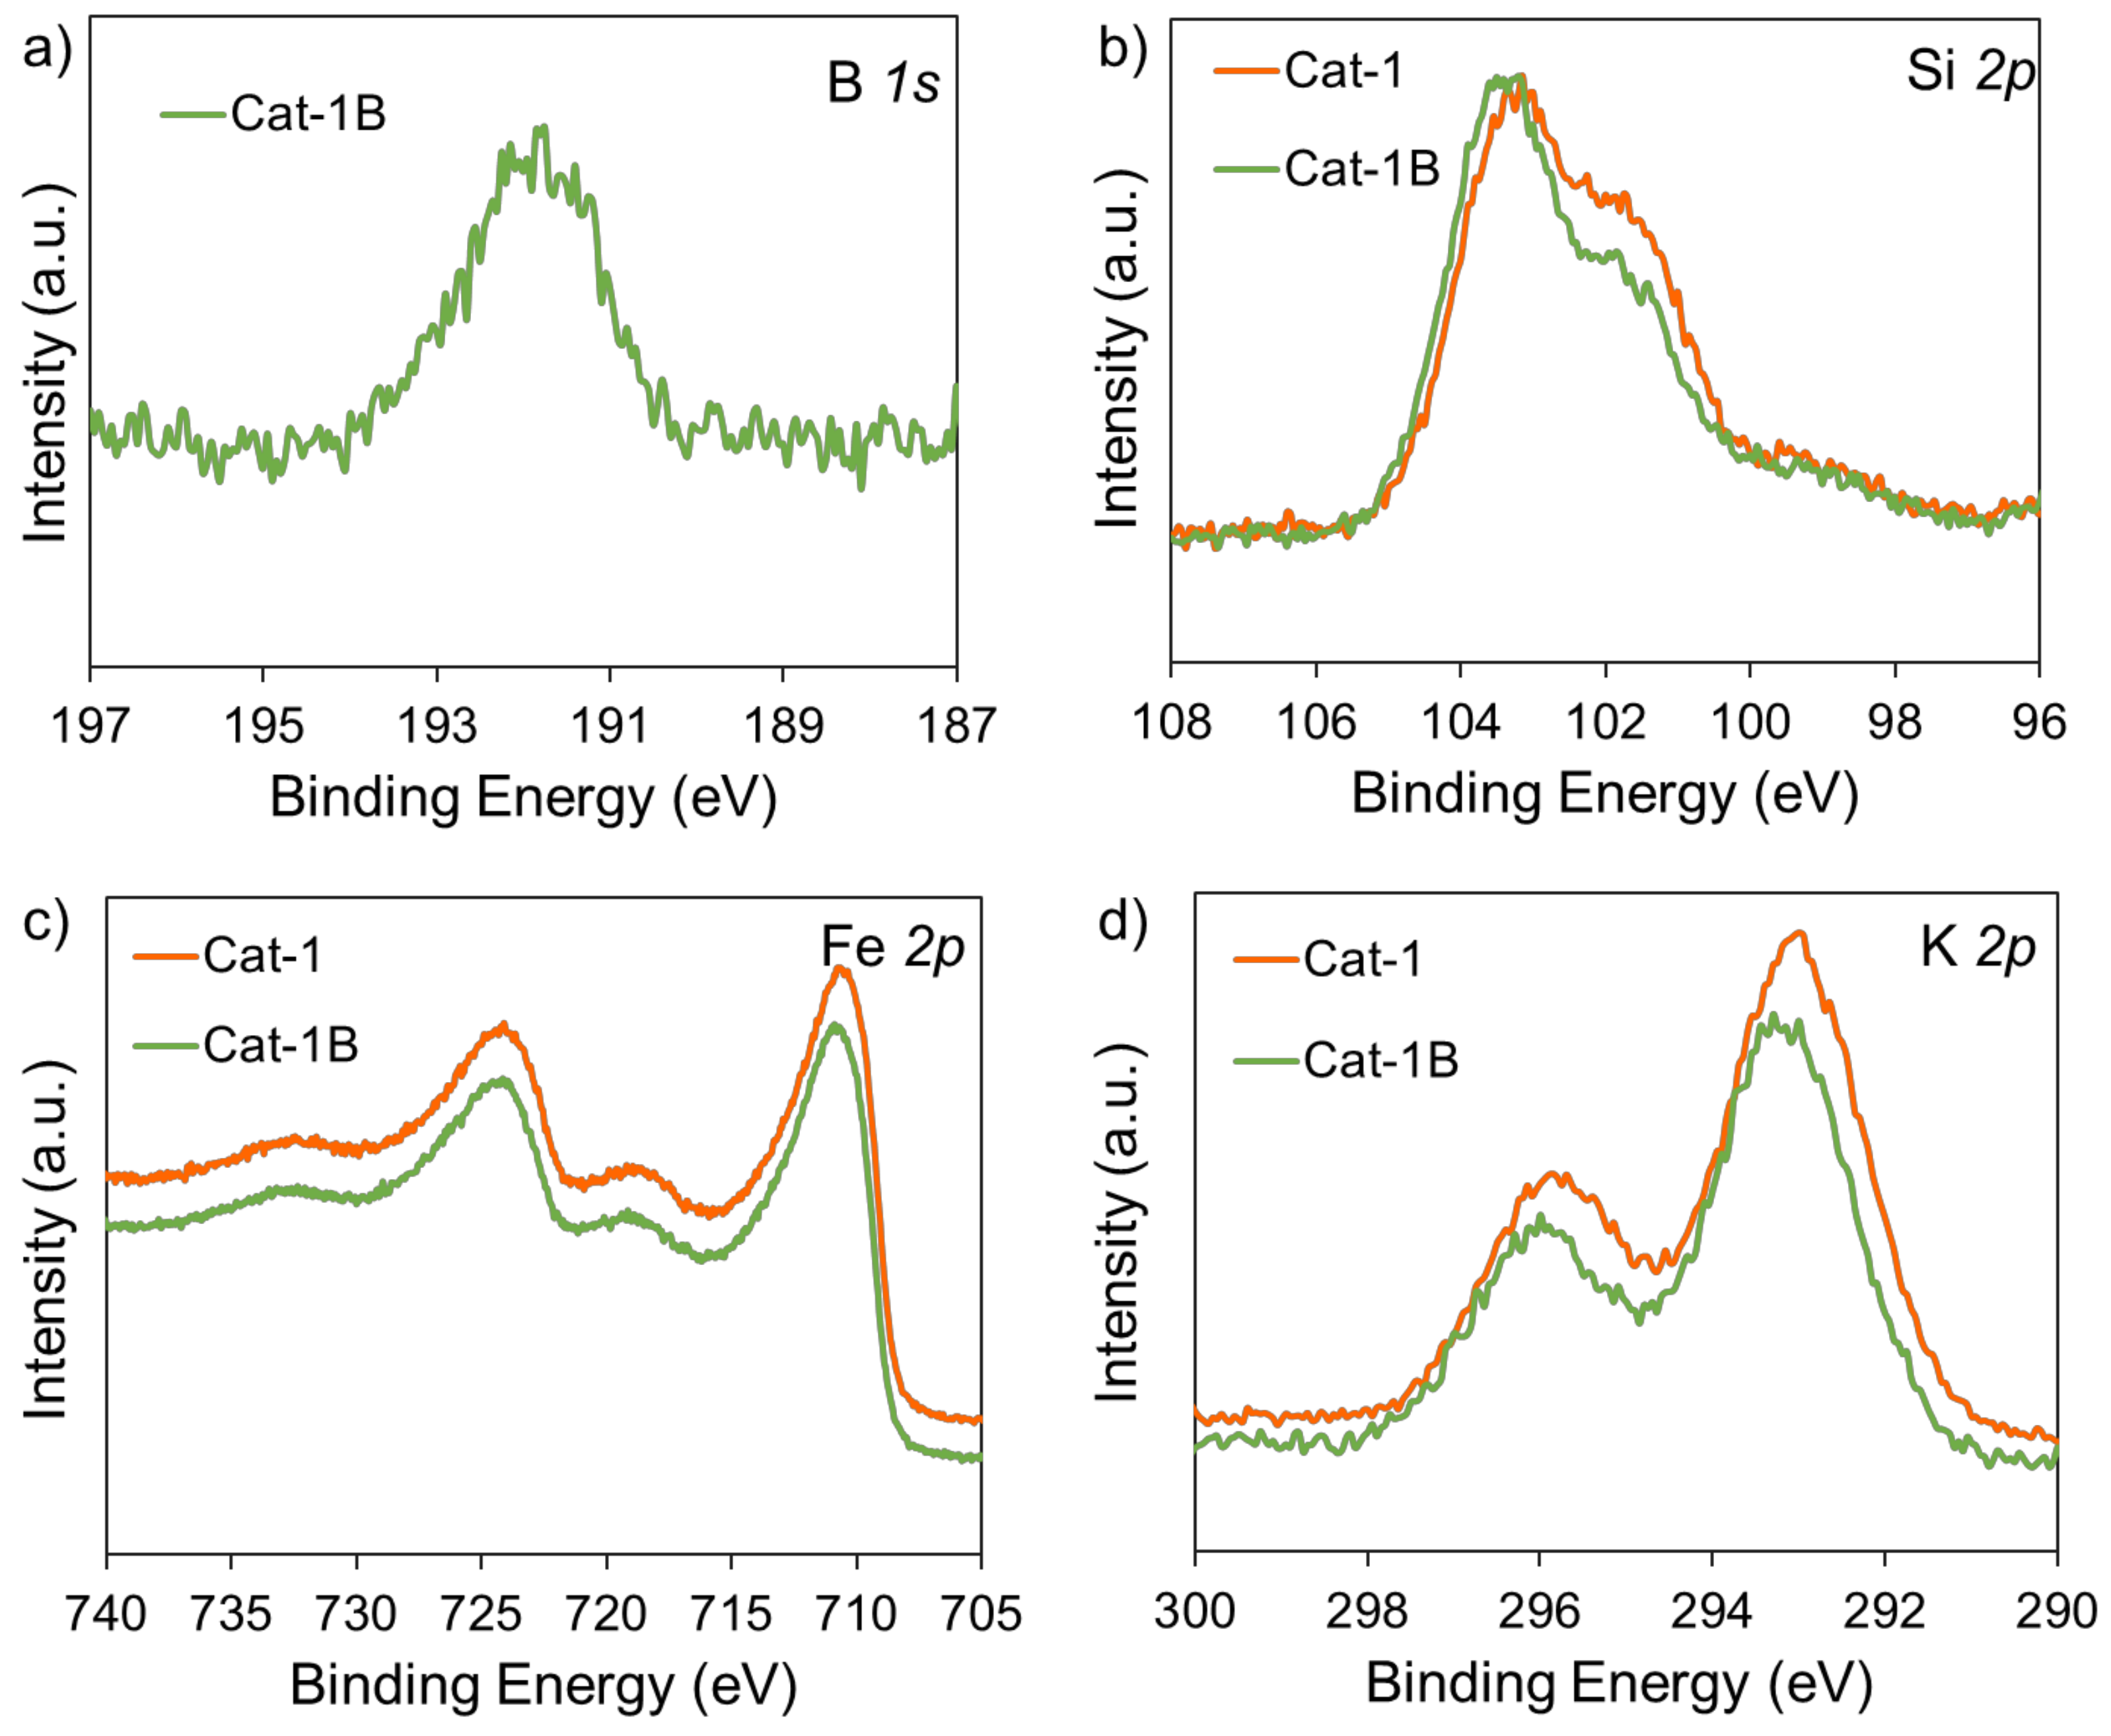
The boron promoter is found to be greatly beneficial to the FTS stability. Through a series of characterization tests, it was revealed that the boron promoter reduces carbon deposition on the catalyst surface and improves the FTS stability. In the present work, an iron catalyst was designed and was successfully applied in an industrial FTS plant in China.
Future studies are required to optimize the stability of FTS over 1000 h and intensively focus on selectivity through more research routes, including in situ characterization, severe conditions testing, and ffundamental simulations of promoter effects, etc.

Author Contributions

Conceptualization, Q.L., M.C., K.Z.; investigation, M.C., K.Z., W.L., P.W., H.C.; writing—original draft, Q.L., M.C., K.Z., W.L.; writing—review and editing, Q.L., M.C., K.Z., W.L.; project administration, Q.L., Y.L., Z.M.; funding acquisition, Q.L., Y.L., Z.M. All authors have read and agreed to the published version of the manuscript.

Funding

This research was funded by the National Key Research and Development Program (Project No. 2017YFB0602500) and the Technical Innovation project of China Energy Investment Corporation (Project No. GJNY-21-72).

Conflicts of Interest

The authors declare no conflict of interest. The funders had no role in the design of the study; in the collection, analyses, or interpretation of data; in the writing of the manuscript, or in the decision to publish the results.

References

  1. Dry, M.E. Fischer–Tropsch synthesis. In Catalysis, Science and Technology, 1st ed.; Anderson, J.R., Boudart, M., Eds.; Springer: New York, NY, USA, 1981; pp. 159–255. [Google Scholar]
  2. Van de Laan, G. Kinetics, Selectivity and Scale up of the Fischer–Tropsch Synthesis. Ph.D. Thesis, University of Groningen, Groningen, The Netherlands, 1999. [Google Scholar]
  3. Jager, B. Developments in Fischer–Tropsch technology. In Studies in Surface Science and Catalysis; Elsevier: Amsterdam, The Netherlands, 1997; Volume 107, pp. 219–224. [Google Scholar]
  4. Men, Z.W.; Lin, Q.; Lv, Y.J. The selection of the cobalt catalysts for Fischer–Tropsch synthesis. Shen Hua Sci. Technol. 2009, 7, 85–87. [Google Scholar]
  5. Kalakkad, D.S.; Shroff, M.D.; Köhler, S.; Jackson, N.; Datye, A.K. Attrition of precipitated iron Fischer–Tropsch catalysts. Appl. Catal. A Gen. 1995, 133, 335–350. [Google Scholar] [CrossRef]
  6. Pham, H.N.; Nowicki, L.; Xu, J.; Datye, A.K.; Bukur, D.B.; Bartholomew, C. Attrition Resistance of Supports for Iron Fischer–Tropsch Catalysts. Ind. Eng. Chem. Res. 2003, 42, 4001–4008. [Google Scholar] [CrossRef]
  7. Lin, T.-J.; Meng, X.; Shi, L. Attrition Studies of an Iron Fischer–Tropsch Catalyst Used in a Pilot-Scale Stirred Tank Slurry Reactor. Ind. Eng. Chem. Res. 2012, 51, 13123–13131. [Google Scholar] [CrossRef]
  8. Bukur, D.B.; Ma, W.-P.; Carreto-Vazquez, V. Attrition studies with precipitated iron Fischer–Tropsch catalysts under reaction conditions. Top Catal. 2005, 32, 135–141. [Google Scholar] [CrossRef]
  9. Bukur, D.B.; Carreto-Vazquez, V.; Pham, H.N.; Datye, A.K. Attrition properties of precipitated iron Fischer–Tropsch catalysts. Appl. Catal. A Gen. 2004, 266, 41–48. [Google Scholar] [CrossRef]
  10. Jager, B.; van Berge, P.; Steynberg, A.P. Developments in Fischer–Tropsch Technology and its Application. In Studies in Surface Science and Catalysis; Elsevier: Amsterdam, The Netherlands, 2001; Volume 136, pp. 63–68. [Google Scholar]
  11. Jager, B.; Espinoza, R. Advances in low temperature Fischer–Tropsch synthesis. Catal. Today 1995, 23, 17–28. [Google Scholar] [CrossRef]
  12. Zhao, R.; Goodwin, J.G.; Oukaci, R. Attrition assessment for slurry bubble column reactor catalysts. Appl. Catal. A Gen. 1999, 189, 99–116. [Google Scholar] [CrossRef]
  13. Bukur, D.B. Attrition studies with catalysts and supports for slurry phase Fischer–Tropsch synthesis. Catal. Today 2005, 106, 275–281. [Google Scholar] [CrossRef]
  14. Pham, H.N.; Datye, A.K. The synthesis of attrition resistant slurry phase iron Fischer–Tropsch catalysts. Catal. Today 2000, 58, 233–240. [Google Scholar] [CrossRef]
  15. Zhao, R.; Goodwin, J.G.; Jothimurugesan, K.; Gangwal, S.K.; Spivey, J.J. Spray-Dried Iron Fischer–Tropsch Catalysts. 1. Effect of Structure on the Attrition Resistance of the Catalysts in the Calcined State. Ind. Eng. Chem. Res. 2001, 40, 1065–1075. [Google Scholar] [CrossRef]
  16. Zhao, R.; Goodwin, J.G.; Jothimurugesan, K.; Gangwal, S.K.; Spivey, J.J. Spray-Dried Iron Fischer–Tropsch Catalysts. 2. Effect of Carburization on Catalyst Attrition Resistance. Ind. Eng. Chem. Res. 2001, 40, 1320–1328. [Google Scholar] [CrossRef]
  17. Sudsakorn, K.; Goodwin, J.G.; Jothimurugesan, K.; Adeyiga, A.A. Preparation of Attrition-Resistant Spray-Dried Fe Fischer–Tropsch Catalysts Using Precipitated SiO2. Ind. Eng. Chem. Res. 2001, 40, 4778–4784. [Google Scholar] [CrossRef]
  18. Bukur, D.B.; Carreto-Vazquez, V.H.; Ma, W. Catalytic performance and attrition strength of spray-dried iron catalysts for slurry phase Fischer–Tropsch synthesis. Appl. Catal. A Gen. 2010, 388, 240–247. [Google Scholar] [CrossRef]
  19. Hou, W.; Wu, B.; Yang, Y.; Hao, Q.; Tian, L.; Xiang, H.; Li, Y. Effect of SiO2 content on iron-based catalysts for slurry Fischer–Tropsch synthesis. Fuel Process. Technol. 2008, 89, 284–291. [Google Scholar] [CrossRef]
  20. Chang, H.; Cheng, M.; Lin, Q.; Zhu, J.Q.; Lv, Y.J.; Men, Z.W. Effects of binder addition process parameters on physical-chemical and catalytic performance of iron-based Fischer–Tropsch (F–T) synthesis catalyst. J. China Coal Soc. in press.
  21. Duvenhage, D.; Coville, N. Deactivation of a precipitated iron Fischer–Tropsch catalyst—A pilot plant study. Appl. Catal. A Gen. 2006, 298, 211–216. [Google Scholar] [CrossRef]
  22. Thüne, P.; Moodley, P.; Scheijen, F.; Fredriksson, H.; Lancee, R.; Kropf, J.; Miller, J.; Niemantsverdriet, J.W. The Effect of Water on the Stability of Iron Oxide and Iron Carbide Nanoparticles in Hydrogen and Syngas Followed by in Situ X-ray Absorption Spectroscopy. J. Phys. Chem. C 2012, 116, 7367–7373. [Google Scholar] [CrossRef]
  23. Xie, J.; Torres Galvis, H.M.; Koeken, A.C.J.; Kirilin, A.; Dugulan, A.I.; Ruitenbeek, M.; de Jong, K.P. Size and Promoter Effects on Stability of Carbon-Nanofiber-Supported Iron-Based Fischer–Tropsch Catalysts. ACS Catal. 2016, 6, 4017–4024. [Google Scholar] [CrossRef] [Green Version]
  24. Nakhaei Pour, A.; Housaindokht, M.R.; Tayyari, S.F.; Zarkesh, J.; Alaei, M.R. Deactivation studies of Fischer–Tropsch synthesis on nano-structured iron catalyst. J. Mol. Catal. A Chem. 2010, 330, 112–120. [Google Scholar] [CrossRef]
  25. Li, S.; Li, A.; Krishnamoorthy, S.; Iglesia, E. Effects of Zn, Cu, and K Promoters on the Structure and on the Reduction, Carburization, and Catalytic Behavior of Iron-Based Fischer–Tropsch Synthesis Catalysts. Catal. Lett. 2001, 77, 197–205. [Google Scholar] [CrossRef]
  26. Qing, M.; Yang, Y.; Wu, B.; Wang, H.; Wang, H.; Xu, J.; Zhang, C.; Xiang, H.; Li, Y. Effect of the zirconia addition manner on the modification of Fe–SiO2 interaction. Catal. Today 2012, 183, 79–87. [Google Scholar] [CrossRef]
  27. Dad, M. From 2D to 3D: Development, Characterization and Testing of a Well-Defined Fe-Mn/SiO2 Fischer–Tropsch Model Catalyst. Ph.D. Thesis, Eindhoven University of Technology, Eindhoven, The Netherlands, 2016. [Google Scholar]
  28. Zhang, Y.; Qing, M.; Wang, H.; Liu, X.-W.; Liu, S.; Wan, H.; Li, L.; Gao, X.; Yang, Y.; Wen, X.-D.; et al. Comprehensive understanding of SiO2-promoted Fe Fischer–Tropsch synthesis catalysts: Fe-SiO2 interaction and beyond. Catal. Today 2021, 368, 96–105. [Google Scholar] [CrossRef]
  29. Suo, H.; Zhang, C.; Wu, B.; Xu, J.; Yang, Y.; Xiang, H.; Li, Y. A comparative study of Fe/SiO2 Fischer–Tropsch synthesis catalysts using tetraethoxysilane and acidic silica sol as silica sources. Catal. Today 2012, 183, 88–95. [Google Scholar] [CrossRef]
  30. Arakawa, H.; Bell, A.T. Effects of potassium promotion on the activity and selectivity of iron Fischer–Tropsch catalysts. Ind. Eng. Chem. Proc. Des. Dev. 1983, 22, 97–103. [Google Scholar] [CrossRef]
  31. Dry, M. Factors influencing the formation of carbon on iron Fischer–Tropsch catalysts II. The effect of temperature and of gases and vapors present during Fischer–Tropsch synthesis. J. Catal. 1970, 17, 347–354. [Google Scholar] [CrossRef]
  32. Pendyala, V.R.R.; Graham, U.M.; Jacobs, G.; Hamdeh, H.H.; Davis, B.H. Fischer–Tropsch Synthesis: Morphology, Phase Transformation, and Carbon-Layer Growth of Iron-Based Catalysts. ChemCatChem 2014, 6, 1952–1960. [Google Scholar] [CrossRef]
  33. Zhang, C.-H.; Wan, H.-J.; Yang, Y.; Xiang, H.-W.; Li, Y.-W. Study on the iron–silica interaction of a co-precipitated Fe/SiO2 Fischer–Tropsch synthesis catalyst. Catal. Commun. 2006, 7, 733–738. [Google Scholar] [CrossRef]
  34. Cong, X.-D.; Kirkpatrick, R.J.; Diamond, S. 29Si MAS NMR spectroscopic investigation of alkali silica reaction product gels. Cem. Concr. Res. 1993, 23, 811–823. [Google Scholar] [CrossRef]
  35. Ouyang, R.; Liu, J.-X.; Li, W.-X. Atomistic theory of Ostwald ripening and disintegration of supported metal particles under reaction conditions. J. Am. Chem. Soc. 2013, 135, 1760–1771. [Google Scholar] [CrossRef]
  36. Wan, H.; Qing, M.; Wang, H.; Liu, S.; Liu, X.-W.; Zhang, Y.; Gong, H.; Li, L.; Zhang, W.; Song, C.; et al. Promotive effect of boron oxide on the iron-based catalysts for Fischer–Tropsch synthesis. Fuel 2020, 281, 118714. [Google Scholar] [CrossRef]
  37. Mekki, A.; Holland, D.; McConville, C.F.; Salim, M. An XPS study of iron sodium silicate glass surfaces. J. Non-Cryst. Solids 1996, 208, 267–276. [Google Scholar] [CrossRef]
  38. Mitchell, D.F.; Clark, K.B.; Bardwell, J.A.; Lennard, W.N.; Massoumi, G.R.; Mitchell, I.V. Film thickness measurements of SiO2 by XPS. Surf. Interface Anal. 1994, 21, 44–50. [Google Scholar] [CrossRef]
  39. Sayyed, B.A.; Chatterjee, A.K.; Kanetkar, S.M.; Badrinarayanan, S.; Date, S.K. Surface characterisation of an iron oxide catalyst (ethylbenzene → styrene): An xps study. J. Chem. Sci. 1985, 95, 291–295. [Google Scholar]
  40. Wu, B.; Tian, L.; Bai, L.; Zhang, Z.; Xiang, H.; Li, Y.W. Study on a new iron catalyst for slurry Fischer–Tropsch synthesis. Catal. Commun. 2004, 5, 253–257. [Google Scholar] [CrossRef]
  41. Xu, J.; Bartholomew, C.H. Temperature-programmed hydrogenation (TPH) and in situ Mössbauer spectroscopy studies of carbonaceous species on silica-supported iron Fischer–Tropsch catalysts. J. Phys. Chem. B 2005, 109, 2392–2403. [Google Scholar] [CrossRef]
Figure 1. Correlation between the silica content and the attrition index and stability.
Catalysts 11 00908 g001
Figure 2. SEM image of SFT-3 after attrition test in slurry bed reactor.
Catalysts 11 00908 g002
Figure 3. 29Si NMR of 5 types of silica source with different silanol contents.
Catalysts 11 00908 g003
Figure 4. Attrition index and deactivation rate of as-prepared catalysts versus the number of silanol groups.
Catalysts 11 00908 g004
Figure 5. XRD spectra of five catalysts prepared from five different silica sources.
Catalysts 11 00908 g005
Figure 6. TEM images and size distributions of (a,b) Cat-1 and (c,d) SFT-3.
Catalysts 11 00908 g006
Figure 7. SEM image of Cat-1 after attrition test in slurry bed reactor.
Catalysts 11 00908 g007
Figure 8. (a) CO conversion and (b) selectivity of Cat-1–4 and SFT-4.
Catalysts 11 00908 g008
Figure 9. Raman spectroscopy of Cat-1 after running.
Catalysts 11 00908 g009
Figure 10. XPS spectrum of Cat-1 and Cat-1B. (ad) are spectrum of B 1s, Si 2p, Fe 2p, K 2p, respectively.
Catalysts 11 00908 g010
Figure 11. In situ XRD patterns of (a) Cat-1 and (b) Cat-1B.
Catalysts 11 00908 g011
Figure 12. H2-TPR of profiles of Cat-1 and Cat-1B.
Catalysts 11 00908 g012
Figure 13. TPH of (a) Cat-1 and (b) Cat-1B after reaction. Green lines from the left to right are the peaks of α, β, γ, and δ carbon, respectively. The black line is the total fitting curve.
Catalysts 11 00908 g013
Figure 14. Reaction performance of Cat-1 and Cat-1B in slurry bed.
Catalysts 11 00908 g014
Figure 15. SEM images of industrial CNFT-1 catalyst at (a) low magnification and (b) high magnification.
Catalysts 11 00908 g015
Figure 16. FTS products acquired at a million-ton FTS plant using the CNFT-1 catalyst. From left to right are the stable wax, heavy oil, light oil, and synthetic water, respectively.
Catalysts 11 00908 g016
Table 1. Attrition index and physical properties of the prepared catalysts.
SampleSi Content 1 (%)Attrition Index (wt%/h)BET Surface (m2/g)Pore Volume (cm3/g)Average Pore Size (nm)
SFT-112.59.8179.00.5412.0
SFT-215.07.2171.40.4711.1
SFT-317.56.2180.20.5611.6
SFT-421.05.2175.60.5713.0
1 Si content is calculated as SiO2 content per 100 parts of Fe2O3.
Table 2. Fischer–Tropsch synthesis performances of the prepared catalysts 1.
SampleSi Content 2 (%)CO Conversion (%)CO2 Selectivity (%)CH4 Selectivity (%)Deactivation Rate 3 (‰/h)
200 h300 h200 h300 h200 h300 h
SFT-112.564.759.219.822.01.52.10.55
SFT-215.063.659.417.519.01.92.30.42
SFT-317.556.153.716.417.52.22.50.24
SFT-421.045.844.514.614.83.03.10.13
1 All samples were tested at 265 °C, 2.3 MPa H2/CO = 3 syngas, GHSV = 20,000 mL/(g-cat·h). 2 Si content is calculated as SiO2 content per 100 parts of Fe2O3. 3 Deactivation rate = (CO conversion at the initial stage of reaction (t = 200 h) − CO conversion at the end of reaction)/(Overall reaction time: 200 h).
Table 3. H2-TG results of the prepared catalysts.
SampleSi Content (%)Fe2O3 → Fe3O4Fe3O4 → FeTotal Reduction Degree (%)
Peak Temp. (°C)Weight Loss (%)Reduction
Degree (%)
Peak Temp. (°C)Weight Loss (%)Reduction
Degree (%)
SFT-112.5259.28.735.5769.615.161.697.1
SFT-215.0267.08.333.9715.014.458.692.6
SFT-317.5267.87.430.1682.812.651.681.7
SFT-421.0275.47.831.7654.08.635.066.7
Table 4. Fe content in liquid products of SFT-3.
SampleFe Content in Liquid Products (ppm)
After 30 min DepositAfter 60 min Deposit
SFT-3627367
Table 5. 29Si-NMR results and calculated silanol contents of different Si sources.
Si SourceQ0 (%)Q1 (%)Q2 (%)Q3 (%)Q4 (%)Silanol Content
(mol/100 mol Si)
KSi-11.297.7931.5850.548.81142
KSi-20.683.1524.3956.1015.68117
KSi-30.022.3724.9953.6219.00111
KSi-40.923.3020.3048.4227.06103
KSi-50.460.285.7529.3764.1544
Table 6. Attrition index and physical properties of catalysts prepared with different silica sources.
SampleSi SourceAttrition Index (wt%/h)BET Surface (m2/g)Pore Volume (cm3/g)Average Pore Size (nm)
Cat-1KSi-12.7171.30.4911.7
Cat-2KSi-23.3169.50.4513.4
Cat-3KSi-33.4170.00.4711.5
Cat-4KSi-44.0167.50.4811.9
SFT-3KSi-56.1180.20.5611.6
Table 7. Fischer–Tropsch synthesis performances of catalysts with different silica sources 1.
Sample 1Si SourceCO Conversion (%)CO2 Selectivity (%)CH4 Selectivity (%)Deactivation Rate 2 (‰/h)
Cat-1KSi-164.917.62.20.15
Cat-2KSi-264.115.82.20.15
Cat-3KSi-364.517.42.20.16
Cat-4KSi-466.219.52.40.15
SFT-3KSi-556.116.42.20.24
1 All samples were tested at 265 °C, 2.3 MPa H2/CO = 3 syngas, GHSV = 20,000 mL/(g-cat·h). 2 Deactivation rate = (CO conversion at the initial stage of reaction (t = 200 h) − CO conversion at the end of reaction)/(Overall reaction time: 200 h).
Table 8. Fe content in liquid products of Cat-1.
SampleFe Content in Liquid Products (ppm)
After 30 min DepositAfter 60 min Deposit
Cat-12220
Table 9. Grain size of Fe5C2 at different reduction periods.
Time (h)3456789
Cat-1 grain size (nm)12.818.220.419.121.620.421.7
Cat-1B grain size (nm)12.214.915.916.215.915.215.5
Table 10. Peak fitting results of the TPH curves of Cat-1 and Cat-1B.
SampleContent of Carbon Species (%)
αβγδ
Cat-16.444.040.88.8
Cat-1B43.221.628.86.4
Table 11. Attrition index and physical properties of Cat-1 and Cat-1B.
SampleSi SourceAttrition Index
(wt%/h)
BET Surface
(m2/g)
Pore Volume
(cm3/g)
Average Pore Size
(nm)
Cat-1KSi-12.7171.20.4911.7
Cat-1BKSi-12.4143.20.4713.3
Table 12. Fischer–Tropsch synthesis performances of Cat-1 and Cat-1B.
Sample 1Si SourceCO Conversion (%)CO2 Selectivity (%)CH4 Selectivity (%)Deactivation Rate 1 (‰/h)
Cat-1KSi-164.917.62.20.15
Cat-1BKSi-162.416.02.50.012
1 Deactivation rate = (CO conversion at the initial stage of reaction (t = 200 h) − CO conversion at the end of reaction)/(Overall reaction time: 200 h).
Table 13. Industrial application performance of CNFT-1.
ItemValue
Total CO conversion (mol%)97.4
CO2 selectivity (mol%)2.0
CH4 selectivity (mol%)18.8
Syngas consumption per ton oil (Nm3/t)5631
Wax/oil ratio (t/t)1.4
Publisher’s Note: MDPI stays neutral with regard to jurisdictional claims in published maps and institutional affiliations.

