
Natural Sunlight Driven Photocatalytic Removal of Toxic Textile Dyes in Water Using B-Doped ZnO/TiO2 Nanocomposites

 , ,
, ,
Abstract
:1. Introduction
2. Results and Discussion
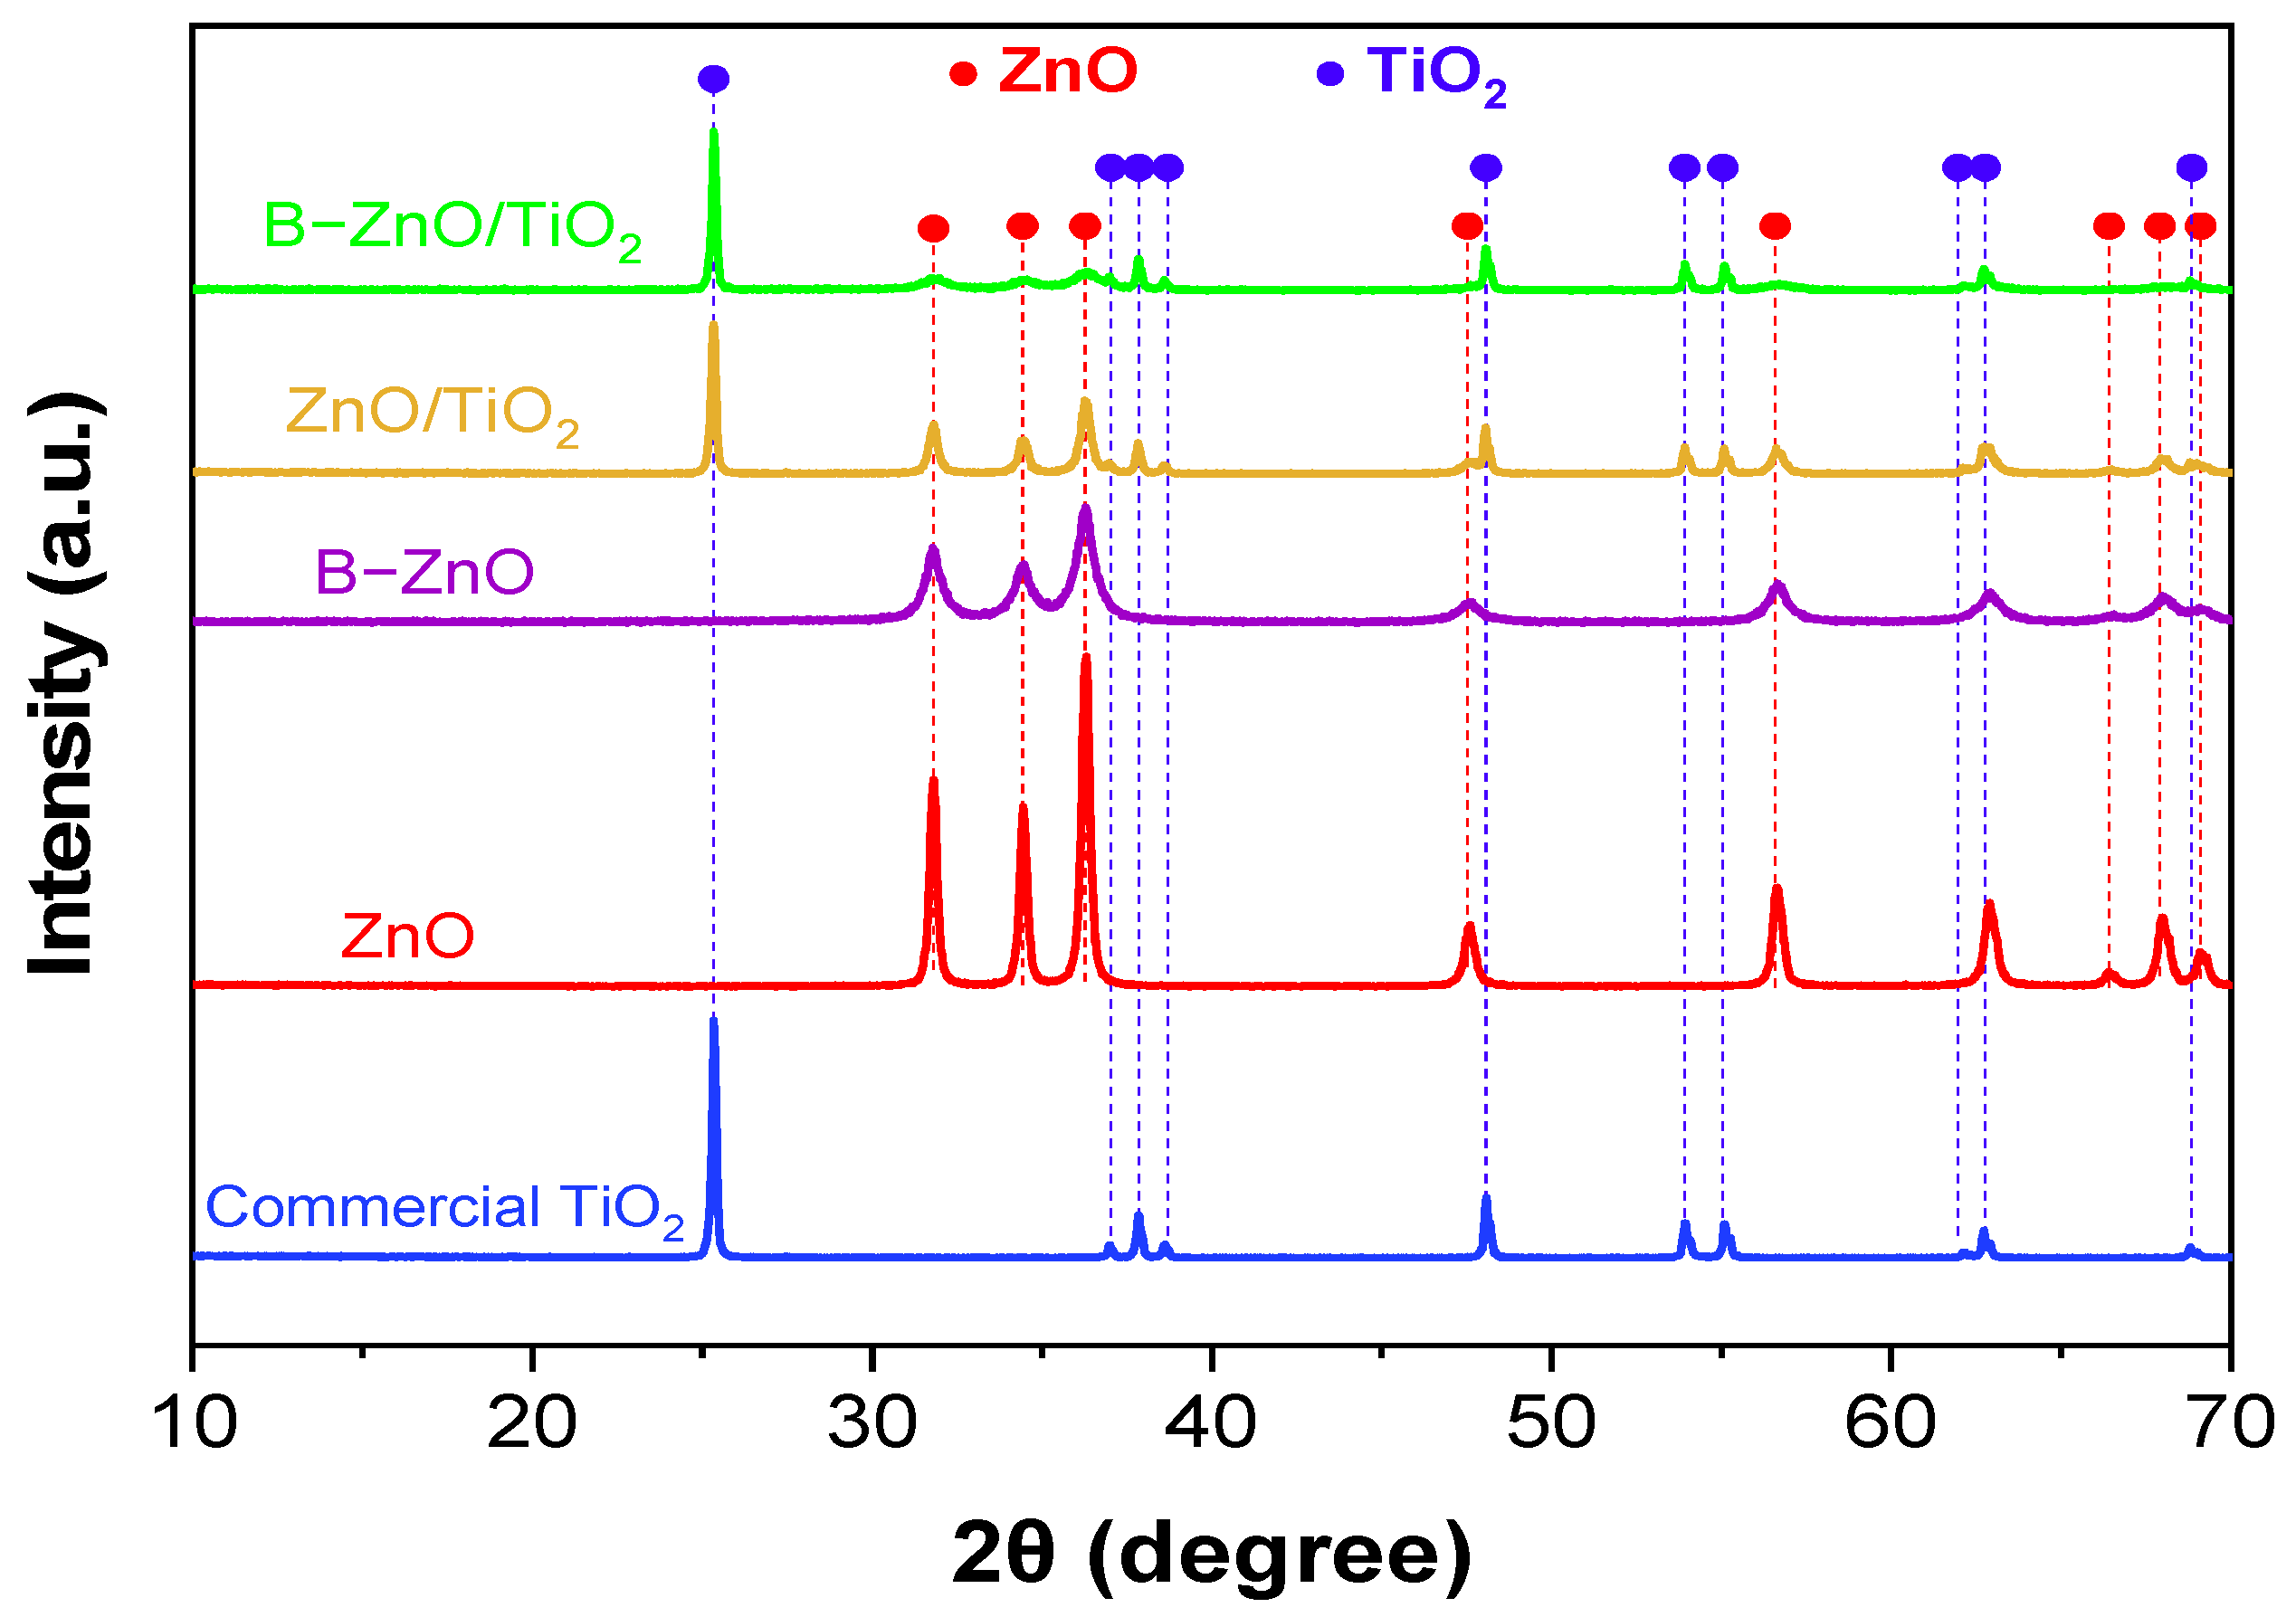
2.1. XRD Study
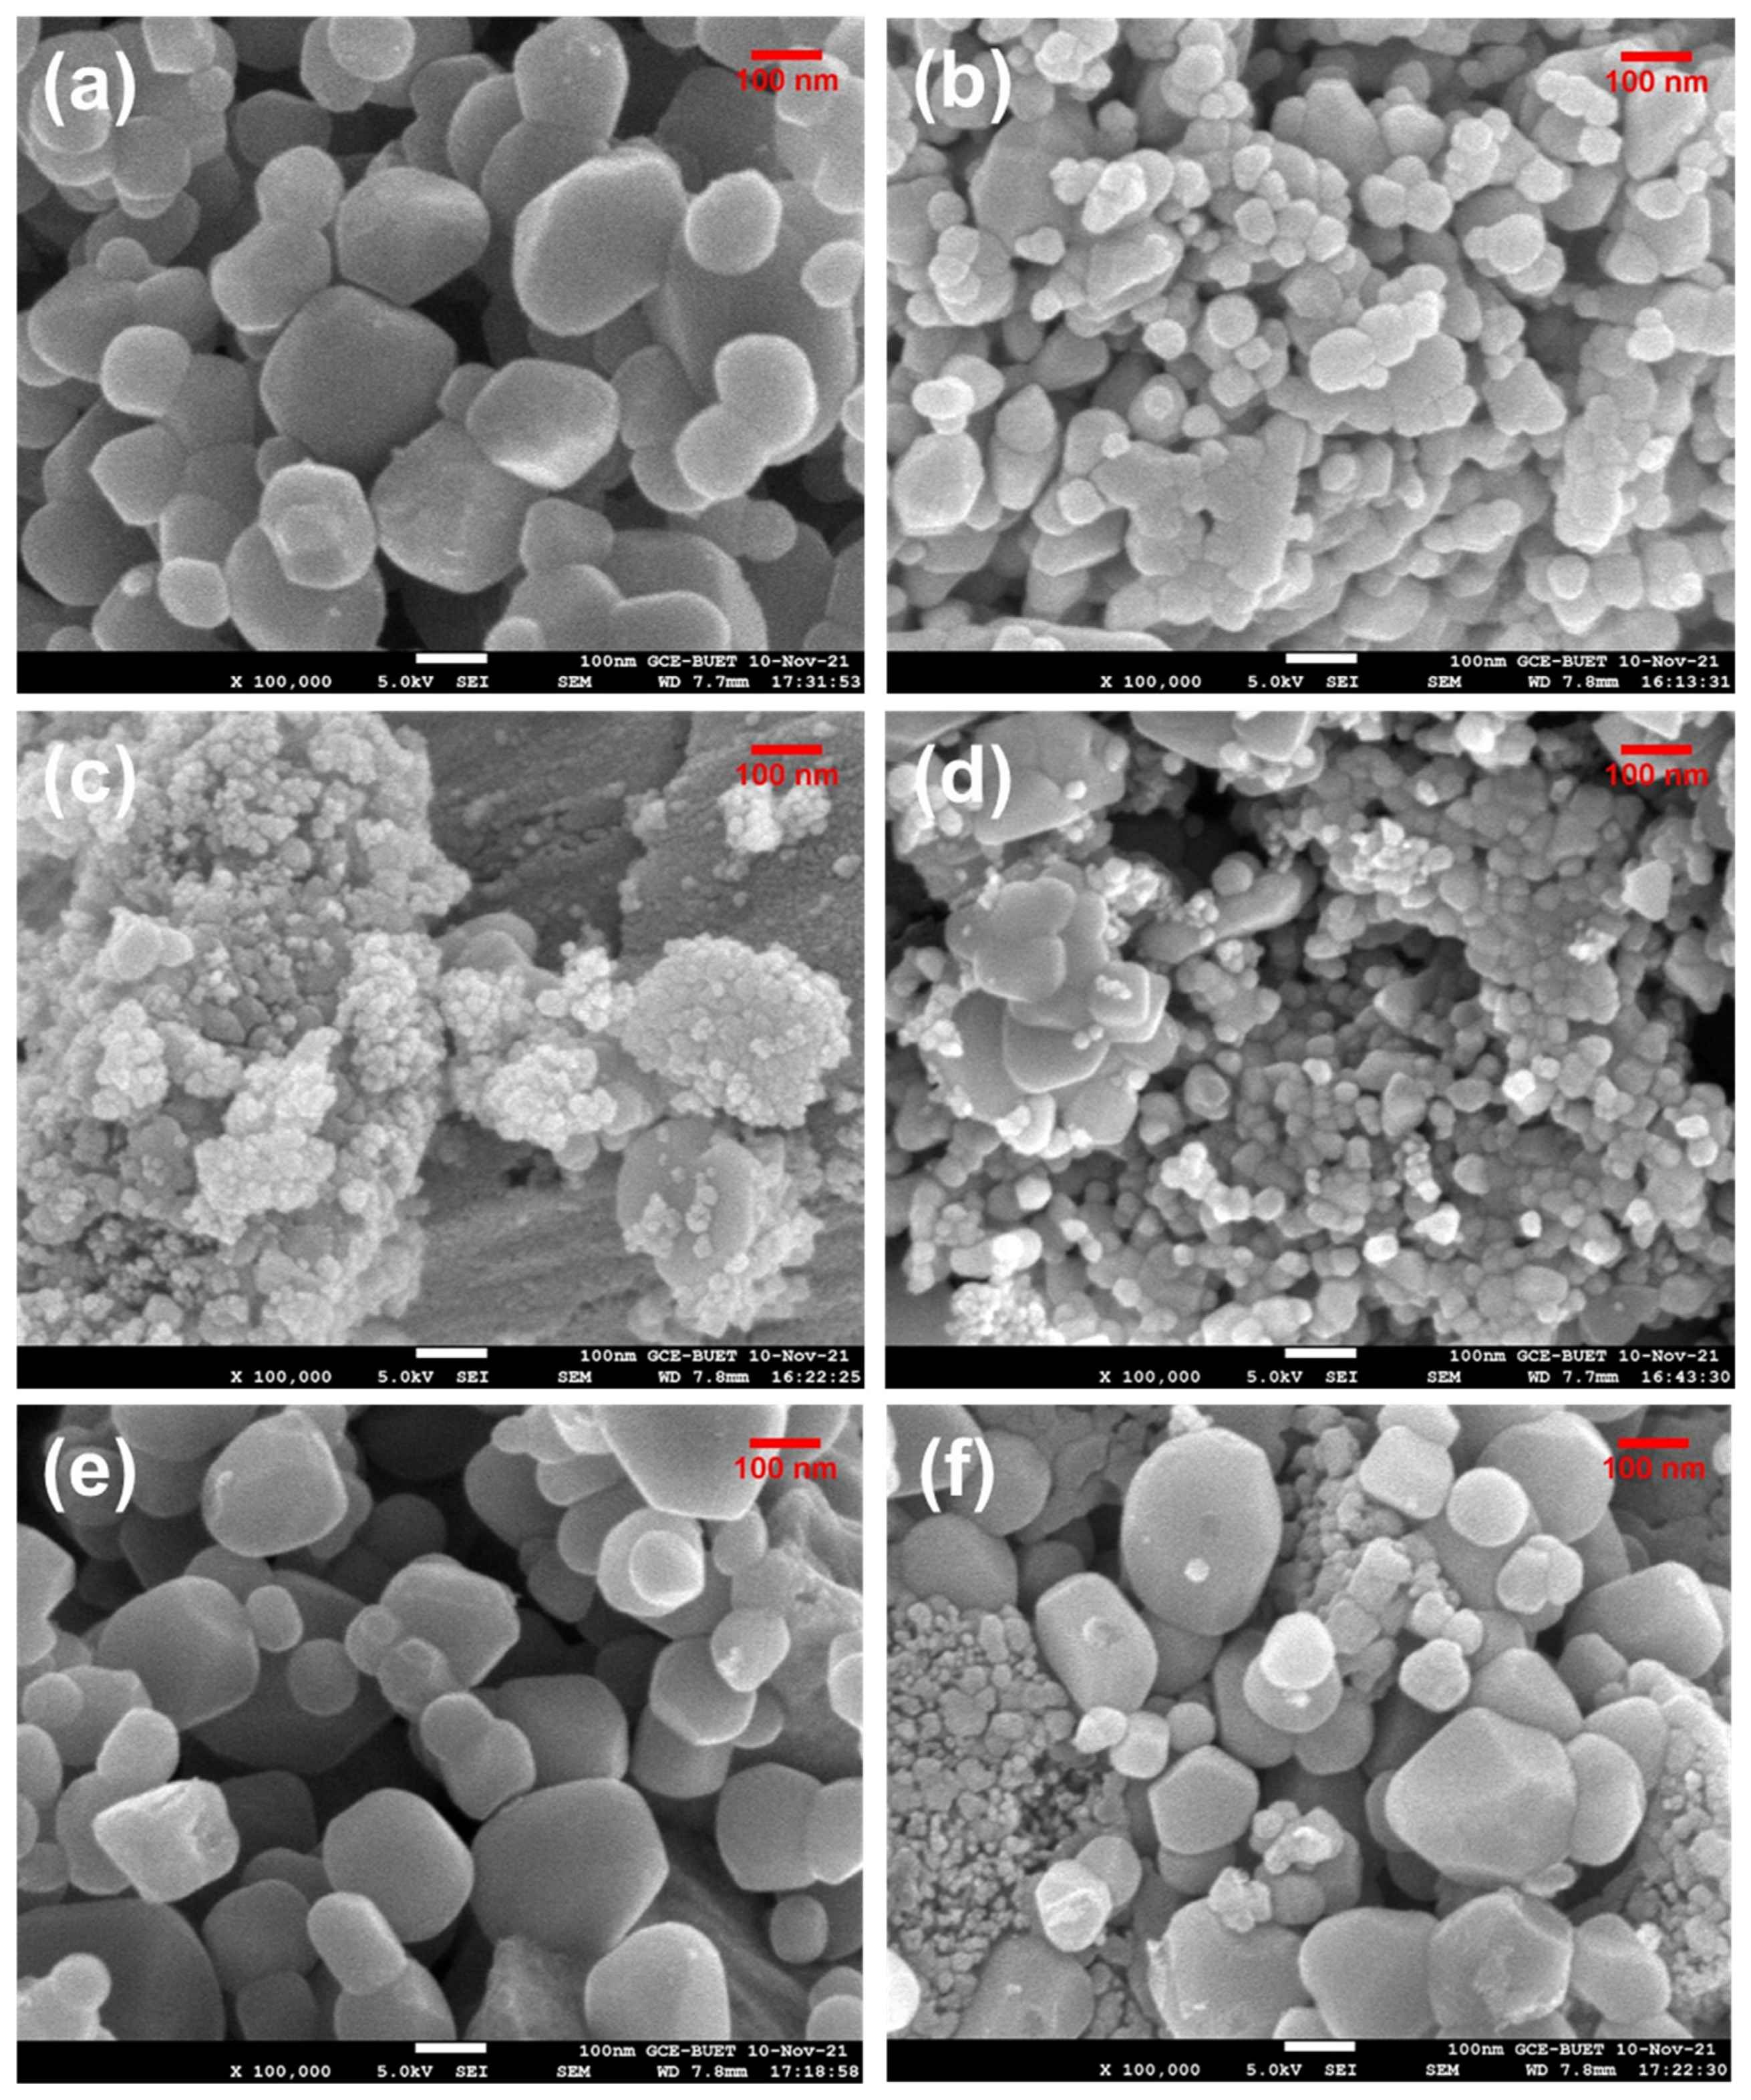
2.2. FESEM Study
2.3. SEM and EDS Mapping Study
2.4. EDS Study
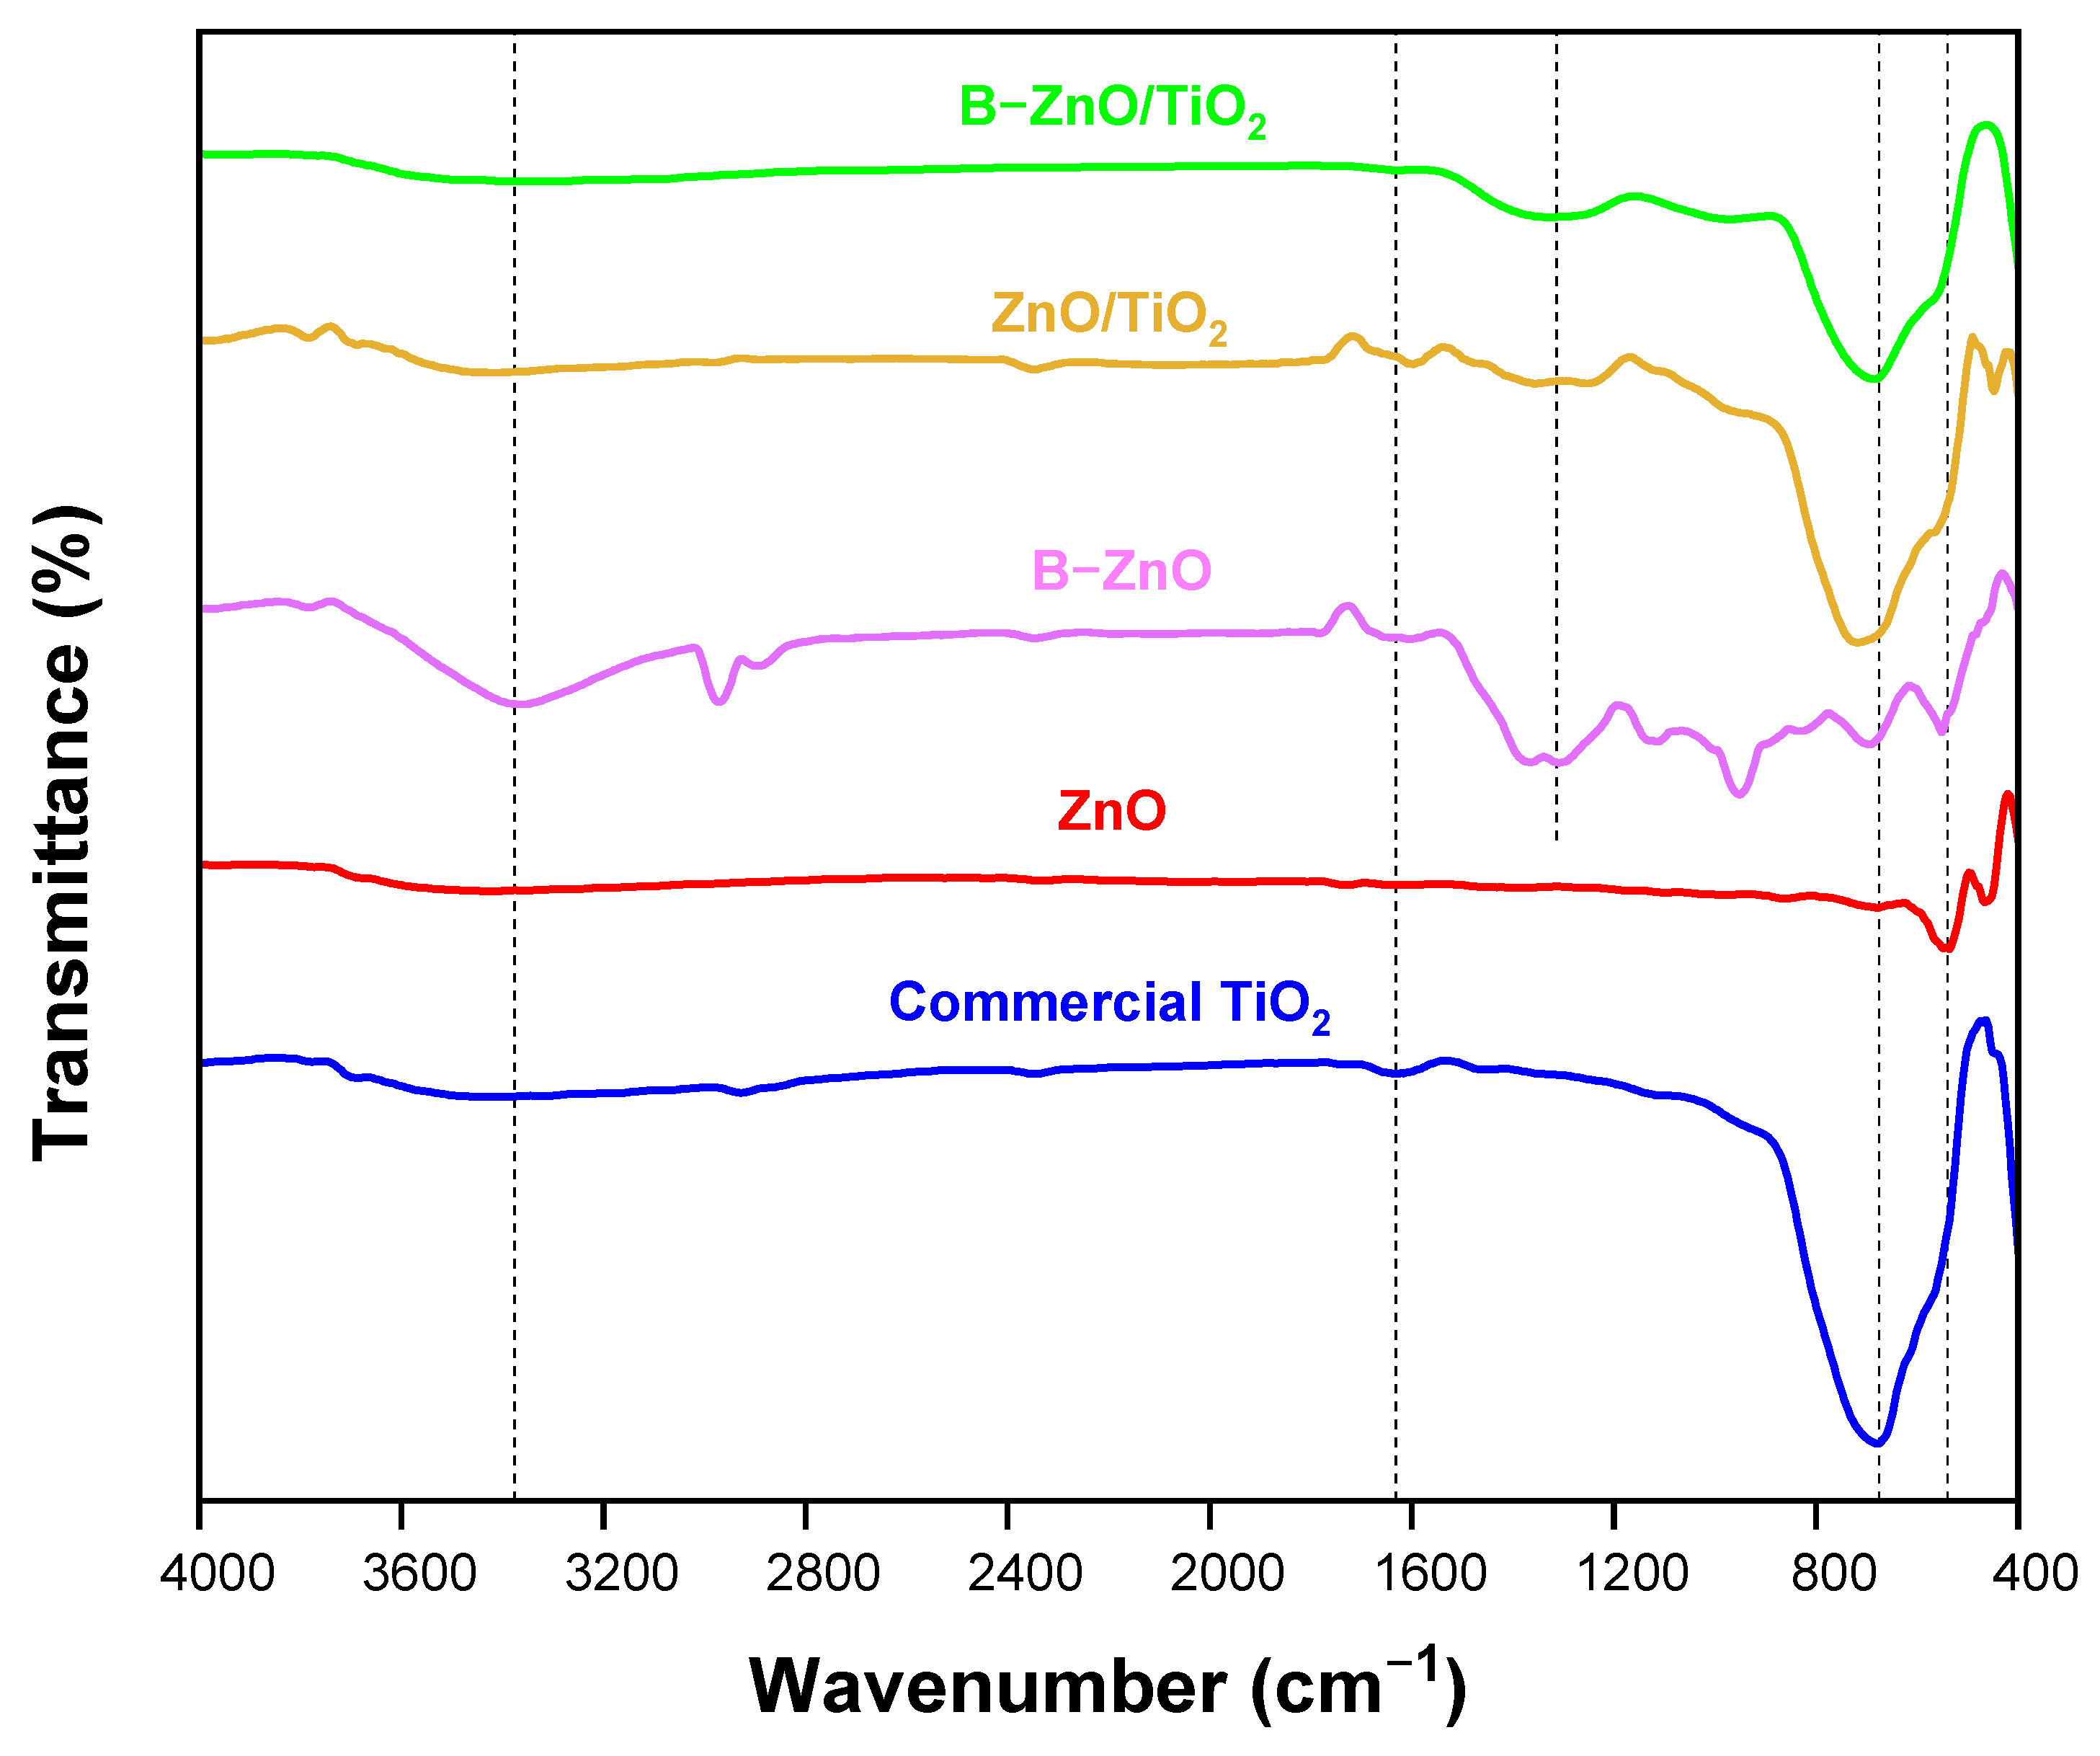
2.5. FTIR Study
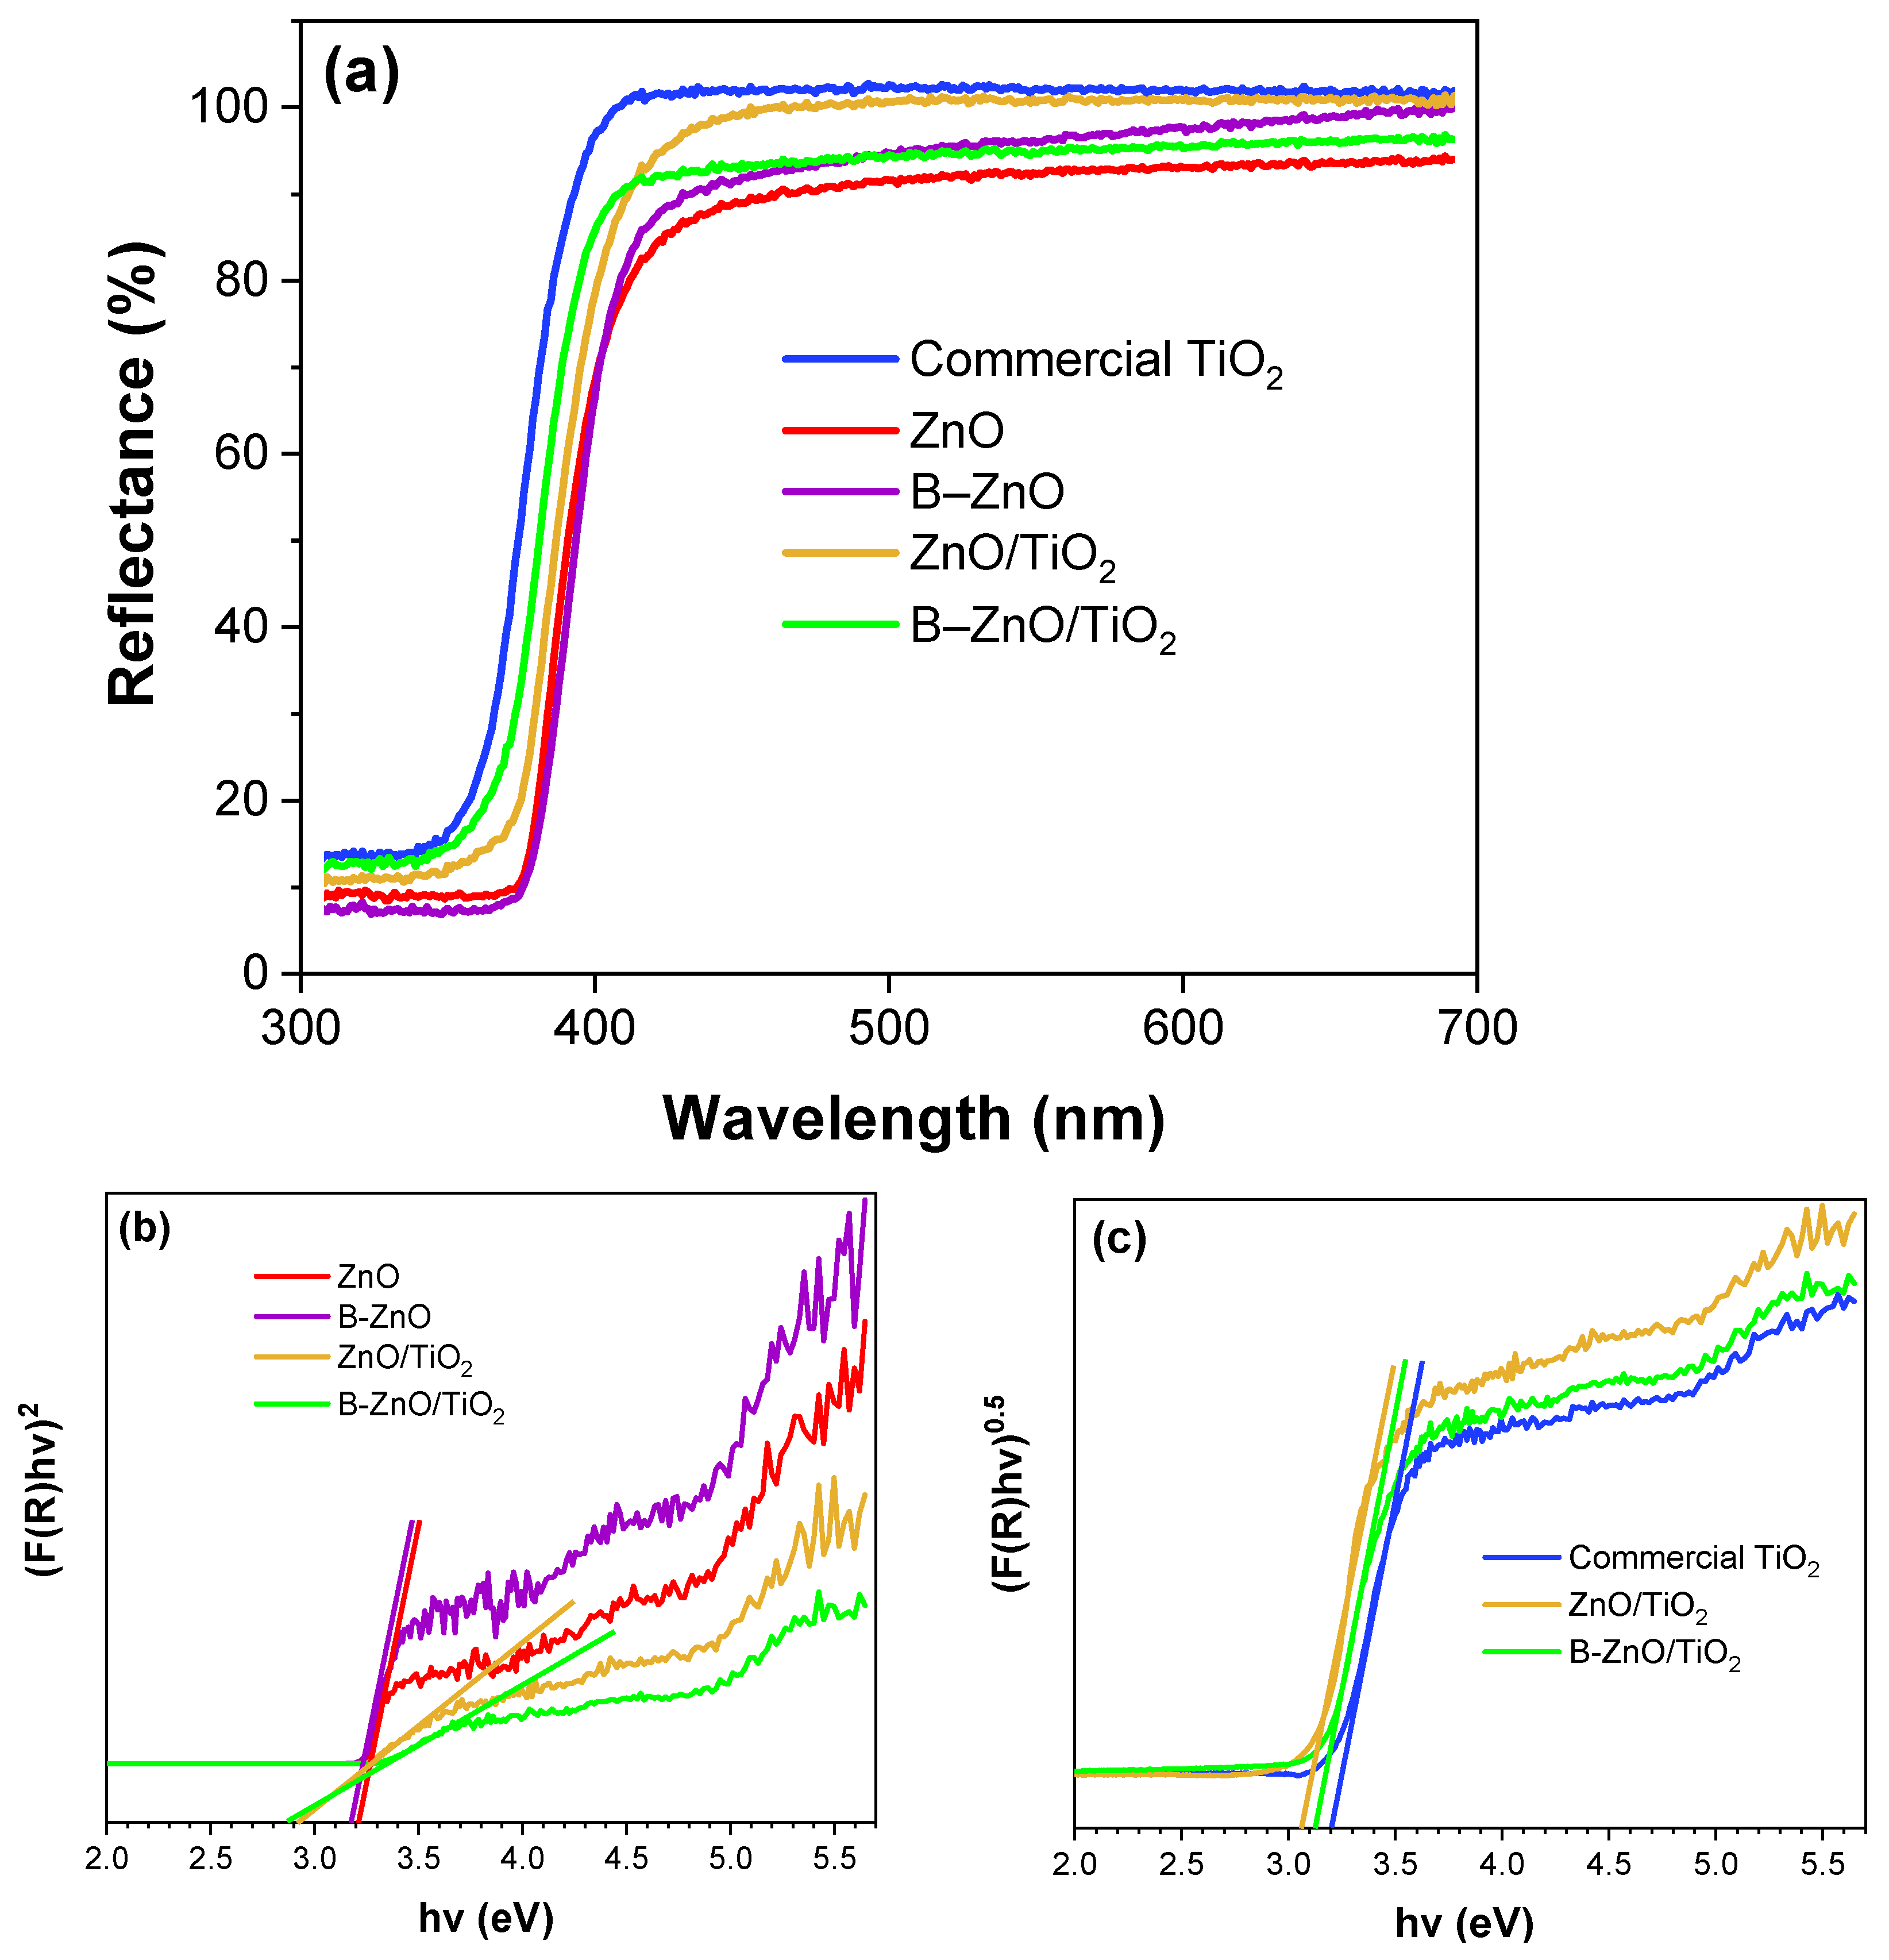
2.6. UV-Vis DRS Study
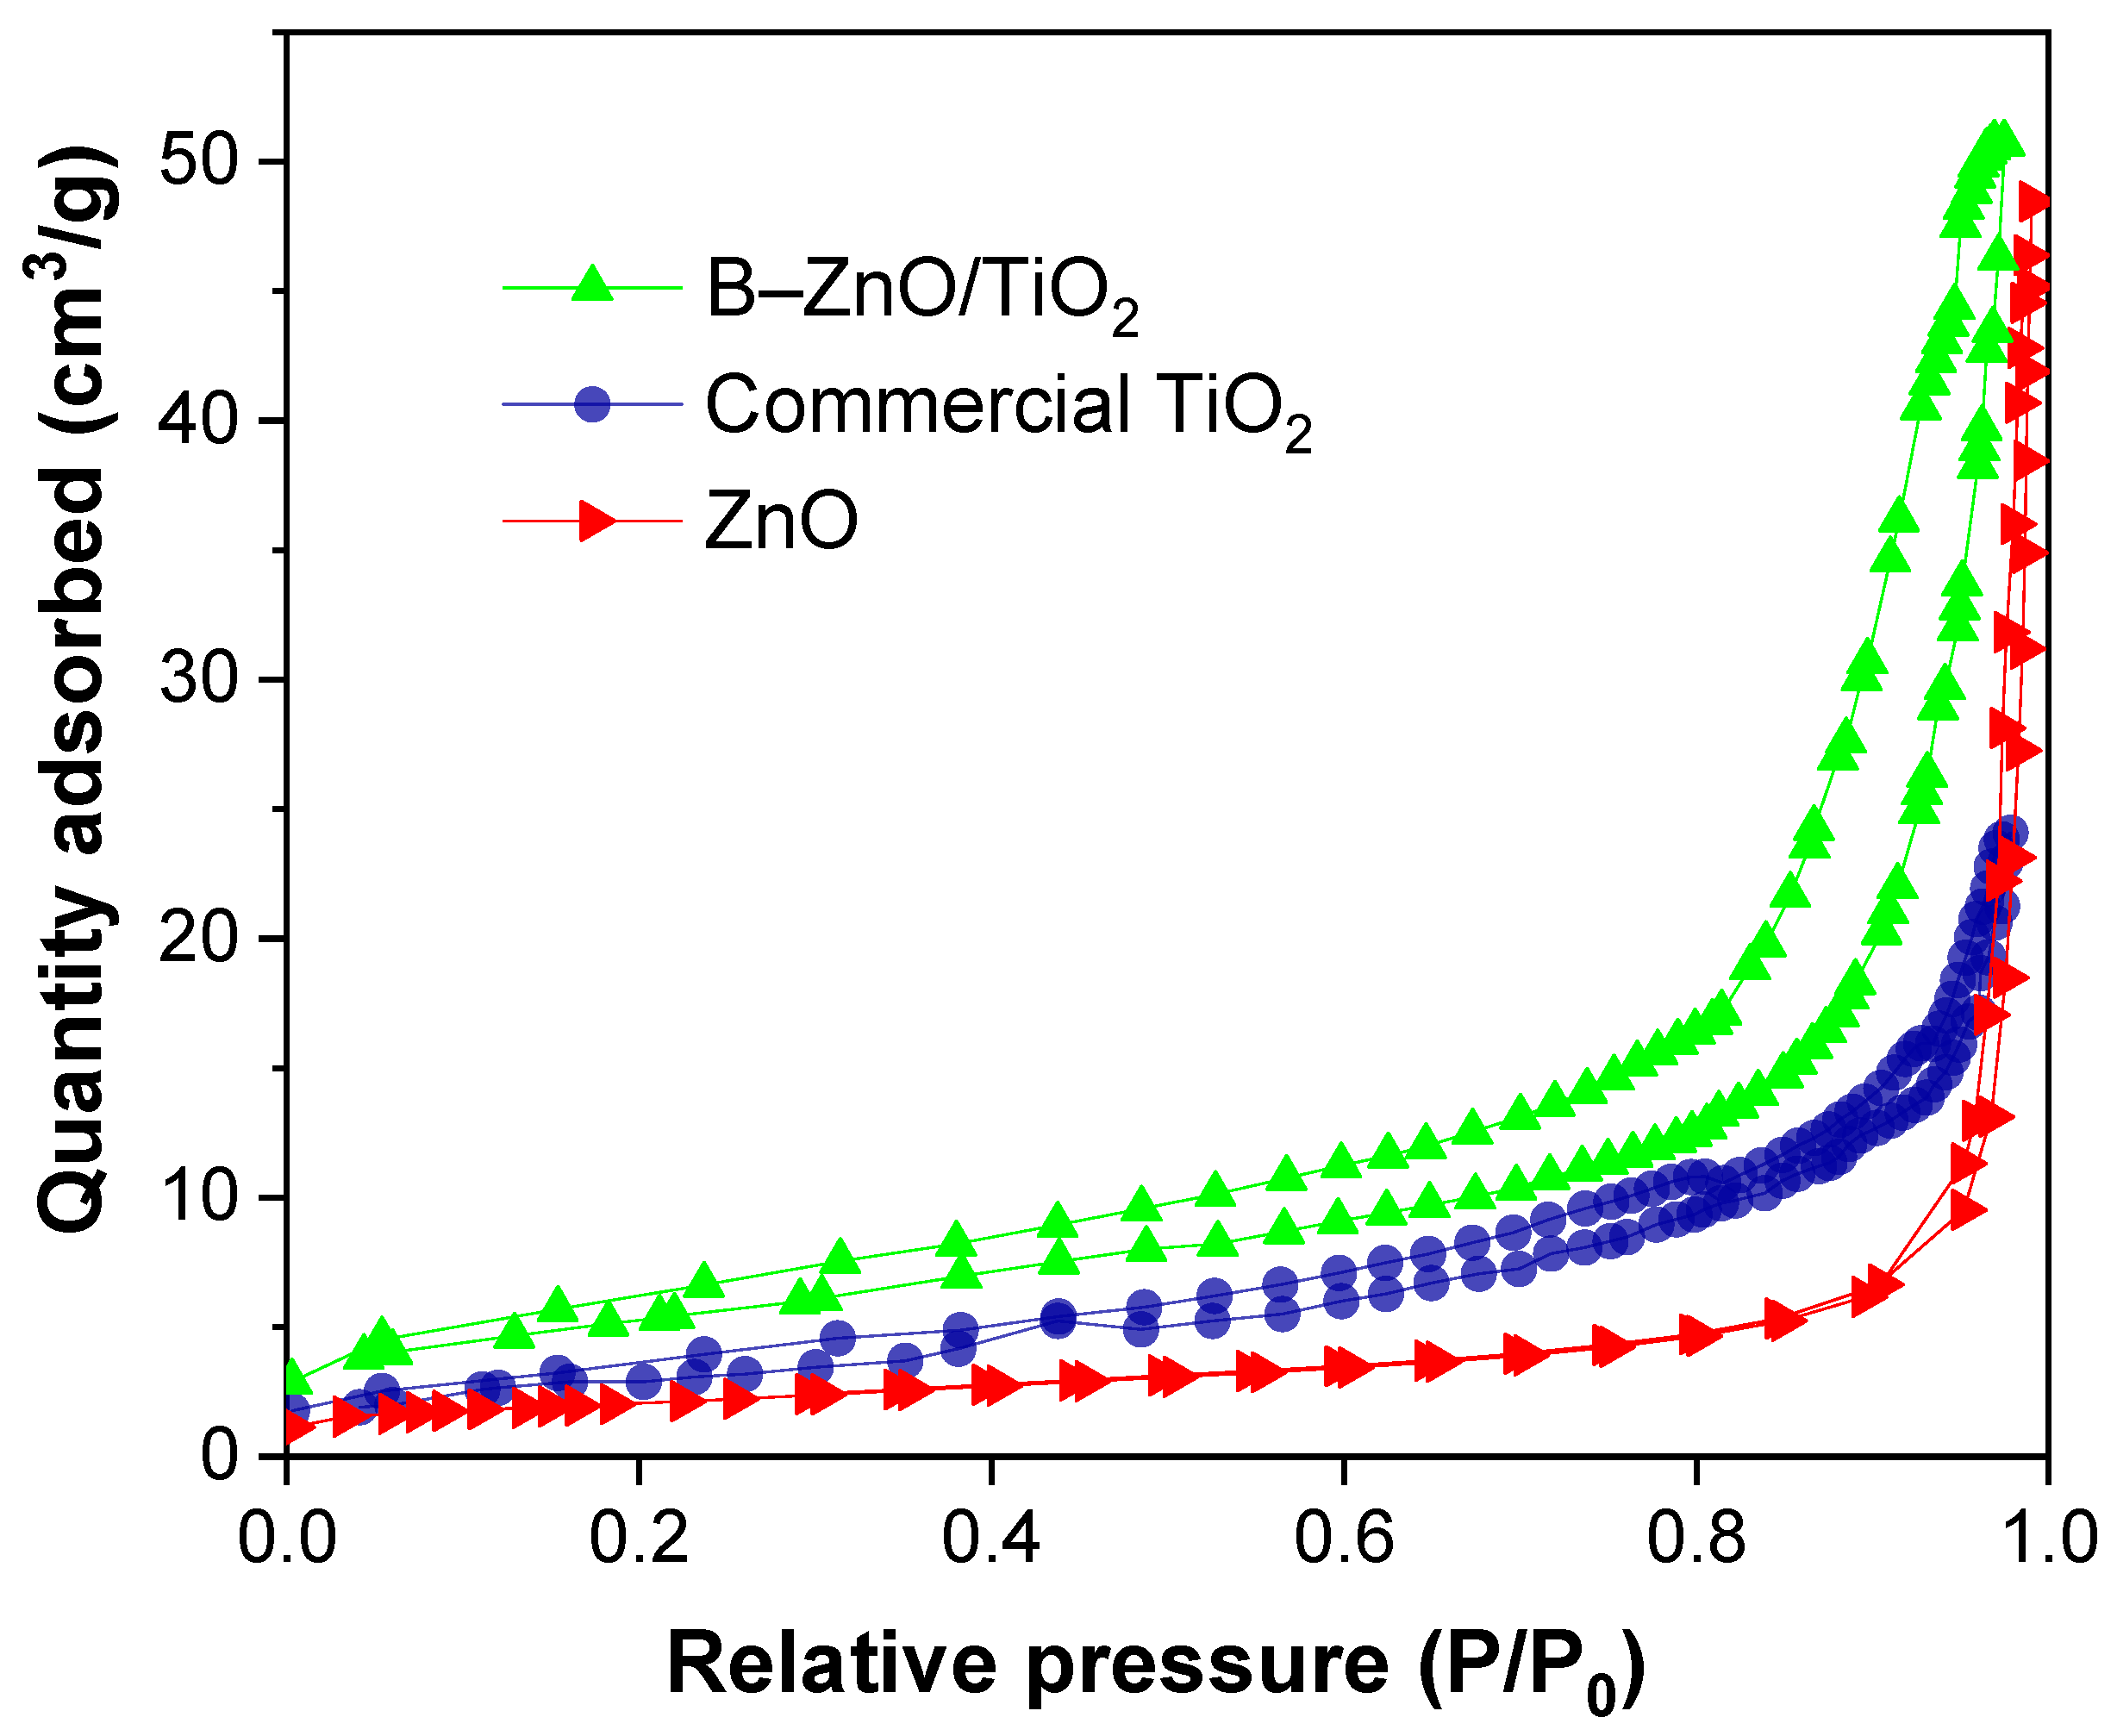
2.7. BET Study
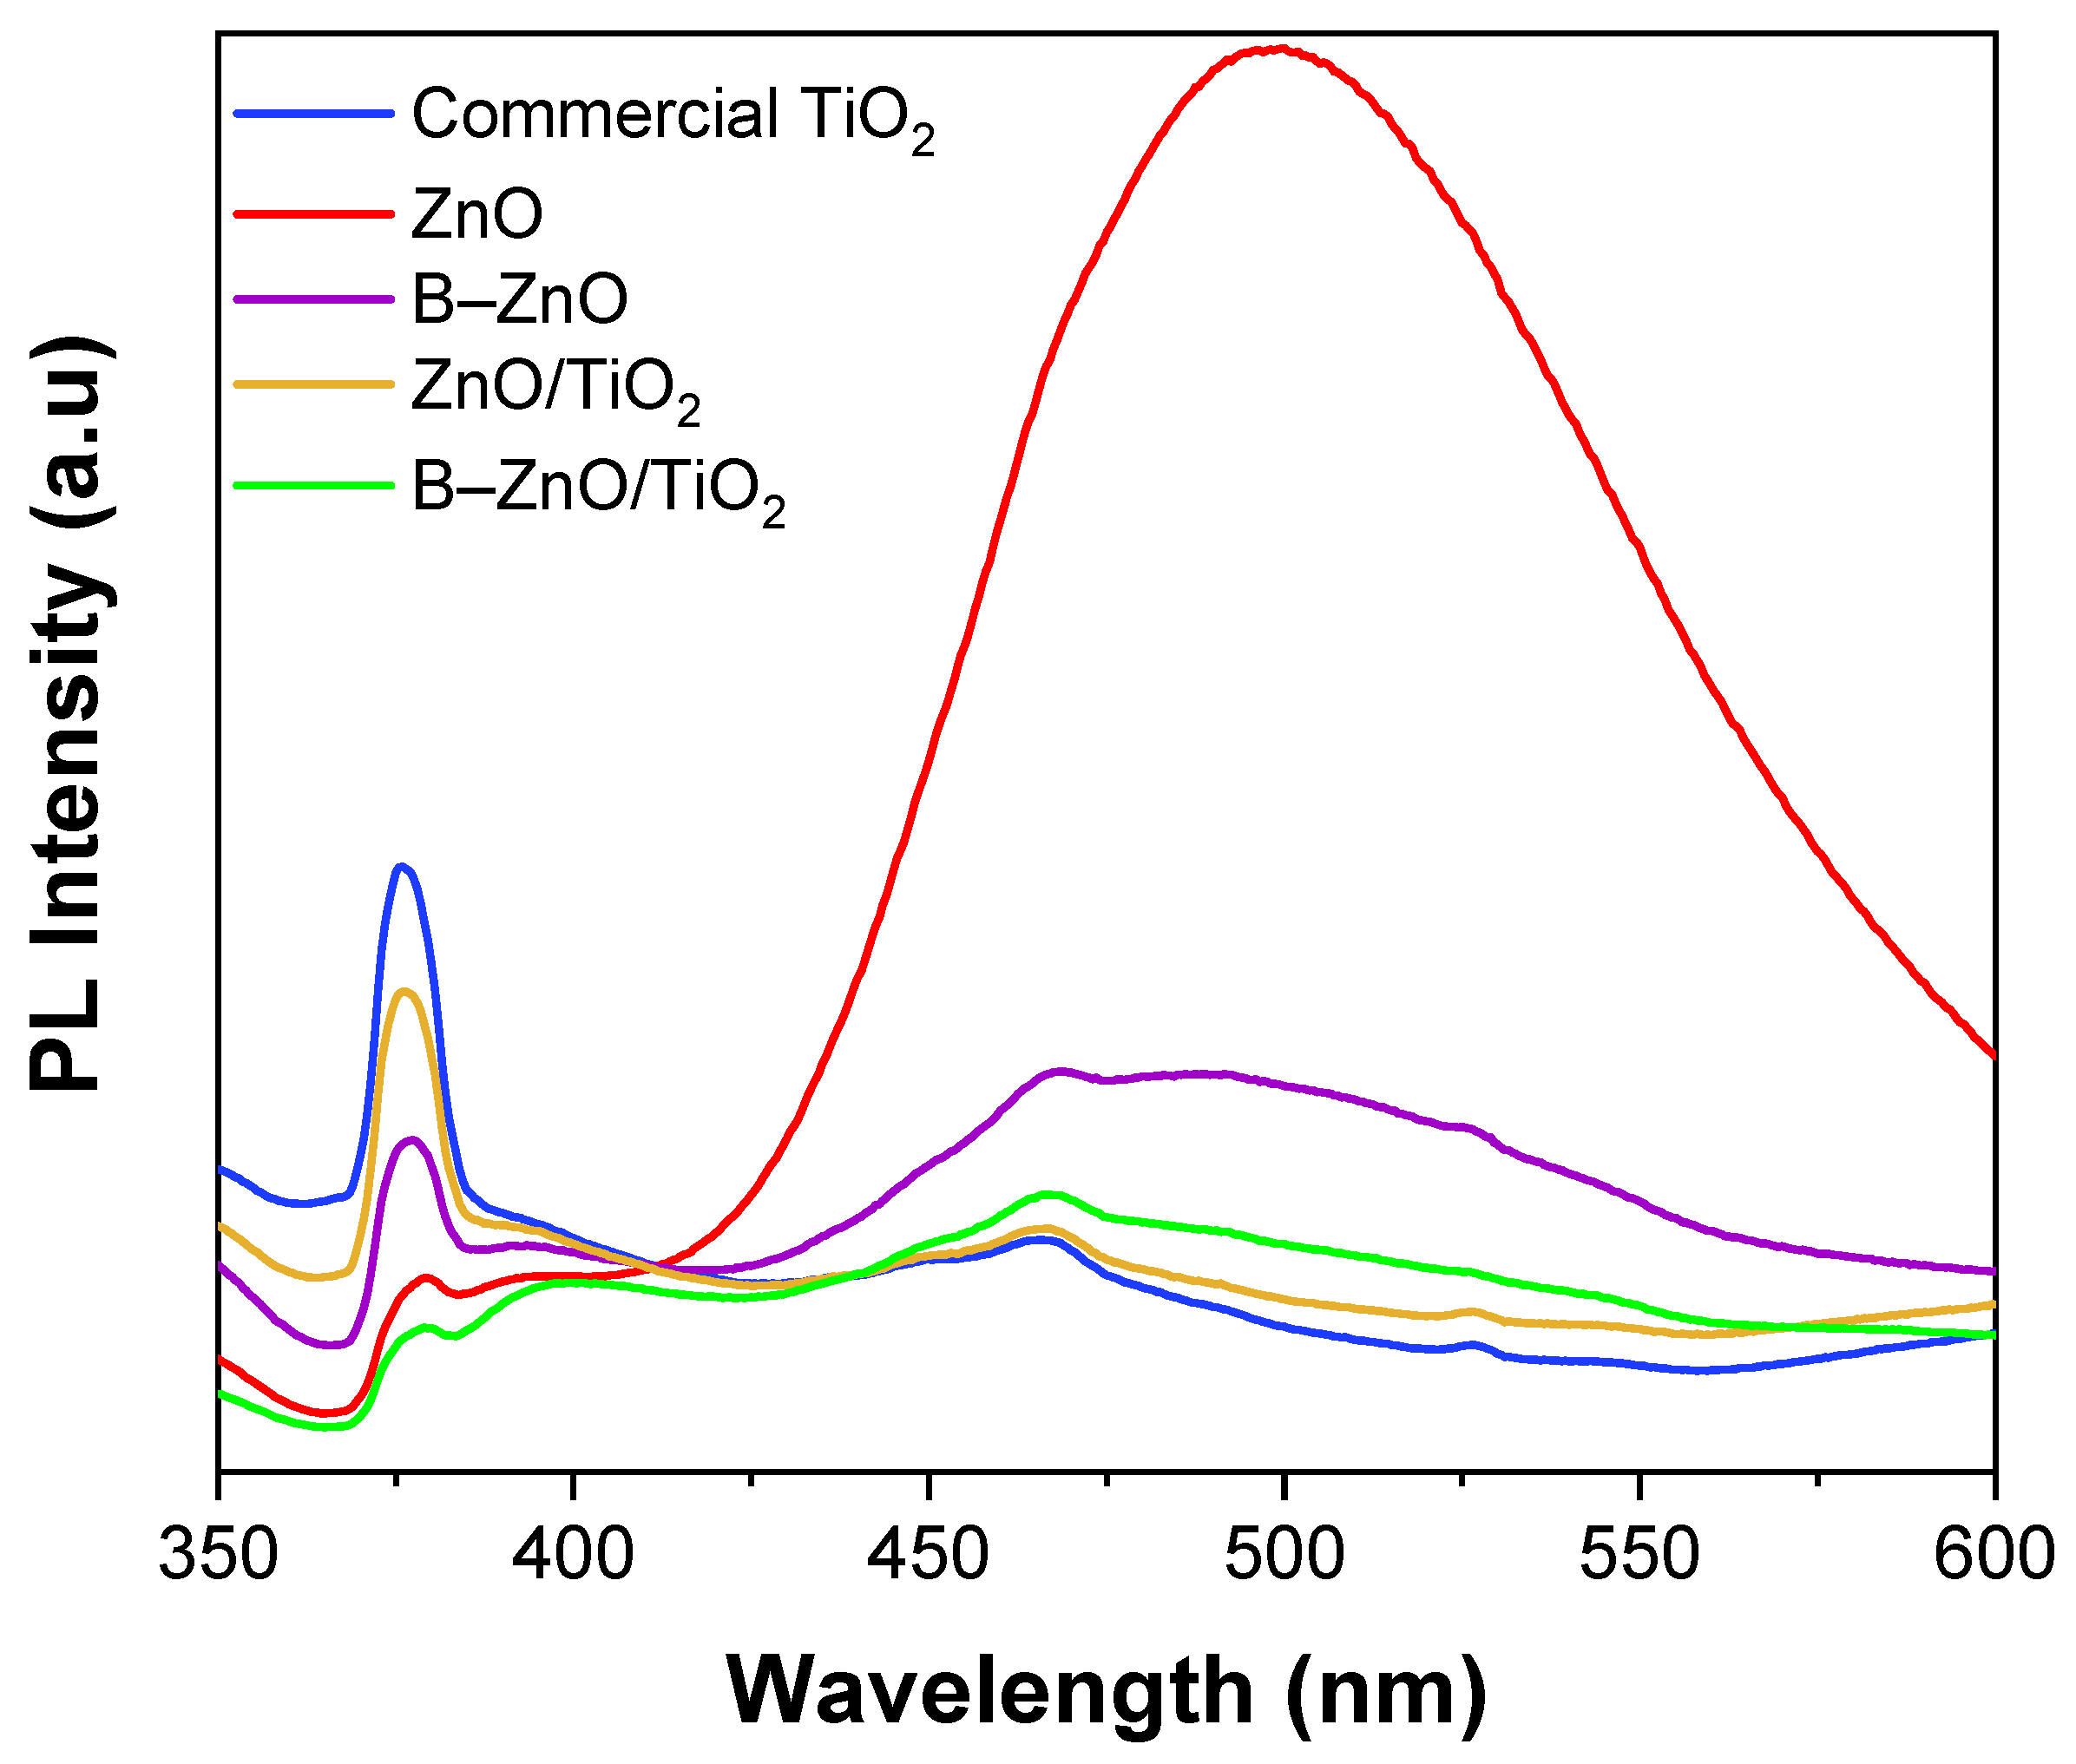
2.8. PL Study
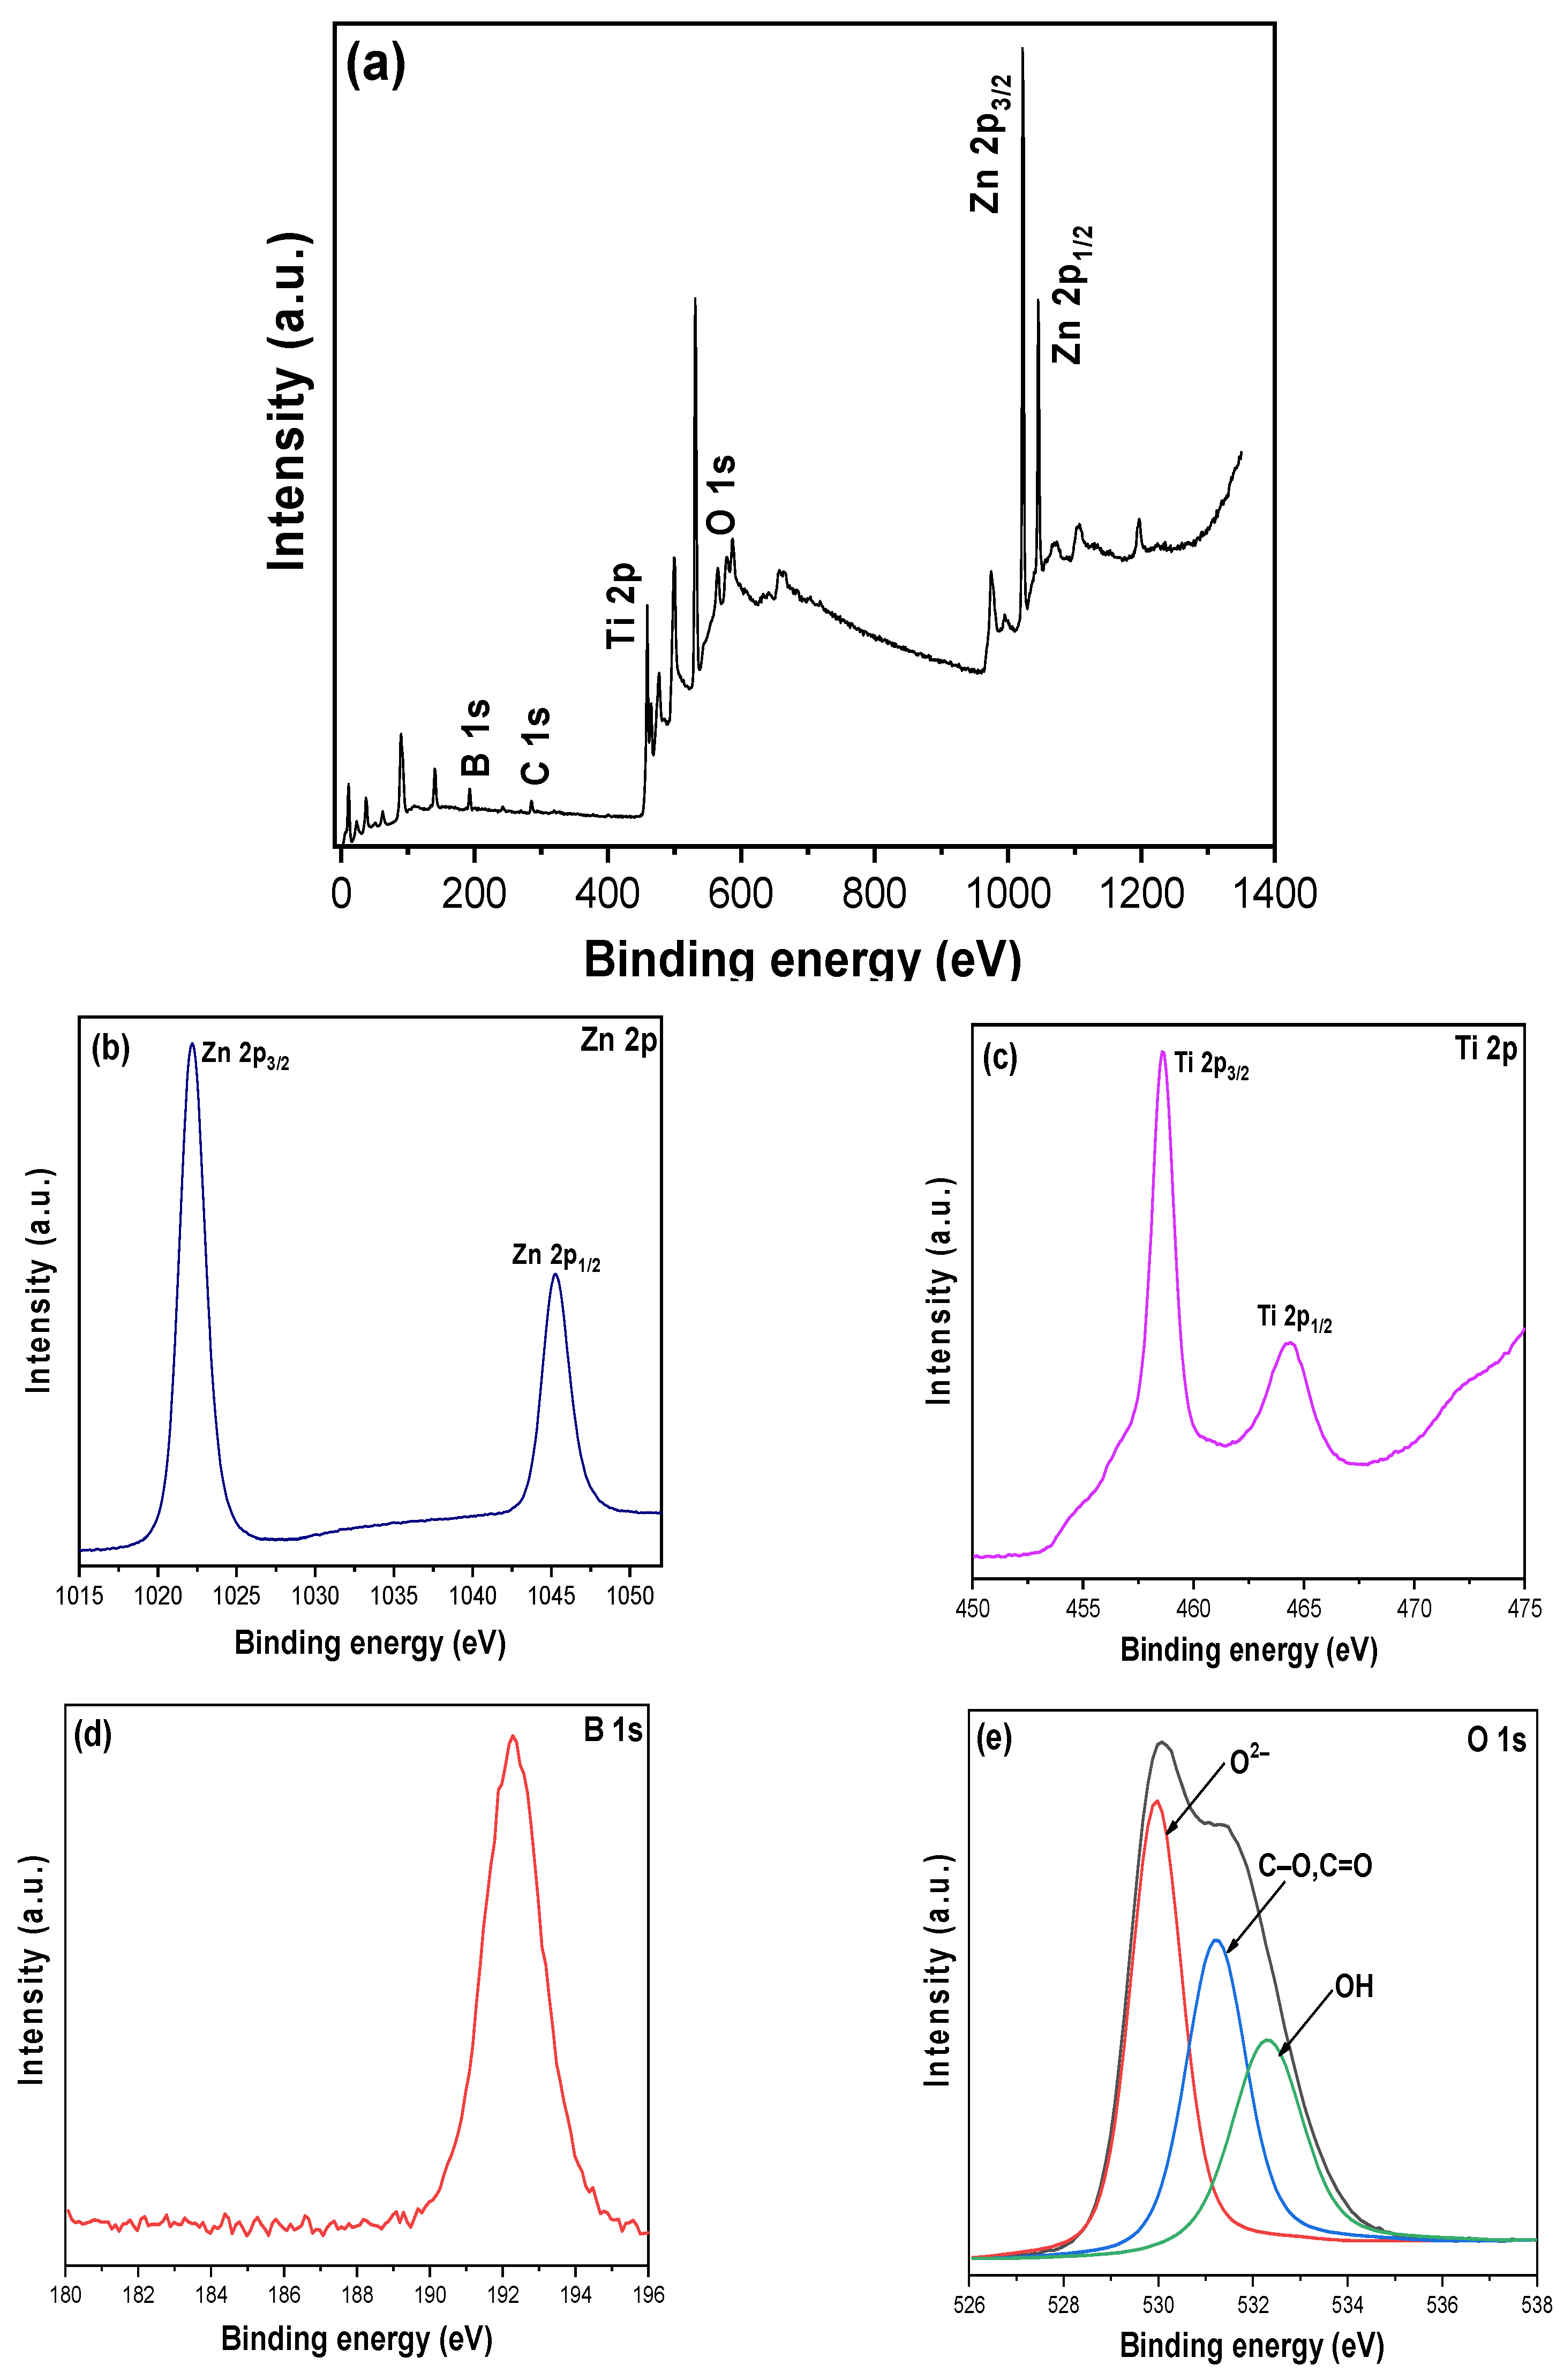
2.9. XPS Study
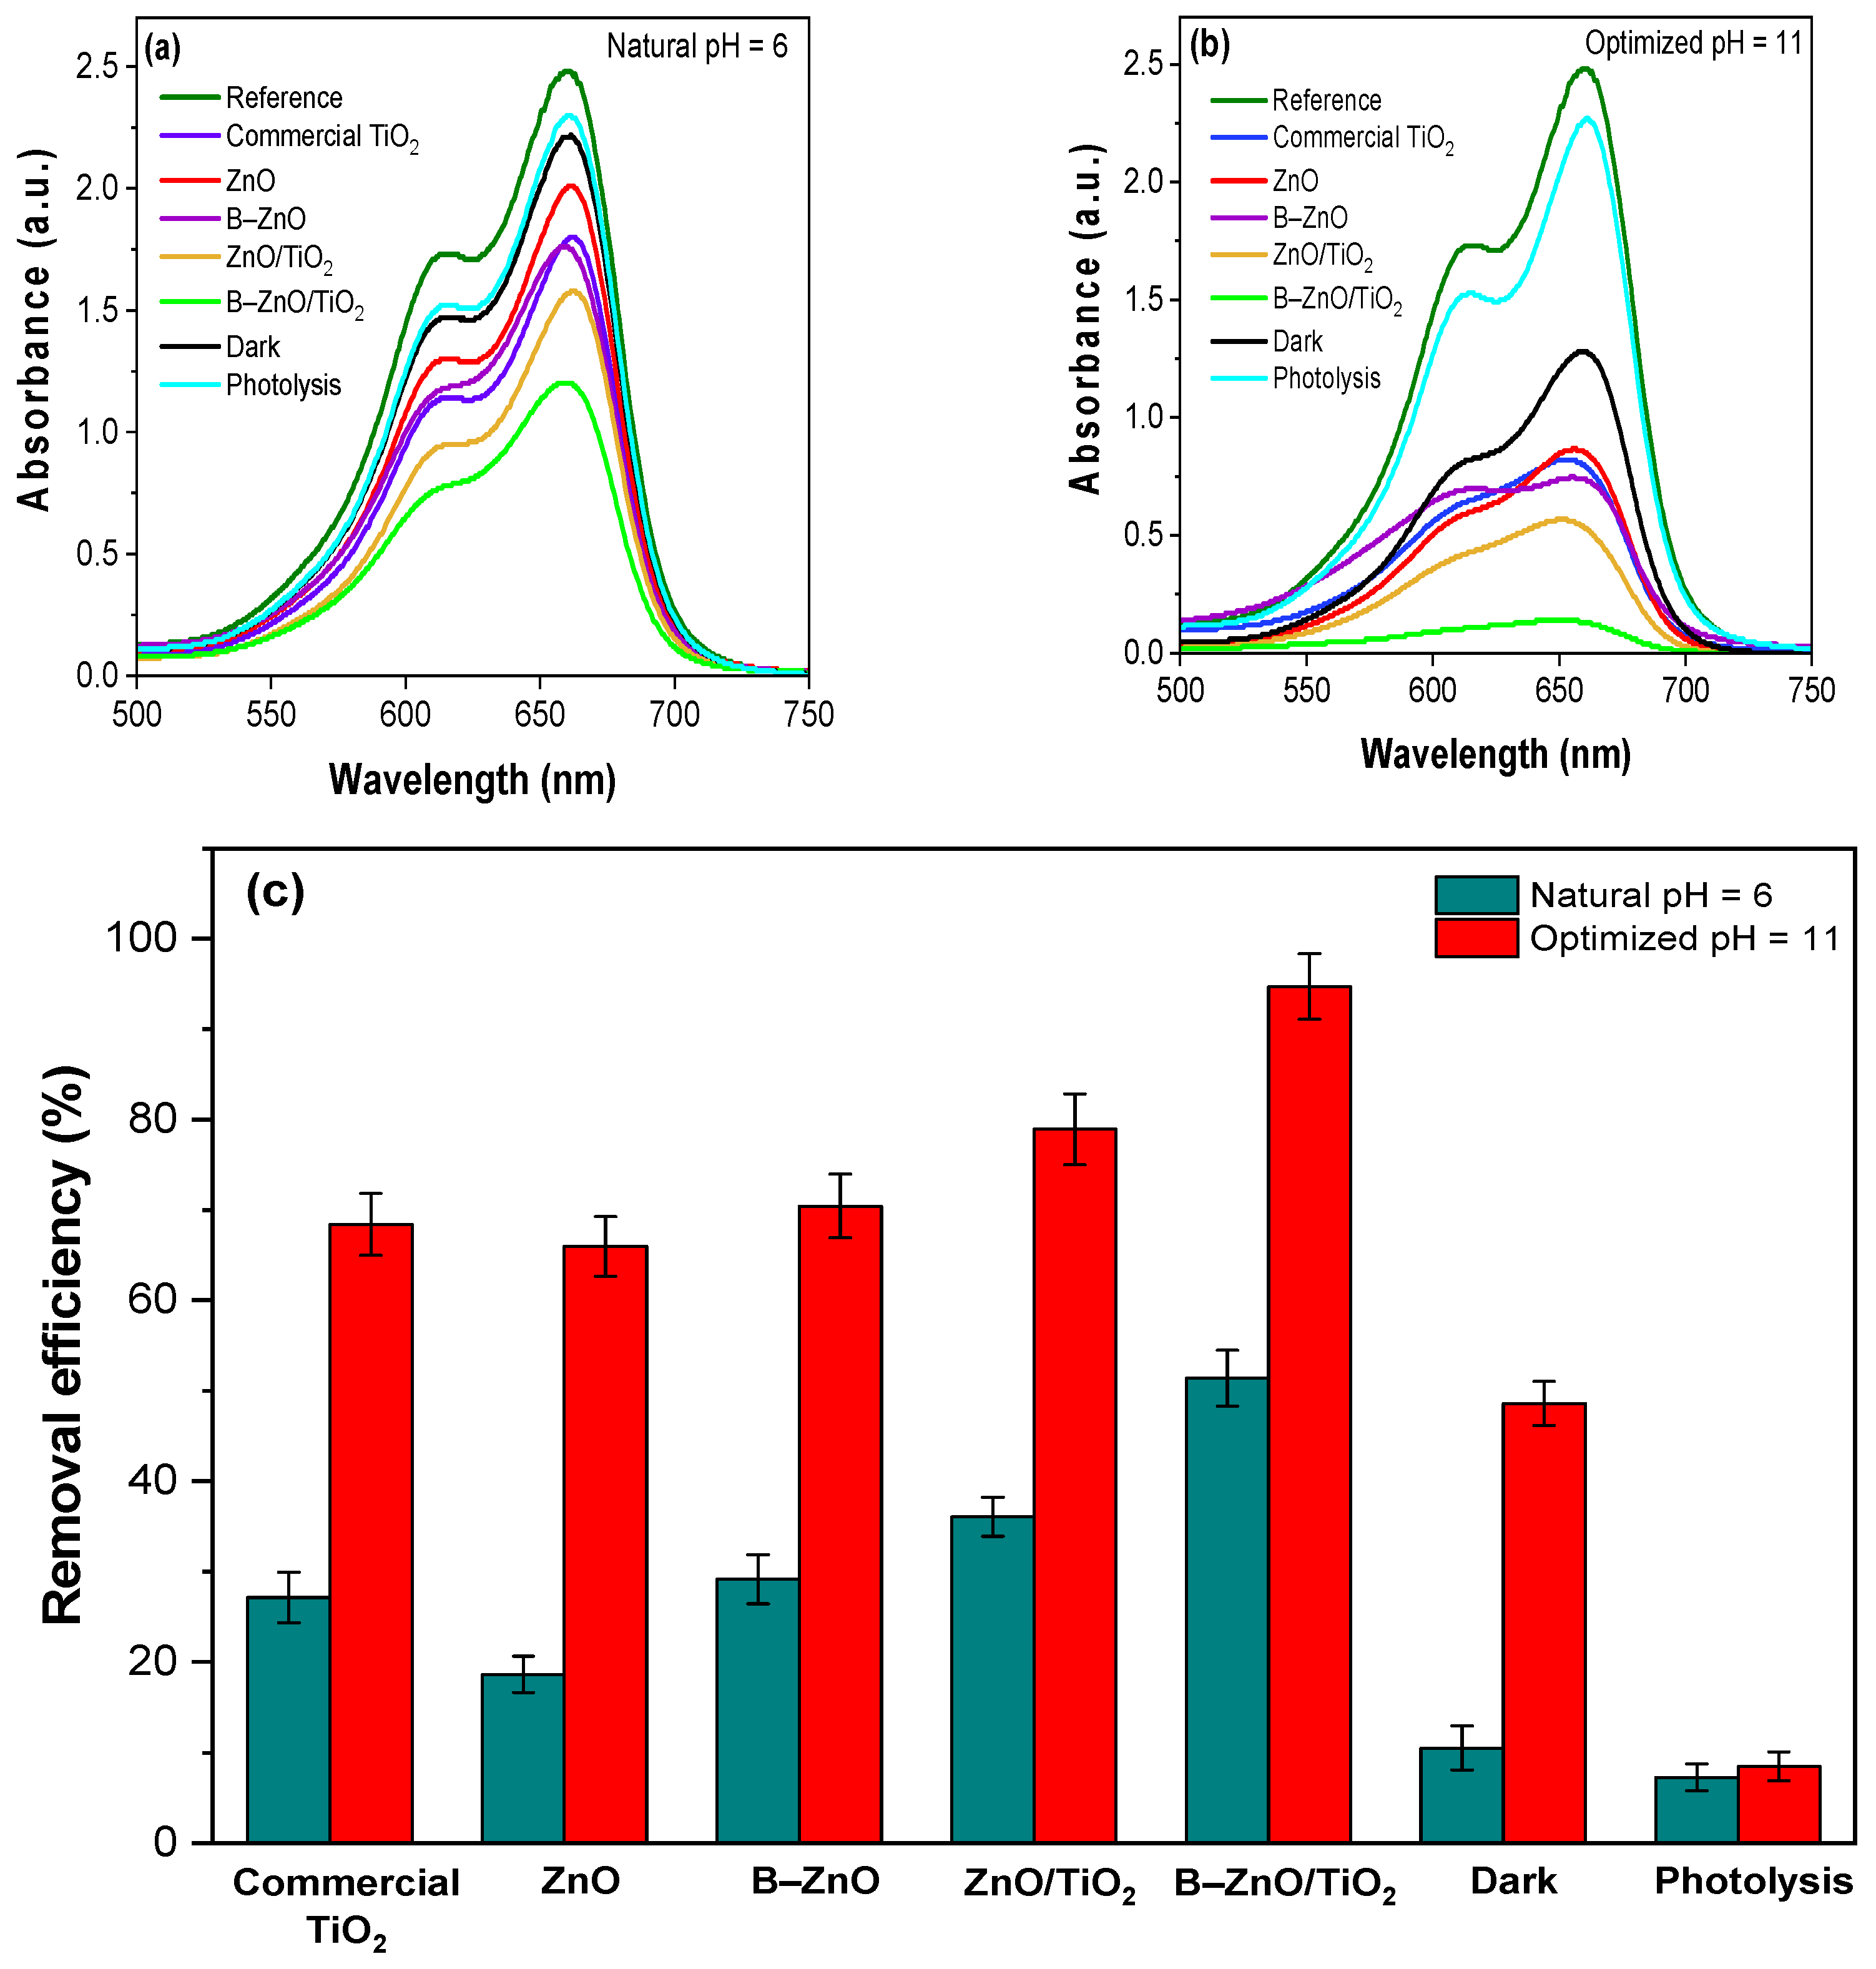
2.10. Photocatalytic Removal of MB Dye
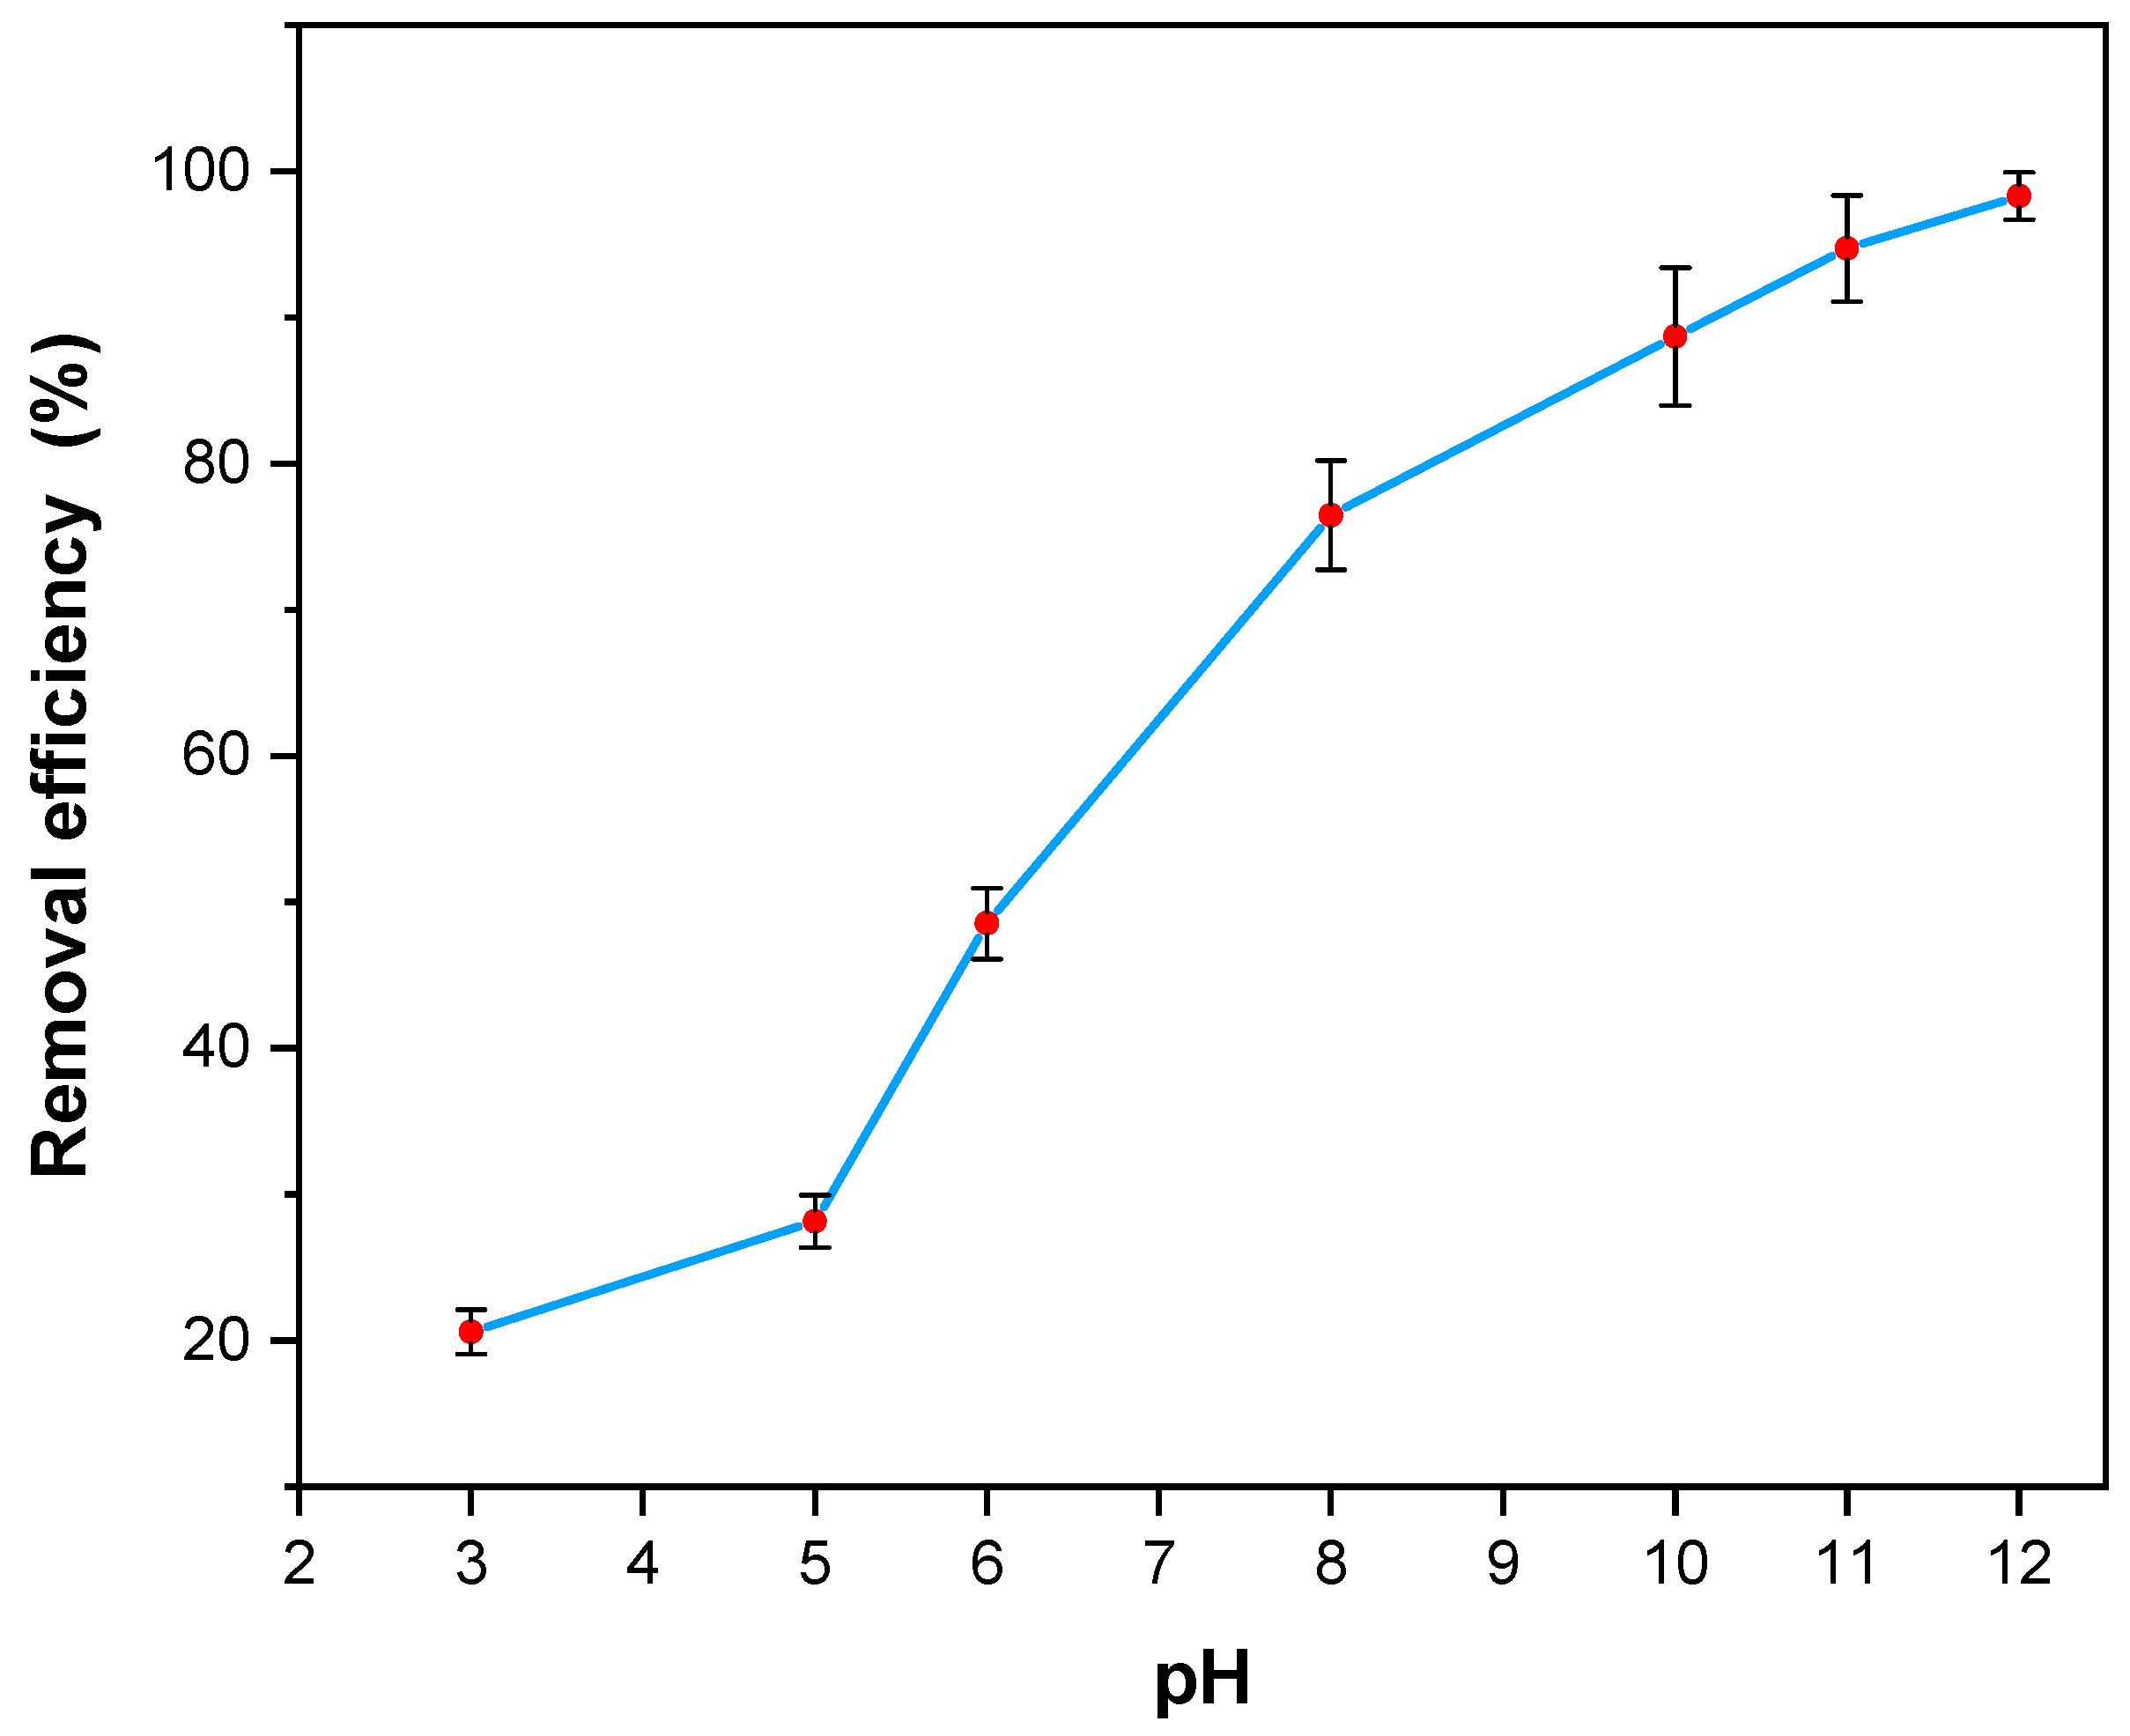
2.11. Effect of pH
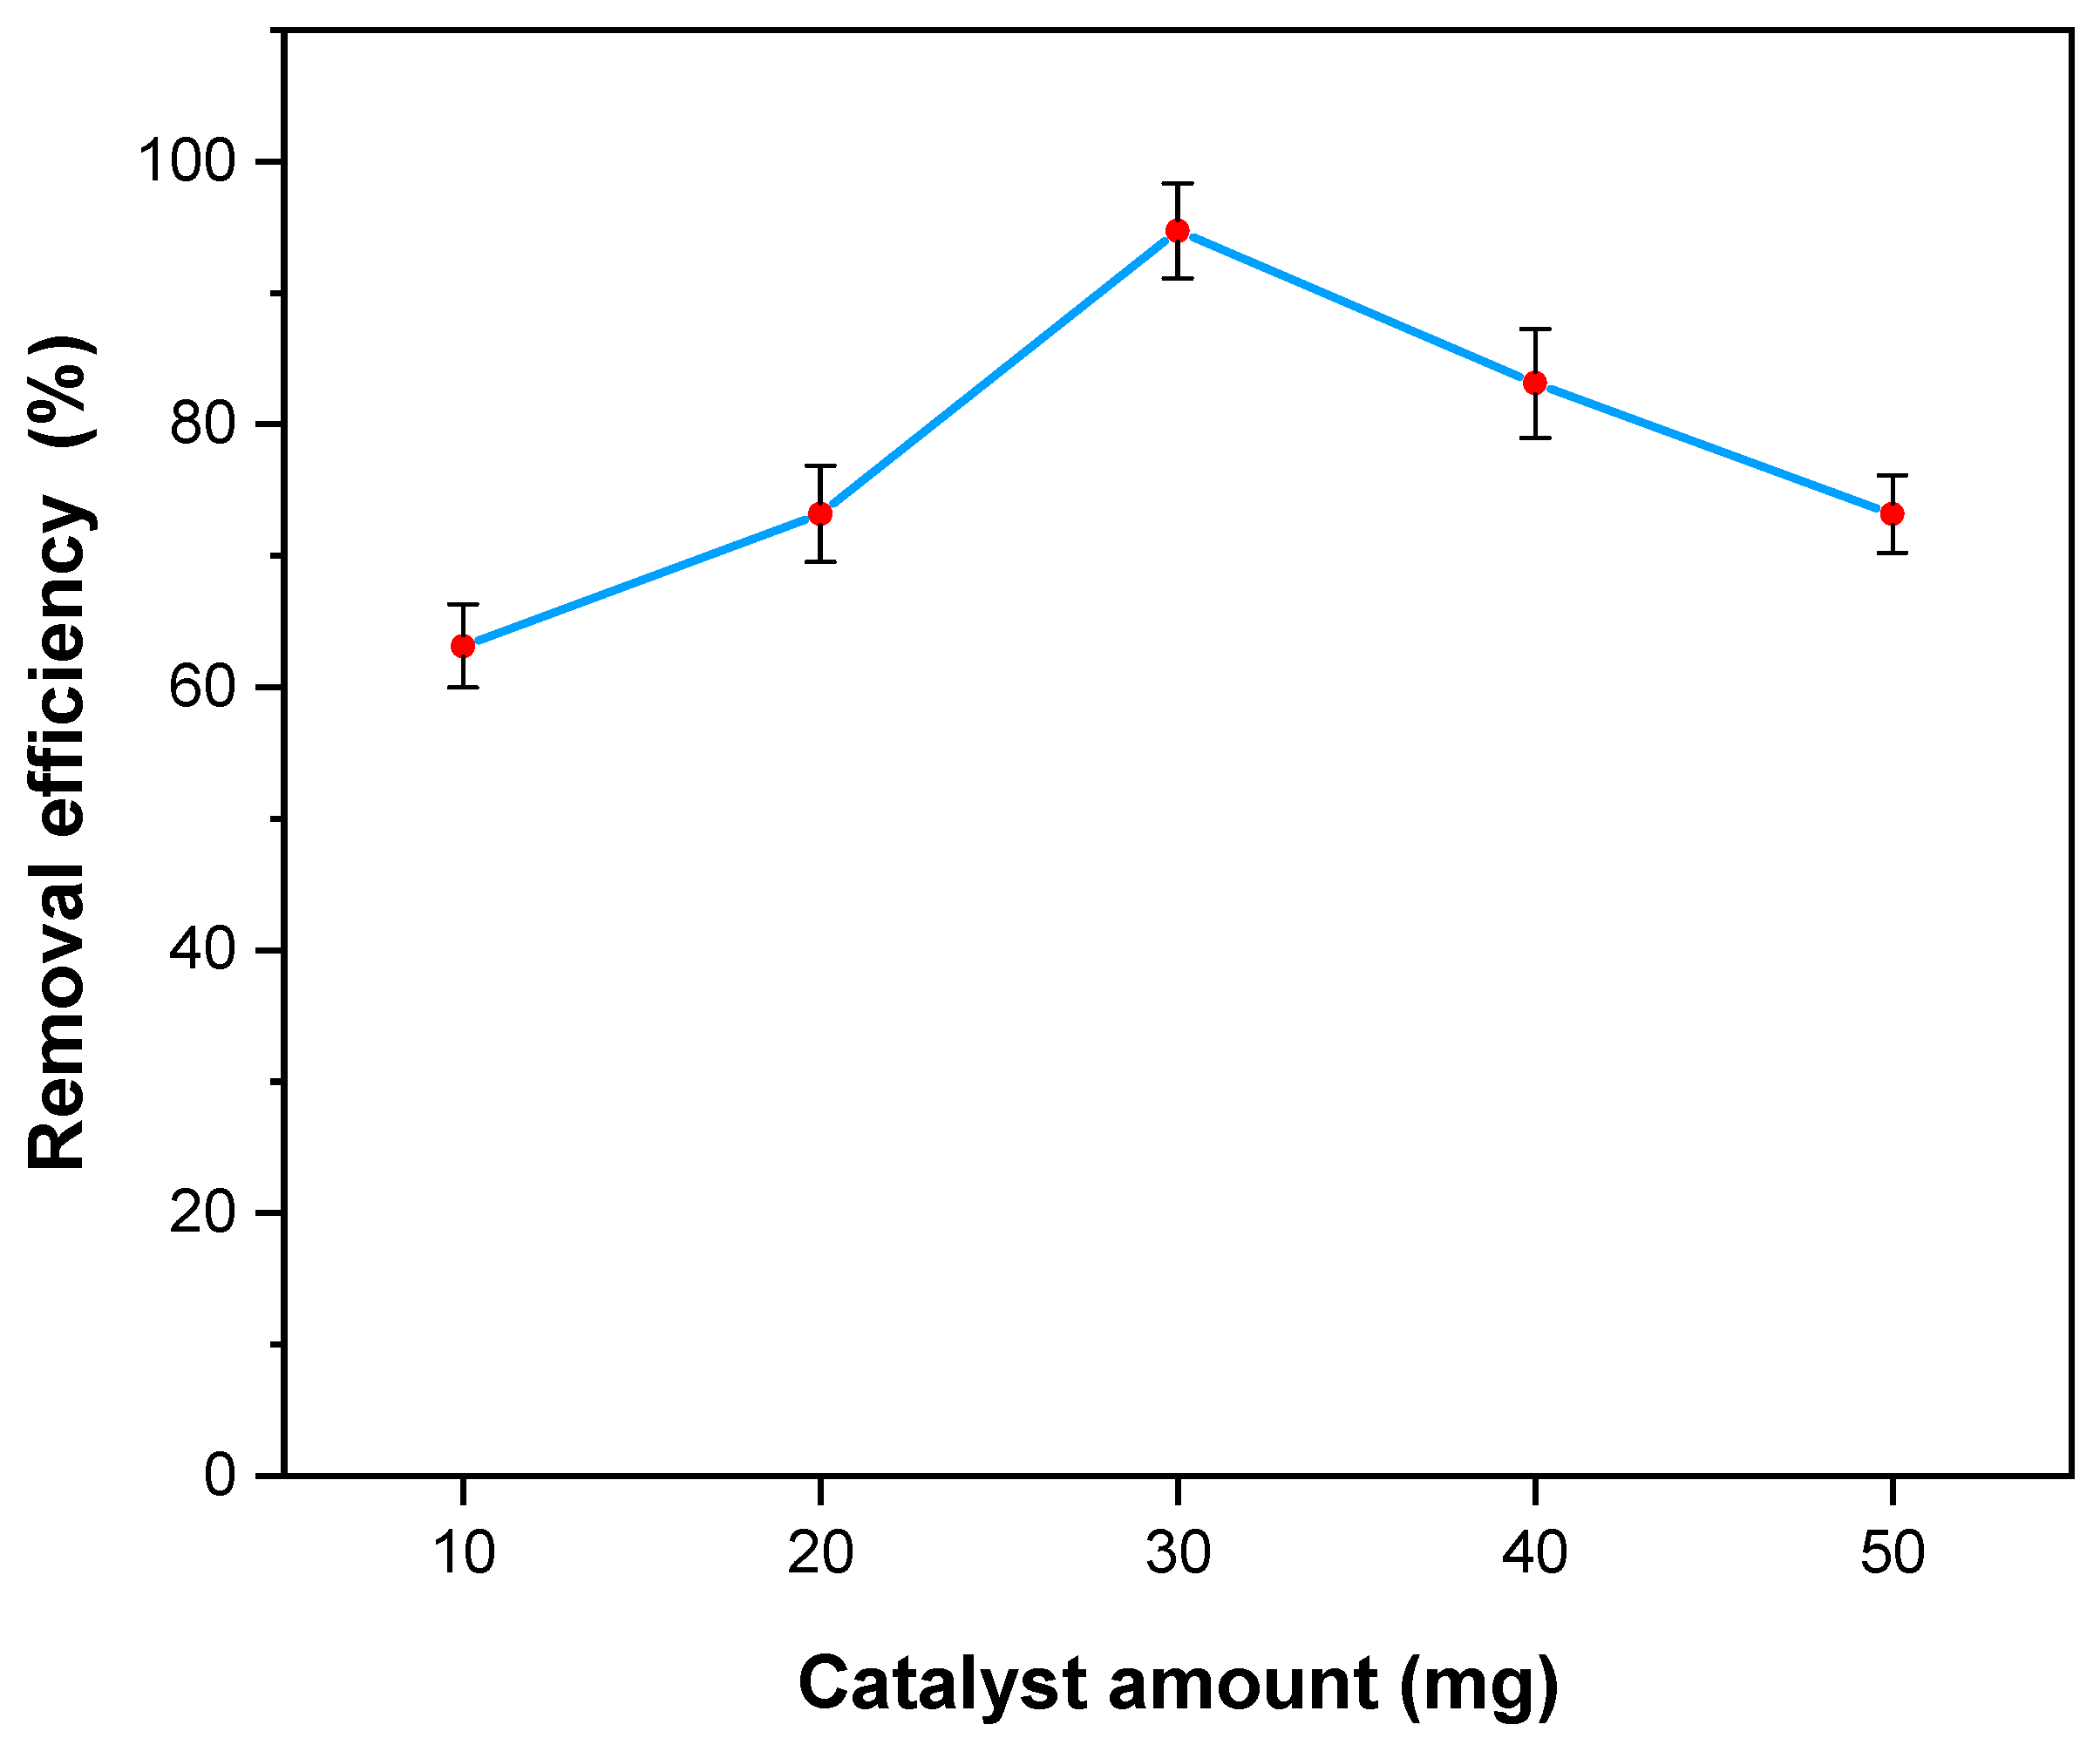
2.12. Effect of Photocatalyst Dosages
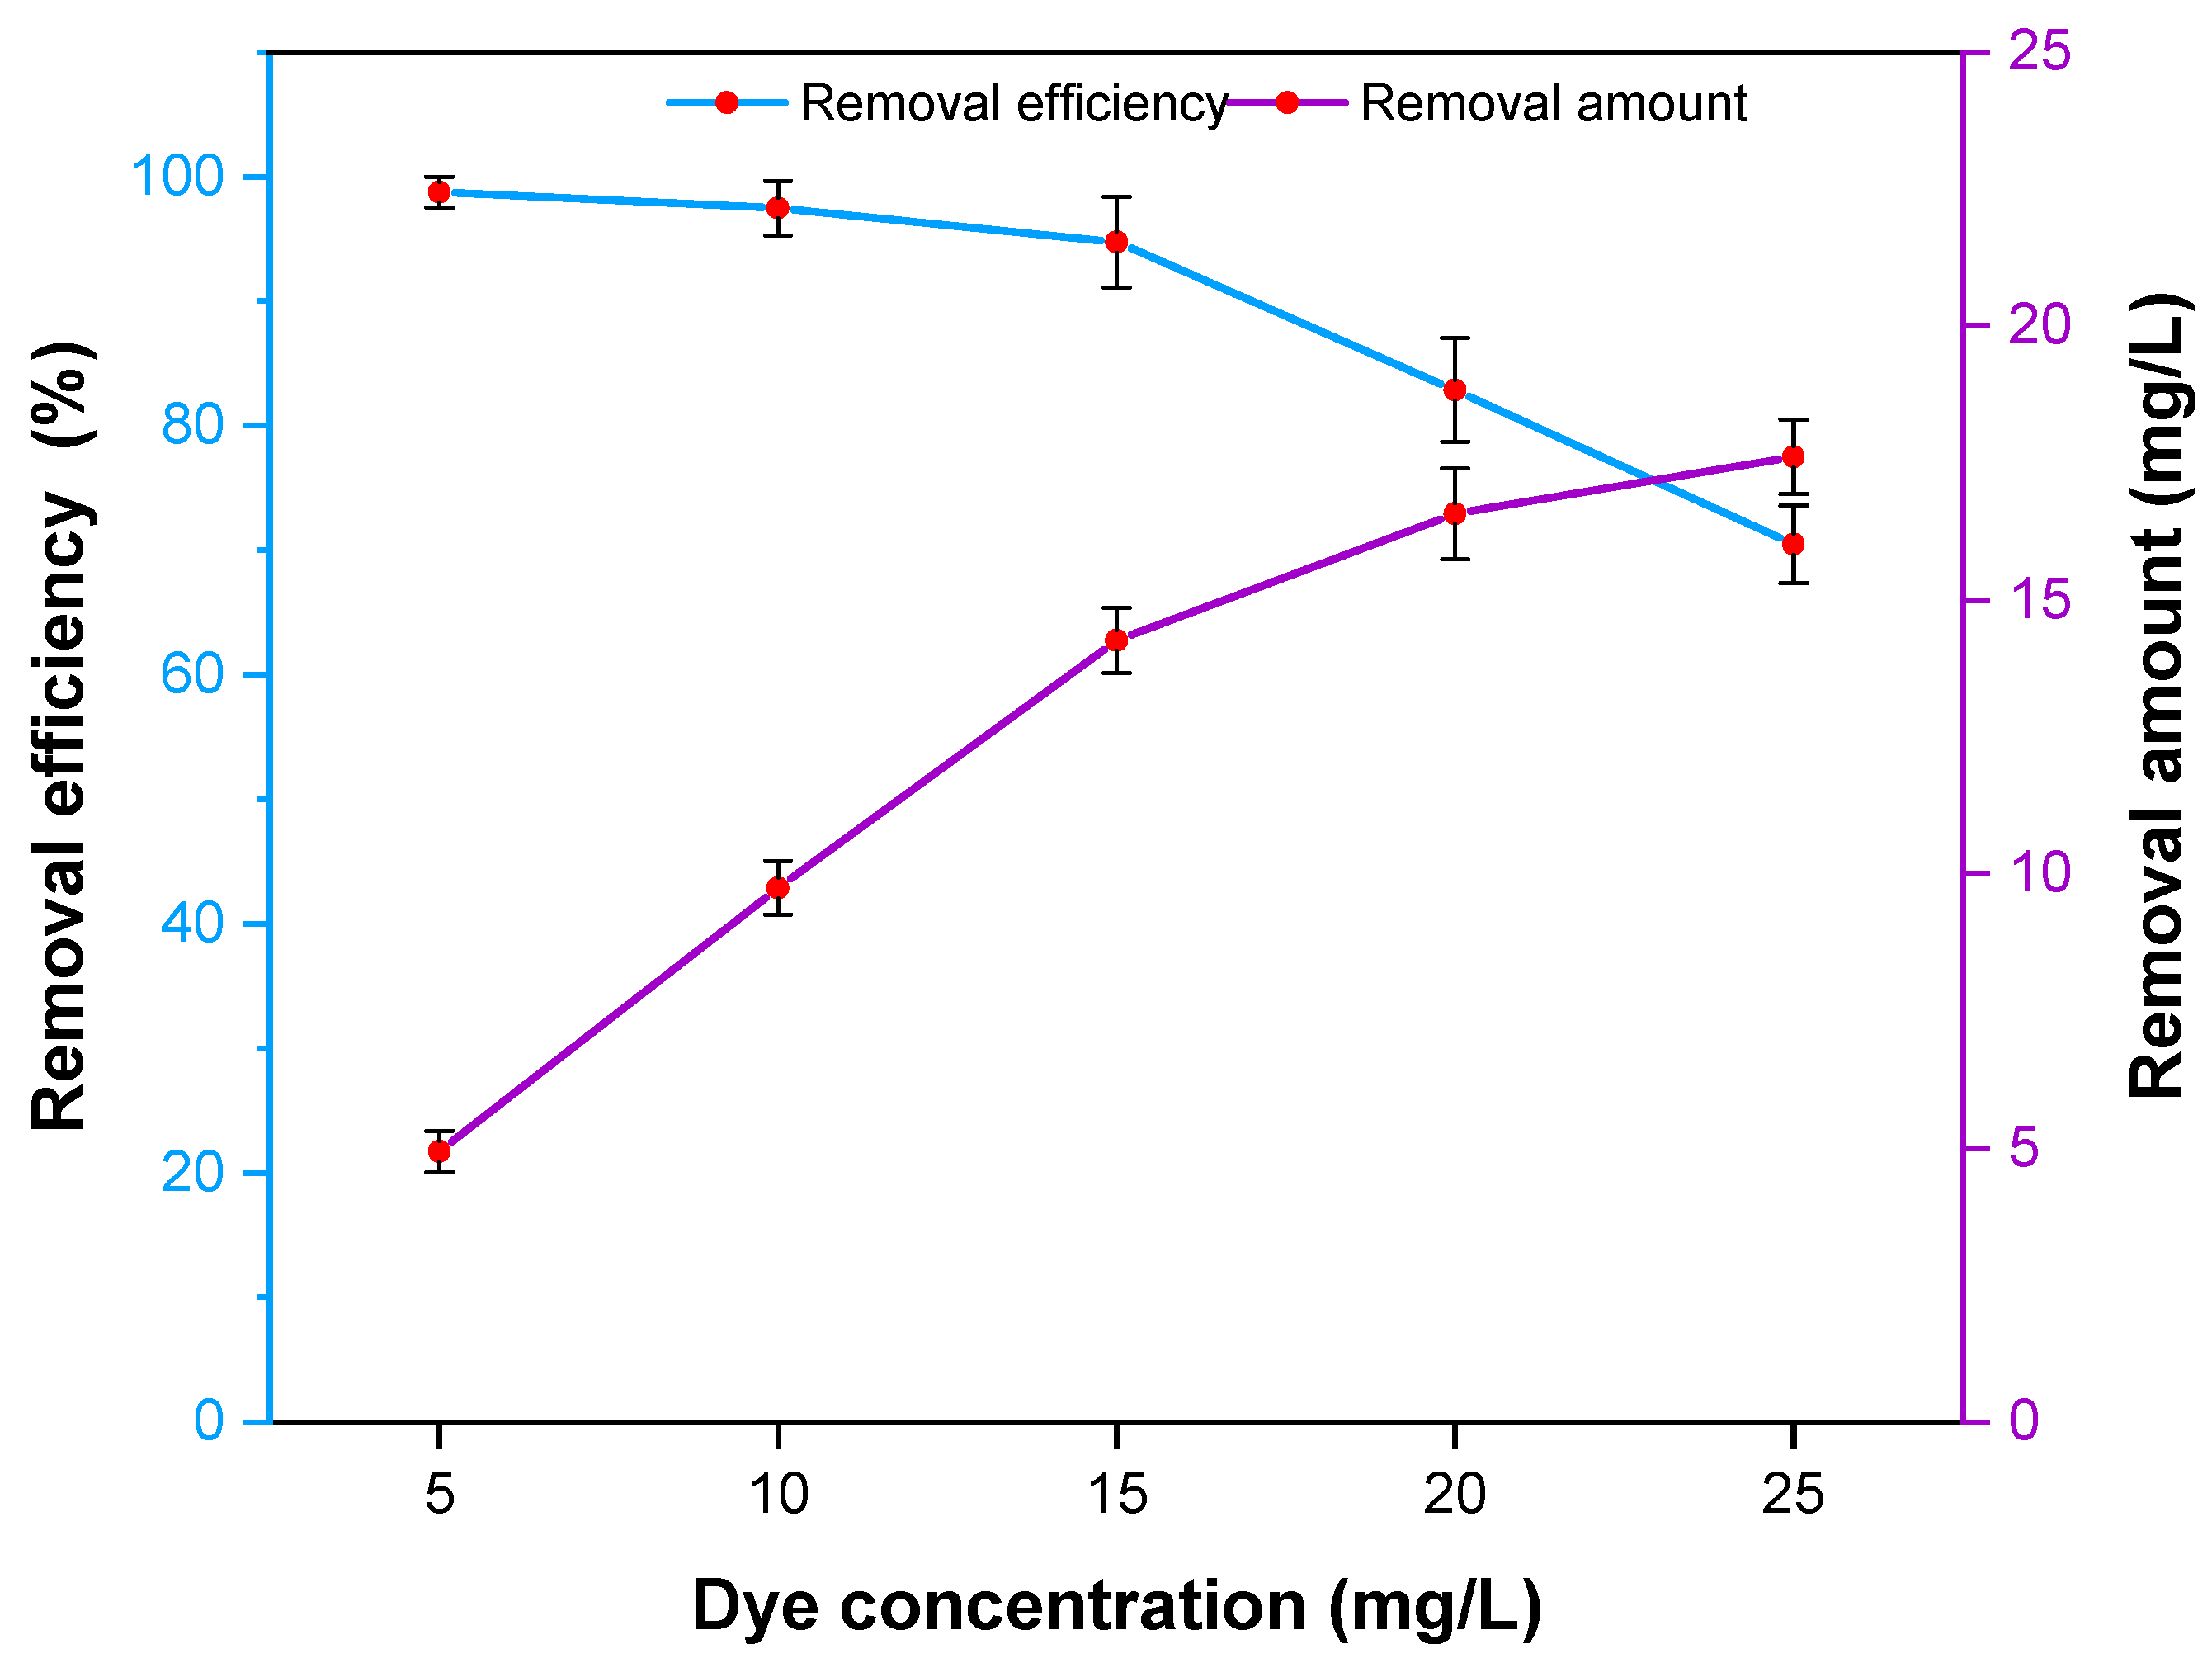
2.13. Effect of Initial MB Dye Concentration
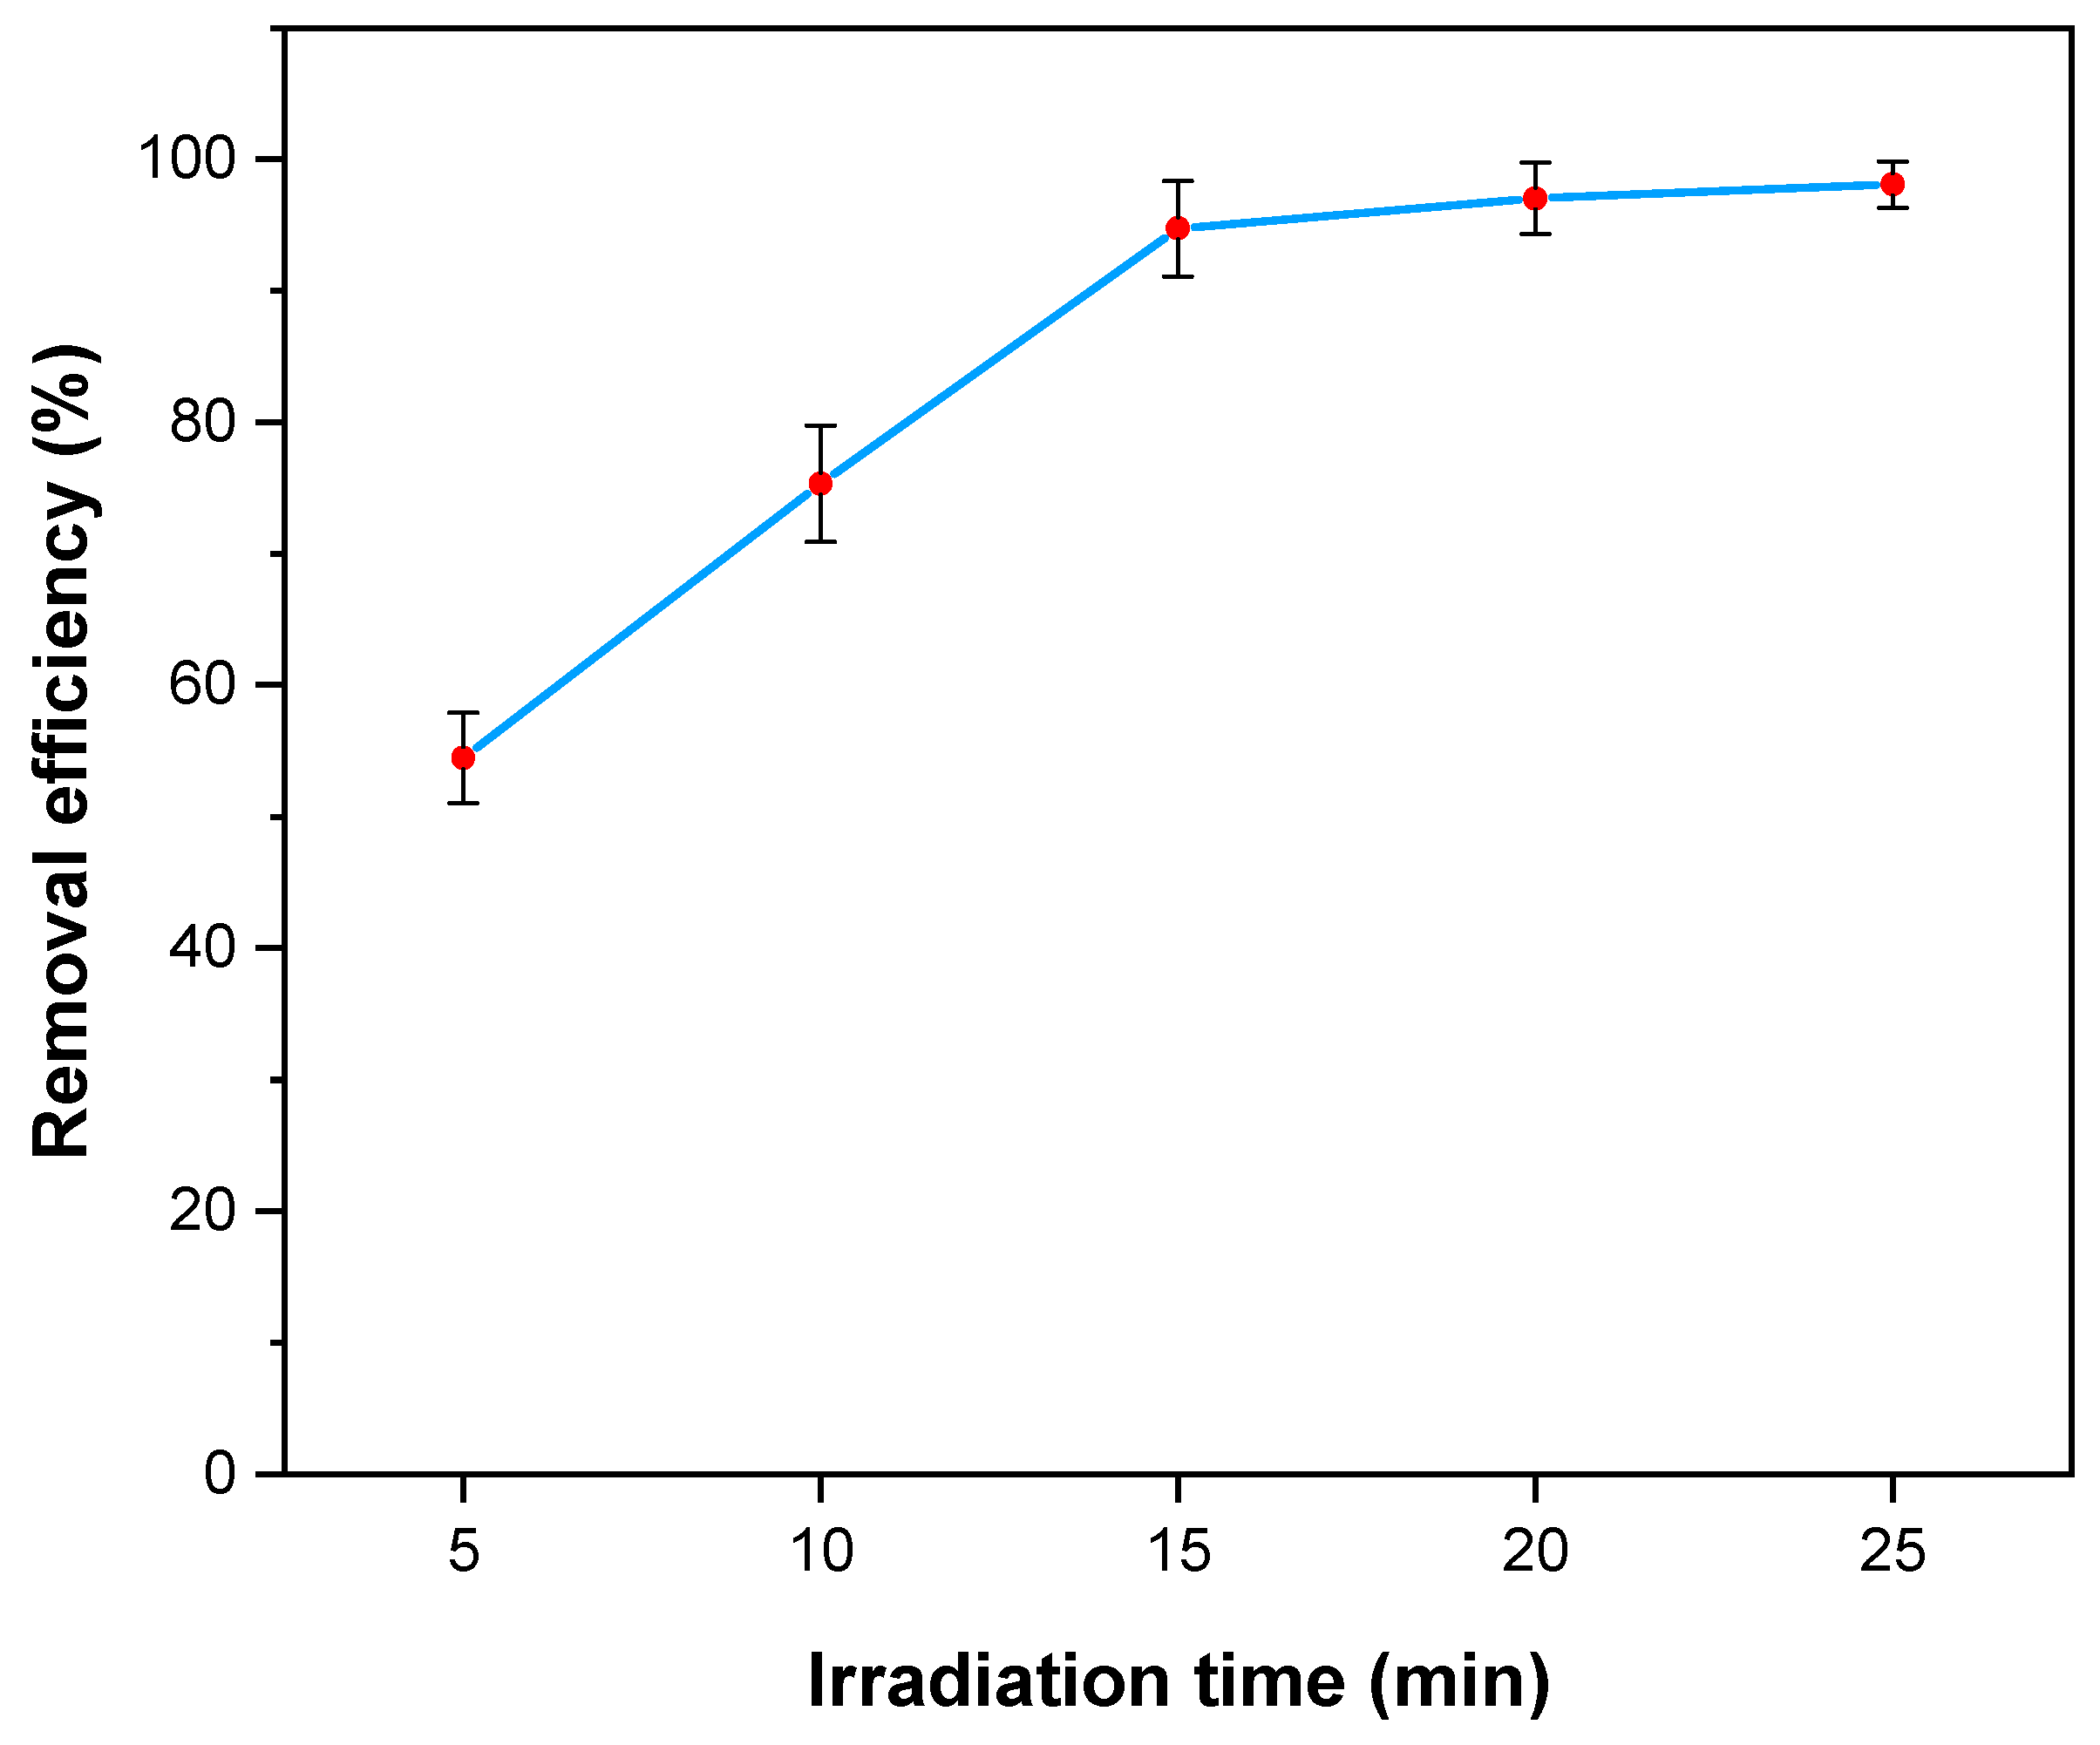
2.14. Effect of Irradiation Time
2.15. Role of Radical Scavengers
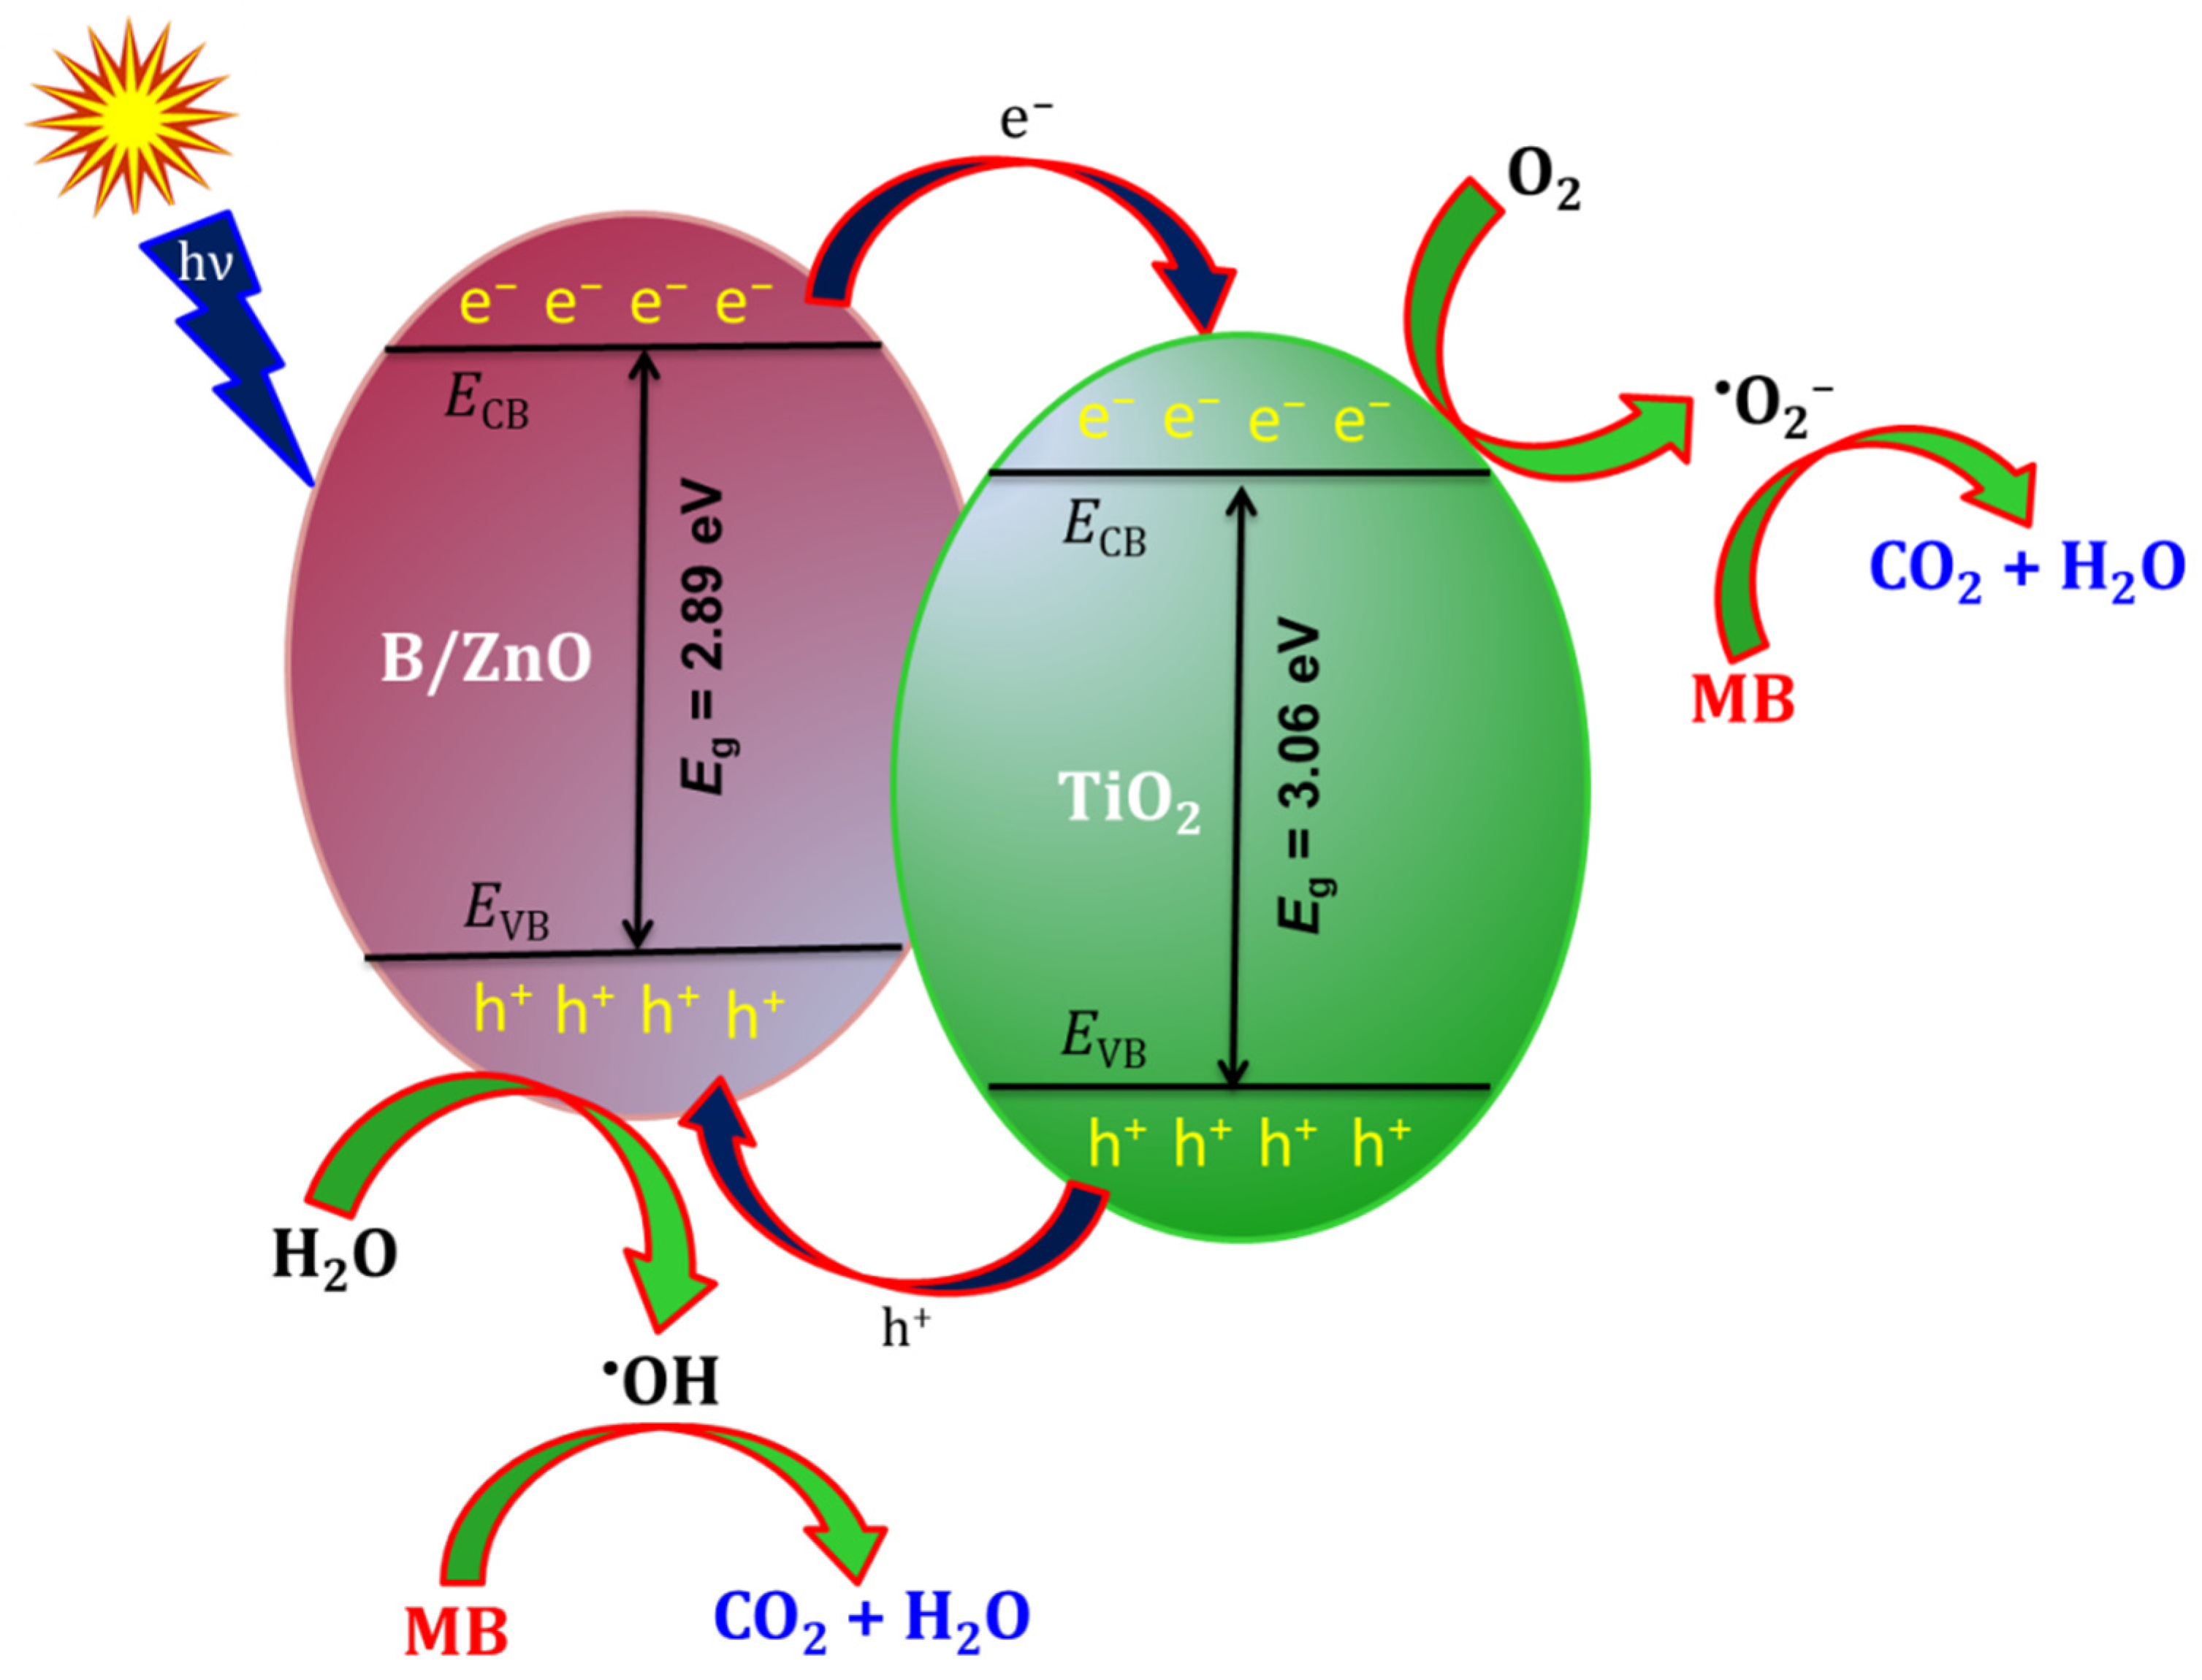
2.16. Photocatalytic Degradation Mechanism
2.17. Photocatalyst Reusability
3. Materials and Methods
3.1. Materials
3.2. Synthesis of B–ZnO/TiO2
3.3. Characterization
3.4. Removal of MB
4. Conclusions
Supplementary Materials
Author Contributions
Funding
Data Availability Statement
Acknowledgments
Conflicts of Interest
References
- Bayomie, O.S.; Kandeel, H.; Shoeib, T.; Yang, H.; Youssef, N.; El-Sayed, M.M.H. Novel approach for effective removal of methylene blue dye from water using fava bean peel waste. Sci. Rep. 2020, 10, 7824. [Google Scholar] [CrossRef] [PubMed]
- Houas, A.; Lachheb, H.; Ksibi, M.; Elaloui, E.; Guillard, C.; Herrmann, J.M. Photocatalytic degradation pathway of methylene blue in water. Appl. Catal. B Environ. 2001, 31, 145–157. [Google Scholar] [CrossRef]
- Chen, D.; Cheng, Y.; Zhou, N.; Chen, P.; Wang, Y.; Li, K.; Huo, S.; Cheng, P.; Peng, P.; Zhang, R.; et al. Photocatalytic degradation of organic pollutants using TiO2-based photocatalysts: A review. J. Clean. Prod. 2020, 268, 121725. [Google Scholar] [CrossRef]
- Gnanaprakasam, A.; Sivakumar, V.M.; Thirumarimurugan, M. Influencing Parameters in the Photocatalytic Degradation of Organic Effluent via Nanometal Oxide Catalyst: A Review. Indian J. Mater. Sci. 2015, 2015, 1–16. [Google Scholar] [CrossRef]
- Azeez, F.; Al-Hetlani, E.; Arafa, M.; Abdelmonem, Y.; Nazeer, A.A.; Amin, M.O.; Madkour, M. The effect of surface charge on photocatalytic degradation of methylene blue dye using chargeable titania nanoparticles. Sci. Rep. 2018, 8, 7104. [Google Scholar] [CrossRef] [PubMed]
- Ameta, R.; Benjamin, S.; Ameta, A.; Ameta, S.C. Photocatalytic degradation of organic pollutants: A review. Mater. Sci. Forum 2013, 734, 247–272. [Google Scholar] [CrossRef]
- Gupta, D.; Chauhan, R.; Kumar, N.; Singh, V.; Srivastava, V.C.; Mohanty, P.; Mandal, T.K. Enhancing photocatalytic degradation of quinoline by ZnO:TiO2 mixed oxide: Optimization of operating parameters and mechanistic study. J. Environ. Manag. 2020, 258, 110032. [Google Scholar] [CrossRef]
- Mohtar, S.S.; Aziz, F.; Ismail, A.F.; Sambudi, N.S.; Abdullah, H.; Rosli, A.N.; Ohtani, B. Impact of doping and additive applications on photocatalyst textural properties in removing organic pollutants: A review. Catalysts 2021, 11, 1160. [Google Scholar] [CrossRef]
- Mulpuri, R.K.; Tirukkovalluri, S.R.; Imandi, M.R.; Alim, S.A.; Lakshmi Kapuganti, V.D. Zinc and boron co-doped nanotitania with enhanced photocatalytic degradation of acid red 6A under visible light irradiation. Sustain. Environ. Res. 2019, 1, 29. [Google Scholar]
- Giahi, M.; Saadat Niavol, S.; Taghavi, H.; Meskinfam, M. Synthesis and characterization of ZnO-TiO2 nanopowders doped with Fe via sol-gel method and their application in photocatalytic degradation of anionic surfactant. Russ. J. Phys. Chem. A 2015, 89, 2432–2437. [Google Scholar] [CrossRef]
- Sakib, A.A.M.; Masum, S.M.; Hoinkis, J.; Islam, R.; Molla, M.A.I. Synthesis of CuO/ZnO Nanocomposites and Their Application in Photodegradation of Toxic Textile Dye. J. Compos. Sci. 2019, 3, 91. [Google Scholar] [CrossRef] [Green Version]
- Wu, Y.; Gong, Y.; Liu, J.; Zhang, Z.; Xu, Y.; Ren, H.; Li, C.; Niu, L. B and Y co-doped TiO2 photocatalyst with enhanced photodegradation efficiency. J. Alloys Compd. 2017, 695, 1462–1469. [Google Scholar] [CrossRef]
- Wetchakun, K.; Wetchakun, N.; Sakulsermsuk, S. An overview of solar/visible light-driven heterogeneous photocatalysis for water purification: TiO2- and ZnO-based photocatalysts used in suspension photoreactors. J. Ind. Eng. Chem. 2019, 71, 19–49. [Google Scholar] [CrossRef]
- Islam, M.M.; Ahmed, A.Z.; Kabir, S.F.; Islam, R.; Islam Molla, M.A. Optimization of Photodegradation Conditions of Rhodamine B in Water with Dye-Sensitized Titanium Dioxide. J. CleanWAS 2020, 4, 28–31. [Google Scholar] [CrossRef]
- Liu, C.; Li, X.; Xu, C.; Wu, Y.; Hu, X.; Hou, X. Boron-doped rutile TiO2/ anatase TiO2/ZrTiO4 ternary heterojunction photocatalyst with optimized phase interface and band structure. Ceram. Int. 2020, 46, 20943–20953. [Google Scholar] [CrossRef]
- Niu, P.; Wu, G.; Chen, P.; Zheng, H.; Cao, Q.; Jiang, H. Optimization of Boron Doped TiO2 as an Efficient Visible Light-Driven Photocatalyst for Organic Dye Degradation with High Reusability. Front. Chem. 2020, 8, 1–8. [Google Scholar] [CrossRef] [Green Version]
- Panwar, S.; Upadhyay, G.K.; Purohit, L.P. Gd-doped ZnO:TiO2 heterogenous nanocomposites for advance oxidation process. Mater. Res. Bull. 2022, 145, 111534. [Google Scholar] [CrossRef]
- Kerli, S.; Kavgacı, M.; Soğuksu, A.K.; Avar, B. Photocatalytic Degradation of Methylene Blue, Rhodamine-B, and Malachite Green by Ag @ ZnO/TiO2. Braz. J. Phys. 2021, 52, 22. [Google Scholar] [CrossRef]
- Li, W.; Wu, D.; Yu, Y.; Zhang, P.; Yuan, J.; Cao, Y.; Cao, Y.; Xu, J. Investigation on a novel ZnO/TiO2-B photocatalyst with enhanced visible photocatalytic activity. Phys. E Low-Dimens. Syst. Nanostruct. 2014, 58, 118–123. [Google Scholar] [CrossRef]
- Wang, Y.; Liu, X.; Guo, L.; Shang, L.; Ge, S.; Song, G.; Naik, N.; Shao, Q.; Lin, J.; Guo, Z. Metal organic framework-derived C-doped ZnO/TiO2 nanocomposite catalysts for enhanced photodegradation of Rhodamine B. J. Colloid Interface Sci. 2021, 599, 566–576. [Google Scholar] [CrossRef]
- Munguti, L.; Dejene, F. Influence of annealing temperature on structural, optical and photocatalytic properties of ZnO–TiO2 composites for application in dye removal in water. Nano Struct. Nano Objects 2020, 24, 100594. [Google Scholar] [CrossRef]
- Teh, C.M.; Mohamed, A.R. Roles of titanium dioxide and ion-doped titanium dioxide on photocatalytic degradation of organic pollutants (phenolic compounds and dyes) in aqueous solutions: A review. J. Alloys Compd. 2011, 509, 1648–1660. [Google Scholar] [CrossRef]
- Ahmed, A.Z.; Islam, M.M.; Islam, M.M.u.; Masum, S.M.; Islam, R.; Molla, M.A.I. Fabrication and characterization of B/Sn-doped ZnO nanoparticles via mechanochemical method for photocatalytic degradation of rhodamine B. Inorg. Nano-Metal Chem. 2020, 51, 1369–1378. [Google Scholar] [CrossRef]
- Kumar, S.; Maivizhikannan, V.; Drews, J.; Krishnan, V. Fabrication of nanoheterostructures of boron doped ZnO-MoS2 with enhanced photostability and photocatalytic activity for environmental remediation applications. Vacuum 2019, 163, 88–98. [Google Scholar] [CrossRef]
- Molla, M.A.I.; Furukawa, M.; Tateishi, I.; Katsumata, H.; Suzuki, T.; Kaneco, S. Photocatalytic Decolorization of Dye with Self-Dye-Sensitization under Fluorescent Light Irradiation. ChemEngineering 2017, 1, 8. [Google Scholar] [CrossRef] [Green Version]
- Mousa, H.M.; Alenezi, J.F.; Mohamed, I.M.A.; Yasin, A.S.; Hashem, A.F.M.; Abdal-hay, A. Synthesis of TiO2@ZnO heterojunction for dye photodegradation and wastewater treatment. J. Alloys Compd. 2021, 886, 161169. [Google Scholar] [CrossRef]
- Gohari, G.; Mohammadi, A.; Akbari, A.; Panahirad, S.; Dadpour, M.R.; Fotopoulos, V.; Kimura, S. Titanium dioxide nanoparticles (TiO2 NPs) promote growth and ameliorate salinity stress effects on essential oil profile and biochemical attributes of Dracocephalum moldavica. Sci. Rep. 2020, 10, 912. [Google Scholar] [CrossRef]
- Ismail, M.A.; Taha, K.K.; Modwi, A.; Khezami, L. ZnO nanoparticles: Surface and X-ray profile analysis. J. Ovonic Res. 2018, 14, 381–393. [Google Scholar]
- Wang, W.; Ai, T.; Yu, Q. Electrical and photocatalytic properties of boron-doped ZnO nanostructure grown on PET–ITO flexible substrates by hydrothermal method. Sci. Rep. 2017, 7, 42615. [Google Scholar] [CrossRef]
- Wolfgong, W.J. Chemical analysis techniques for failure analysis: Part 1, common instrumental methods. In Handbook of Materials Failure Analysis with Case Studies from the Aerospace and Automotive Industries; Butterworth-Heinemann: Oxford, UK, 2016; pp. 279–307. [Google Scholar]
- El Mragui, A.; Daou, I.; Zegaoui, O. Influence of the preparation method and ZnO/(ZnO + TiO2) weight ratio on the physicochemical and photocatalytic properties of ZnO-TiO2 nanomaterials. Catal. Today 2018, 321–322, 41–51. [Google Scholar] [CrossRef]
- Shaikh, S.F.; Mane, R.S.; Min, B.K.; Hwang, Y.J.; Joo, O.S. D-sorbitol-induced phase control of TiO2 nanoparticles and its application for dye-sensitized solar cells. Sci. Rep. 2016, 6, 20103. [Google Scholar] [CrossRef]
- Ebraheem, S.; El-Saied, A. Band Gap Determination from Diffuse Reflectance Measurements of Irradiated Lead Borate Glass System Doped with TiO2 by Using Diffuse Reflectance Technique. Mater. Sci. Appl. 2013, 4, 324–329. [Google Scholar]
- Tekin, D.; Kiziltas, H.; Ungan, H. Kinetic evaluation of ZnO/TiO2 thin film photocatalyst in photocatalytic degradation of Orange G. J. Mol. Liq. 2020, 306, 112905. [Google Scholar] [CrossRef]
- Molla, M.A.I.; Furukawa, M.; Tateishi, I.; Katsumata, H.; Kaneco, S. Fabrication of Ag-doped ZnO by mechanochemical combustion method and their application into photocatalytic Famotidine degradation. J. Environ. Sci. Heal. Part A Toxic Hazard. Subst. Environ. Eng. 2019, 54, 914–923. [Google Scholar] [CrossRef]
- Sultana, T.; Dey, S.C.; Molla, M.A.I.; Hossain, M.R.; Rahman, M.M.; Quddus, M.S.; Moniruzzaman, M.; Shamsuddin, S.M.; Sarker, M. Facile synthesis of TiO2/Chitosan nanohybrid for adsorption-assisted rapid photodegradation of an azo dye in water. React. Kinet. Mech. Catal. 2021, 133, 1121–1139. [Google Scholar] [CrossRef]
- Yadav, K.; Gahlaut, S.K.; Mehta, B.R.; Singh, J.P. Photoluminescence based H2 and O2 gas sensing by ZnO nanowires. Appl. Phys. Lett. 2016, 108, 071602. [Google Scholar] [CrossRef]
- Alamdari, S.; Ghamsari, M.S.; Afarideh, H.; Mohammadi, A.; Geranmayeh, S.; Tafreshi, M.J.; Ehsani, M.H. Preparation and characterization of GO-ZnO nanocomposite for UV detection application. Opt. Mater. Amst. 2019, 92, 243–250. [Google Scholar] [CrossRef]
- Zhang, Q.; Li, C. TiO2 Coated ZnO Nanorods by Mist Chemical Vapor Deposition for Application as Photoanodes for Dye-Sensitized Solar Cells. Nanomaterials 2019, 9, 1339. [Google Scholar] [CrossRef] [Green Version]
- Pant, B.; Ojha, G.P.; Kuk, Y.S.; Kwon, O.H.; Wan Park, Y.; Park, M. Synthesis and characterization of ZnO-TiO2/carbon fiber composite with enhanced photocatalytic properties. Nanomaterials 2020, 10, 1960. [Google Scholar] [CrossRef]
- Delsouz Khaki, M.R.; Shafeeyan, M.S.; Raman, A.A.A.; Daud, W.M.A.W. Evaluating the efficiency of nano-sized Cu doped TiO2/ZnO photocatalyst under visible light irradiation. J. Mol. Liq. 2018, 258, 354–365. [Google Scholar] [CrossRef]
- Guo, J.; Li, J.; Yin, A.; Fan, K.; Dai, W. Photodegradation of Rhodamine B on Sulfur Doped ZnO/TiO2 Nanocomposite Photocatalyst under Visible-light Irradiation. Chin. J. Chem. 2010, 28, 2144–2150. [Google Scholar] [CrossRef]
- Zou, X.; Dong, X.; Wang, L.; Ma, H.; Zhang, X.; Zhang, X. Preparation of Ni doped ZnO-TiO2 composites and their enhanced photocatalytic activity. Int. J. Photoenergy 2014, 2014, 893158. [Google Scholar] [CrossRef] [Green Version]
- Xie, H.; Ding, F.; Mu, H. Effects of Au nanoparticles and ZnO morphology on the photocatalytic performance of Au doped ZnO/TiO2 films. Nanotechnology 2019, 30, 085708. [Google Scholar] [CrossRef]
- Viet, T.Q.Q.; Khoi, V.H.; Thi Huong Giang, N.; Thi Van Anh, H.; Dat, N.M.; Phong, M.T.; Hieu, N.H. Statistical screening and optimization of photocatalytic degradation of methylene blue by ZnO–TiO2/rGO nanocomposite. Colloids Surf. A Physicochem. Eng. Asp. 2021, 629, 127464. [Google Scholar] [CrossRef]
- Pal, P. Industry-Specific Water Treatment Case Studies. In Industrial Water Treatment Process Technology; Butterworth-Heinemann: Oxford, UK, 2017; pp. 243–511. [Google Scholar]
- Molla, M.A.I.; Furukawa, M.; Tateishi, I.; Katsumata, H.; Kaneco, S. Mineralization of Diazinon with nanosized-photocatalyst TiO2 in water under sunlight irradiation: Optimization of degradation conditions and reaction pathway. Environ. Technol. 2020, 41, 3524–3533. [Google Scholar] [CrossRef]
- Benhebal, H.; Chaib, M.; Salmon, T.; Geens, J.; Leonard, A.; Lambert, S.D.; Crine, M.; Heinrichs, B. Photocatalytic degradation of phenol and benzoic acid using zinc oxide powders prepared by the sol–gel process. Alex. Eng. J. 2013, 52, 517–523. [Google Scholar] [CrossRef] [Green Version]
- Molla, M.A.I.; Ahsan, S.; Tateishi, I.; Furukawa, M.; Katsumata, H.; Suzuki, T.; Kaneco, S. Degradation, Kinetics, and Mineralization in Solar Photocatalytic Treatment of Aqueous Amitrole Solution with Titanium Dioxide. Environ. Eng. Sci. 2018, 35, 401–407. [Google Scholar] [CrossRef]
- Mondol, B.; Sarker, A.; Shareque, A.M.; Dey, S.C.; Islam, M.T.; Das, A.K.; Shamsuddin, S.M.; Molla, M.A.I.; Sarker, M. Preparation of Activated Carbon/TiO2 Nanohybrids for Photodegradation of Reactive Red-35 Dye Using Sunlight. Photochem 2021, 1, 54–66. [Google Scholar] [CrossRef]
- Molla, M.A.I.; Tateishi, I.; Furukawa, M.; Katsumata, H.; Suzuki, T.; Kaneco, S. Evaluation of Reaction Mechanism for Photocatalytic Degradation of Dye with Self-Sensitized TiO2 under Visible Light Irradiation. Open J. Inorg. Non-Met. Mater. 2017, 7, 1–7. [Google Scholar]
- Tian, J.; Shao, Q.; Zhao, J.; Pan, D.; Dong, M.; Jia, C.; Ding, T.; Wu, T.; Guo, Z. Microwave solvothermal carboxymethyl chitosan templated synthesis of TiO2/ZrO2 composites toward enhanced photocatalytic degradation of Rhodamine B. J. Colloid Interface Sci. 2019, 541, 18–29. [Google Scholar] [CrossRef]
- Yu, Z.; Moussa, H.; Liu, M.; Schneider, R.; Moliere, M.; Liao, H. Heterostructured metal oxides-ZnO nanorods films prepared by SPPS route for photodegradation applications. Surf. Coat. Technol. 2019, 375, 670–680. [Google Scholar] [CrossRef]
- Hou, X.; Stanley, S.L.; Zhao, M.; Zhang, J.; Zhou, H.; Cai, Y.; Huang, F.; Wei, Q. MOF-based C-doped coupled TiO2/ZnO nanofibrous membrane with crossed network connection for enhanced photocatalytic activity. J. Alloys Compd. 2019, 777, 982–990. [Google Scholar] [CrossRef]
- Kabir, R.; Saifullah, M.A.K.; Ahmed, A.Z.; Masum, S.M.; Molla, M.A.I. Synthesis of N-Doped ZnO Nanocomposites for Sunlight Photocatalytic Degradation of Textile Dye Pollutants. J. Compos. Sci. 2020, 4, 49. [Google Scholar] [CrossRef]
- Molla, M.A.I.; Ahmed, A.Z.; Kaneco, S. Reaction Mechanism for Photocatalytic Degradation of Organic Pollutants; Elsevier, B.V.: Amsterdam, The Netherlands, 2021; ISBN 9780128230077. [Google Scholar]
- Molla, M.A.I.; Furukawa, M.; Tateishi, I.; Katsumata, H.; Kaneco, S. Studies of Effects of Calcination Temperature on the Crystallinity and Optical Properties of Ag-Doped ZnO Nanocomposites. J. Compos. Sci. 2019, 3, 18. [Google Scholar] [CrossRef] [Green Version]


| Photocatalysts | Crystallite Size (nm) | BET Parameters | Bandgap Energies (eV) | ||
|---|---|---|---|---|---|
| BET Surface Area (m2/g) | Pore Volume (cm3/g) | Direct Transitions | Indirect Transitions | ||
| Commercial TiO2 | 73.35 | 10.76 | 0.0371 | − | 3.21 |
| ZnO | 32.10 | 7.30 | 0.0732 | 3.22 | − |
| B–ZnO | 14.03 | − | − | 3.18 | − |
| ZnO/TiO2 | 52.40 | − | − | 2.93 | 3.13 |
| B–ZnO/TiO2 | 42.54 | 18.99 | 0.0781 | 2.89 | 3.06 |
| Nanocomposites | Synthesis Methodology | Dye Concentration | Photocatalyst Dimension | Time (min) | Light Source | Removal Efficiency | Ref. |
|---|---|---|---|---|---|---|---|
| B–ZnO/TiO2 | Mechanochemical–calcination method | MB (15 mg/L) | 30 mg/50 mL | 15 | Natural sunlight (∼1.2 mW/cm2) | ∼95% | Presentstudy |
| Gd–ZnO/TiO2 | Sol–gel method | MB (20 mg/L) MO (20 mg/L) | 1 g/L | 90 | Fluorescent lamps (30 W) | 93% (MB) 94% (MO) | [17] |
| Ag–ZnO/TiO2 | Hydrothermal method | MB, RhB, MG (5 mg/L) | 10 mg/50 mL | 120 | Xenon lamp (300 W) | 99% (MB) 87% (RhB) 71% (MG) | [18] |
| C–ZnO/TiO2 | Hydrothermal–calcination method | RhB (10 mg/L) | 50 mg/100 mL | 45 | Xenon lamp (200 W) | 94% | [20] |
| ZnO/TiO2–CNFs | Hydrothermal method | MB (10 mg/L) | 20 mg/25 mL | 120 | Ultraviolet lamp (λ = 365 nm) | 93% | [40] |
| Cu–TiO2/ZnO | Sol–gel method | MO MB | 0.7 g/L | 120 | Fluorescent lamp (18–23 W) | 85% (MO) 73% (MB) | [41] |
| S–ZnO/TiO2 | Sol–gel method | RhB (2.5 × 10⁻⁵ mol/L) | 50 mg/100 mL | 100 | Halogen lamps (125 W) | 92% | [42] |
| Ni–ZnO/TiO2 | Sol–gel method | RBB (50 mg/L) | 1 g/L | 120 | Simulated sunlight (350 W Xe lamp) | 61% | [43] |
| Au–ZnO/TiO2 | Hydrothermal | MO (10 mg/L) | 3.34 mg/50mL | 300 | Mercury lamp (300 W) | 95% | [44] |
| ZnO/TiO2–rGO | Solvothermal method | MB (20 mg/L) | 252.5 mg/L | 63.5 | Ultraviolet lamp (11 W) | 99% | [45] |
Publisher’s Note: MDPI stays neutral with regard to jurisdictional claims in published maps and institutional affiliations. |
© 2022 by the authors. Licensee MDPI, Basel, Switzerland. This article is an open access article distributed under the terms and conditions of the Creative Commons Attribution (CC BY) license (https://creativecommons.org/licenses/by/4.0/).
Share and Cite
Shathy, R.A.; Fahim, S.A.; Sarker, M.; Quddus, M.S.; Moniruzzaman, M.; Masum, S.M.; Molla, M.A.I. Natural Sunlight Driven Photocatalytic Removal of Toxic Textile Dyes in Water Using B-Doped ZnO/TiO2 Nanocomposites. Catalysts 2022, 12, 308. https://0-doi-org.brum.beds.ac.uk/10.3390/catal12030308
Shathy RA, Fahim SA, Sarker M, Quddus MS, Moniruzzaman M, Masum SM, Molla MAI. Natural Sunlight Driven Photocatalytic Removal of Toxic Textile Dyes in Water Using B-Doped ZnO/TiO2 Nanocomposites. Catalysts. 2022; 12(3):308. https://0-doi-org.brum.beds.ac.uk/10.3390/catal12030308
Chicago/Turabian StyleShathy, Romana Akter, Shahriar Atik Fahim, Mithun Sarker, Md. Saiful Quddus, Mohammad Moniruzzaman, Shah Md. Masum, and Md. Ashraful Islam Molla. 2022. "Natural Sunlight Driven Photocatalytic Removal of Toxic Textile Dyes in Water Using B-Doped ZnO/TiO2 Nanocomposites" Catalysts 12, no. 3: 308. https://0-doi-org.brum.beds.ac.uk/10.3390/catal12030308