
Tungsten Catalysts for Visible Light Driven Ofloxacin Photocatalytic Degradation and Hydrogen Production


1
Department of Chemistry, Section of General Chemistry, University of Pavia, Via Taramelli 12, 27100 Pavia, Italy
2
Istituto Nazionale di Fisica Nucleare (INFN), Sezione di Pavia, Via Agostino Bassi 6, 27100 Pavia, Italy
3
Department of Chemistry, University of Pavia, Via Taramelli 12, 27100 Pavia, Italy
*
Author to whom correspondence should be addressed.
Catalysts 2022, 12(3), 310; https://0-doi-org.brum.beds.ac.uk/10.3390/catal12030310
Submission received: 4 February 2022
/
Revised: 4 March 2022
/
Accepted: 7 March 2022
/
Published: 9 March 2022
(This article belongs to the Special Issue Photocatalysis and Renewable Materials)
Abstract
:Some tungsten catalysts of interest that are synthesized are bismuth tungstate (BT) and Tetrabutylammonium decatungstate (TBADT), using two consolidated procedures. BT is used as a photo-catalyst for the simulated solar light degradation of ofloxacin (OFL) antibiotic under relevant real conditions (µg L−1, fresh water) with the limit of 0.05 g L−1 of catalyst. A quantitative drug decomposition occurred following a bi-exponential first-order law, with an efficiency comparable with the most used P25 TiO2 catalyst. The photocatalytic profiles of OFL at µg L−1 and mg L−1 were monitored by high-pressure liquid chromatography (HPLC) coupled with fluorescence (FD) and ultraviolet (UV) detectors. Additionally, the main photoproducts were identified by high-pressure liquid chromatography coupled to electrospray ionization in tandem with mass spectrometry (HPLC-ESI-MS/MS). The catalyst Tetrabutylammonium decatungstate (TBADT) was used as a catalyst to produce hydrogen from glucose and 2-propanol in aqueous solution, providing hydrogen gas evolution up to 10 µmol g−1 h−1.
1. Introduction
Currently, pollution is an unavoidable topic, especially as impurities removal from industrial and household products is necessary. Additionally, the whole world is thinking about developing alternative energy sources before 2050 to decrease carbon dioxide emissions. In this sense, to create a green Earth, a strategic approach in the production of H2 gas is highly demanded by green methods.
The degradation of pollutants and their analysis brings us a step closer to realizing a green Earth. Today, consuming antibiotics and other basic medicines is unavoidable to stay healthy. However, these medicines create more pollution, especially in water [1]. When compared to other chemical methods, photochemistry is a widely welcomes topic in discussions due to its safeness in a green-way with almost no residues. The ideal green photo method has been proposed to achieve products in a higher percentage without using aggressive reagents and conditions throughout the reaction sequence, avoiding high energy photons [2]. From the perspective of solar energy utilization, the development of visible light active photocatalysts is in demand.
Nowadays, new Bismuth-based catalysts are evolving and they are being investigated in the field of photochemistry. The BT catalyst received much attention because of its non-toxicity, strong behavior in visible light [3], narrow band-gap and unique structure with photostability [4].
The conduction band of BT involves 5d orbitals of tungsten and the valence bond of BT involves bismuth 6s, oxygen 2p hybridization gives the dispersed valence band. This could cause a higher mobility of charge by photo-induced hole mobility which emphasizes the power of the catalyst towards a good oxidizing agent for the purpose of many photochemical reactions. In this way we, could achieve heterogeneous photocatalytic oxidation, a promising technique in the removal of organic pollutants that is feasible [5]. The BT catalyst could be prepared using different methods such as sol-gel, solid-state and hydrothermal conditions [6,7,8]. The BT catalyst is used for the removal of dyes, especially Rhodamine B dye. The photocatalytic activity of BT for RhB degradation is discovered to be closely linked with the pH value of the solution. The doped TiO2 photocatalysts leads to harm in terms of photo-corrosion and instability. The stability of Bi2WO6 as a visible-light-driven photocatalyst has been proven, as after five recycles for the photodegradation of RhB, the catalyst did not exhibit any substantial loss of action, confirming that Bi2WO6 is not photocorroded during the photocatalytic oxidation of the pollutant molecules [9]. Zhao et al. demonstrated that the 3D flower-like structure comprised of well-ordered nanoplates presented excellent photo-catalytic activity, and the degradation efficacy of ceftriaxone sodium was 70.18% [10]. Lin et al. proved that the flower-like Bi2WO6 showed much higher visible photo-catalytic action in the decay of Rhodamine B in the aqueous phase with a degradation efficacy of 100% for 50 min of irradiation time [11].
On the other hand, water splitting into H2 gas (Green energy) by photo catalytic reaction is an ideal resource. We were particularly interested in TBADT, (nBu4N)4[W10O32]), a highly efficient HAT (Hydrogen Atom Transfer) photocatalyst that is widely used for dehydrogenation, oxidation, and conjugate addition reactions of even inactivated aliphatic CH bonds [1].
Recently, a research group demonstrated that TBADT can abstract from different hydrogen donor molecules including alkanes, ethers, 1,4-dioxane, aldehydes, 1,3-benzodioxole, lactones, acetals, oxetanes, aromatic and aliphatic amides and THF in heterocyclic chemistry forming new C-C bonds. Furthermore, the TBADT catalyst tends to close the cycle and promoted further reusable behavior in the catalyst when performing this kind of addition reaction. These reactions are carried out by UV irradiation but even a solar simulator is a good choice [12,13,14,15,16]. Bearing this in mind, we are concentrating on the process of dehydrogenation to produce hydrogen gas (H2) by using the versatility of TBADT.
Many catalysts work for hydrogen production and the decomposition of antibiotics in water to date. However, maintaining green chemistry methods in the preparation, and approaching the necessary goal is vital. In this aspect, new tungsten-based catalysts are highly considered to perform both hydrogen production and OFL decomposition. In this work, BT and TBADT were prepared using a reported procedure. The photocatalytic implementation of the prepared BT and TBADT catalyst were evaluated by the degradation of OFL and hydrogen production from glucose and 2-propanol aqueous solutions under UV-visible light irradiation with the power of 250 W m−2 and 500 W m−2, respectively. The degradation profile of OFL was monitored by HPLC-FD and HPLC-UV, the photoproducts by HPLC-ESI-MS/MS, and the hydrogen production was evaluated by gas chromatography.
2. Results and Discussion
2.1. UV-Visible Absorption Spectra of TBADT
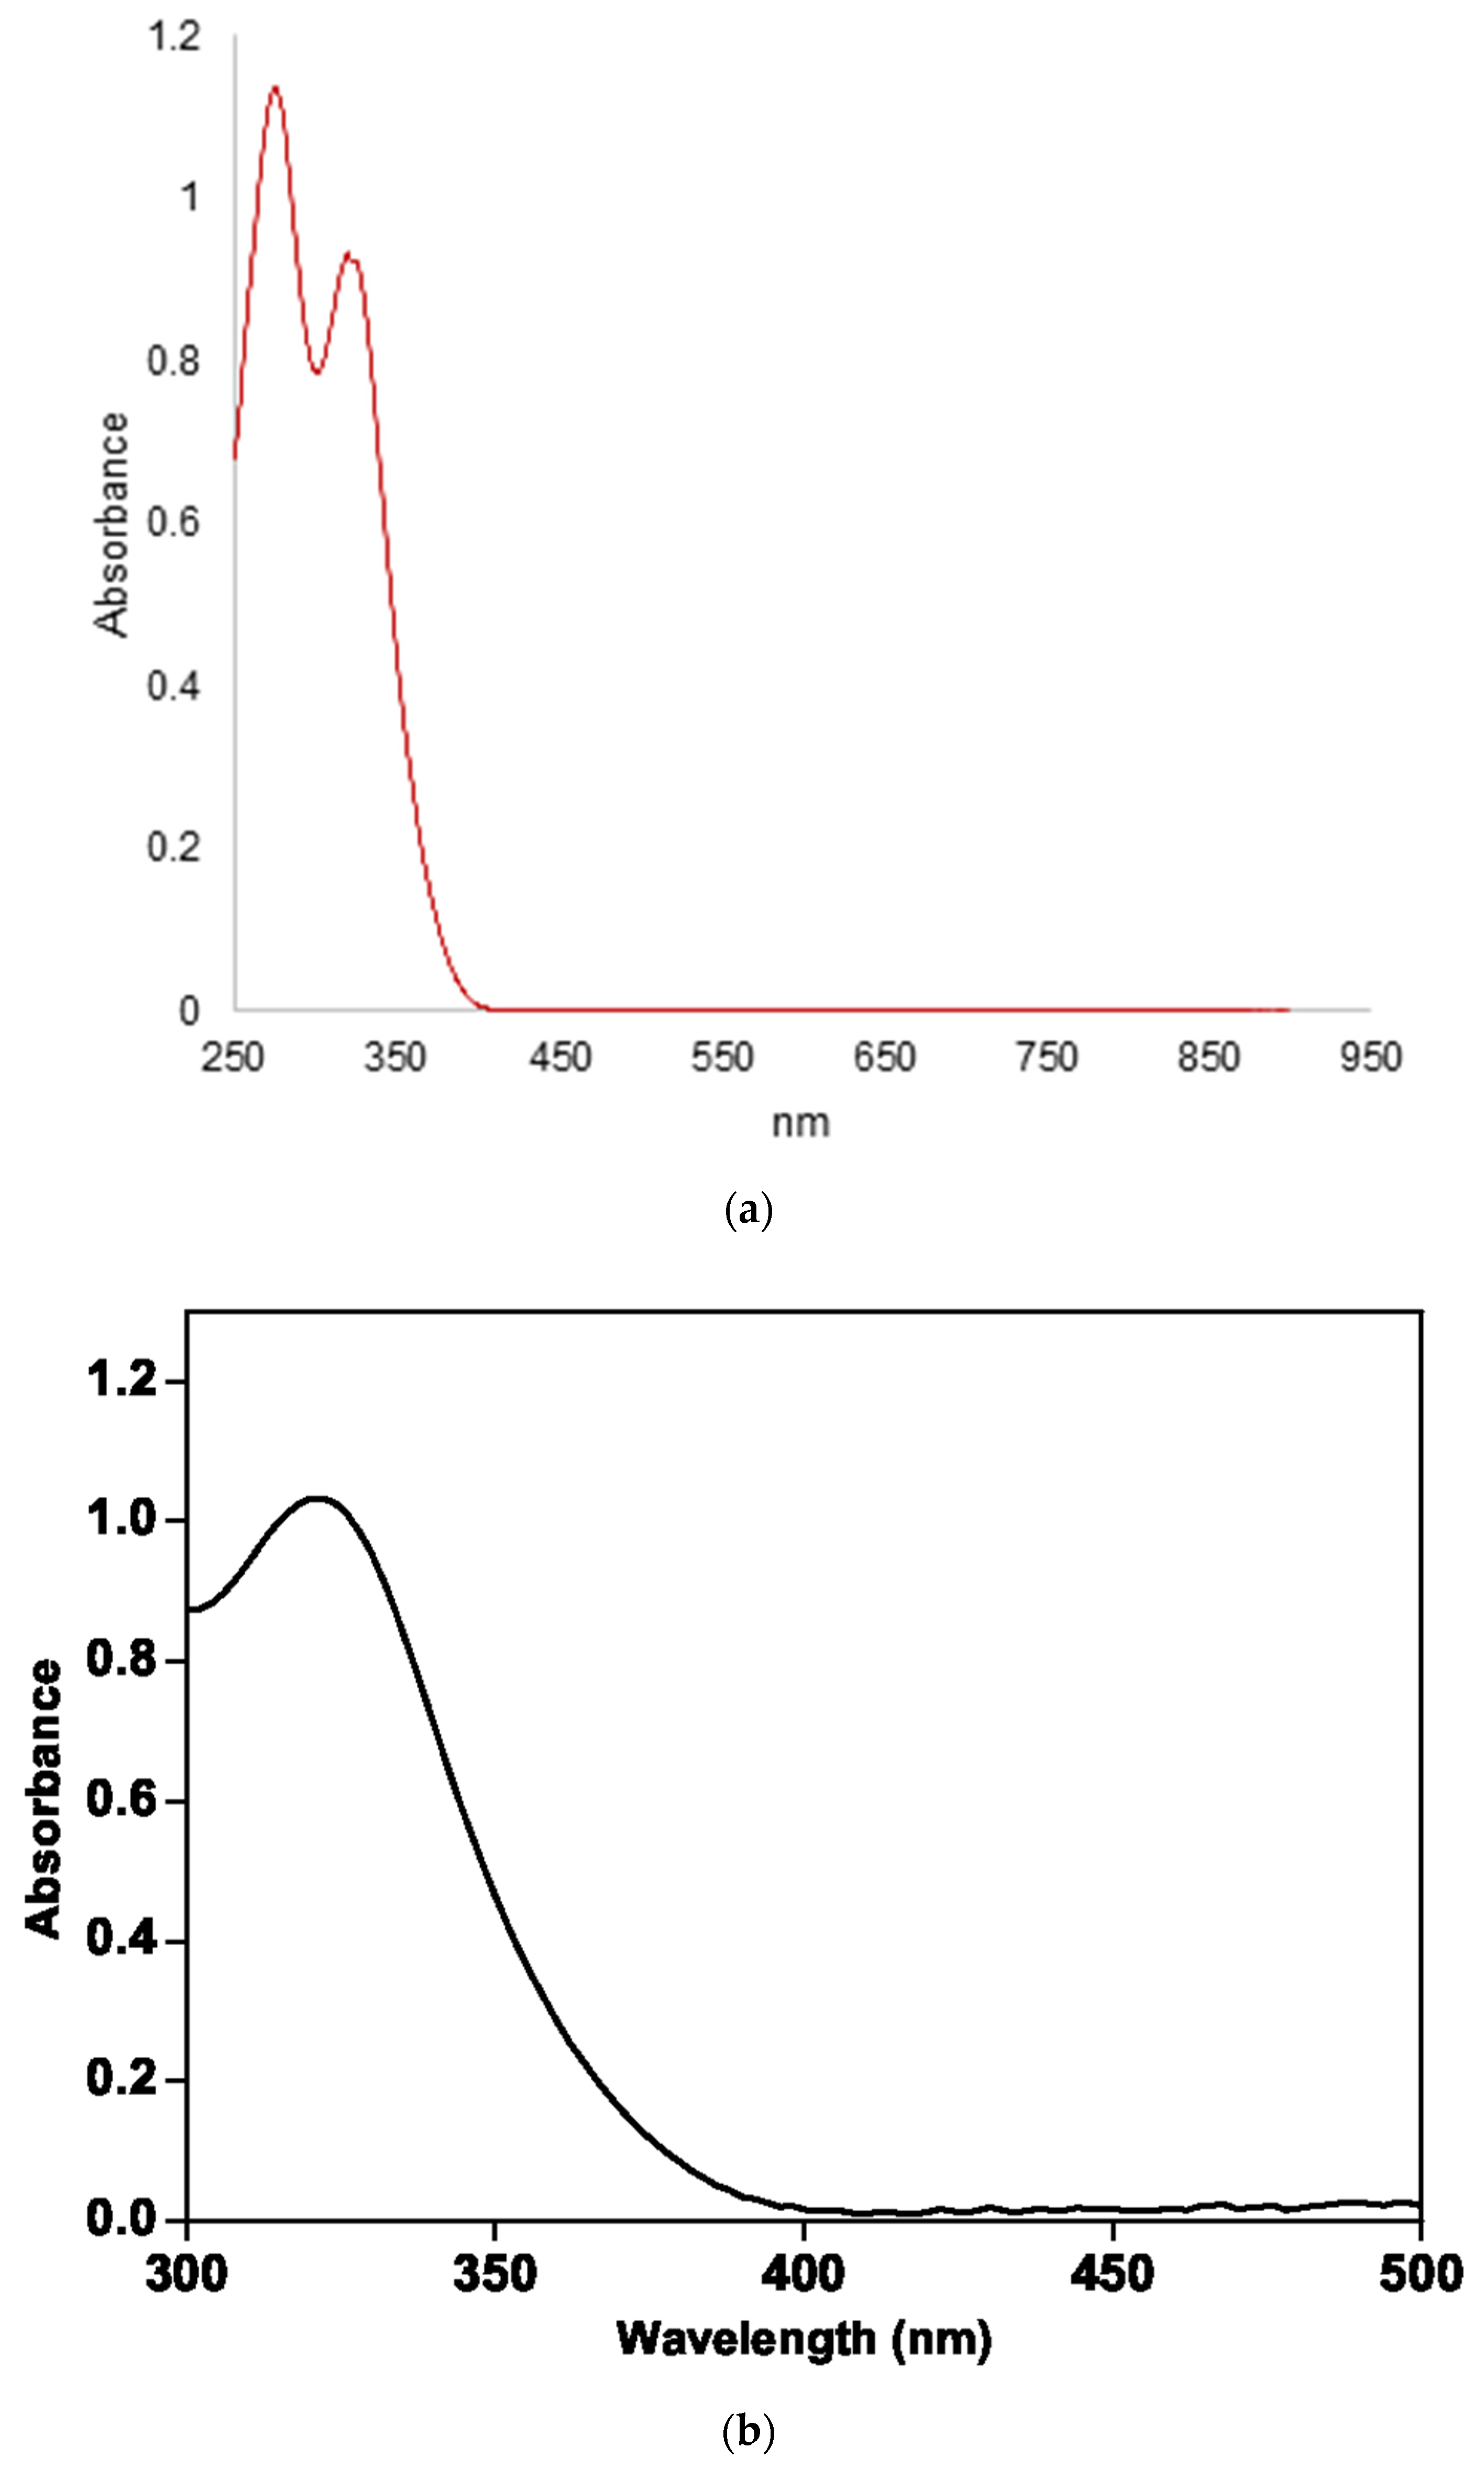
The purity of the synthesized catalyst was evaluated by UV-Visible spectrophotometry (Jasco V-750, spectra acquisition 250–900 nm) on TBADT solutions in acetonitrile, using quartz cuvettes of 1 cm optical path. The molar extinction coefficient (ε) was calculated by considering the characteristic absorption of decatungstate at 323 nm of the observed wavelength with a purity of >90%.
A representative UV-Vis spectrum recorded on an 8.4 × 10⁵ M TBADT solution is shown in Figure 1a. The value of ε, 1.2 × 10⁴ L mol−1 cm−1, is in good agreement with the literature data [17], attesting to the good preparation of the catalyst. In fact, among the different tungsten species that could occur in solution, the decatungstate possesses the highest extinction coefficient in the range considered. The spectrum evidences a light absorption for wavelength ≤ 405 nm. The FT-IR, scanning electron microscopic (SEM), Tauc plot for band gap identification is shown in Figures S2, S4 and S6, respectively and EDX shown in Figure S8. A representative UV-Vis spectrum recorded on 1 × 10⁻⁵ M BT solution is shown in Figure 1b and it is in good agreement with the literature data [14], attesting to the good preparation of the catalyst. The FT-IR, scanning electron microscopic (SEM), Tauc plot for band gap identification is shown in Figures S3, S5 and S7, respectively.
2.2. OFL Decomposition by BT Compared to TiO2 Photocatalyst
A first experiment was carried out using a consolidated approach, i.e., 50 µg L−1 of OFL dissolved in tap water and 0.5 g L−1 of BT catalyst which was then added into it. The decrease in the OFL concentration was measured by using HPLC-FD as a function of time.
A fast and quantitative drug degradation was observed within a few minutes of irradiation (Figure S1).
As previously demonstrated, tap water mimics environmental water samples well in terms of pH, ionic strength, dissolved organic matter [18], and, in addition, its composition is invariant over time. For these reasons, further kinetic experiments were carried out in the same matrix, using one tenth (1/10) of the catalyst amount (0.05 g L−1) to follow the degradation profile better.
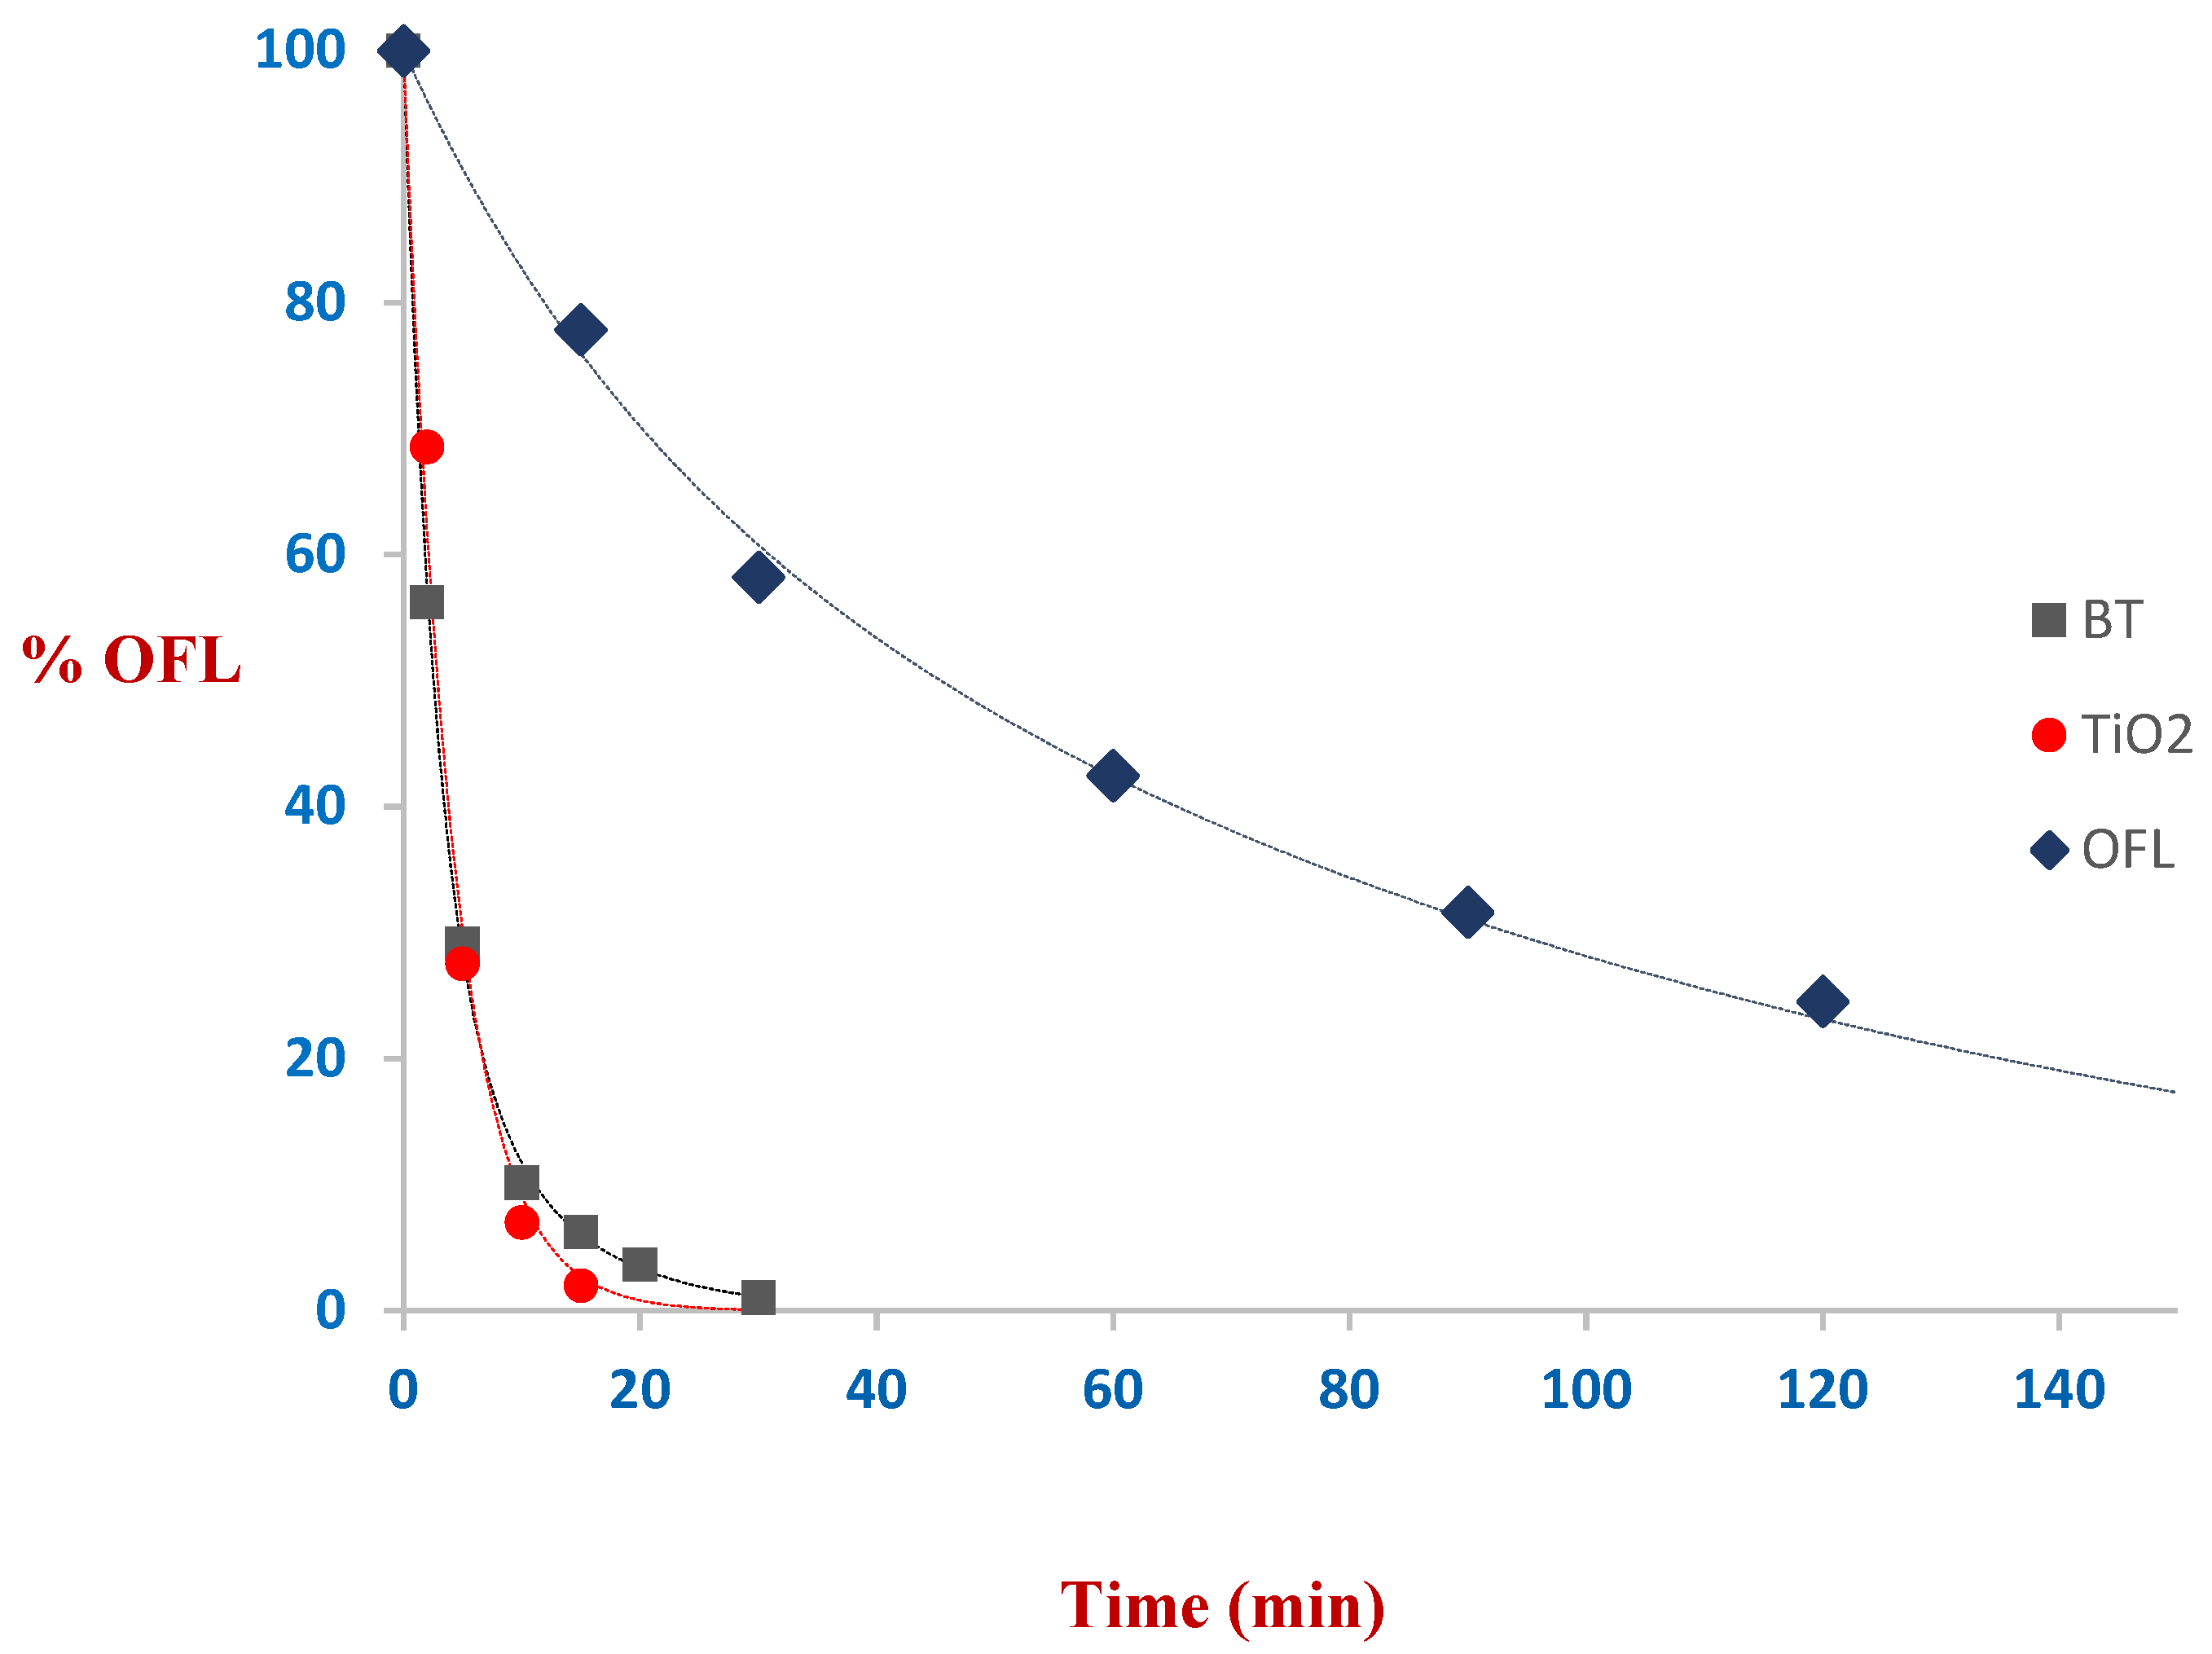
As shown in Figure 2, OFL proved to be susceptible to BT photodegradation in 20 min under simulated outdoor conditions, following a bi-exponential first-order law (Equation (1)):
The kinetic degradation constants, the pre-exponential factors of an R2 value, were determined by dedicated software (Figure P application, Figure P Software Corporation) and are reported in Table 1. The bi-exponential decay was already observed for FQs [18,19] and referred to the role of two ionic forms.
For comparison, we investigated OFL photolysis and OFL TiO2-promoted degradation under the same experimental conditions, except for the equilibration step. It was previously demonstrated that sonication or magnetic stirring did not greatly affect OFL TiO2-promoted degradation [20].
Interestingly, a quantitative OFL removal occurred slightly faster with TiO2 than BT. The experimental data were well fitted by a mono-exponential first-order law (Equation (2)):
OFL TIO2-degradation profile, the kinetic constant and R2 value are shown in Figure 2 and Table 1, confirming the trend already observed [20].
To summarize, BT seems to be as efficient in drug removal as TiO2 P25, the most used and efficient photocatalyst in advanced oxidation processes for environmental remediation [21].
2.3. Mechanism of OFL Decomposition in Presence of BT under Simulated Solar Light
Since the degradation kinetics showed a biexponential consumption, two different concurring mechanisms are involved. For this reason, together with the classical photodegradation reactions (Equations (3)–(8)) we consider a direct degradation of OFL onto BT (Equation (9)). Preliminary photocatalytic experiment (50 µg L−1 OFL, 0.5 g L−1 BT), and OFL adsorption in the dark (50 µg L−1 OFL, 0.5 g L−1 BT) are shown in Figure S1.
Bi2WO6 + hν → h+ + e−
O2 + e− → •O2−
•O2− + h+ → 1O2
O2 + 2e− + 2H+ → H2O2
•O2− + H2O2 → •OH + OH− + O2
h+ + H2O → •OH + H+
Bi2WO6 * + OFL → Direct degradation
(h+) (1O2) (•O2−) (•OH) + OFL → Degradation photo products
2.4. Photoproducts Identification by HPLC-ESI-MS/MS
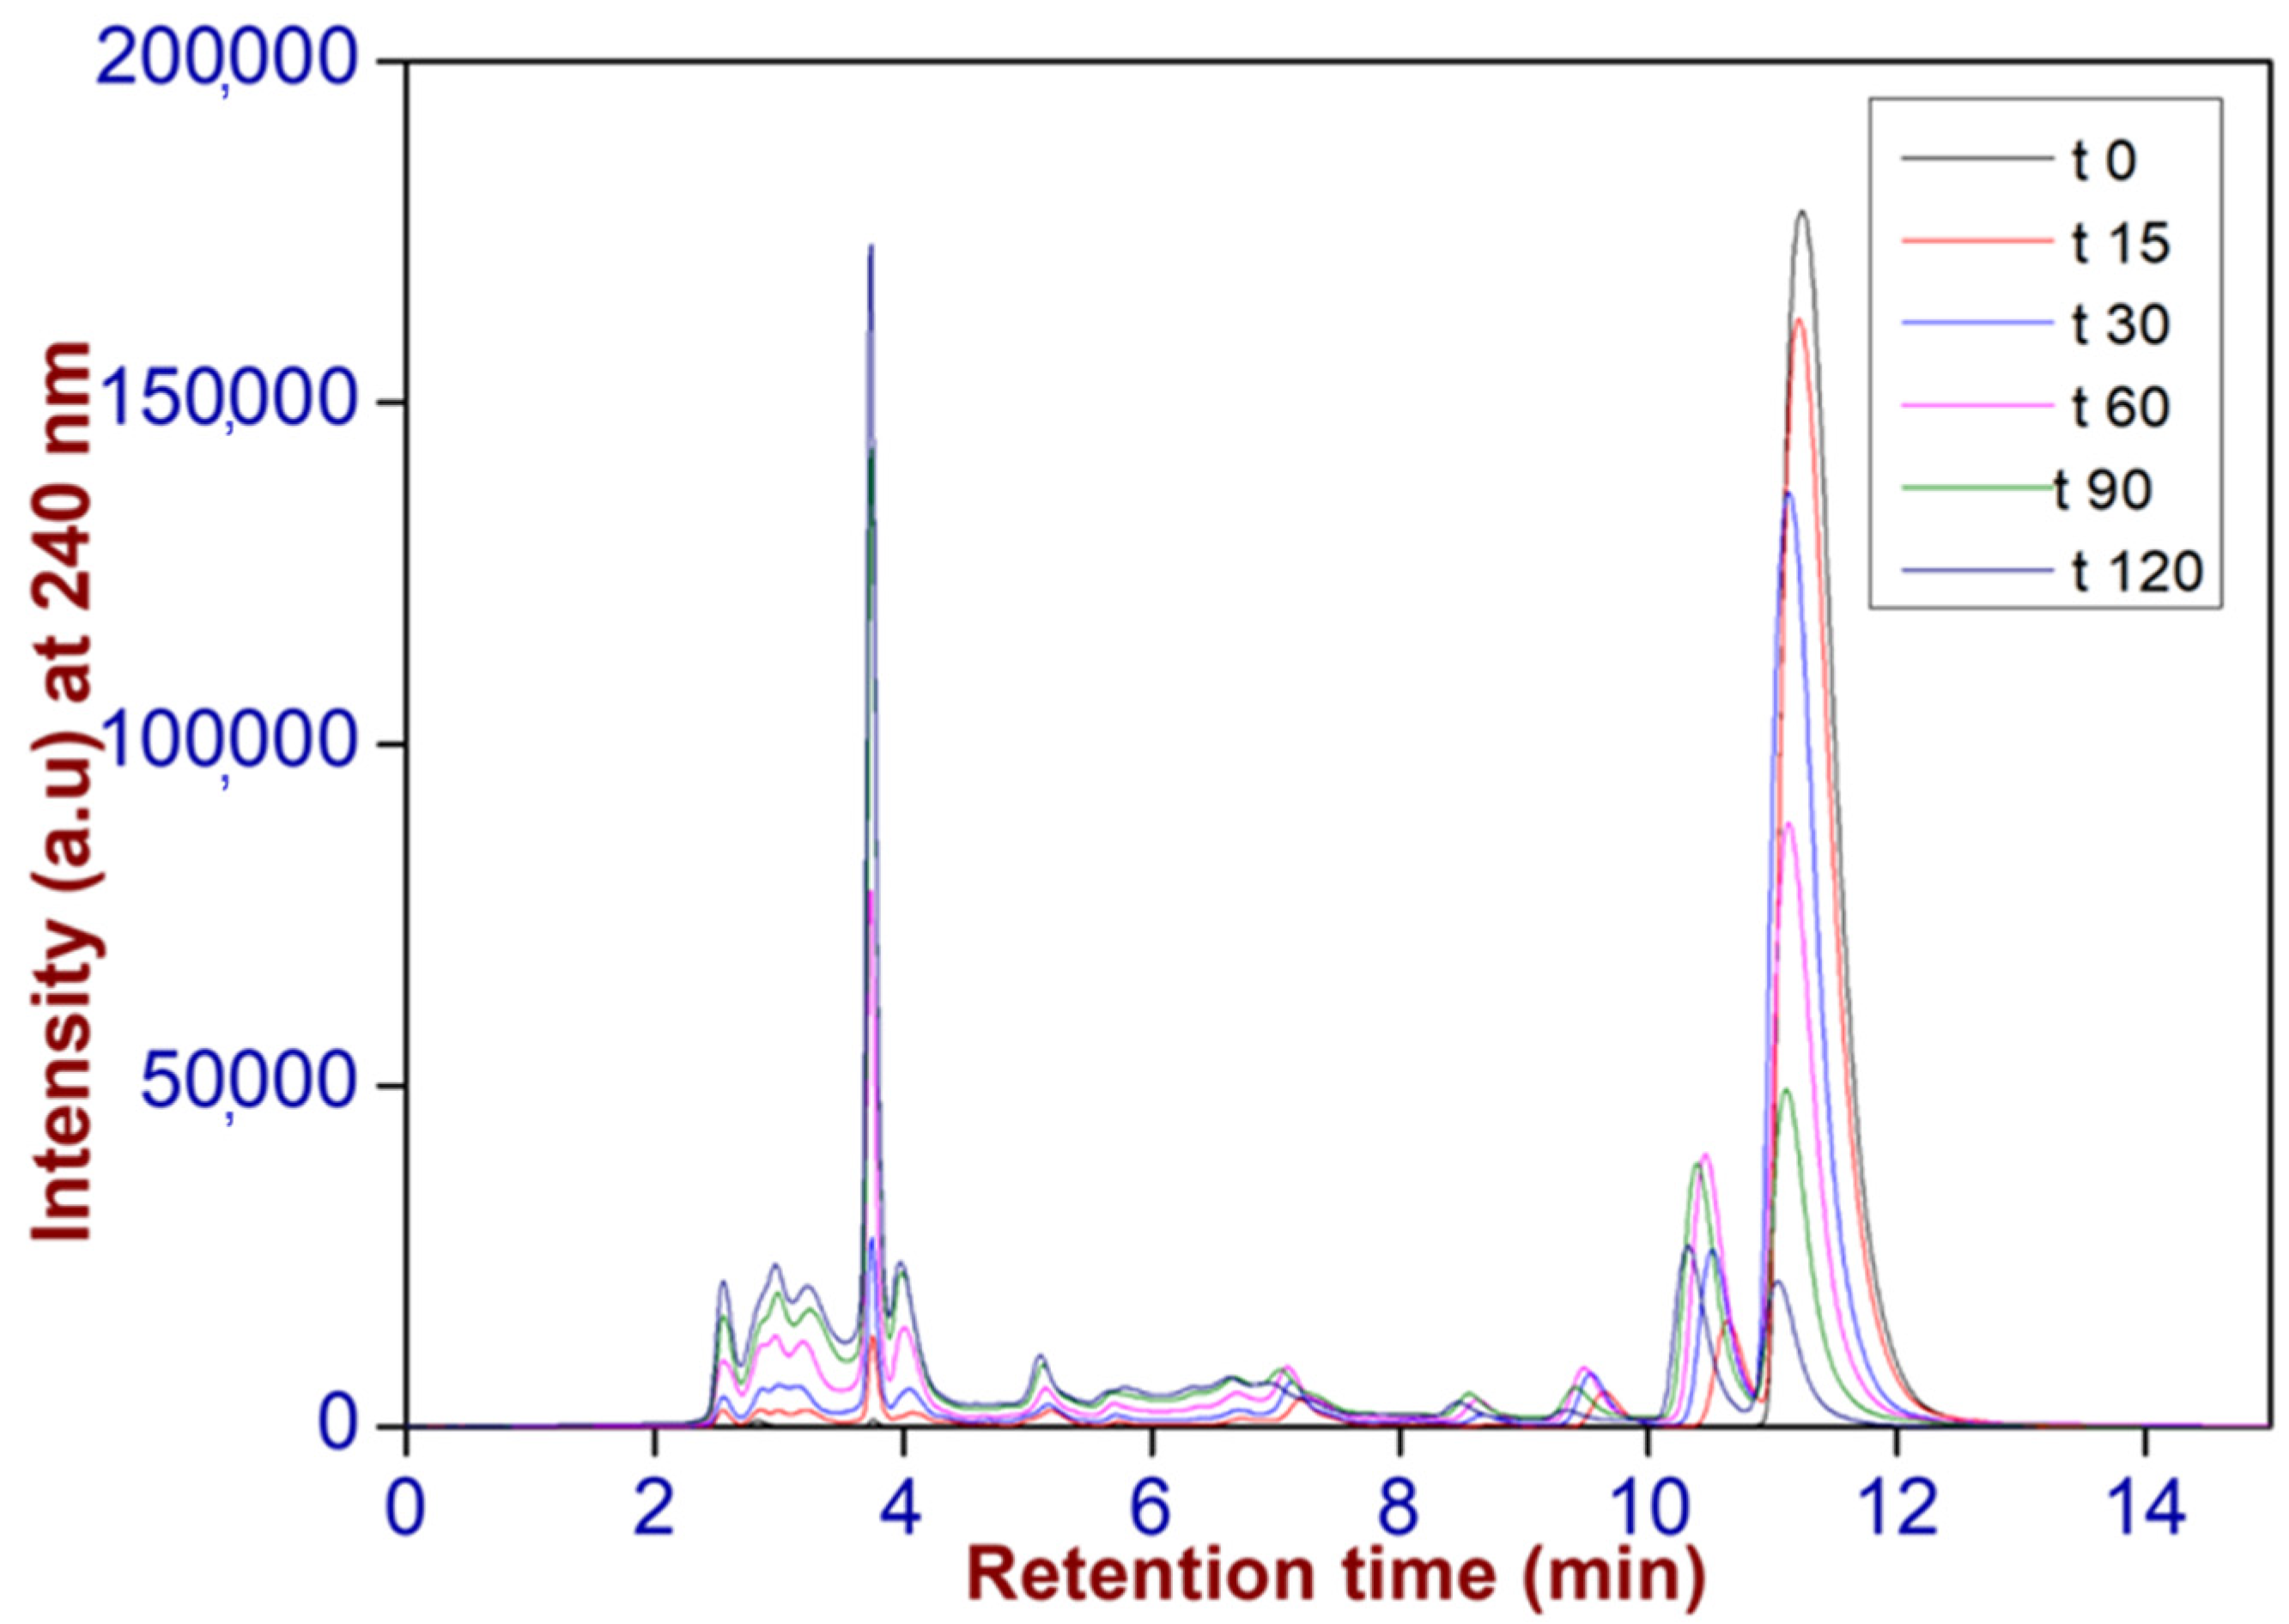
The main photoproducts formed during simulated solar light irradiation of 110 mg L−1 OFL in the presence of BT catalyst were first monitored by HPLC-UV, which is shown in Figure 3. The higher concentration was used to detect photoproducts. As shown in Figure 3, the maximum amount of detectable photoproducts were formed after 60 min of irradiation by a solar simulator with a sensible decrease in the OFL intensity at 240 nm.
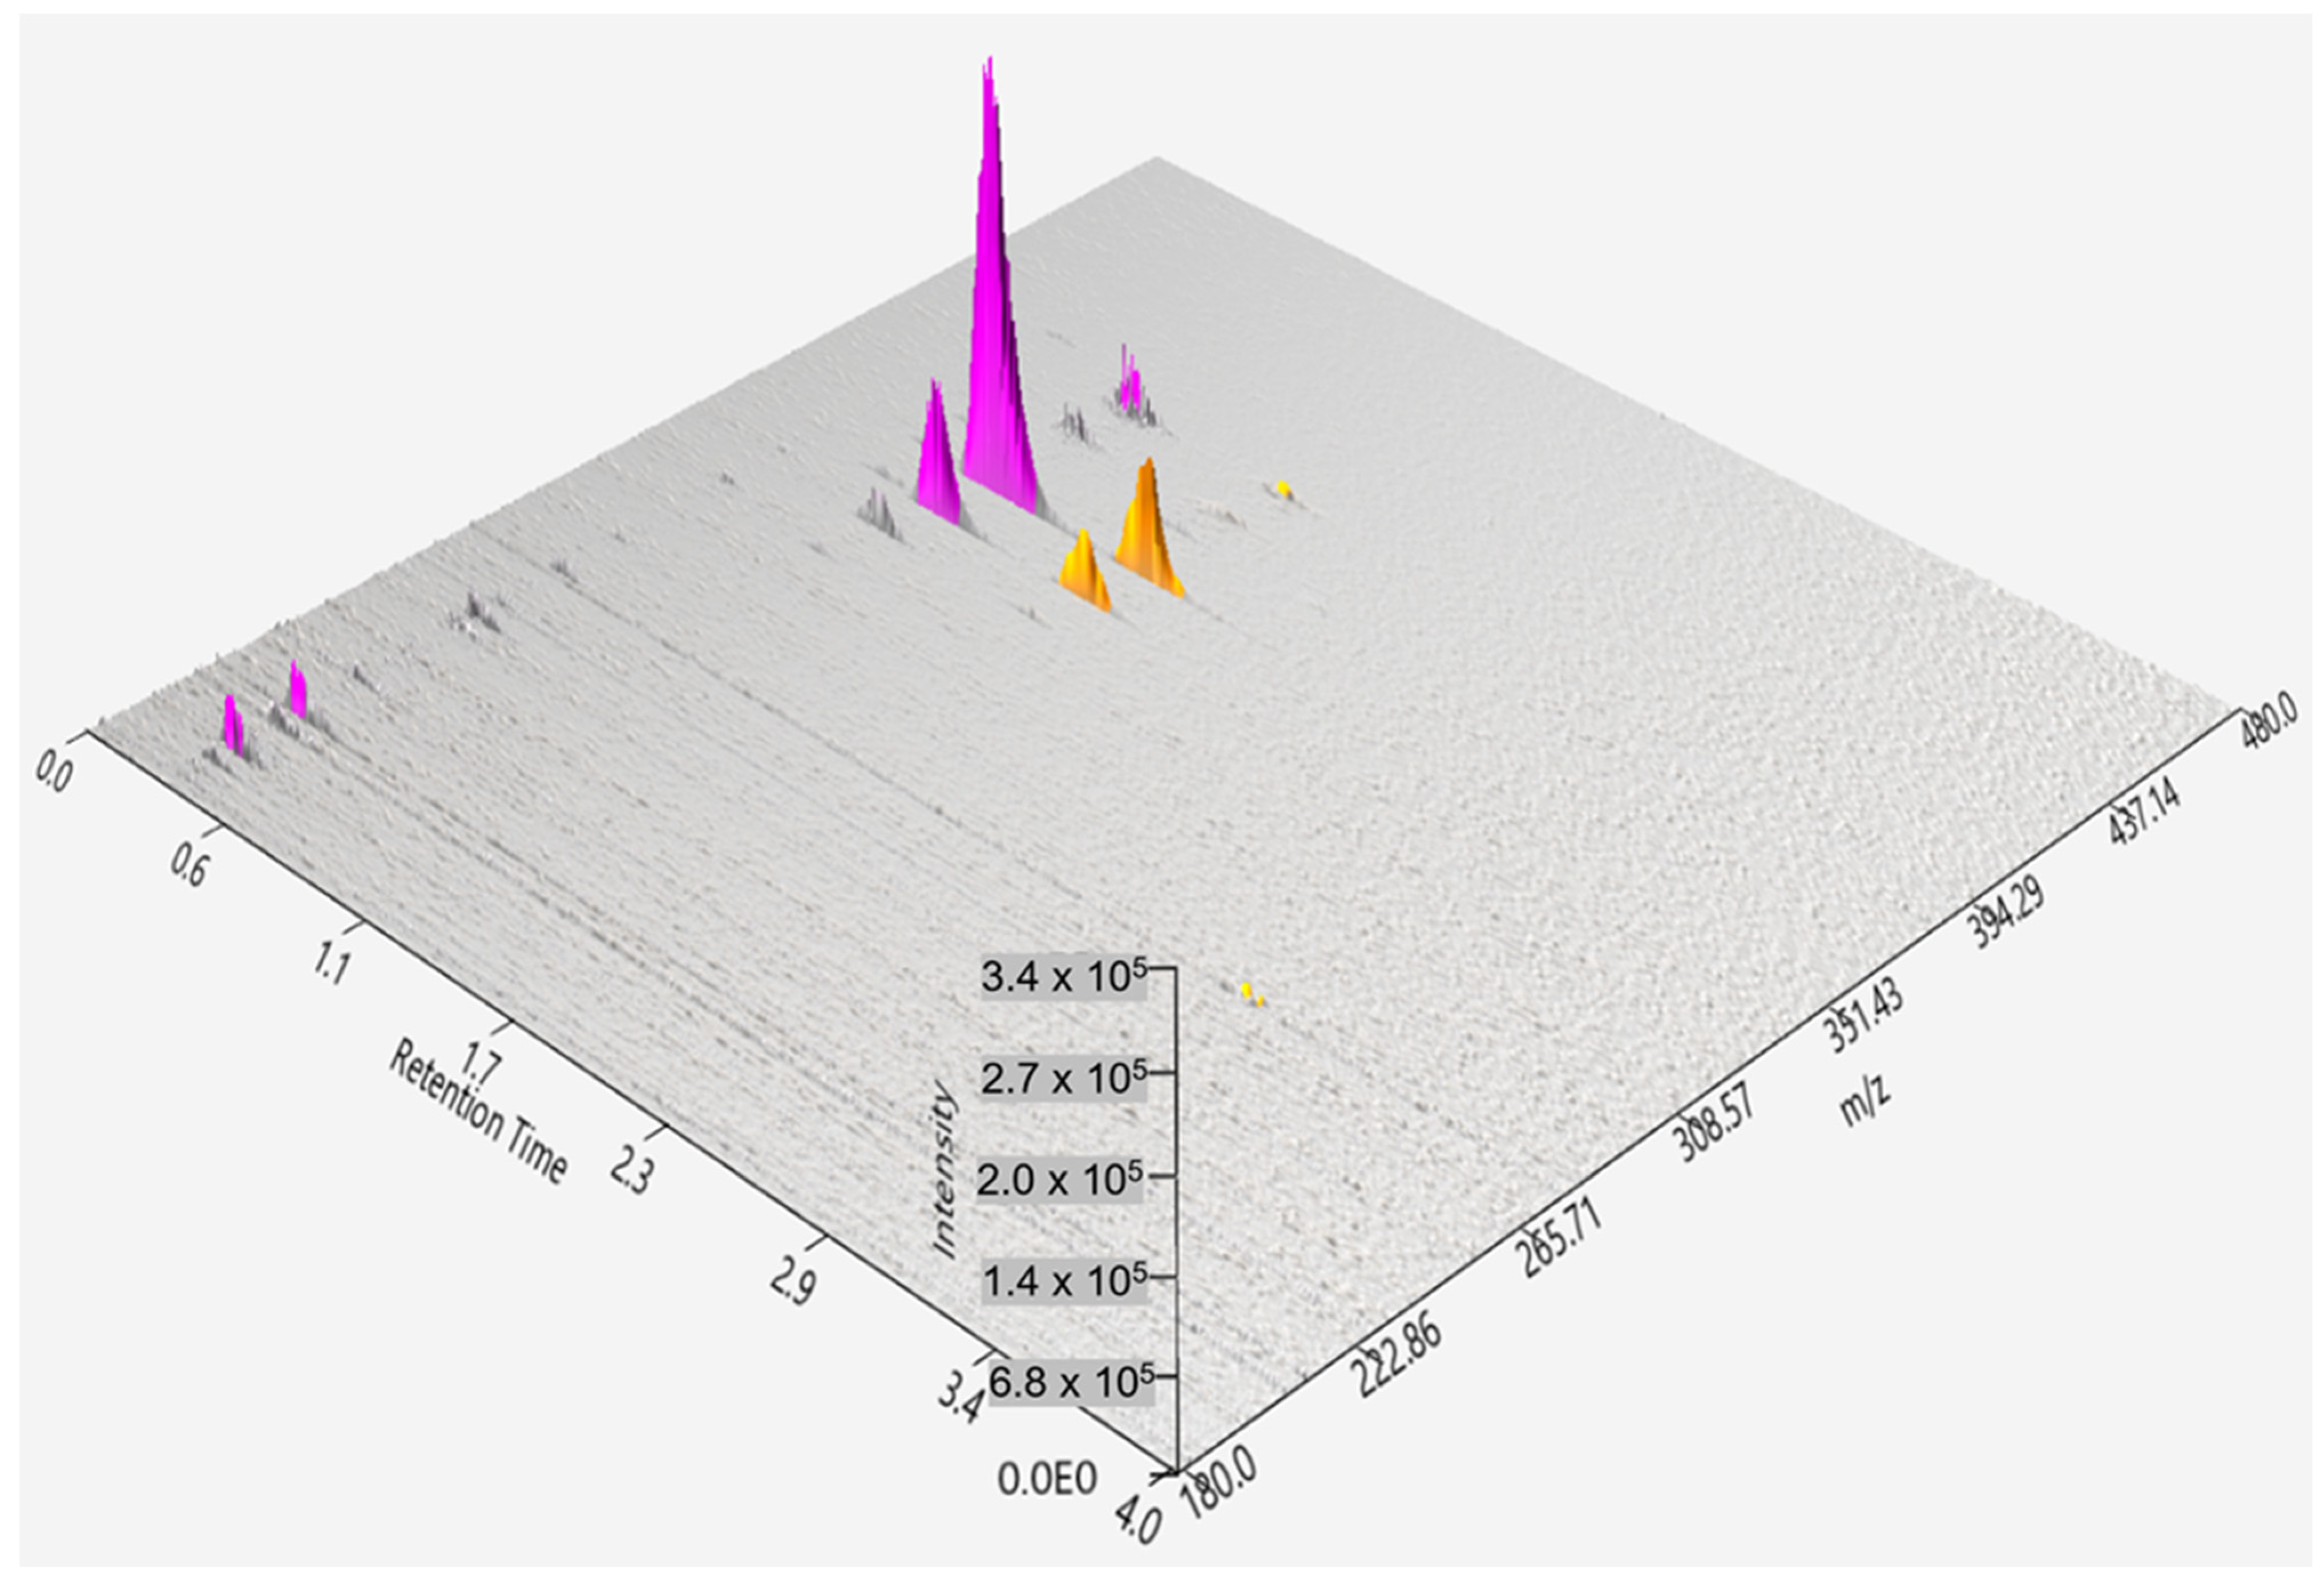
The same trend is confirmed by HPLC-MS. The molecular weight of photoproducts is identified by HPLC-ESI-MS/MS and their possible tentative structures are identified, and some new photo-products are identified. Samples of OFL with the effect of BT catalyst at 60 min and 90 min of solar simulator irradiation time are shown in Figure 4. As is visible, there is also a presence of lower m/z (<100) compounds coming from the decomposition of the piperazine ring. A list of the identified peaks, ordered from the lowest to the highest m/z, is shown in Table 2.
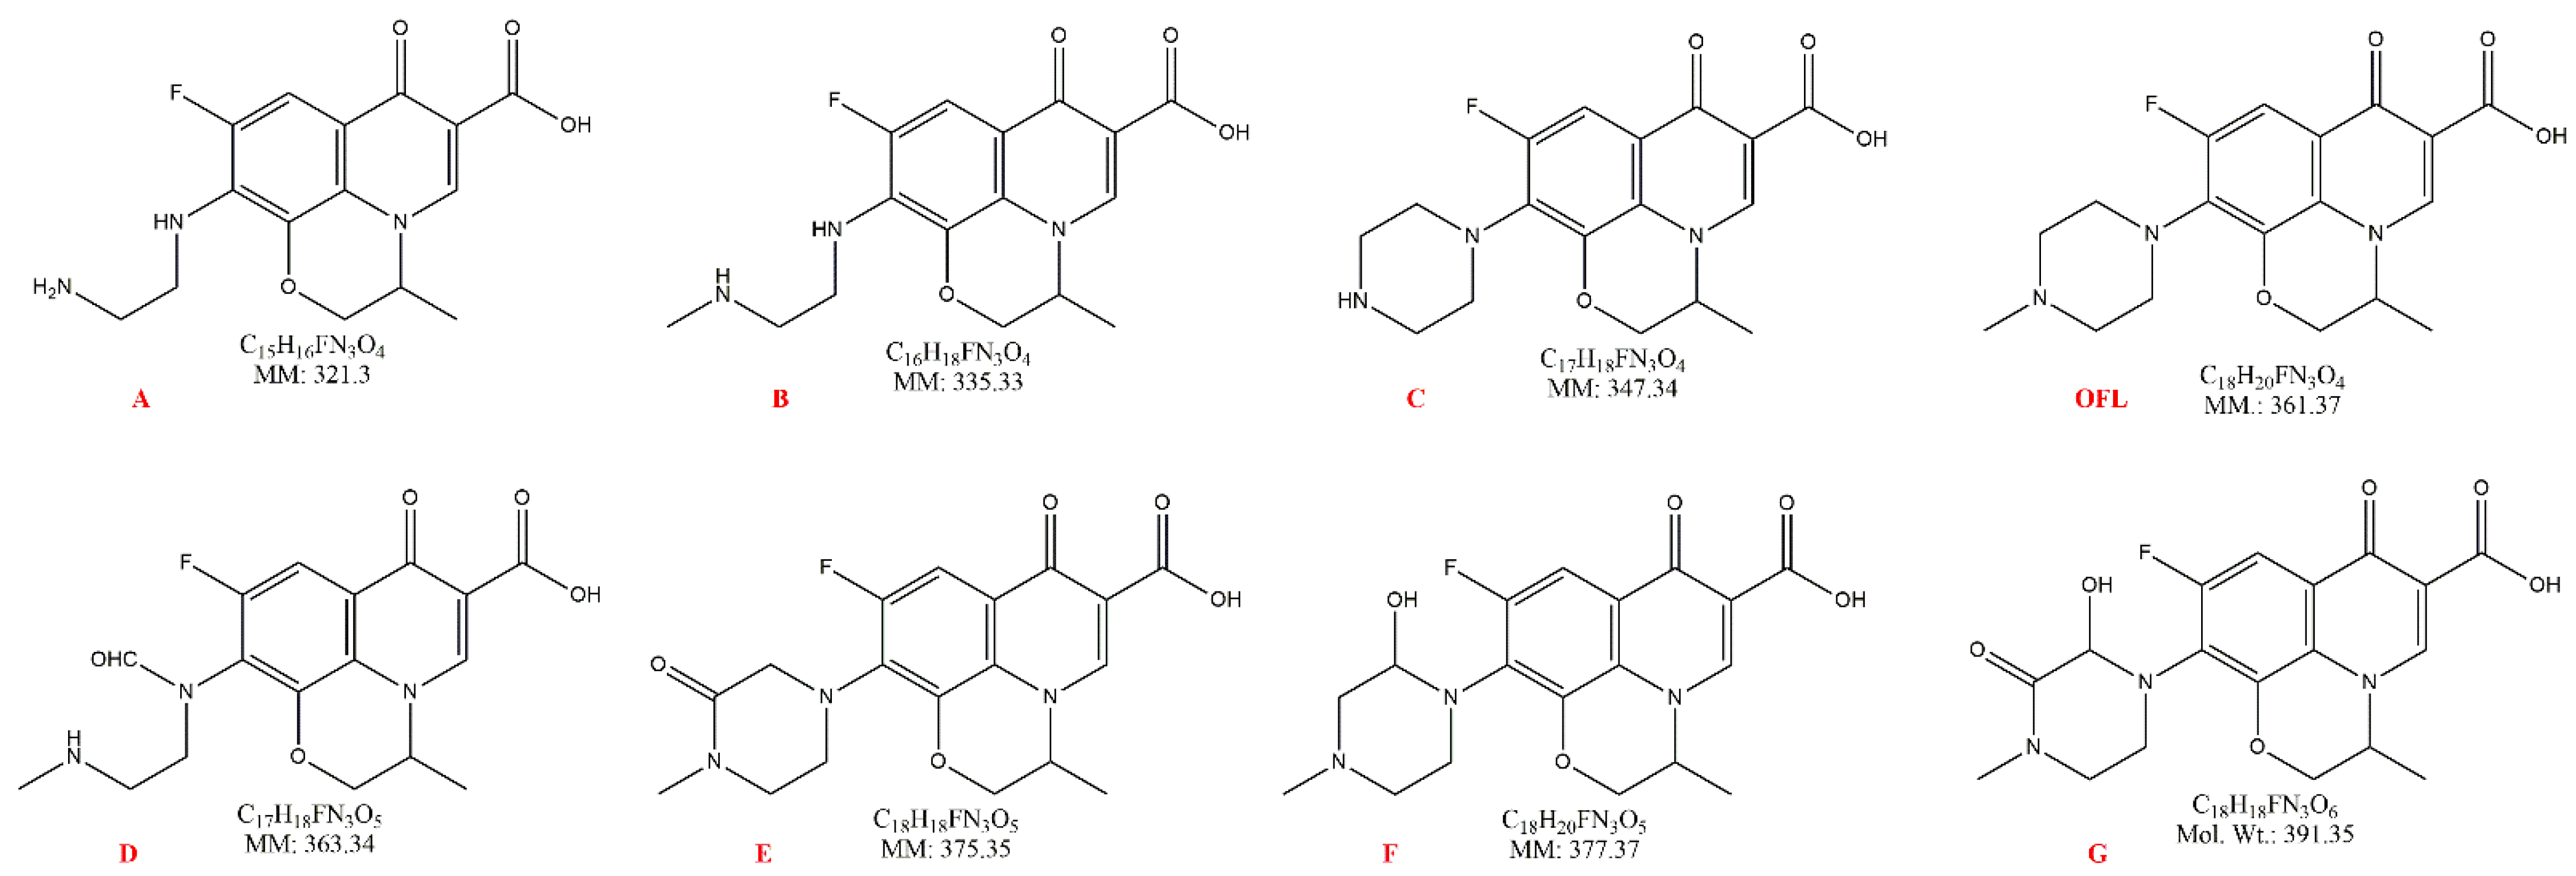
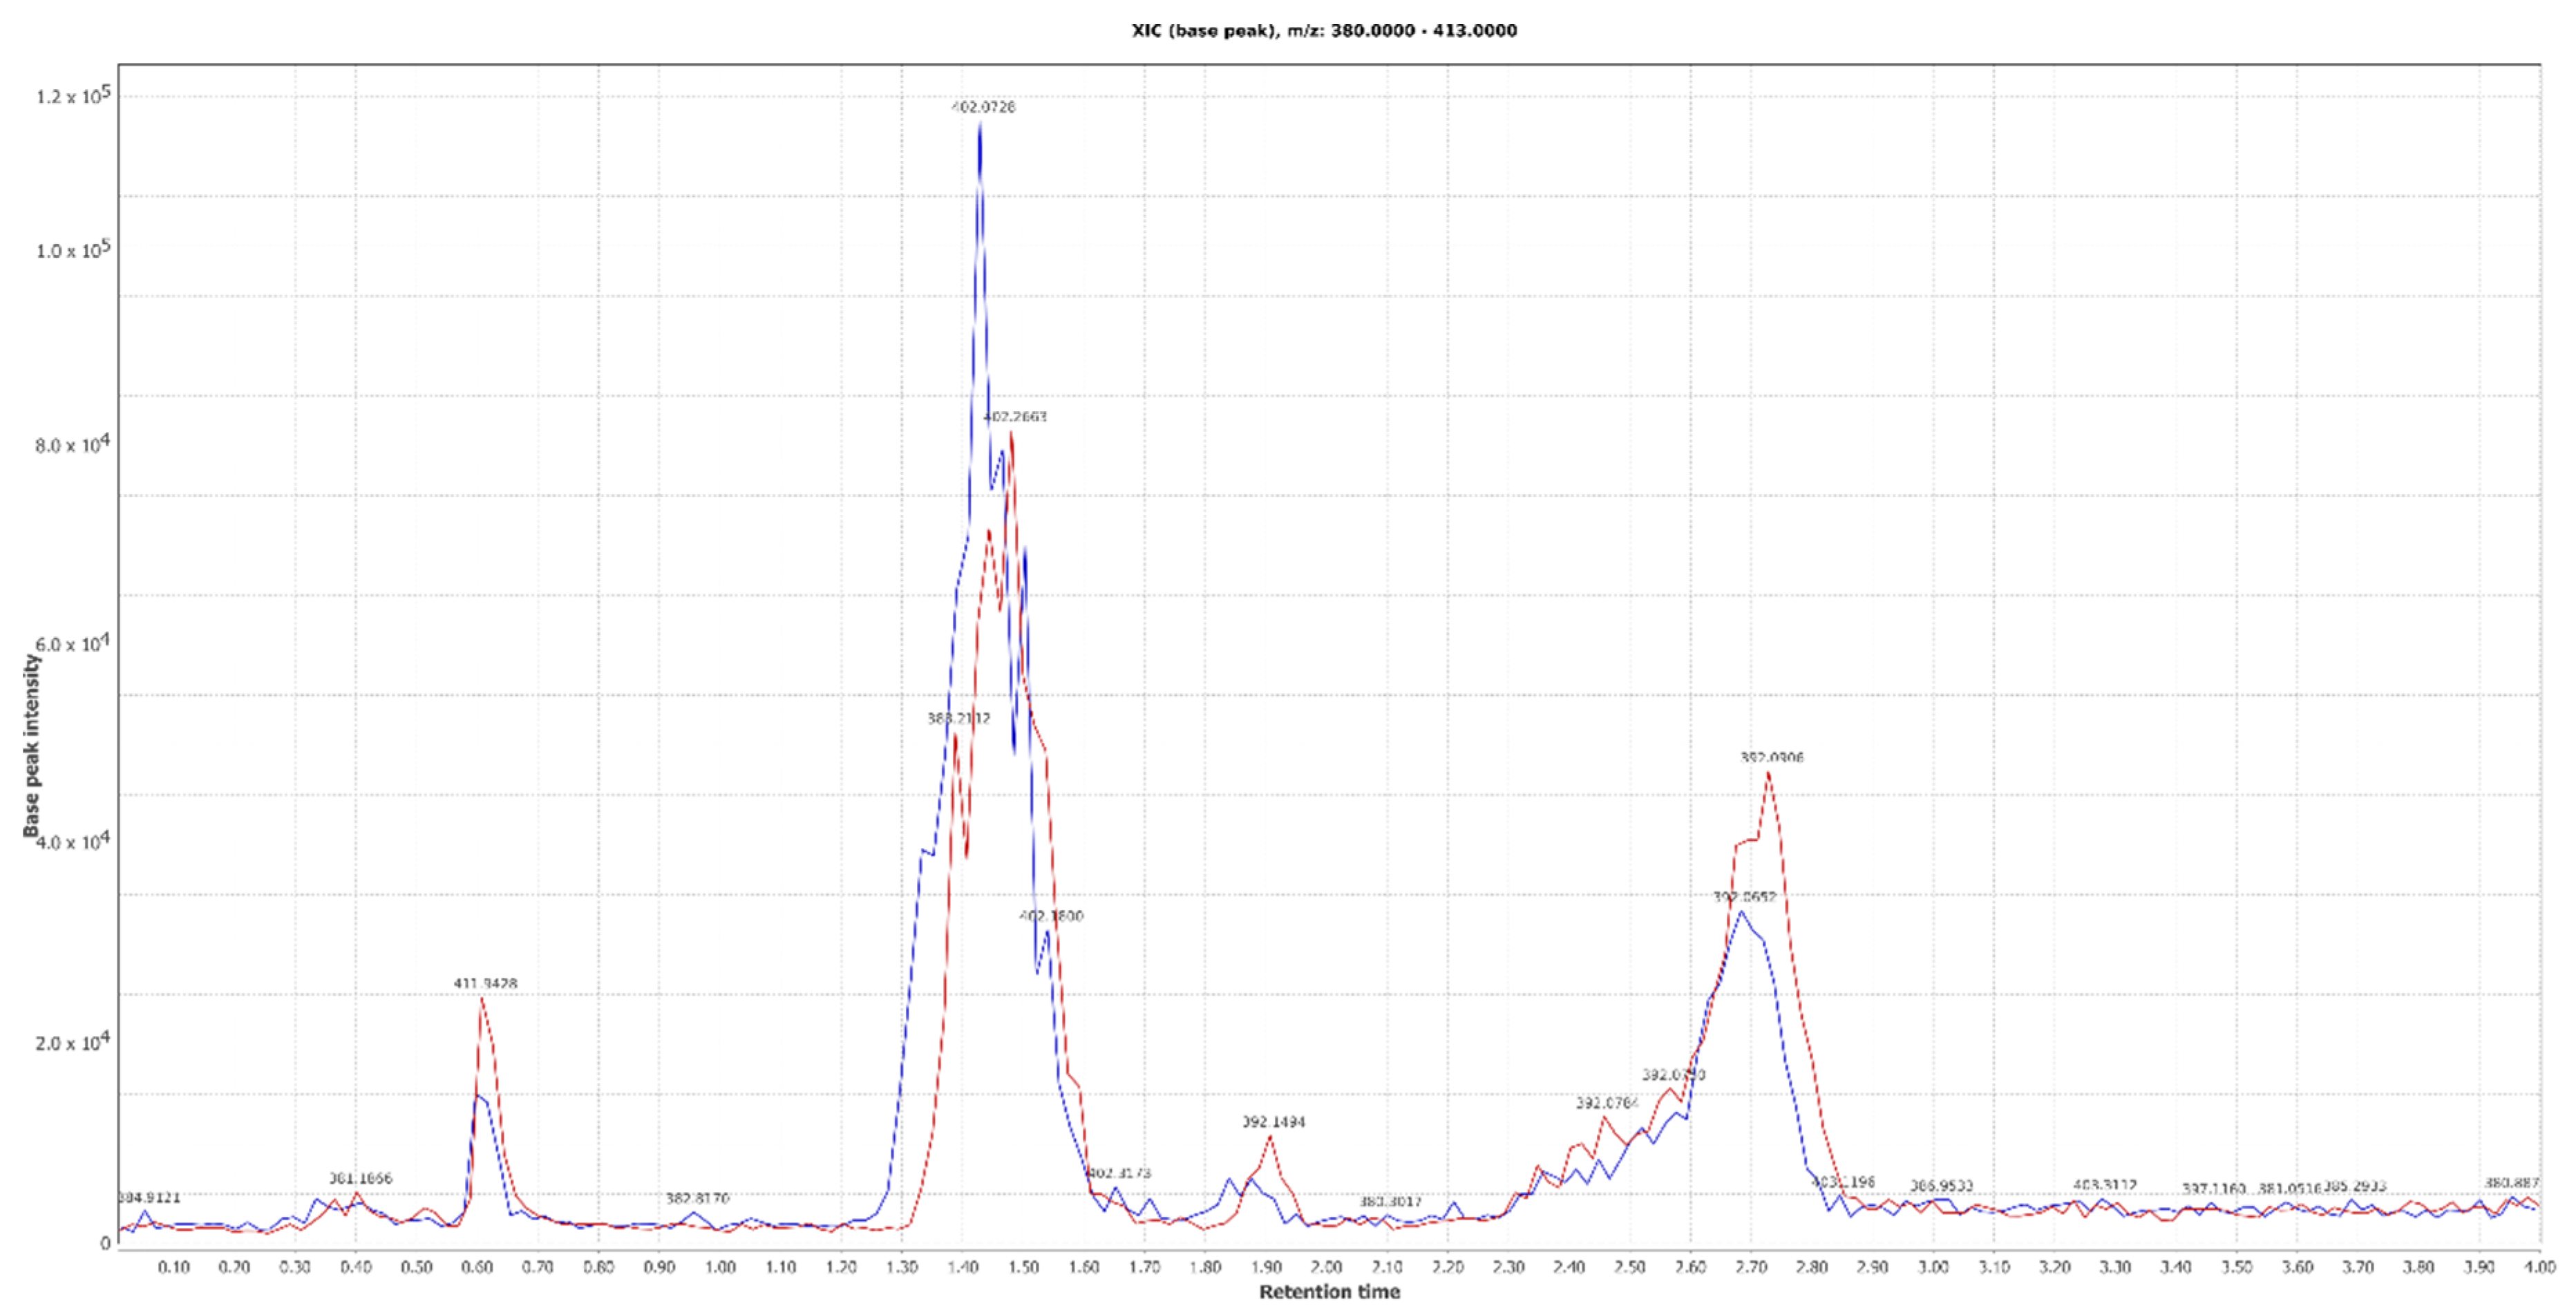
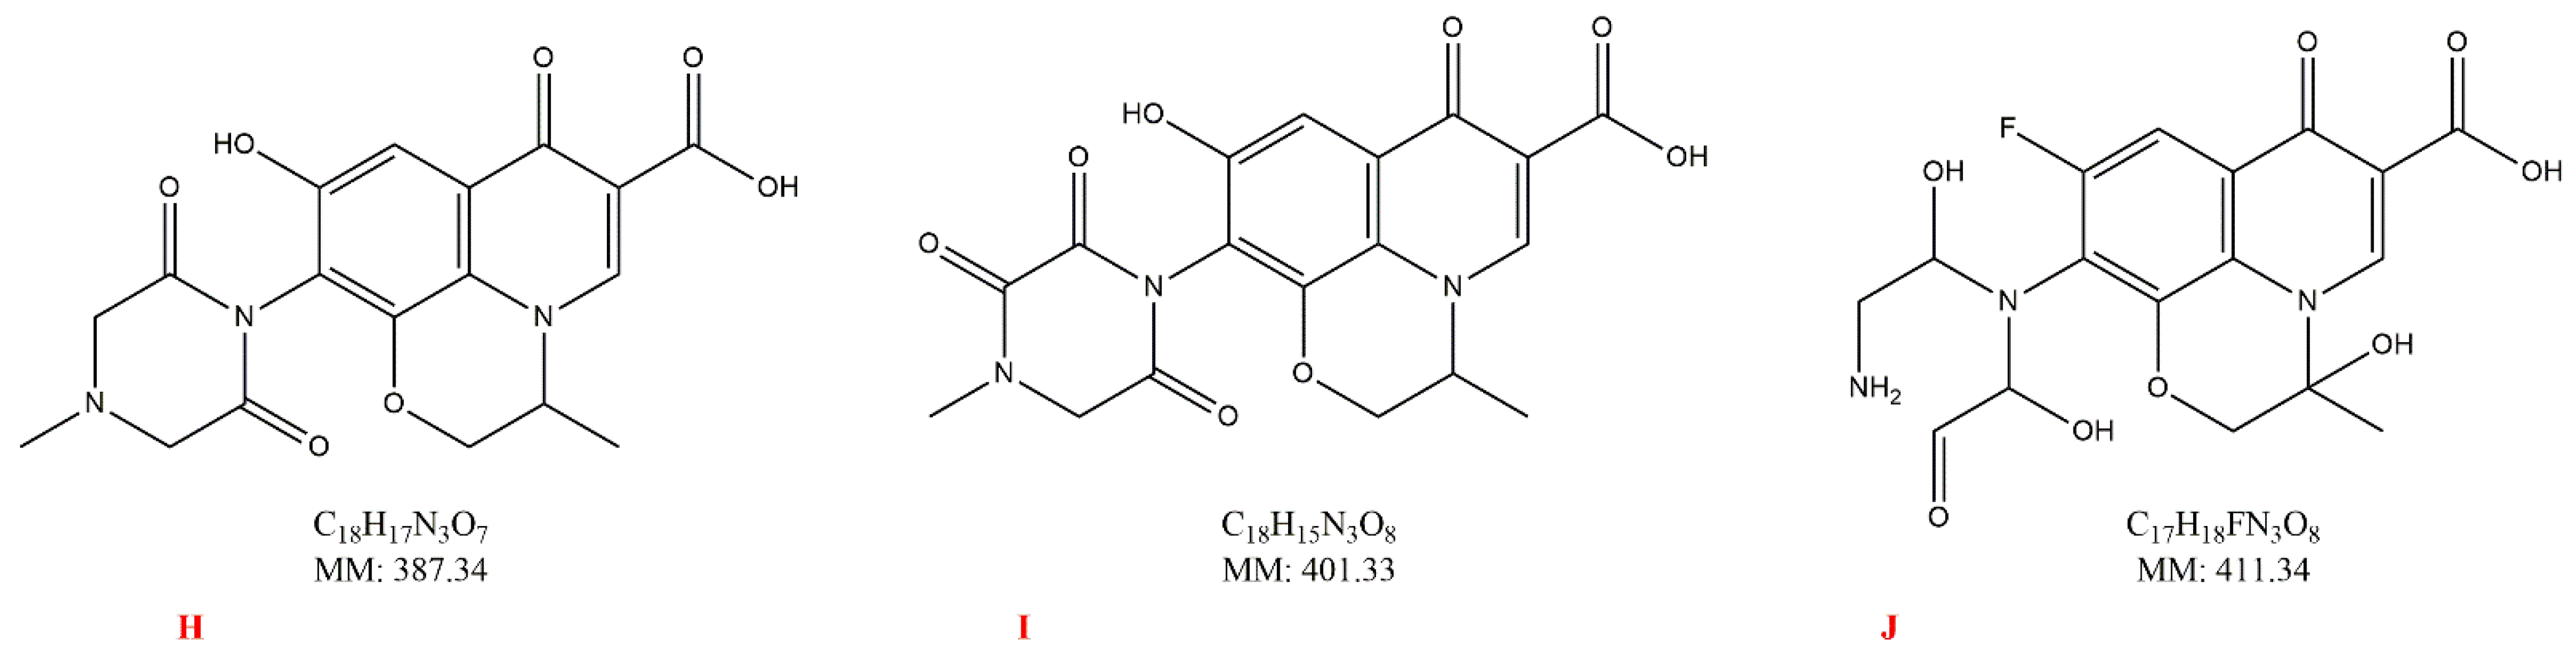
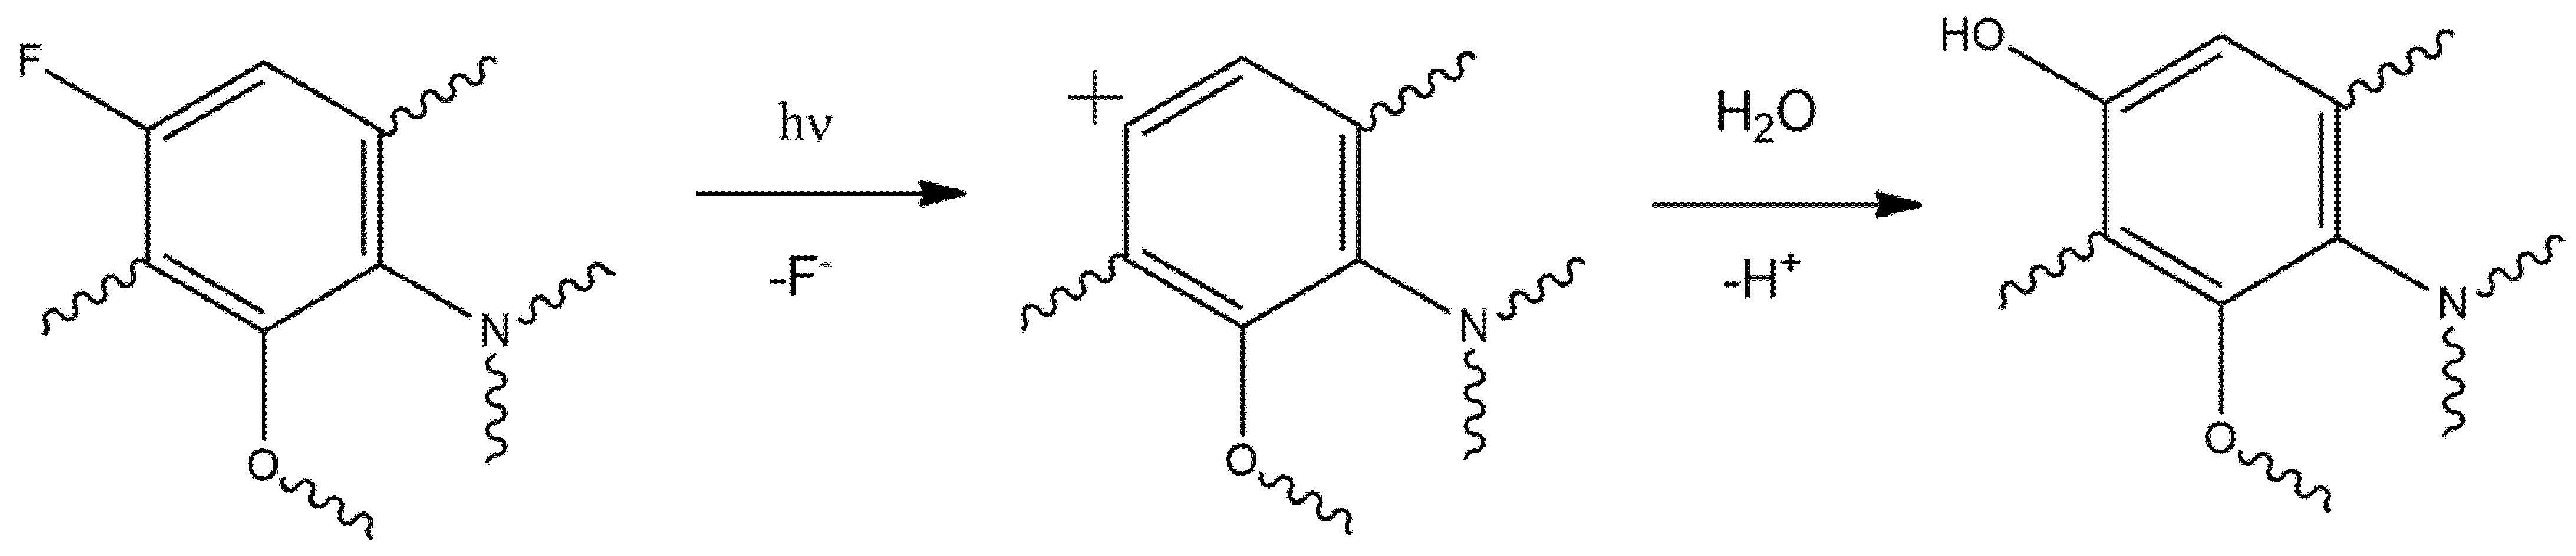
The compounds that are named A–G are already described in the literature and their structures are shown in Figure 5 together with the starting material (OFL). Together with the compound A–G, we observed three more structures with m/z values of 392, 402 and 412. Their peaks are shown in Figure 6. A tentative identification of their structures is shown in Figure 7. For the compound J, we assumed hydroxylation of the morpholine ring, while for compounds H–J we supposed a photo-nucleophilic substitution of fluorine via aryl-cation (Figure 8) [22,23].
The m/z value of 362 corresponds to the (M + 1) peak of OFL with the retention time of 1.41. The m/z value of 378 corresponds to the formation of the main oxidized product (F) of OFL in accordance with the MS2 degradation spectrum. The m/z value of 322 corresponds to the A oxidized photoproduct according to MS2 fragmentation spectra [20]. The m/z values of 336, 348 correspond to the formation of the main oxidized product B, C of OFL compared with the MS2 degradation spectrum [24]. Additionally, the photoproducts were verified for photo-reaction under solar simulator light for 90 min by BT in the decomposition of OFL to verify the possibility of further products, but the same photo-products visible for light exposure of 1 h for the decomposition of OFL by BT were observed [25].
2.5. Hydrogen Evolution Experiments
Regarding photocatalytic H2 evolution, experiments have been performed on 2-PrOH aqueous solutions, and on glucose, representative of biomass-derivatives. It was found that 1 g L−1 catalyst in 0.1 M 2-PrOH provided a marked improvement in the H2 evolution from the solution. The mean hydrogen evolution ration (HER) was 10 µmol g−1 h−1 (RSD < 20%, n = 7). A similar behavior was observed to be working in 0.1 M glucose, obtaining a mean HER of 7 µmol g−1 h−1 (RSD < 20%, n = 7). These values correspond to a 20/30-fold higher H2 formation compared to the control samples, i.e., aqueous glucose or 2-PrOH irradiated under the same conditions but omitting the catalyst. Indeed, in these cases, the evolved H2 was below the instrumental quantification limit, clearly underlining the role of the catalyst. Undetectable H2 resulted from the irradiation of pure water, as expected. The reaction occurs via the excited state of decatungstate (indicated as W).
In the first step, decatungstate absorbs a photon transitioning into its excited state (R1). The excited state can perform a hydrogen atom abstraction (HAT) onto a hydrogen donor, giving rise to the decatungstate reduced state with the formation of a radical. In the last step (R3) two molecules of reduced decatungstate reform the catalyst (thus closing the catalytic cycle) with the concurrent formation of a molecule of hydrogen.
W + hν → W *
W * + RH → WH + R• (HAT)
2WH → 2W + H2
These preliminary results suggest that further work should be addressed to refine the experimental conditions (e.g., catalyst and organic substrates concentrations) and to combine decatungstate with other agents to improve its photocatalytic activity and to expand its light absorption in the visible range. In some cases, the persistent blue colour of reduced decatungstate (WH) is observed, indicating that the closure of the catalytic cycle is the most difficult step.
3. Experimental Section
3.1. Reagents and Materials
OFL VETRANALTM, analytical standard by Merck Life Science S.r.l. (Milano, Italy) was purchased from Merck (Milano, Italy). High-performance liquid chromatography (HPLC) gradient–grade acetonitrile (ACN) was supplied by VWR International (Milano, Italy), H3PO4 (85% w/w), and water for liquid chromatography/mass spectrometry (LC/MS) was supplied by Carlo Erba Reagents (Cornaredo, Milano, Italy). Evonik P25 TiO2 (80% anatase, 20% rutile, particle size 30 nm, surface area 50 ± 15 m2 g−1) was purchased from Evonik Industries AG (Hanau, Germany). Working tap water OFL solutions were prepared before use. The microwave system Marsxpress was supplied by CEM (CEM S.r.l., Cologno al Serio, Italy).
3.2. Synthesis of BT and TBADT
BT was synthesized as reported in the literature [26] via the hydrothermal reaction of bismuth nitrate (Bi(NO3)3) (5.0 m mol) and sodium tungstate (Na2WO4) (2.75 m mol) in an aqueous phase. Both the mixtures were mixed in a magnetic stirrer and sonication was performed, followed by 20 h of microwave and cooling to room temperature, after which white precipitate was collected by centrifuge. Briefly, the microwave synthesis was performed by a Marsxpress microwave equipped with an 8 PTFE vessel carousel and internal temperature control. The maximum irradiation power was 800 W at a temperature of 160 °C (15 min temperature rate) maintained for 20 h. TBADT was prepared by a consolidated procedure [16]. Tetrabutylammonium bromide (2.5 g) and sodium tungstate dihydrate (5.0 g) were dissolved each in 150 mL of water, kept at 90 °C with stirring. To adjust pH with a HCl up to 2. Both the solutions were mixed at 90 °C for 30 min. The formed white color TBADT was collected and dried at room temperature.
3.3. Irradiation Experiments
3.3.1. OFL Photodegradation Experimental Method
Irradiation was performed using a solar simulator (Solar Box 1500e, CO.FO.ME.GRA) set at a power factor of 250 W m−2, equipped with a UV outdoor filter of soda lime glass, with IR treated as previously reported [18].
Briefly, a fixed amount (5 mg) of each BT catalyst was suspended in 100 mL of tap water (0.05 g L−1) spiked with 16 µg L−1 OFL in a closed glass container (40 mm depth, exposed surface 9500 mm2), sonicated or magnetically stirred in the dark for about 10 min to guarantee a good catalyst suspension and promote the antibiotic adsorption on the catalyst surface. During the irradiation course, aliquots (ca. 1 mL) of each sample were withdrawn at planned times, filtered (0.2 μm) and analyzed by HPLC-FD.
3.3.2. Hydrogen Evolution Experimental Method
The H2 evolution experiments were conducted in distilled water containing either 0.1 M 2-propanol (Merck, 99.8%) or 0.1 M glucose (99.9%, Carlo Erba Reagents), irradiated in Pyrex glass containers (28 mL capacity, 21 mL sample). After the addition of the catalyst (1 g L−1), the sample was deoxygenated by Ar bubbling (20 min) to reach anoxic conditions and irradiated under magnetic stirring for 4 h. Irradiation was performed under simulated solar light (1500 W Xenon lamp, 300–800 nm) using a Solar Box 1500e (CO.FO.ME.GRA S.r.l., Milan, Italy), set at a power factor 500 W m−2 and equipped with UV outdoor filter made of IR-treated soda lime glass. Repeated photoproduction experiments were performed on all samples. The headspace evolved gas was quantified by gas chromatography coupled with thermal conductivity detection (GC-TCD) and the hydrogen evolution rate (HER) is reported in the paper as H2 µmol per gram of catalyst per hour of irradiation (µmol g−1 h−1) [27,28].
3.4. Analytical Determinations
3.4.1. HPLC-FD for Kinetic Experiments
The HPLC-fluorescence detection (FD) system consisted of a series 200 pump equipped with a vacuum degasser interfaced with a programmable S200A fluorescence detector (PerkinElmer, Monza, Italy). A total of 50 μL of each sample, filtered on 0.2 µm nylon syringe filter, was injected into a 250 × 4.6 mm, 5 µm Ascentis RPAmide (Supelco-Merck Life Science, Milano, Italy) coupled with a similar guard-column. An isocratic elution of 25 mmol L−1 H3PO4-ACN (85:15) with a flow rate of 1 mL min−1 was carried out [18].
3.4.2. HPLC-UV for Photoproducts Identification
The HPLC-UV system consisted of a Shimadzu (Shimadzu Corporation, Milano, Italy) LC-20AT solvent delivery module equipped with a DGU-20A3 degasser and interfaced with an SPD-20A UV detector. The wavelength selected for the analysis was 280 nm, corresponding to the maximum OFL absorption. In total, 20 µL of each sample was injected into a 250 × 4.6 mm, Kroma Phase 100 C18 (Scharlab, Riozzo di Cerro al Lambro, Milano, Italy) column, coupled with a similar guard-column. Isocratic elution was carried out using a 25 mmol L−1 H3PO4-ACN (85:15) mixture. The flow rate was 1.0 mL min−1.
3.4.3. HPLC-ESI-MS/MS for Photoproducts Identification
The HPLC-ESI-MS/MS analysis of the irradiated OFL solutions was performed by an Agilent 1100 HPLC with a Gemini C18 (250 × 4.6 mm, 5 µm) column, maintained at 30 °C. A gradient was used for the mobile phase (solvent A: HCOOH 0.1% v/v in ultrapure water; solvent B: ACN) as follows: 10% B until 5 min, 70% B from 0.1 min and 10% B from 1 to 3 min. The flow rate was 300 µL per min and the injection volume was 20 µL.
The MS/MS-system consisted of a linear trap Thermo LXQ. The ESI experiments were carried out in positive-ion mode under the following constant instrumental conditions: source voltage of 4.5 kV, capillary voltage of 20 V, capillary temperature of 275 °C and normalized-collision energy 35.
4. Conclusions
Two different catalysts of tungsten were synthesized, namely Tetrabutylammonium decatungstate (TBADT) and bismuth tungstate (BT), by two consolidated procedures. BT was used as a catalyst for simulated solar light decomposition of ofloxacin (OFL) at 16 µg L−1 (real condition) concentration with the limit of 0.05 g L−1 of BT catalyst. A vigorous action against OFL degradation was observed as demonstrated by the high kinetic constant value (0.38 min−1), when compared to other catalysts widely used in the literature for the removal of the same class of compounds. The main photoproducts analyzed by HPLC-ESI-MS/MS included new photoproducts which have not yet been identified in this class of antibiotics. The other catalyst TBADT was used as a catalyst to produce hydrogen from glucose with the concentration of 0.1 M produced 7 µmol g−1 h−1 (RSD < 20%, n = 7) and 2-propanol with the concentration of 0.1 M produced 10 µmol g−1 h−1 (RSD < 20%, n = 7). A reasonable amount of H2 was produced and further research work is in progress.
Supplementary Materials
The following supporting information can be downloaded at: https://0-www-mdpi-com.brum.beds.ac.uk/article/10.3390/catal12030310/s1, Figure S1: Preliminary photocatalytic experiment; Figure S2: Scanning Electron Microscopic images of TBADT; Figure S3: Scanning Electron Microscopic images of BT; Figure S4: FT-IR of TBADT catalyst; Figure S5: FT-IR of BT catalyst; Figure S6: Tauc plot for TBADT catalyst; Figure S7: Tauc plot for BT catalyst; Figure S8: EDX for TBADT catalyst respectively.
Author Contributions
Methodology, Experiments, HPLC, GC and mass analysis and writing—original draft preparation, D.V.; kinetics investigation, review and editing, M.S.; H2 evolution investigation, review and editing, A.S.; Conceptualization and supervision, review and editing, D.D. All authors have read and agreed to the published version of the manuscript.
Funding
This research received no external funding.
Data Availability Statement
Data is contained within the article or Supplementary Material.
Conflicts of Interest
The authors declare no conflict of interest.
References
- Cheng, D.; Ngo, H.H.; Guo, W.; Chang, S.W.; Nguyen, D.D.; Liu, Y.; Wei, Q.; Wei, D. A Critical Review on Antibiotics and Hormones in Swine Wastewater: Water Pollution Problems and Control Approaches. J. Hazard. Mater. 2020, 387, 121682. [Google Scholar] [CrossRef]
- Fagnoni, M.; Dondi, D.; Ravelli, D.; Albini, A. Photocatalysis for the Formation of the C−C Bond. Chem. Rev. 2007, 107, 2725–2756. [Google Scholar] [CrossRef]
- Jin, J.; Sun, J.; Lv, K.; Guo, X.; Hou, Q.; Liu, J.; Wang, J.; Bai, Y.; Huang, X. Oxygen Vacancy BiO2−x/Bi2WO6 Synchronous Coupling with Bi Metal for Phenol Removal via Visible and near-Infrared Light Irradiation. J. Colloid Interface Sci. 2022, 605, 342–353. [Google Scholar] [CrossRef]
- Zhang, N.; Ciriminna, R.; Pagliaro, M.; Xu, Y.-J. Nanochemistry-Derived Bi2WO6 Nanostructures: Towards Production of Sustainable Chemicals and Fuels Induced by Visible Light. Chem. Soc. Rev. 2014, 43, 5276–5287. [Google Scholar] [CrossRef] [PubMed]
- Saison, T.; Gras, P.; Chemin, N.; Chanéac, C.; Durupthy, O.; Brezová, V.; Colbeau-Justin, C.; Jolivet, J.-P. New Insights into Bi2WO6 Properties as a Visible-Light Photocatalyst. J. Phys. Chem. C 2013, 117, 22656–22666. [Google Scholar] [CrossRef]
- Liu, S.; Yu, J. Cooperative Self-Construction and Enhanced Optical Absorption of Nanoplates-Assembled Hierarchical Bi2WO6 Flowers. J. Solid State Chem. 2008, 181, 1048–1055. [Google Scholar] [CrossRef]
- Zhang, G.; Lü, F.; Li, M.; Yang, J.; Zhang, X.; Huang, B. Synthesis of Nanometer Bi2WO6 Synthesized by Sol–Gel Method and Its Visible-Light Photocatalytic Activity for Degradation of 4BS. J. Phys. Chem. Solids 2010, 71, 579–582. [Google Scholar] [CrossRef]
- Zhang, Z.; Wang, W.; Zhang, L. Large Improvement of Photo-Response of CuPc Sensitized Bi2WO6 with Enhanced Photocatalytic Activity. Dalton Trans. 2013, 42, 4579. [Google Scholar] [CrossRef]
- Zhang, L.; Zhu, Y. A Review of Controllable Synthesis and Enhancement of Performances of Bismuth Tungstate Visible-Light-Driven Photocatalysts. Catal. Sci. Technol. 2012, 2, 694. [Google Scholar] [CrossRef]
- Zhao, Y.; Liang, X.; Hu, X.; Fan, J. RGO/Bi2WO6 Composite as a Highly Efficient and Stable Visible-Light Photocatalyst for Norfloxacin Degradation in Aqueous Environment. J. Colloid Interface Sci. 2021, 589, 336–346. [Google Scholar] [CrossRef]
- Zhong, S.; Li, C.; Shen, M.; Lv, C.; Zhang, S. Synthesis of Modified Bismuth Tungstate and the Photocatalytic Properties on Tetracycline Degradation and Pathways. J. Mater. Res. Technol. 2019, 8, 1849–1858. [Google Scholar] [CrossRef]
- Raviola, C.; Ravelli, D. Efficiency and Selectivity Aspects in the C–H Functionalization of Aliphatic Oxygen Heterocycles by Photocatalytic Hydrogen Atom Transfer. Synlett 2019, 30, 803–808. [Google Scholar] [CrossRef] [Green Version]
- Dondi, D.; Fagnoni, M.; Albini, A. Tetrabutylammonium Decatungstate-Photosensitized Alkylation of Electrophilic Alkenes: Convenient Functionalization of Aliphatic CH Bonds. Chem. Eur. J. 2006, 12, 4153–4163. [Google Scholar] [CrossRef] [PubMed]
- Tzirakis, M.D.; Orfanopoulos, M. Photochemical Addition of Ethers to C60: Synthesis of the Simplest [60]Fullerene/Crown Ether Conjugates. Angew. Chem. Int. Ed. 2010, 49, 5891–5893. [Google Scholar] [CrossRef] [PubMed]
- Ravelli, D.; Albini, A.; Fagnoni, M. Smooth Photocatalytic Preparation of 2-Substituted 1,3-Benzodioxoles. Chem. Eur. J. 2011, 17, 572–579. [Google Scholar] [CrossRef] [PubMed]
- Protti, S.; Ravelli, D.; Fagnoni, M.; Albini, A. Solar Light-Driven Photocatalyzed Alkylations. Chemistry on the Window Ledge. Chem. Commun. 2009, 7351–7353. [Google Scholar] [CrossRef]
- Wang, Z.; Hojo, H.; Einaga, H. Photocatalytic Hydroxylation of Benzene to Phenol with Dioxygen Using Sodium Decatungstate. Mol. Catal. 2021, 515, 111933. [Google Scholar] [CrossRef]
- Sturini, M.; Speltini, A.; Maraschi, F.; Profumo, A.; Pretali, L.; Irastorza, E.A.; Fasani, E.; Albini, A. Photolytic and Photocatalytic Degradation of Fluoroquinolones in Untreated River Water under Natural Sunlight. Appl. Catal. B Environ. 2012, 119–120, 32–39. [Google Scholar] [CrossRef]
- Sturini, M.; Speltini, A.; Maraschi, F.; Profumo, A.; Pretali, L.; Fasani, E.; Albini, A. Photochemical Degradation of Marbofloxacin and Enrofloxacin in Natural Waters. Environ. Sci. Technol. 2010, 44, 4564–4569. [Google Scholar] [CrossRef]
- Sturini, M.; Speltini, A.; Maraschi, F.; Vinci, G.; Profumo, A.; Pretali, L.; Albini, A.; Malavasi, L. G-C3N4-Promoted Degradation of Ofloxacin Antibiotic in Natural Waters under Simulated Sunlight. Environ. Sci. Pollut. Res. 2017, 24, 4153–4161. [Google Scholar] [CrossRef]
- Pretali, L.; Maraschi, F.; Cantalupi, A.; Albini, A.; Sturini, M. Water Depollution and Photo-Detoxification by Means of TiO2: Fluoroquinolone Antibiotics as a Case Study. Catalysts 2020, 10, 628. [Google Scholar] [CrossRef]
- Fasani, E.; Profumo, A.; Albini, A. Structure and Medium-Dependent Photodecomposition of Fluoroquinolone Antibiotics. Photochem. Photobiol. 1998, 68, 666–674. [Google Scholar] [CrossRef] [PubMed]
- Sturini, M.; Maraschi, F.; Cantalupi, A.; Pretali, L.; Nicolis, S.; Dondi, D.; Profumo, A.; Caratto, V.; Sanguineti, E.; Ferretti, M.; et al. TiO2 and N-TiO2 Sepiolite and Zeolite Composites for Photocatalytic Removal of Ofloxacin from Polluted Water. Materials 2020, 13, 537. [Google Scholar] [CrossRef] [PubMed] [Green Version]
- Sturini, M.; Speltini, A.; Maraschi, F.; Pretali, L.; Profumo, A.; Fasani, E.; Albini, A.; Migliavacca, R.; Nucleo, E. Photodegradation of Fluoroquinolones in Surface Water and Antimicrobial Activity of the Photoproducts. Water Res. 2012, 46, 5575–5582. [Google Scholar] [CrossRef] [PubMed]
- Wang, Q.; Li, P.; Zhang, Z.; Jiang, C.; Zuojiao, K.; Liu, J.; Wang, Y. Kinetics and Mechanism Insights into the Photodegradation of Tetracycline Hydrochloride and Ofloxacin Mixed Antibiotics with the Flower-like BiOCl/TiO2 Heterojunction. J. Photochem. Photobiol. A Chem. 2019, 378, 114–124. [Google Scholar] [CrossRef]
- Chen, M.; Chu, W. Photocatalytic Degradation and Decomposition Mechanism of Fluoroquinolones Norfloxacin over Bismuth Tungstate: Experiment and Mathematic Model. Appl. Catal. B Environ. 2015, 168–169, 175–182. [Google Scholar] [CrossRef]
- Speltini, A.; Romani, L.; Dondi, D.; Malavasi, L.; Profumo, A. Carbon Nitride-Perovskite Composites: Evaluation and Optimization of Photocatalytic Hydrogen Evolution in Saccharides Aqueous Solution. Catalysts 2020, 10, 1259. [Google Scholar] [CrossRef]
- Speltini, A.; Gualco, F.; Maraschi, F.; Sturini, M.; Dondi, D.; Malavasi, L.; Profumo, A. Photocatalytic Hydrogen Evolution Assisted by Aqueous (Waste)Biomass under Simulated Solar Light: Oxidized g-C3N4 vs. P25 Titanium Dioxide. Int. J. Hydrogen Energy 2019, 44, 4072–4078. [Google Scholar] [CrossRef]
Figure 1.
(a) UV-Visible absorption spectrum of TBADT in acetonitrile; (b) UV-Visible absorption spectrum of BT.
Figure 1.
(a) UV-Visible absorption spectrum of TBADT in acetonitrile; (b) UV-Visible absorption spectrum of BT.

Figure 2.
Kinetics of OFL decomposition: photolysis and BT photocatalysis referred with TiO2 photocatalyst.
Figure 2.
Kinetics of OFL decomposition: photolysis and BT photocatalysis referred with TiO2 photocatalyst.

Figure 3.
HPLC-UV profiles of OFL (110 mg L−1) decomposition in the presence of BT under simulated solar irradiation.
Figure 3.
HPLC-UV profiles of OFL (110 mg L−1) decomposition in the presence of BT under simulated solar irradiation.

Figure 4.
Three-dimensional view of the OFL decomposition by BT catalyst with the irradiation time of 60 min (purple) and 90 min (yellow).
Figure 4.
Three-dimensional view of the OFL decomposition by BT catalyst with the irradiation time of 60 min (purple) and 90 min (yellow).

Figure 5.
Identified OFL photoproducts reported in the literature.

Figure 6.
Evolution of the photoproducts with masses in the range 380–413 m/z by irradiation of BT catalyzed OFL. Blue curve: 60 min irradiation, red curve: 90 min irradiation.
Figure 6.
Evolution of the photoproducts with masses in the range 380–413 m/z by irradiation of BT catalyzed OFL. Blue curve: 60 min irradiation, red curve: 90 min irradiation.

Figure 7.
Proposed formulas for intermediates H–J.

Figure 8.
Nucleophilic substitution of fluorine via photogenerated aril cation intermediate.


Table 1.
% OFL adsorbed during the stirring in the dark, kinetic degradation constants and pre-exponential factors, for BT and TiO2.
Table 1.
% OFL adsorbed during the stirring in the dark, kinetic degradation constants and pre-exponential factors, for BT and TiO2.
| OFL % Adsorbed in the Dark | A, k min −1 | B, h min −1 | R2 | |
|---|---|---|---|---|
| BT | 21 (12 min us) | 70 (14), 0.38 (6) | 30 (14), 0.11 (3) | 0.999 |
| TiO2 | 16 (12 min stirring) | 102 (4), 0.24 (2) | - | 0.993 |
| no catalyst | - | 73 (17), 0.01 (2) | 27 (17), 0.05 (3) | 0.997 |
Table 2.
M + 1 peak of photoproducts from lower to higher m/z values.
| m/z | Compound Name | Mass Peak |
|---|---|---|
| 322 | A | M + 1 |
| 336 | B | M + 1 |
| 348 | C | M + 1 |
| 362 | OFL | M + 1 |
| 364 | D | M + 1 |
| 376 | E | M + 1 |
| 378 | F | M + 1 |
| 388 | H | M + 1 |
| 392 | G | M + 1 |
| 402 | I | M + 1 |
| 412 | J | M + 1 |
Publisher’s Note: MDPI stays neutral with regard to jurisdictional claims in published maps and institutional affiliations. |
© 2022 by the authors. Licensee MDPI, Basel, Switzerland. This article is an open access article distributed under the terms and conditions of the Creative Commons Attribution (CC BY) license (https://creativecommons.org/licenses/by/4.0/).
Share and Cite
MDPI and ACS Style
Vadivel, D.; Sturini, M.; Speltini, A.; Dondi, D. Tungsten Catalysts for Visible Light Driven Ofloxacin Photocatalytic Degradation and Hydrogen Production. Catalysts 2022, 12, 310. https://0-doi-org.brum.beds.ac.uk/10.3390/catal12030310
AMA Style
Vadivel D, Sturini M, Speltini A, Dondi D. Tungsten Catalysts for Visible Light Driven Ofloxacin Photocatalytic Degradation and Hydrogen Production. Catalysts. 2022; 12(3):310. https://0-doi-org.brum.beds.ac.uk/10.3390/catal12030310
Chicago/Turabian StyleVadivel, Dhanalakshmi, Michela Sturini, Andrea Speltini, and Daniele Dondi. 2022. "Tungsten Catalysts for Visible Light Driven Ofloxacin Photocatalytic Degradation and Hydrogen Production" Catalysts 12, no. 3: 310. https://0-doi-org.brum.beds.ac.uk/10.3390/catal12030310
Note that from the first issue of 2016, this journal uses article numbers instead of page numbers. See further details here.