
Ni-Cu/Al2O3 from Layered Double Hydroxides Hydrogenates Furfural to Alcohols


1
Departament d’Enginyeria Química, Universitat Rovira i Virgili, Av. Països Catalans, 26, 43007 Tarragona, Spain
2
Chemical Engineering, Polytechnique Montréal, C.P. 6079, Succ. “CV”, Montréal, QC H3C 3A7, Canada
*
Author to whom correspondence should be addressed.
Catalysts 2022, 12(4), 390; https://0-doi-org.brum.beds.ac.uk/10.3390/catal12040390
Submission received: 10 March 2022
/
Revised: 26 March 2022
/
Accepted: 29 March 2022
/
Published: 31 March 2022
(This article belongs to the Special Issue Catalysts for Biofuel and Bioenergy Production)
Abstract
:The hydrogenation of furfural is an important process in the synthesis of bio-based chemicals. Copper-based catalysts favor the hydrogenation of furfural to alcohols. Catalytic activity and stability were higher at a Ni-to-Cu atomic ratio of 1:1 and 1.5:0.5 compared to 0.5:1.5. Here, we prepared Ni-Cu/Al2O3 hydrogenation catalysts derived from layered double hydroxides (LDHs). Catalysts calcined at 673 K and reduced at 773 K with nominal Ni/Cu atomic ratios y/x = 1.5/0.5, 1/1 and 0.5/1.5 were characterized by XRD, FESEM-EDX, H2-TPR, XPS, FAA and BET. Their activity was tested at 463 K and in a 0.05 g g−1 furfural solution in ethanol, and the space velocity in a packed-bed reactor (PBR) was 2.85 gFF gcat−1 h−1. In a slurry reactor (SSR) at 5 MPa H2 and a contact time of 4 h, conversion was complete, while it varied from 91 to 99% in the PBR. Tetrahydrofurfuryl alcohol (TFA) was the main product in the SSR, with a selectivity of 32%, 63% and 56% for Ni0.5Cu1.5Al1, Ni1Cu1Al1 and Ni1.5Cu0.5Al1, respectively. The main product in the atmospheric PBR was furfuryl alcohol (FA), with a selectivity of 57% (Ni0.5Cu1.5Al1), 61% (Ni1Cu1Al1) and 58% (Ni1.5Cu0.5Al1). Other products included furan, methylfuran, 1-butanol and 1,2-pentanediol. Ethyl tetrahydrofurfuryl ether and difurfuryl ether were also formed via the nucleophilic addition of furfural with ethanol and furfuryl alcohol.
1. Introduction
Furfural (FF) is one of the top value-added chemicals derived from biomass [1]. It is a versatile molecule that is produced in lignocellulosic biorefineries from biomass rich in xylan and other five-carbon polysaccharides [2,3]. The activity of the aldehyde group and the furan ring facilitates the conversion of furfural into several valuable products. The first can be reduced to alcohol, decarbonylated, oxidized to carboxylic acid, reduced to ammines and acetylated, and it results in aldol and Knoevenagel condensations and Grignard reactions. The furan ring can be transformed by halogenation, alkylation, oxidation, nitration, hydrogenation and ring-opening hydrogenolysis, which may involve the C−O−C bond or C=C double bonds [4]. Hydrogenation produces several valuable chemicals, but furfuryl alcohol (FA) and tetrahydrofurfuryl alcohol (TFA) are the most common [5]. They find application as solvents and in the production of resins, fragrances, polyesters, agrochemicals, biofuels and fuel additives [3,5,6,7,8,9]. Ring-opening hydrogenolysis of FF produces 1,2-pentanediol (12PD) and 1,5-pentanediol (15PD), which are monomers of polyesters, polyurethanes and polyamides and can be used as solvents and fuel additives [4]. The reduction of FF to FA with in situ rearrangement yields cyclopentanone (CPO), which is a specialty chemical used in the synthesis of pharmaceuticals, fungicides, flavors and fragrances, and polyamides [3].
Furfural adsorption to the catalyst surface determines the hydrogenation and hydrogenolysis pathway. Copper surfaces adsorb FF molecules via the oxygen atom of the aldehyde group (η1-(O)-aldehyde mode) [10,11]. This directs the reaction towards the formation of FA by the hydrogenation of the aldehyde group [4]. Nickel surfaces tend to adsorb furfural via the η2-(C,O)-aldehyde mode, where FF attaches to the surface via the carbon and oxygen atoms of the aldehyde group, leaving the furan ring parallel to the metal surface [10,12,13,14,15]. This type of adsorption is stronger than the η1-(O)-aldehyde due to the additional interaction between nickel and the π bonds in FF [15,16,17]. It promotes saturation of the furan ring and reduction of the aldehyde group, which mainly leads to TFA, but it may also favor ring-opening reactions. Temperature shifts the adsorption mode on nickel from η2-(C,O)-aldehyde to η1-(C)-acyl. The latter promotes the decarbonylation of furfural to furan (FUR) [4]. In general, the strength of the interaction of furfural with the surfaces of Ni, Pd, Pt and Cu follows the order of Ni > Pd > Pt ≫ Cu [18,19]. Therefore, copper catalysts tend to be less active than those based on other metals. Metal promoters such as Fe, Zn, Mg or Co improve the activity of copper-based catalysts and modifies their selectivity to other products besides FA. Regardless of the metal, the high dispersion and strong interaction of the metal particles with the support matrix enhance the activity of the catalyst and influence its selectivity [4]. Layered double hydroxides (LDHs), obtained by co-precipitation of salts of active metals at controlled pH, are versatile materials that, upon calcination and reduction, yield catalysts with high metal dispersion and strong interaction with the support, which makes them active and resistant to sintering. FF hydrogenation has been reported with the use of several catalysts based on LDHs. A CuMgAl catalyst converted 84% of furfural with a 71% selectivity to pentanediols (46% 12PD and 25% 15PD) [20]. A spinel-based CoAlO catalyst facilitated the complete conversion of FF and selectivities to 15PD and TFA of 30 and 62%, respectively [21], whereas a Cu-ZnO/Al2O3 catalyst was highly selective to FOL in the gas-phase hydrogenation of FF [22]. A CuNi/MgAlO catalyst prepared from a hydrotalcite precursor yielded FOL with an 89% selectivity and 93% conversion [23]. Copper-based bimetallic catalysts produced cyclopentanol (CuZnAl [24] and CuMgAl [25]) and cyclopentanone (CuZnAl [26] and CuNiAl [27]). 5-Hydroxymethylfurfural (HMF), a furan analog of FF derived from six-carbon monosaccharides, led to complete conversion and a selectivity of 64% to 1,2,6-hexanetriol on NiCoAl mixed oxide catalysts [28]. Modifying the calcination conditions of NiAl resulted in a catalyst tailored to selectively convert HMF into 2,5-dimethylfuran (DMF), 2,5-dimethyltetrahydrofuran (DMTHF) or 2,5-dihydroxymethyltetrahydrofuran (DHMTHF) [29]. In this work, we synthesized NixCuyAl1 catalysts from layered double hydroxides with Ni/Cu atomic ratios y/x of 1.5/0.5, 1/1 and 0.5/1.5. The catalysts were tested for furfural hydrogenation in the vapor phase at atmospheric pressure and in the liquid phase at 5.0 MPa of hydrogen. The influence of the Ni/Cu ratio and the type of reactor on product selectivity is assessed, and the pathways leading to the formation of the major products are discussed.
2. Results and Discussion
2.1. Catalyst Characterization
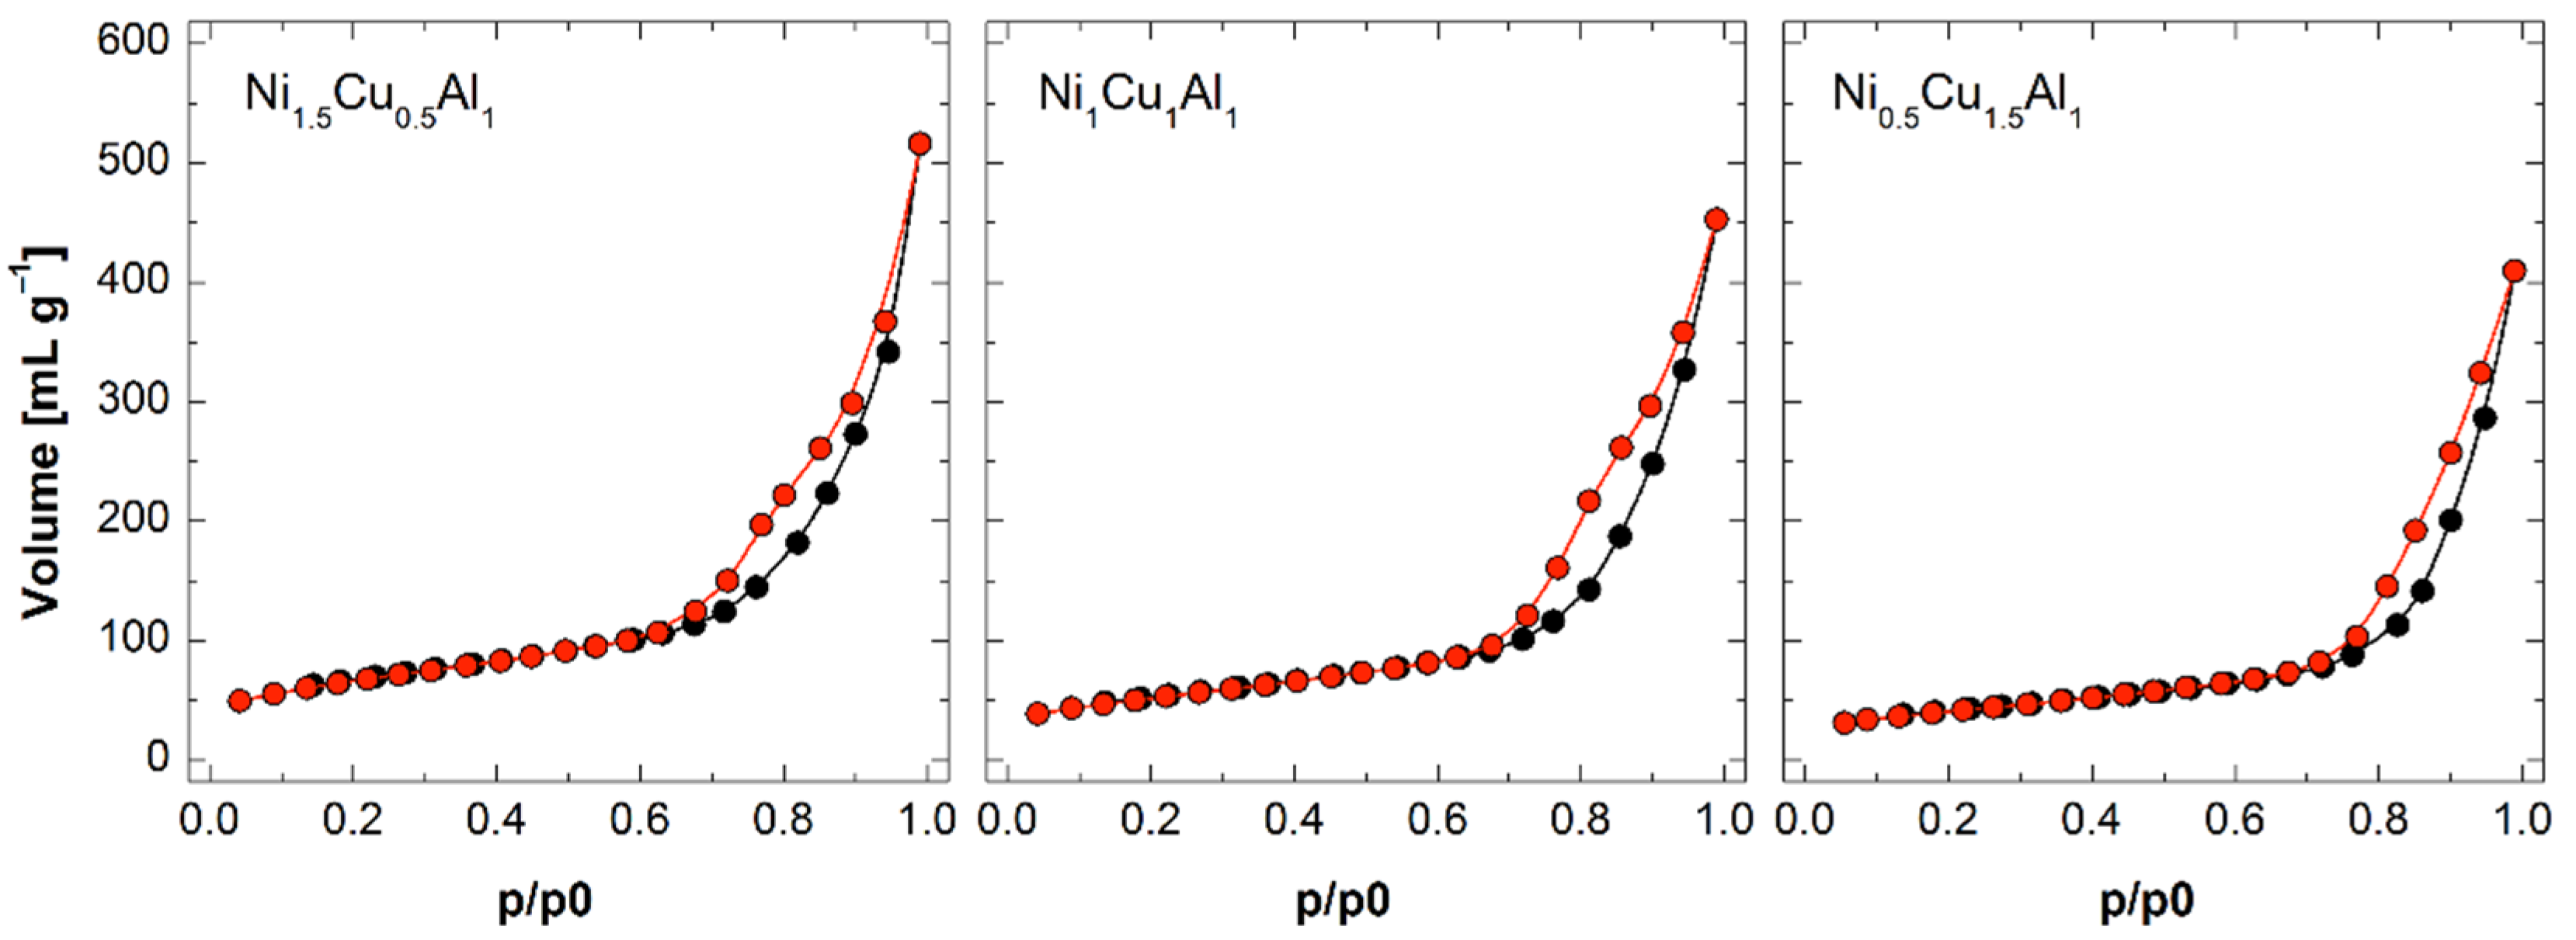
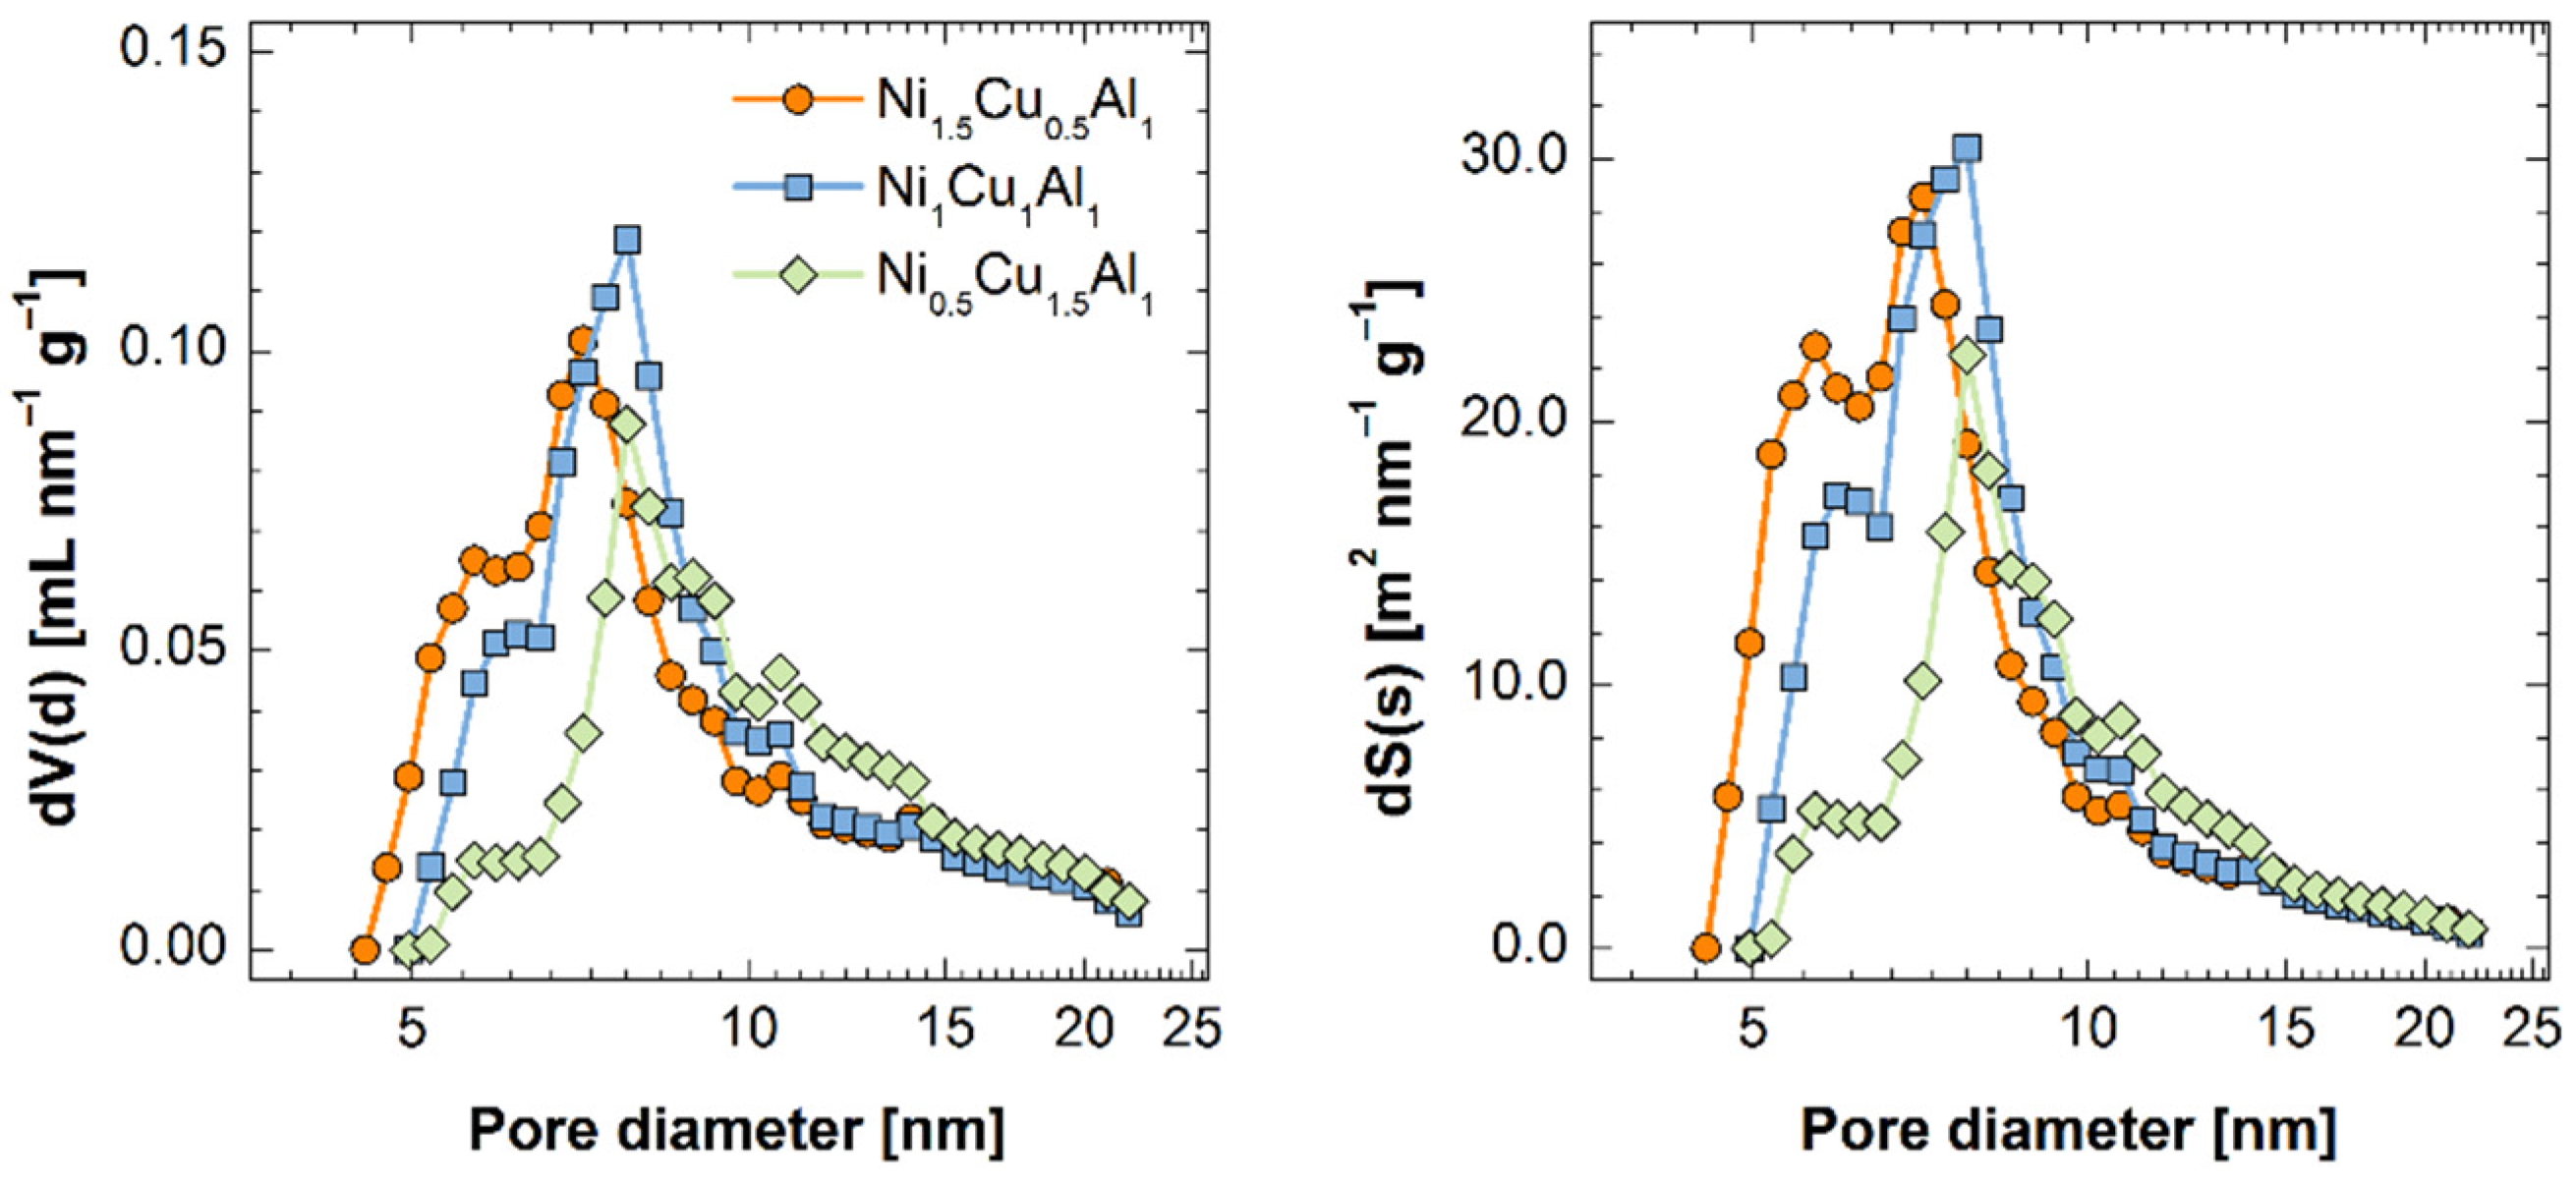
The adsorption isotherms corresponded to mesoporous materials with type IV(a) isotherms and H3 hysteresis loops according to the IUPAC classification (Figure 1) [30,31]. The pore size tended to decrease when the Ni/Cu atomic ratio increased (Figure 2). The average pore diameter increased from 7.0 nm in Ni1.5Cu0.5Al1 to 7.4 nm in Ni0.5Cu1.5Al1 (Table 1). Accordingly, the surface area and pore volume increased as the average pore size decreased. The BET surface area increased from 127 m2 g−1 in Ni0.5Cu1.5Al1 to 201 m2 g−1 in Ni1.5Cu0.5Al1. SEM imaging of the calcined LDHs confirmed that the surface morphologies of the three samples were similar (Figure S1), although Ni1.5Cu0.5Al1 had a slightly denser structure consisting of smaller particles.
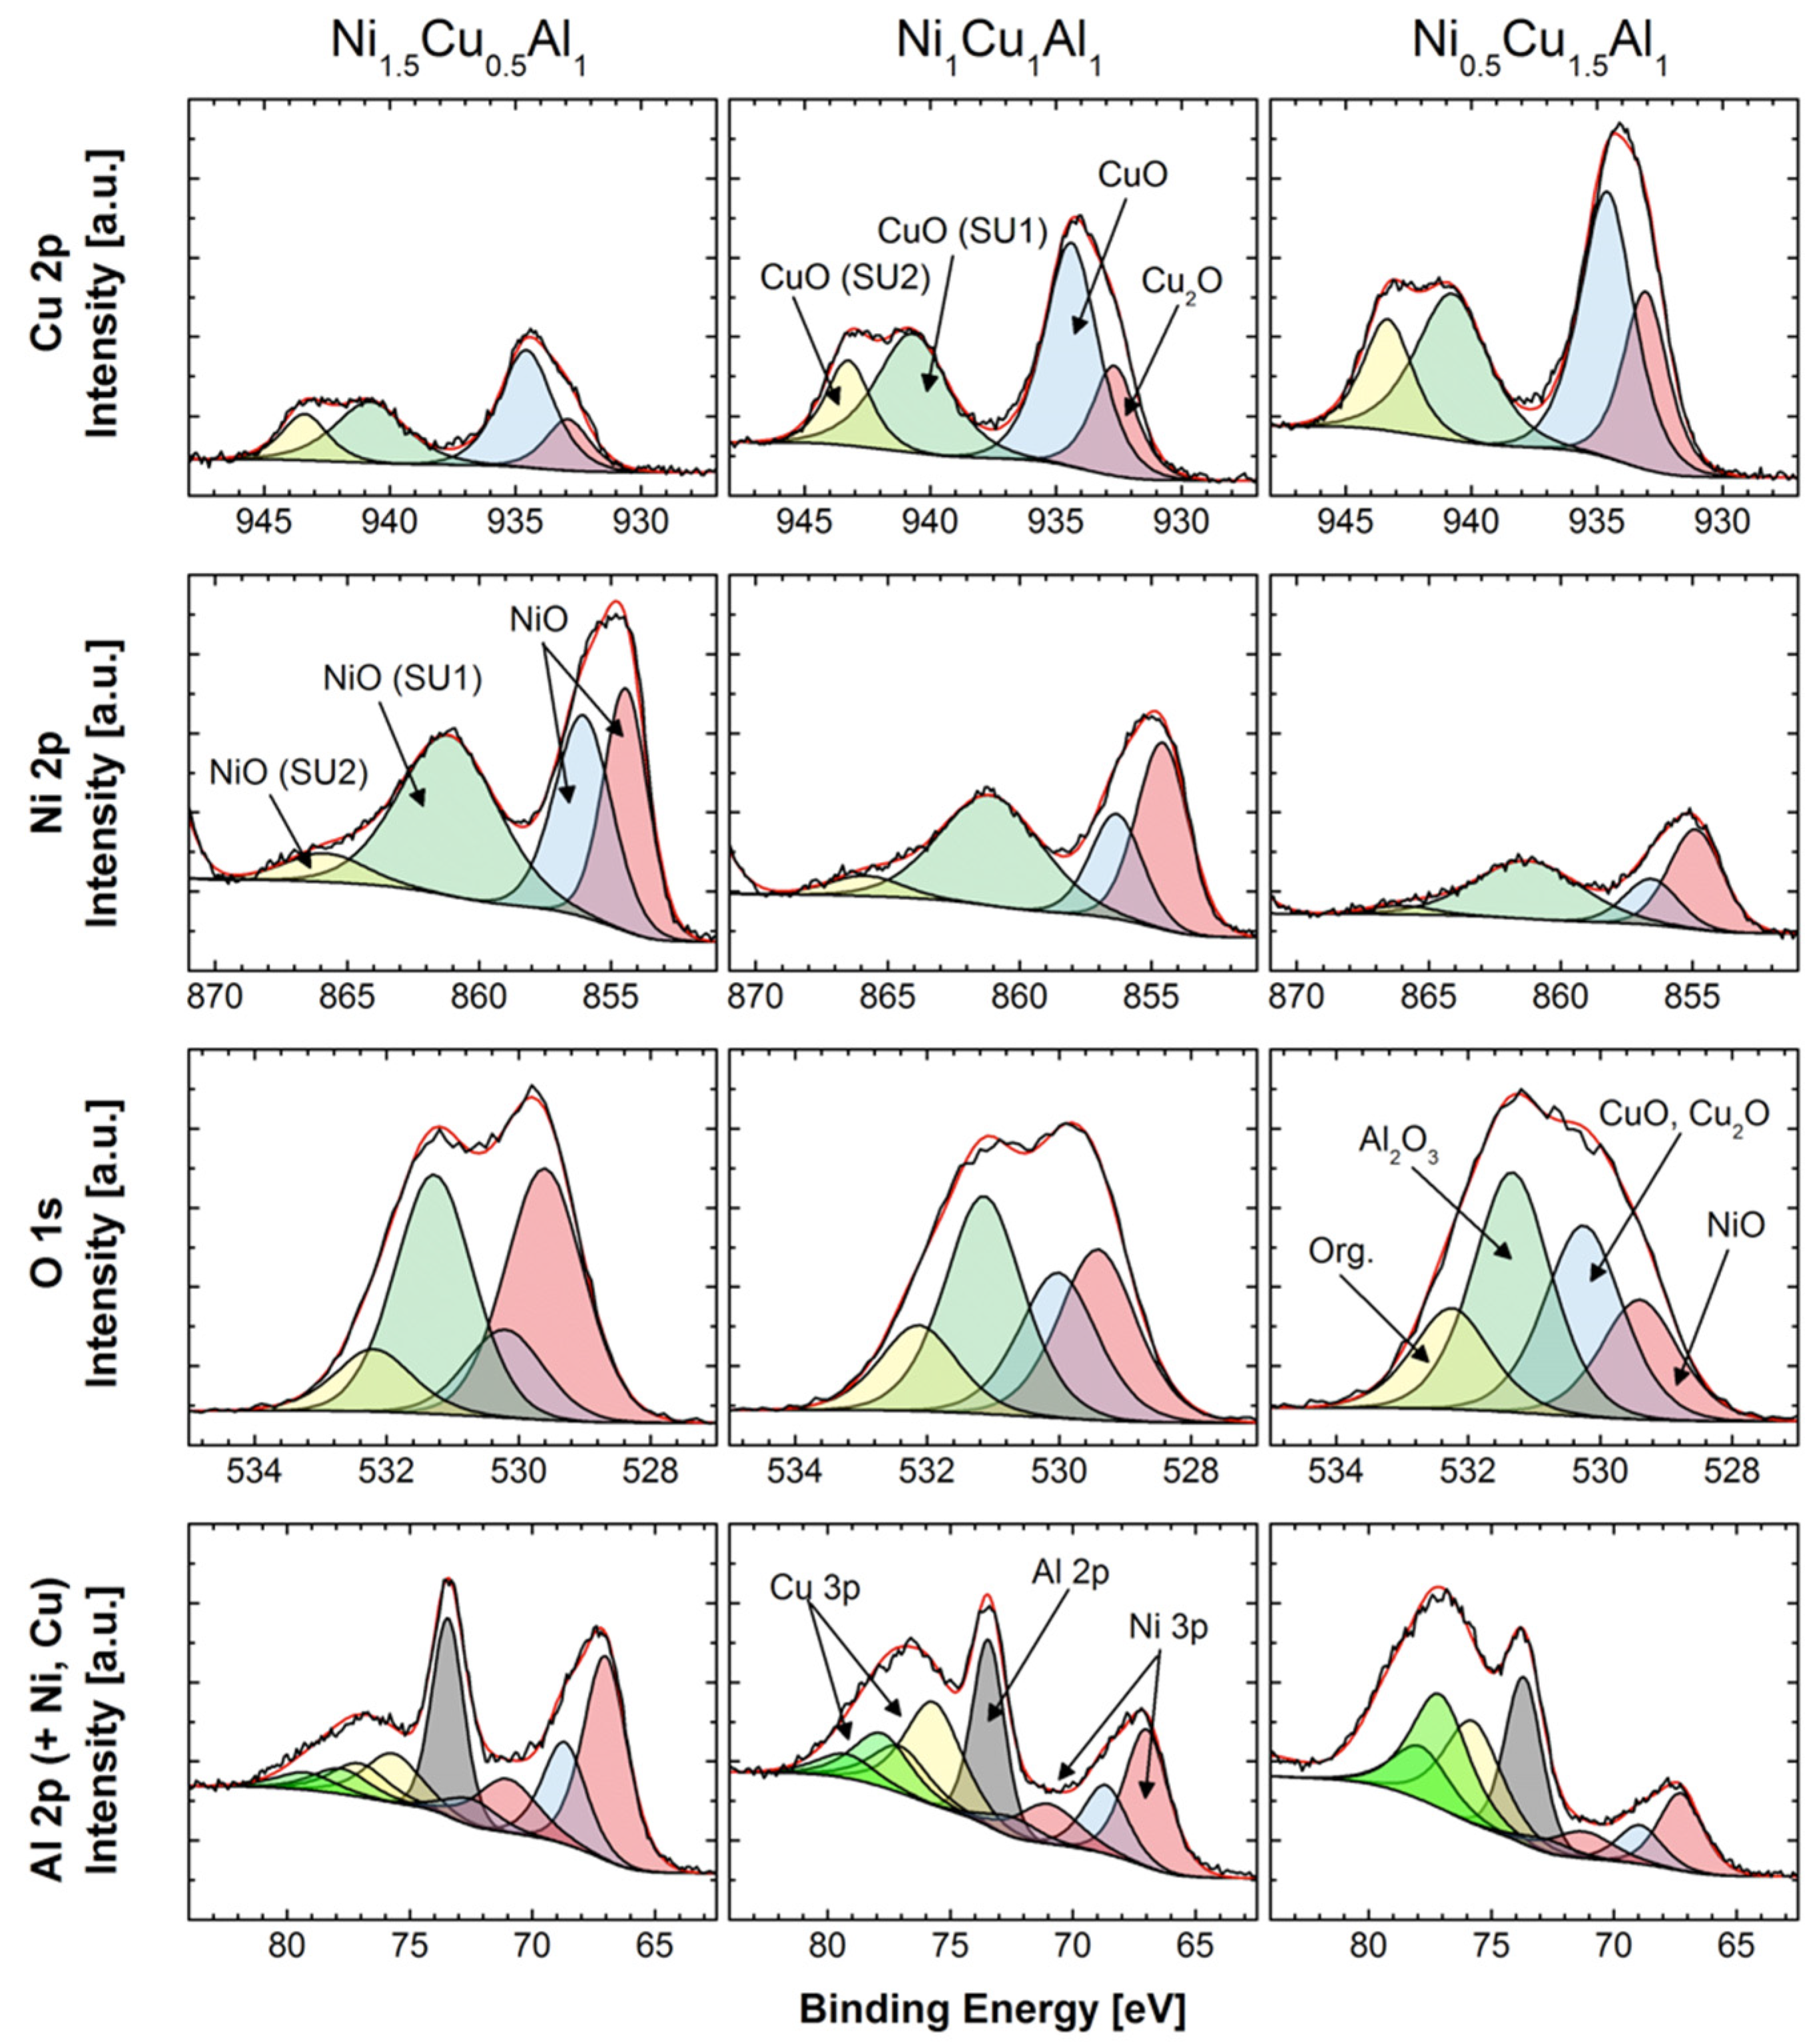
The Ni/Al and Cu/Al atomic ratios of the calcined LDHs measured by FAA were close to the nominal values (Table 2), proving the suitability of the synthesis procedure. FESEM-EDX imaging showed a gradual change in composition among the three materials (Figure S2). The atomic ratios determined by this technique were higher than those measured by FAA, especially in Ni1.5Cu0.5Al1. High-resolution XPS also revealed values above the nominal ones, although the Ni/Cu ratios were close to those determined by FAA. The higher Ni/Al and Cu/Al atomic ratios measured by XPS and FESEM-EDX were attributed to the formation of Cu and Ni oxides dispersed on top of aluminum oxides [32]. The oxides were identified by XPS (Figure 3) based on the binding energies of Ni 2p3, Cu 2p3 and Al 2p (Table 3).
Nickel formed NiO. Although the binding energy at which Ni 2p was observed was higher than that expected for NiO and closer to that expected for Ni(OH)2 [33], the shape of the shake-up (SU) satellite peak was consistent with NiO [34]. The multiple splitting expected for NiO was not observed. This could be because the samples were in the form of powder, which tends to broaden the peaks and reduce energy resolution. Furthermore, the ratio of oxygen to nickel found was not consistent with nickel being predominantly in the form of Ni(OH)2. Copper formed CuO and Cu2O. An asymmetry and slight shoulder on the low binding energy side of the Cu 2p3 and Cu 2p1 peaks indicated the presence of Cu2O. The shape and size of the SU satellite peak were consistent with CuO [34]. Nevertheless, only a weak SU was expected for Cu2O. The binding energy of the Cu 2p components of CuO and Cu2O was slightly higher than expected [33,34]. As for nickel, the presence of a large amount of Cu(OH)2 was ruled out because the ratio of oxygen to copper content was not large enough. The same argument applies to CuAl2O4. The binding energy of Cu 2p in this compound should be around 934.5 eV [35], consistent with the largest component observed here, but the oxygen-to-copper ratio was too low. Oxygen O 1s components were assigned to NiO [33,36], CuO and Cu2O (internal reference) and Al2O3 [34] based on the binding energy and intensity to yield the proper metal/oxygen ratios. The fitted Al 2p curve had a high level of uncertainty, as it overlapped with Ni 3p and Cu 3p. In the three materials, a single component of Al 2p was found at binding energies of 73.4 eV and 73.7 eV, which is consistent with the presence of Al2O3. The presence of CuAl2O4 could not be confirmed because the binding energy of Al 2p in this compound, ca. 74 eV [35], was not significantly different from that of Al2O3 when considering the overlap with Cu 3p.
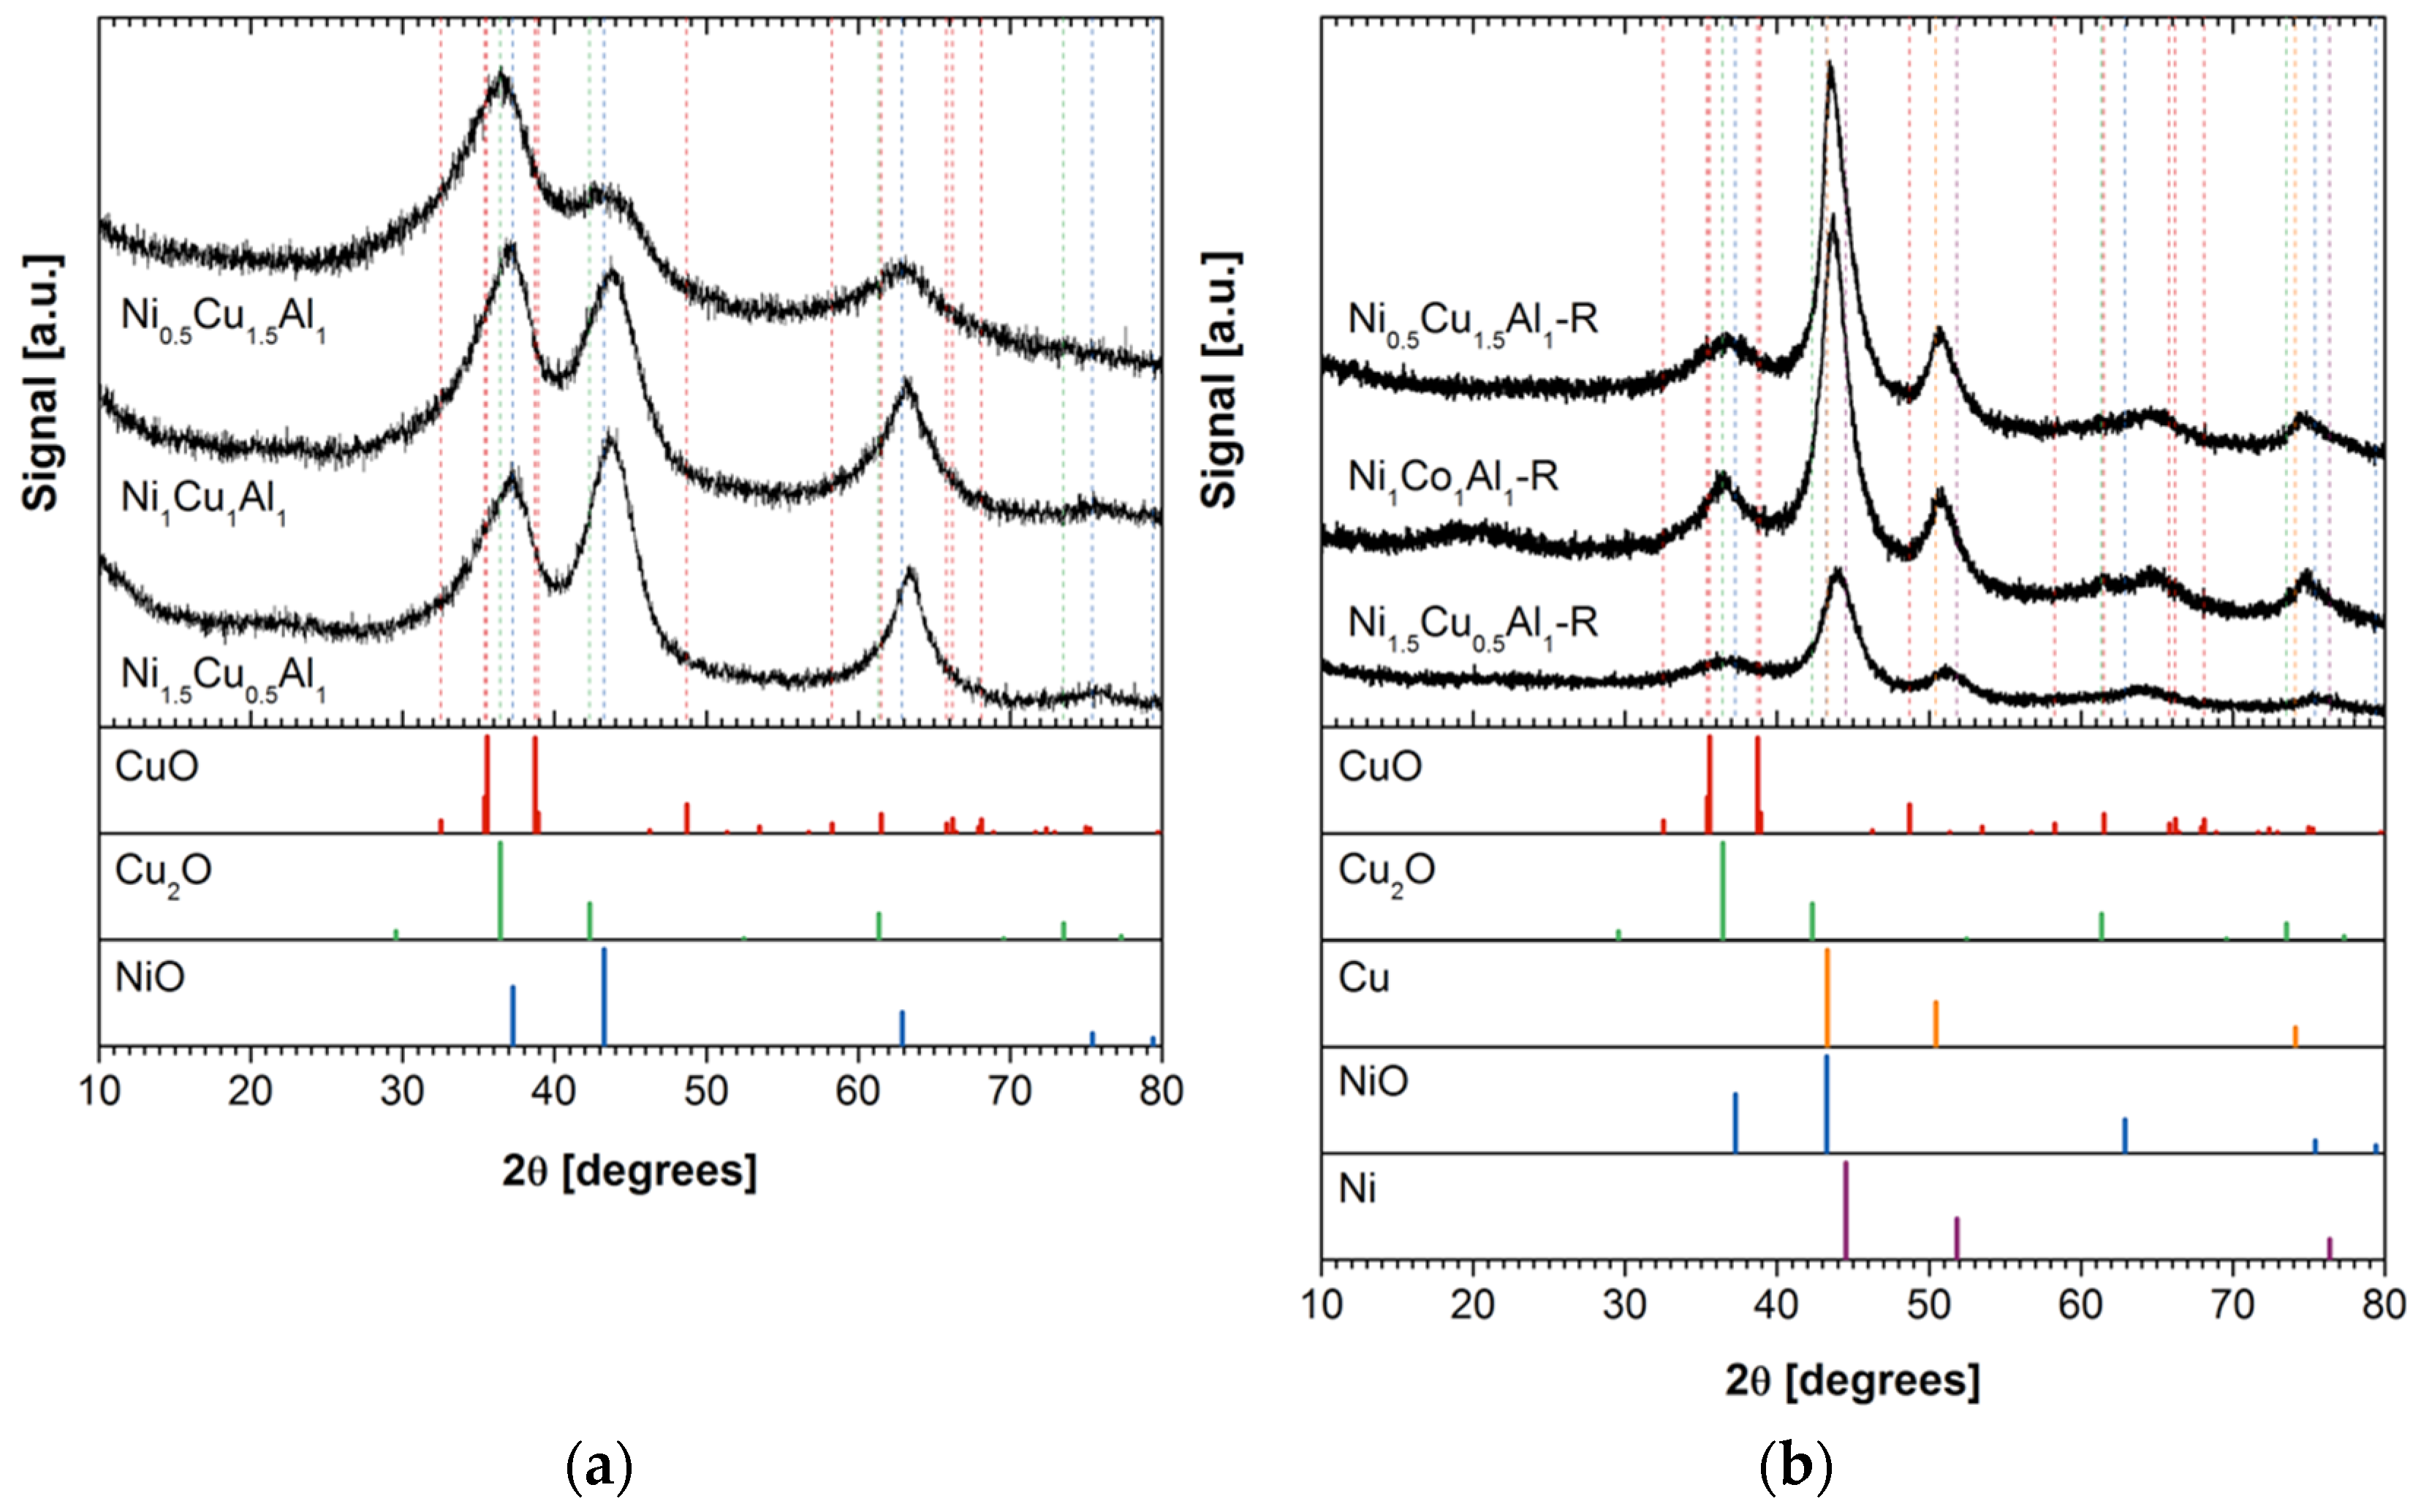
XRD of the calcined LDHs (Figure 4) revealed three broad peaks at ca. 37°, 44° and 63°, which are consistent with CuO, Cu2O and NiO. Overlapping of the signals of the three oxides could be caused by the smaller crystallite sizes and large dispersion of the oxides derived from LDH precursors [37,38]. Notably, the signals attributable to NiO were more intense in Ni1.5Cu0.5Al1, whereas those of CuO were dominant in Ni0.5Cu1.5Al1.
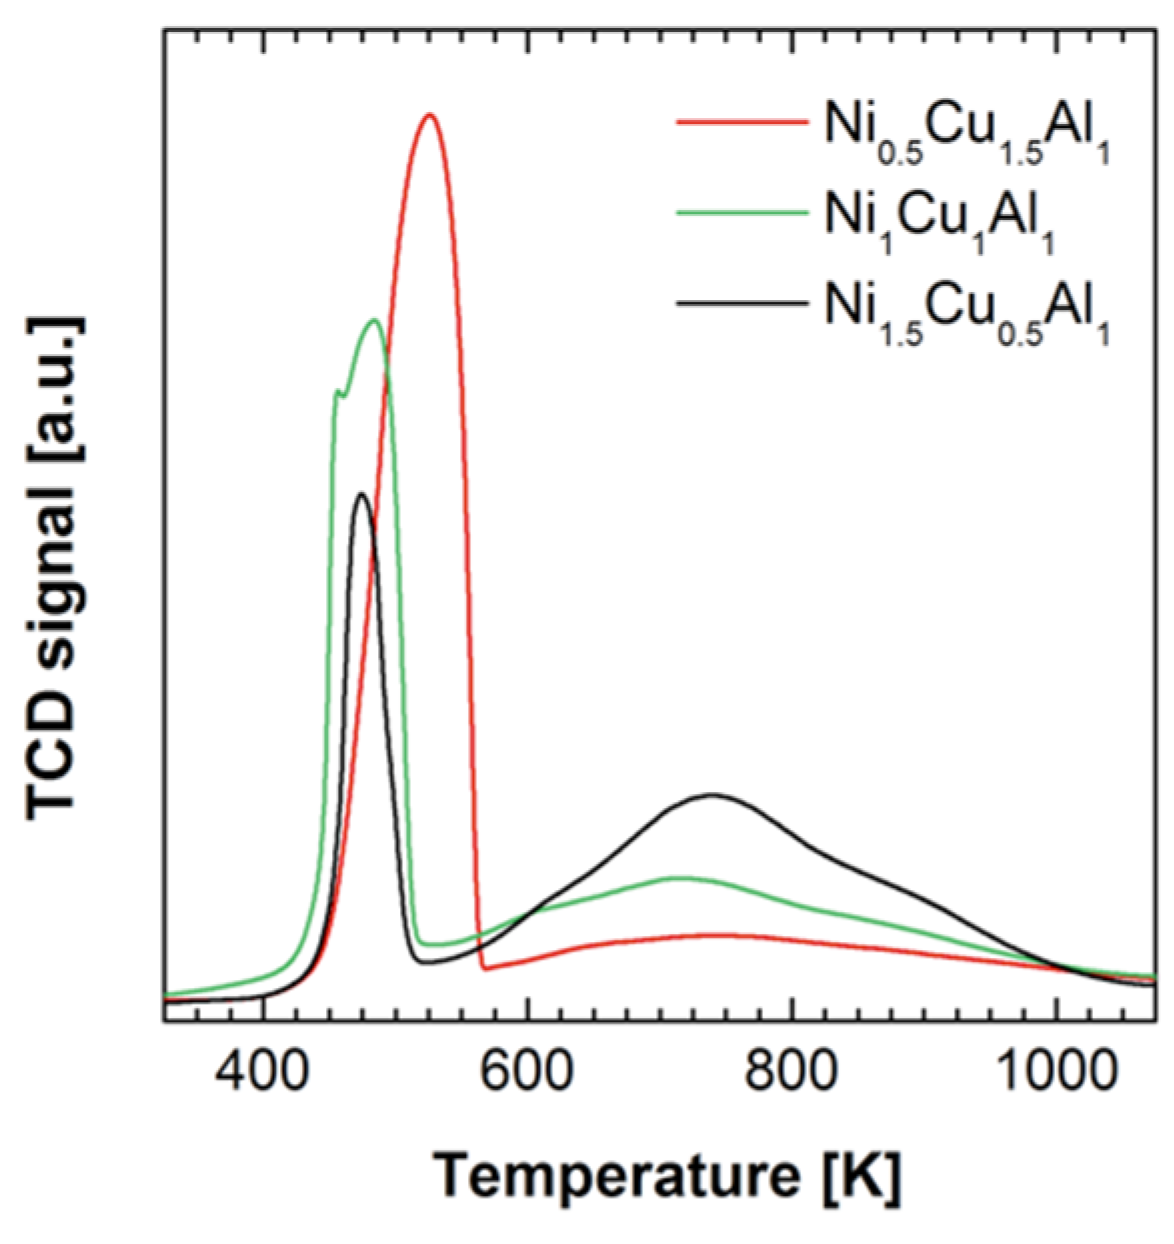
The reducibility of the calcined materials was studied by temperature-programmed reduction under 10% hydrogen in argon (H2-TPR) from 375 to 1075 K (Figure 5). Two well-differentiated peaks of hydrogen consumption were observed. The peak at the lowest temperature corresponded to the reduction of highly dispersed particles of copper oxides to metal Cu [39,40], while the much broader peak at the highest temperature was attributed to the reduction of nickel oxide, as it strongly interacts with aluminum oxides [41,42,43,44]. The Ni/Cu ratio influenced the temperature of each peak and its specific hydrogen consumption (Table 4). The hydrogen intake in the first peak rose with the content of copper in the sample, from 367 mL g−1 of H2 (STP) in Ni1.5Cu0.5Al1 to 113 mL g−1 of H2 (STP) in Ni0.5Cu1.5Al1. The consumption of the second peak showed the opposite trend, and it decreased from 85 mL g−1 of H2 (STP) in Ni1.5Cu0.5Al1 to 19 mL g−1 of H2 (STP) in Ni0.5Cu1.5Al1. However, Ni1Cu1Al1 had the highest total consumption and the lowest temperature of nickel oxide reduction. This suggests that the nickel oxides had a slightly weaker interaction with the alumina matrix in this material, thus resulting in better reducibility.
Nickel and copper metals were present in the three catalysts after reduction at 773 K (Figure 4b), and CuO and Cu2O declined. The three catalysts produced the signal of metal Cu at 50.4°, and its intensity grew with the content of copper. The main Cu signal at 43.3° overlapped with that of NiO at the same angle, but the presence of NiO was confirmed by its secondary band at 37.2°. Concerning Ni, its main signal was observed at 44.5°, especially in Ni1.5Cu0.5Al1-R, although it overlapped with the signals of NiO and Cu at 43.3°. Overall, the crystalline phases detected after reduction at 773 K agreed with the TPR. Most copper was reduced to its metal form, whereas nickel was only partially reduced, and a significant fraction remained as NiO.
2.2. Catalytic Activity Tests
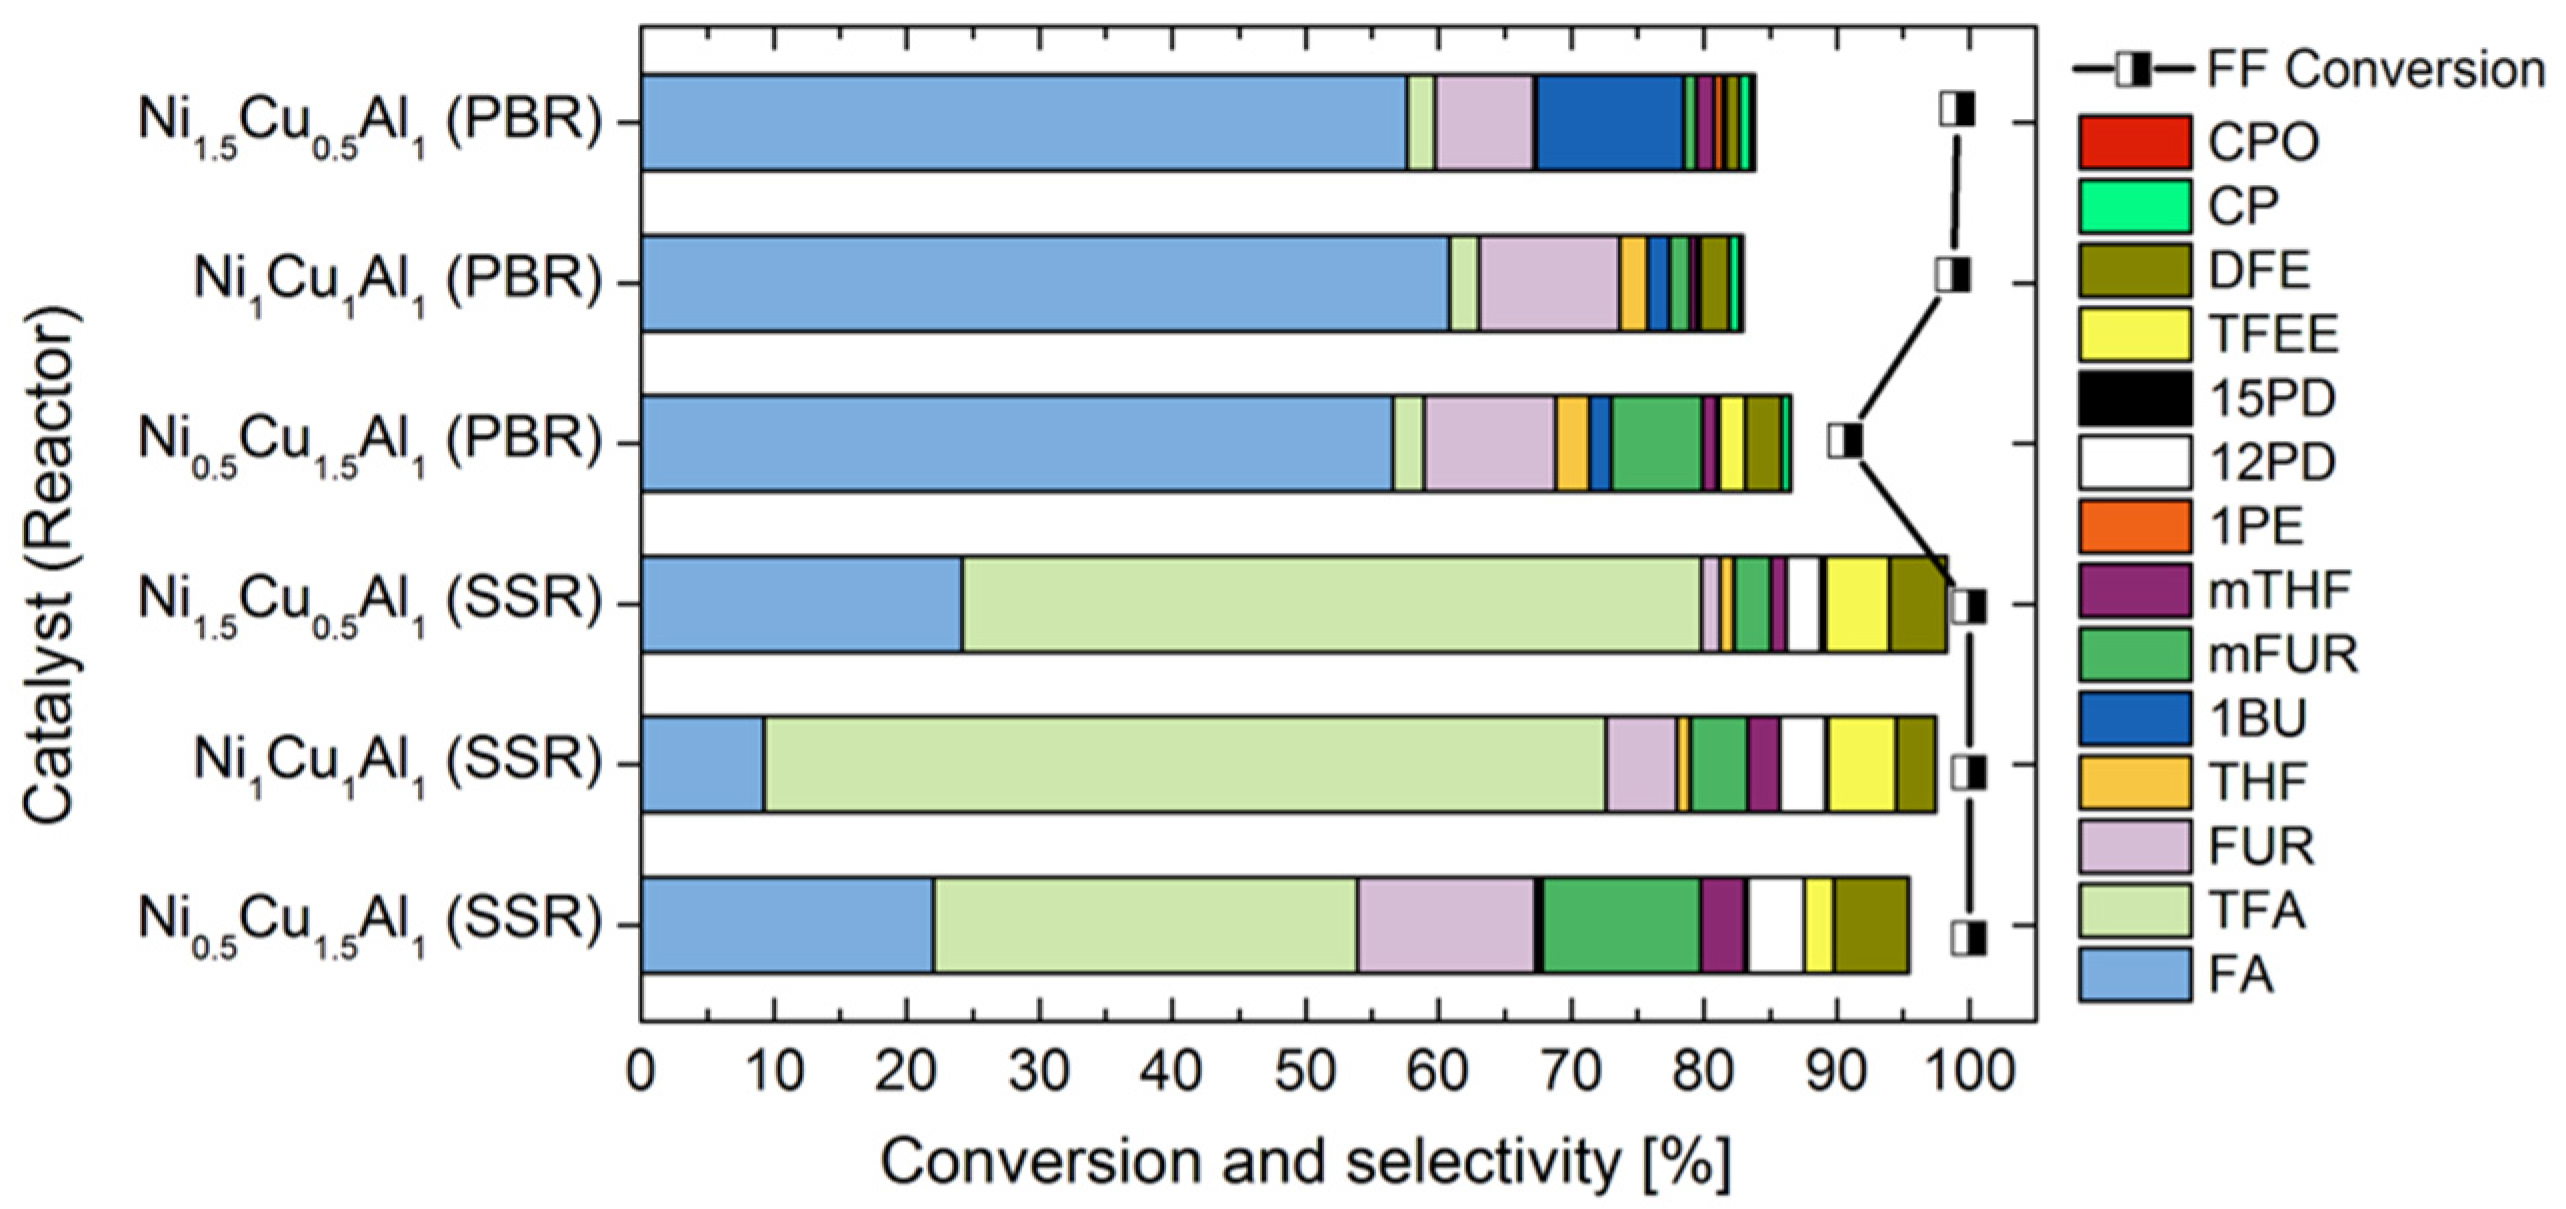
The activity of the catalysts was tested in the gas phase on a continuous packed-bed reactor at atmospheric pressure (PBR) and in the liquid phase on a high-pressure stirred slurry reactor (SSR). All catalysts facilitated the complete conversion of furfural (FF) during the tests performed in the SSR at 5.0 MPa of H2. The Ni/Cu metal ratio of the catalyst significantly influenced the distribution of products (Figure 6 and Table S1).
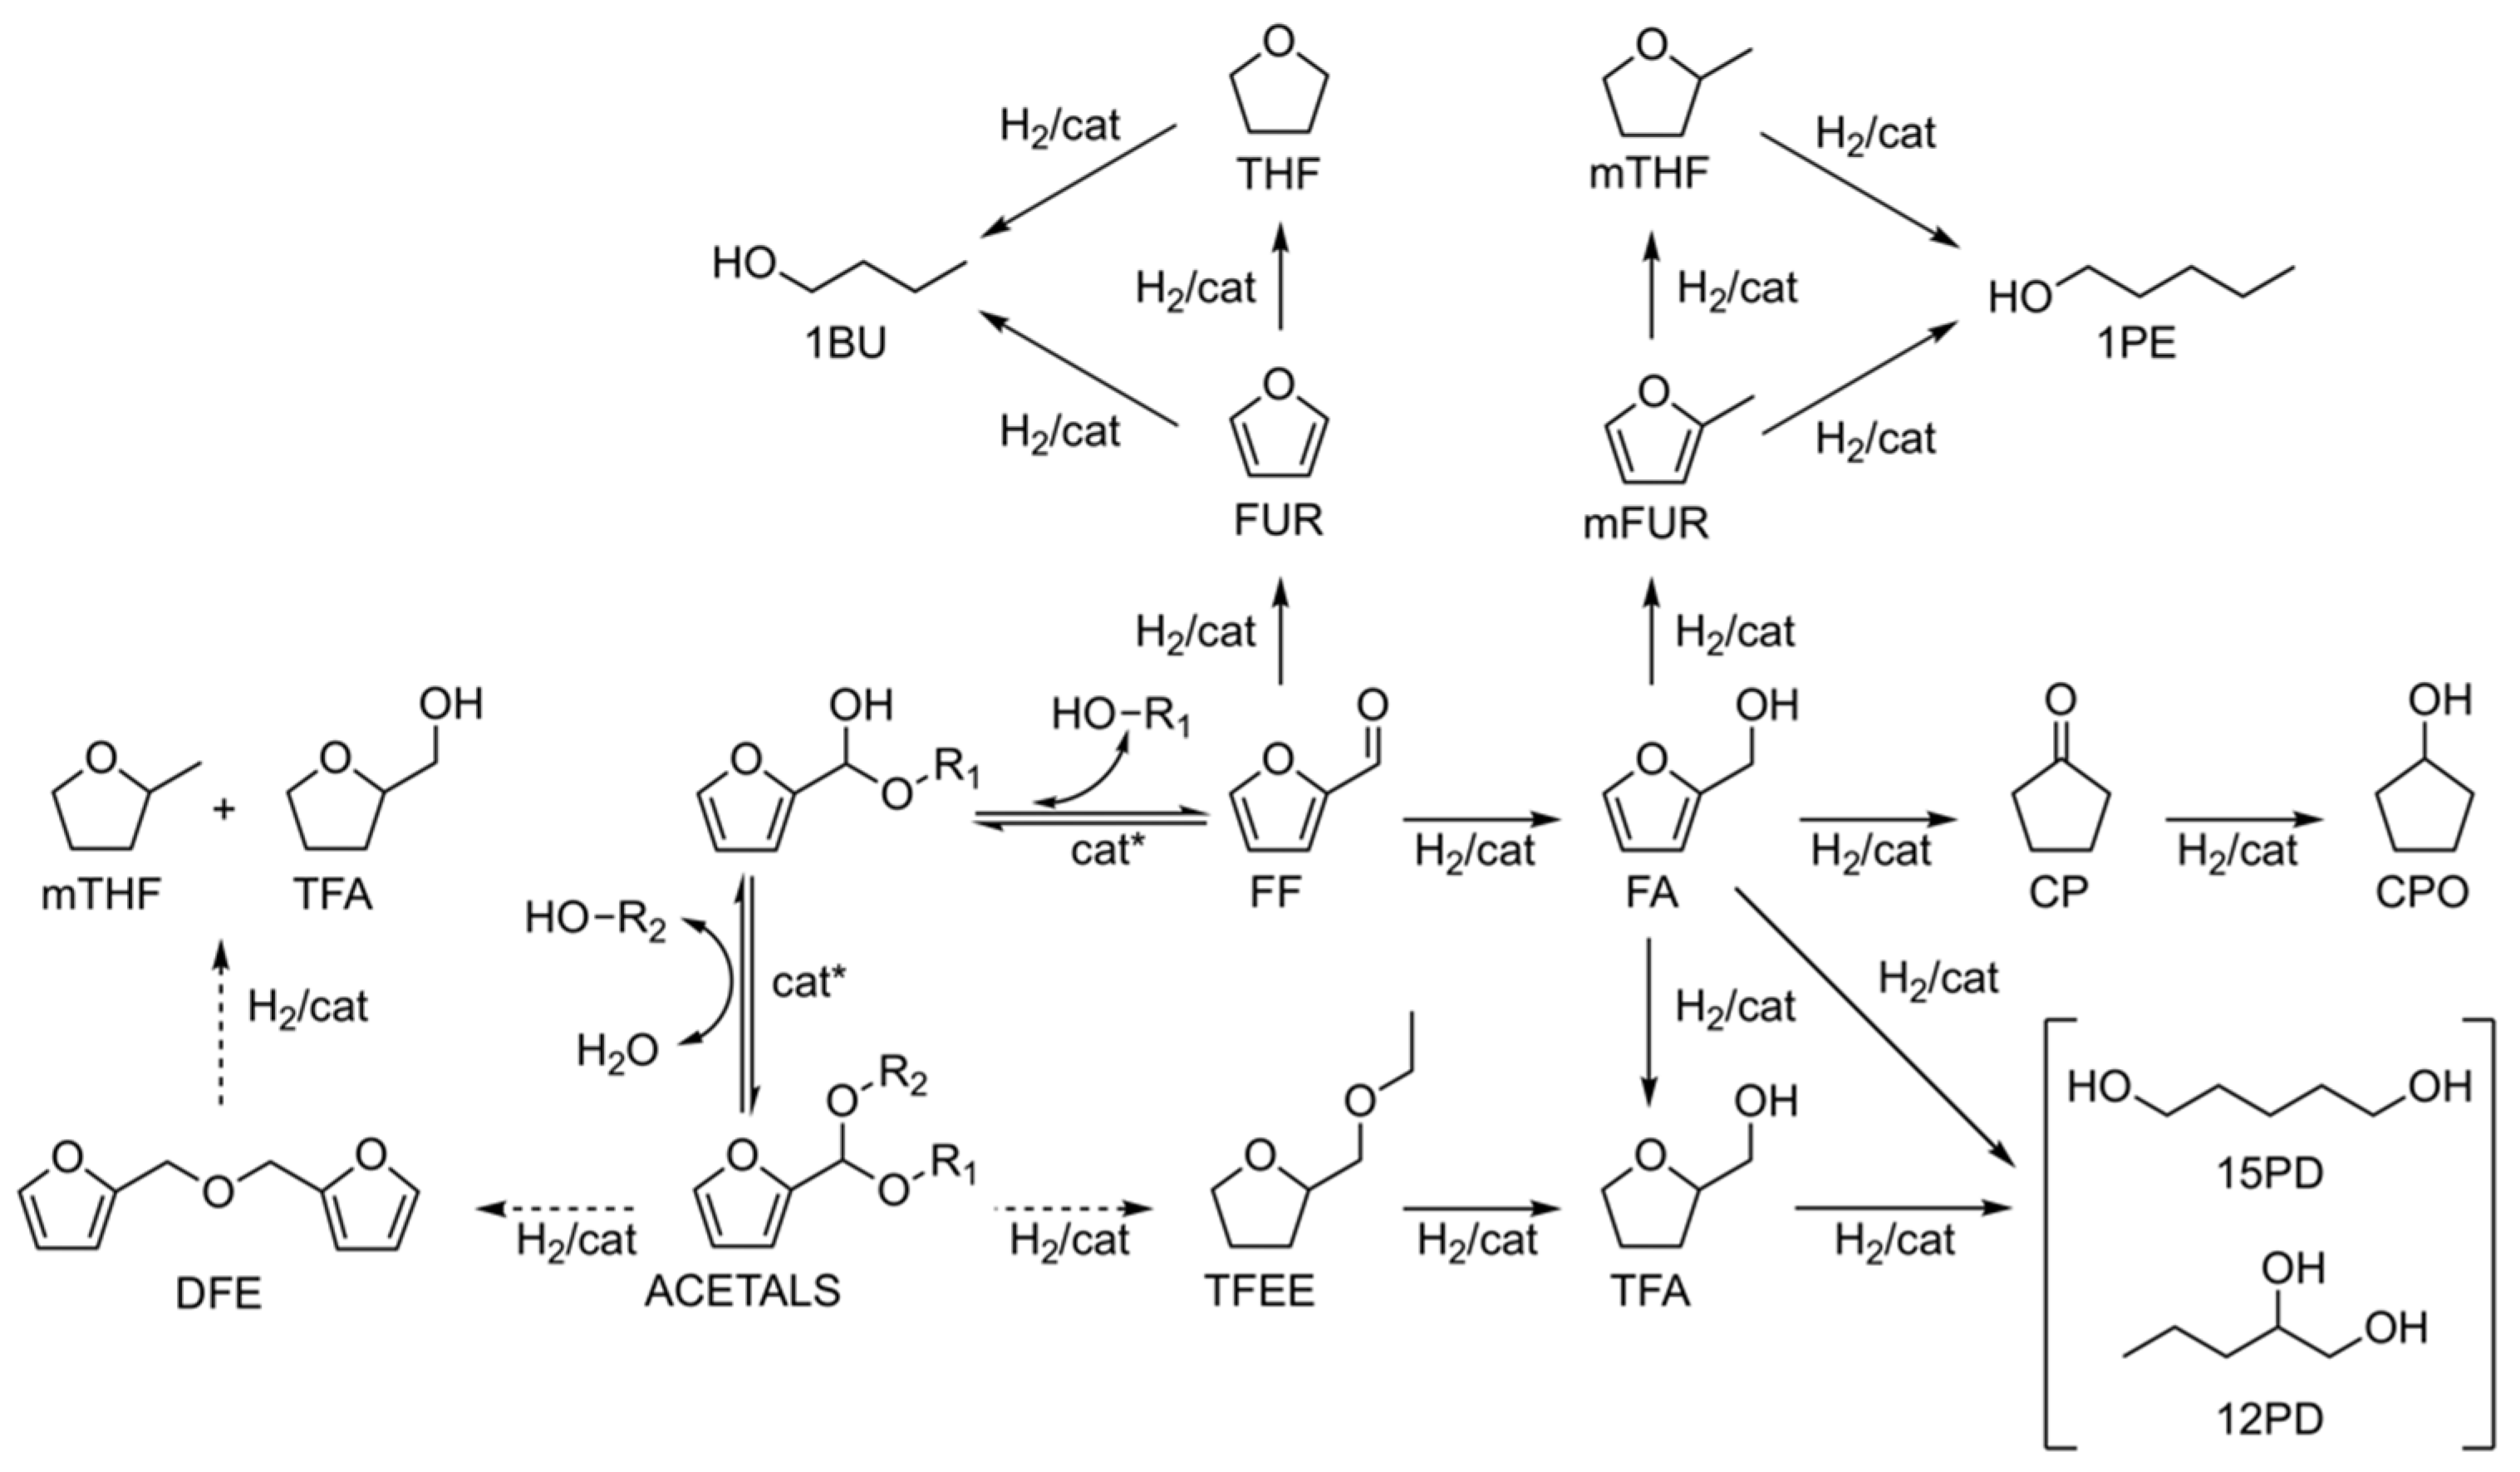
Tetrahydrofurfuryl alcohol (TFA) was the main product obtained on Ni1Cu1Al1-R, with a selectivity of 63%, together with furfuryl alcohol (FA 9.2%), furan (FUR 5.3%), 2-methylfuran (mFUR 4.3%), 2-methyltetrahydrofuran (mTHF 2.4%) and 1,2-pentanediol (12PD 3.4%). In addition, two products that could not be formed by direct hydrogenation/hydrogenolysis of furfural were present: ethyl tetrahydrofurfuryl ether (TFEE 5.2%) and difurfuryl ether (DFE 3.0%). Shifting to a higher copper content (Ni0.5Cu1.5Al1-R) reduced the formation of TFA to 32% and enhanced the selectivity to FA (22%), FUR (14%), mFUR (12%), 12PD (4.3%) and mTHF (3.3%). However, on Ni1.5Cu0.5Al1-R, the selectivity to TFA declined (56%), while that of FA increased (24%), and the formation of FUR, mFUR, 12PD and mTHF was lower than that on Ni1Cu1Al1-R. Trace amounts of 1-butanol (1BU) and 1,5-pentaneanediol (15PD) and significant amounts of TFEE and DFE were always formed with the Ni/Cu atomic ratio, shifting selectivity towards more TFEE and less DFE. Three competing pathways were involved in the conversion of FF in the SSR (Scheme 1). The first route started with the hydrogenation of the carbonyl group of FF to form FA, followed by the hydrogenation of the alcohol group in FA to form mFUR (which can be further hydrogenated to mTHF) or the direct hydrogenation of the double bonds (π bonds) in FA to form TFA. The second route was the decarbonylation of FF to FUR, which was followed by the hydrogenation of the π bonds in the furan ring of FUR to produce THF or by the ring-opening hydrogenolysis of FUR to form 1BU. TFEE and DFE evolved through the formation of acetals on acidic sites of the catalyst surface by the reversible nucleophilic addition of FF with ethanol or FA and were subsequently converted to TFA and mTHF by hydrogenolysis. Although the intermediate species involved in this pathway, such as ethoxy(furan-2-yl) methanol (EFM), 2-furaldehyde diethyl acetal (FDA) or 2-furaldehyde ethyl furfuryl acetal (FEFA), were not detected in significant amounts, there is ample evidence of this route. For instance, the formation of FDA from FF and ethanol on a Pd/C catalyst under mild hydrogenation conditions was identified as the key intermediate step in the production of furfuryl ethyl ether and tetrahydrofurfuryl ethyl ether [45]. In addition, 2-(diisopropoxymethyl)furan—the analog of FDA resulting from acetylation of FF with 2-propanol—was formed during the hydrogenation of FF on CuFeAl catalysts [46] and the catalytic transfer hydrogenation of FF with 2-propanol on NiO [47], NiO-Al2O3 and ZnAl2O4-Al2O3 [48] and Pd-exchanged β-zeolite catalysts [49].
Furfural hydrogenation was studied in the PBR with a time-on-stream of 4 h. The activity of the catalysts was stable (Figure S1), and after 4 h, conversion in the PBR was 91%, 98% and 99% for Ni0.5Cu1.5Al1-R, Ni1Cu1Al1-R and Ni1.5Cu0.5Al1-R, respectively. On the Ni1Cu1Al1-R catalyst, FA was the main product, with a selectivity of 61%, followed by FUR (11%) and lower amounts of TFA (2.3%), THF (2.1%), mFUR (1.5%), 1BU (1.6%) and mTHF (0.5%). In addition, selectivity to DFE was 2.2%, but TFEE was not formed. Pentanediols were not detected among the reaction products, but trace amounts of 1PE together with cyclopentanone (CP) and cyclopentanol (CPO) were produced by the rearrangement of FA. When the Ni/Cu ratio was lower (Ni0.5Cu1.5Al1-R), the selectivity of FA decreased to 57%, and that of mFUR rose to 6.9%. The other products were not affected substantially, except for TFEE, which was formed on this catalyst. On the other hand, when the Ni/Cu ratio was increased (Ni1.5Cu0.5Al1-R), selectivity to FA decreased to 57%, but then 1BU (11%) was the main secondary product. FUR was lower (7.4%), and TFEE was not formed. The selectivity to DFE was lower than in the SSR, and it tended to decrease with the Ni/Cu atomic ratio in the catalyst. Overall, nickel favored the paths leading to FUR and 1BU, whereas Cu favored the hydrogenation of the alcohol group in FA to mFUR and did not promote the ring-opening hydrogenolysis of FUR or mFUR to linear alcohols. The three catalysts presented little activity on the hydrogenation of the π bonds of the furan ring, at least in the short contact time of these experiments, which explains the low yields of TFA, THF and mTHF.
Hydrogen availability was different between the two reactor systems, and this could influence selectivity. The effective hydrogen-to-furfural molar ratio in the liquid phase of the SSR was low because of the low solubility of hydrogen in ethanol, even with a high operation pressure and optimized stirring to avoid mass transfer limitations. An estimation of the equilibrium composition of the liquid and gas phases at the beginning of the reaction in the SSR was obtained with ASPEN Plus using the Peng–Robinson equation of state. The model was first validated by comparing equilibrium calculations of ethanol–hydrogen mixtures at saturation at high pressure and temperature with published data [50]. The equilibrium molar concentrations of hydrogen, furfural and ethanol in the liquid at 5.0 MPa and 463 K were 0.190, 0.419 and 11.3 mol L−1, respectively. This means that in the SSR, the initial molar ratio between hydrogen and furfural in the bulk of the liquid was ca. 0.45 molH2/molFF at most. In the initial stages of the reaction, FF was converted to FA, which, given the extended contact time (4 h in these experiments), was subsequently transformed to TFA, FUR and several hydrogenolysis products, including 1,2-pentanediol. The low availability of hydrogen and the huge excess of ethanol enabled the nucleophilic addition between FF and ethanol/FA, which led to TFEE and DFE.
Given the feed flowrates of FF solution and hydrogen used in the PBR, the catalyst particles at the beginning of the reactor were exposed to concentrations of hydrogen, furfural and ethanol of 9.35 × 10⁻³, 7.36 × 10⁻⁴ and 2.92 × 10⁻² mol L−1, respectively (an absolute pressure of 0.15 MPa was assumed to compensate for the pressure drop across the packed bed and accessories downstream of the reactor). These conditions corresponded to a molar ratio of 12.7 molH2/molFF. Even with the large excess of hydrogen, the short contact time in the PBR allowed FA to be the main product and reduced its subsequent hydrogenation to TFA and other hydrogenolysis products. However, the large excess of hydrogen probably promoted the conversion of FF and FA to FUR and 1BU on the Ni1.5Cu0.5Al1 catalyst. The higher availability of hydrogen also reduced the occurrence of the addition reactions, thus lowering the selectivity towards TFEE and DFE. The inhibition of this pathway was promoted by a higher Ni/Cu ratio. With further optimization of the reaction conditions, the NixCuyAl1 catalysts could be used not only to produce furfuryl alcohol with high selectivity by the gas-phase hydrogenation of furfural but also to explore the co-production of tetrahydrofurfuryl alcohol and high-value products such as 1,2-pentanediol by liquid-phase hydrogenolysis in slurry or trickle-bed type reactors.
3. Materials and Methods
3.1. Synthesis of the Catalysts
NixCuyAl1 LDHs were prepared by co-precipitation at constant pH. An aqueous solution with Cu(NO3)2·6H2O, Ni(NO3)2·6H2O and Al(NO3)3·9H2O, adjusted to a total concentration of 0.6 mol L−1, was added dropwise to a 0.3 mol L−1 Na2CO3 solution in a flat-bottom flask under vigorous stirring at room temperature. A pH sensor was placed in the solution to maintain a constant pH of 10 by the dropwise addition of 1.0 mol L−1 NaOH. Upon completion, the mixture was heated to 333 K, and it was aged under vigorous stirring for 48 h. The solid was then filtered and washed with distilled water until the wash solution reached a pH of 7. The LDHs were dried at 378 K and calcined in air at 673 K for 4 h to form the mixed oxides. The calcined materials were labeled according to their nominal metal molar composition (NixCuyAl1). The active forms of the catalysts were obtained by reduction of the calcined precursors at 773 K for 1 h with 40 mL min−1 of pure hydrogen at STP in the high-pressure slurry batch reactor (SSR) and 60 mL min−1 at STP in the continuous packed-bed reactor (PBR). The suffix R in the label represents a reduced catalyst after calcination (NixCuyAl1-R).
3.2. Catalyst Characterization
The chemical composition of the calcined precursors was determined by flame atomic absorption (FAA). Samples of ca. 5.2 mg were added to 10 mL of 69 wt.% nitric acid and digested in an ultrasonic shaker bath for 5 min. The digested solution was diluted with deionized water and analyzed in a PinAAcle 900 flame atomic adsorption spectrometer (Perkin Elmer, Waltham, MA, USA). The surface composition of the calcined precursors was determined by field-emission scanning electron microscopy with energy-dispersive X-ray spectroscopy (FESEM-EDX) in a Scios 2 Dual Beam (ThermoFisher, Waltham, MA, USA) at 5 kV with a resolution of 512 by 340 pixels and a pixel size of 0.01 µm. Surface composition was also analyzed by X-ray photoelectron spectroscopy (XPS) in VG ESCALAB 250Xi (ThermoFisher) under Mono Al Ka (hv = 1486.6 eV) X-ray source, and the binding energies were corrected using C (1s) at 284.6 eV.
The structures of the mixed oxides and the reduced catalysts were assessed by XRD on a Siemens/Bruker (Madison, WI, USA) D5000 diffractometer (Bragg–Brentano parafocusing geometry and vertical θ-θ goniometer) fitted with a curved graphite diffracted-beam monochromator, incident and diffracted-beam Soller slits, a 0.06° receiving slit and a scintillation counter as a detector. The angular 2θ diffraction range was between 5 and 80°. The data were collected with an angular step of 0.05° at 3 s per step and sample rotation. CuKα radiation was obtained from a copper X-ray tube operated at 40 kV and 30 mA. Diffraction data related to the oxides and metals were extracted from the Dffrac.Eva database (Bruker).
The textural properties of the mixed oxides were determined from nitrogen adsorption–desorption isotherms at 77 K with a Quadrasorb SI Model 4.0 (Quantachrome Instruments, Boynton Beach, FL, USA). Samples of the calcined precursors were outgassed at 423 K for 12 h under vacuum (6 mTorr) to eliminate chemisorbed volatiles before the adsorption isotherm was measured. Surface areas were calculated using the BET method, while the pore size distribution was calculated from the desorption wing of the isotherm according to the DFT method.
Temperature-programmed reduction (TPR) of the calcined oxides was conducted on an AC2920 apparatus (Quantachrome Instruments) equipped with a TCD detector. Samples of ca. 100 mg of calcined oxides were treated at 473 K for 2 h under a constant flow of 20 mL min−1 of He (Airgas, Madrid, Spain UHP) to remove pre-adsorbed species. The samples were then cooled to 323 K and then heated to 1073 K at 5 K min−1 under 20 mL min−1 of 10% H2 in Ar.
3.3. Catalyst Testing
All catalysts were tested in gas-phase and liquid-phase conditions. A packed-bed reactor operating at atmospheric pressure was used in the gas-phase experiments [51]. The reactor was loaded with 500 mg of calcined oxides sieved to 100–200 μm, which were reduced in situ under 60 mL min−1 of H2 (STP) at 773 K for 1 h. After the catalyst was reduced, the bed temperature was lowered to 463 K, and the activity of the catalyst was measured at that temperature for at least 4 h. Constant flow rates of 80 mL min−1 of H2 (STP) and 0.6 mL min−1 of a solution of 0.05 g g−1 of furfural in ethanol were used, equivalent to a WHSV of 2.85 gFF gcat−1 h−1. During the experiment, samples of the reaction products were collected every hour in vials placed in a cold trap at 268 K installed at the exit of the reactor. The samples were stored in a freezer and analyzed later by gas chromatography (GC), as described below.
Liquid-phase hydrogenation was investigated on a high-pressure slurry batch reactor (100 mL Mini Reactor, Autoclave Engineers). Experiments were conducted with 30 mL of a 0.05 g g−1 solution of furfural in ethanol at a constant hydrogen pressure of 5.0 MPa with 200 mg of catalyst sieved to 100–200 μm, which yielded a furfural-to-catalyst mass ratio of 7.44 g/g. A stirrer velocity of 1000 rpm minimized mass transfer resistances. Prior to a reaction test, the required amount of catalyst was reduced at 773 K for 1 h in a tubular reactor under a flow of H2 (40 mL min−1 STP) and then cooled to room temperature under H2 (10 mL min−1 STP). Once cold, the tube was isolated by means of two ball valves to prevent the contact of the catalyst with air and detached from the setup. The catalyst was then discharged directly into the furfural solution in the batch reactor, preventing contact with air as much as possible; the reactor was sealed and cold-pressurized to 5.0 MPa with H2 and then heated. After the scheduled reaction time, the vessel was cooled to room temperature, depressurized and opened. The content of the reactor was filtered to recover the catalyst, which was then washed with ethanol, air-dried and stored for further testing. A sample of the liquid was collected in a sealed vial and stored in a freezer until analyzed by GC. The performance of the catalysts was determined based on the fractional conversion of furfural (XFF) and the molar selectivity (Sj) of the products (Equations (1) and (2)). NFF,0 and NFF are the initial and the final number of moles of furfural in the batch reactor, Nj is the number of moles of product j formed, and vj is the stoichiometric number of moles of furfural required to form a molecule of j. In the tubular reactor, NFF,0, NFF and Nj denote molar flows.
The products were identified by GC-MS (Shimadzu, Kyoto, Japan GCMS-QP2010) with a TRB-5 column (Teknokroma, Barcelona, Spain TR-120232; length: 30.0 m, film thickness: 0.25 μm; inner diameter: 0.25 mm). Analysis was conducted using a 3-stage temperature program (5 min at 323 K, heating to 503 K at 5 K min−1 followed by 10 min at the latter temperature) with He as a carrier gas (47 mL min−1). Sample injection was 1.0 μm, and the split ratio was 300. The retention time and mass spectra of the detected products were compared with those of pure standards, when available, to confirm the assignments. Routine quantification of the reaction products was conducted by GC-FID (Shimadzu GC-2010) using the same column and analysis conditions after calibration with standard solutions. Calibration standards were prepared with commercial samples dissolved in ethanol. Furfural (FF, 99%), furfuryl alcohol (FA, 98%), tetrahydrofuran (THF, 99.9%), 1,5-pentanediol (15PD, 97%), 1,2-pentanediol (12PD, 96%), 1-pentanol (1PE, 99%), furan (FUR, 99%), 1-butanol (1BU, 99.8%), cyclopentanone (CP, >99%) and cyclopentanol (CPO, 99%) were purchased from Sigma Aldrich. Tetrahydrofurfuryl alcohol (TFA, 98%), 2-methylfuran (mFUR, 99%) and 2-methyltetrahydrofuran (mTHF, 99.9%) were acquired from Acros Organics. All chemicals were used as received without any further treatment. Response factors in the FID detector of the compounds that were not commercially available were estimated based on their structures [52,53]. In all cases, the samples were filtered with a nylon filter (Nylon 25 mm, 0.22 μm, Sharlab) before injection.
4. Conclusions
NiCuAl catalysts derived from layered double hydroxides showed high activity in the hydrogenation and hydrogenolysis of furfural, both in the gas phase at atmospheric pressure and in the liquid phase in a slurry batch reactor. Furfural was converted through three competing paths: decarbonylation to furan, hydrogenation to furfuryl alcohol and nucleophilic addition with alcohols (ethanol, the solvent, and furfuryl alcohol) to form acetals, which were subsequently converted to DFE and TFEE. These primary products were further converted by saturation of the furan ring and/or ring-opening to alcohols. In all cases, sequential hydrogenation to furfuryl alcohol and tetrahydrofurfuryl alcohol was the main route, but the selectivity was influenced by the Ni/Cu ratio of the catalysts and by different hydrogen availabilities in the two reactors.
Supplementary Materials
The following supporting information can be downloaded at: https://0-www-mdpi-com.brum.beds.ac.uk/article/10.3390/catal12040390/s1, Table S1: Selectivity and conversion during furfural hydrogenation in the pressurized SSR and atmospheric PBR reactors. Figure S1: SEM imaging of the calcined materials (20,000× magnification): Ni1.5Cu0.5Al1 (top), Ni1Cu1Al1 (center) and Ni0.5Cu1.5Al1 (bottom); Figure S2: Surface composition of LDH precursors calcined at 673 K for 4 h measured by EFSEM-EDX. Figure S3: Furfural conversion in the atmospheric PBR at 463 K and a WHSV of 2.85 gFF gcat−1 h−1.
Author Contributions
Conceptualization, F.M. and D.M.; methodology, A.A., F.M. and D.M.; validation, A.A.; formal analysis, A.A. and D.M.; investigation, A.A.; writing—original draft preparation, A.A.; writing—review and editing, A.A., D.M. and G.S.P.; visualization, A.A. and D.M.; supervision, G.S.P., D.M. and F.M.; funding acquisition, F.M. All authors have read and agreed to the published version of the manuscript.
Funding
This research was developed within the project RTI2018-098310-B-I00 funded by MCIN/AEI/10.13039/501100011033/FEDER “Una manera de hacer Europa”. A. Aldureid is grateful to the Universitat Rovira i Virgili for his PhD scholarship (2018PMF-PIPF-28).
Data Availability Statement
The data presented in this study are available on request from the corresponding author.
Conflicts of Interest
The authors declare no conflict of interest.
References
- Bozell, J.J.; Petersen, G.R. Technology development for the production of biobased products from biorefinery carbohydrates—The US department of energy’s “Top 10” revisited. Green Chem. 2010, 12, 539–554. [Google Scholar] [CrossRef]
- Wettstein, S.G.; Martin Alonso, D.; Gürbüz, E.I.; Dumesic, J.A. A roadmap for conversion of lignocellulosic biomass to chemicals and fuels. Chem. Eng. 2012, 1, 218–224. [Google Scholar] [CrossRef]
- Mariscal, R.; Maireles-Torres, P.; Ojeda, M.; Sádaba, I.; López, G. Furfural: A renewable and versatile platform molecule for the synthesis of chemicals and fuels. Energy Environ. Sci. 2016, 9, 1144–1189. [Google Scholar] [CrossRef]
- Chen, S.; Wojcieszak, R.; Dumeignil, F.; Marceau, E.; Royer, S. How catalysts and experimental conditions determine the selective hydroconversion of furfural and 5-hydroxymethylfurfural. Chem. Rev. 2018, 118, 11023–11117. [Google Scholar] [CrossRef] [PubMed] [Green Version]
- Hoydonckx, H.E.; Van Rhijn, W.M.; Van Rhijn, W.; De Vos, D.E.; Jacobs, P.A. Furfural and derivatives. In Ullmann’s Encyclopedia of Industrial Chemistry; Wiley-VCH Verlag GmbH & Co. KGaA: Weinheim, Germany, 2012; Volume 16, pp. 285–313. [Google Scholar] [CrossRef]
- Serrano-Ruiz, J.C.; Luque, R.; Sepulveda-Escribano, A. Transformations of biomass-derived platform molecules: From high added-value chemicals to fuels via aqueous-phase processing. Chem. Soc. Rev. 2011, 40, 5266–5281. [Google Scholar] [CrossRef] [PubMed]
- Lange, J.-P.; van der Heide, E.; van Buijtenen, J.; Price, R. Furfural—A promising platform for lignocellulosic biofuels. ChemSusChem 2012, 5, 150–166. [Google Scholar] [CrossRef] [PubMed]
- Climent, M.J.; Corma, A.; Iborra, S. Conversion of biomass platform molecules into fuel additives and liquid hydrocarbon fuels. Green Chem. 2014, 16, 516–547. [Google Scholar] [CrossRef] [Green Version]
- Jiang, Y.; Wang, X.; Cao, Q.; Dong, L.; Guan, J.; Mu, X. Chemical conversion of biomass to green chemicals. In Sustainable Production of Bulk Chemicals; Xian, M., Ed.; Springer: Dordrecht, The Netherlands, 2016. [Google Scholar] [CrossRef]
- Sitthisa, S.; Pham, T.; Prasomsri, T.; Sooknoi, T.; Mallinson, R.G.; Resasco, D.E. Conversion of furfural and 2-methylpentanal on Pd/SiO2 and Pd−Cu/SiO2 catalysts. J. Catal. 2011, 280, 17–27. [Google Scholar] [CrossRef]
- Shi, Y.; Zhu, Y.; Yang, Y.; Li, Y.-W.; Jiao, H. Exploring furfural catalytic conversion on Cu(111) from computation. ACS Catal. 2015, 5, 4020–4032. [Google Scholar] [CrossRef]
- Medlin, J.W. Understanding and controlling reactivity of unsaturated oxygenates and polyols on metal catalysts. ACS Catal. 2011, 1, 1284–1297. [Google Scholar] [CrossRef]
- Ni, Z.-M.; Xia, M.-Y.; Shi, W.; Qian, P.-P. Adsorption and decarbonylation reaction of furfural on Pt (111) surface. Acta Phys.-Chim. Sin. 2013, 29, 1916–1922. [Google Scholar] [CrossRef]
- Liu, B.; Cheng, L.; Curtiss, L.; Greeley, J. Effects of van der waals density functional corrections on trends in furfural adsorption and hydrogenation on close-packed transition metal surfaces. Surf. Sci. 2014, 622, 51–59. [Google Scholar] [CrossRef] [Green Version]
- Xiong, K.; Wan, W.; Chen, J.G. Reaction pathways of furfural, furfuryl alcohol and 2-methylfuran on Cu(111) and NiCu bimetallic surfaces. Surf. Sci. 2016, 652, 91–97. [Google Scholar] [CrossRef] [Green Version]
- Bradley, M.K.; Robinson, J.; Woodruff, D.P. The structure and bonding of furan on Pd(111). Surf. Sci. 2010, 604, 920–925. [Google Scholar] [CrossRef] [Green Version]
- Jenness, G.R.; Vlachos, D.G. DFT study of the conversion of furfuryl alcohol to 2-methylfuran on RuO2 (110). J. Phys. Chem. C 2015, 119, 5938–5945. [Google Scholar] [CrossRef]
- Sitthisa, S.; Resasco, D.E. Hydrodeoxygenation of furfural over supported metal catalysts: A comparative study of Cu, Pd and Ni. Catal. Lett. 2011, 141, 784–791. [Google Scholar] [CrossRef]
- Zhang, W.; Zhu, Y.; Niu, S.; Li, Y. A study of furfural decarbonylation on K-doped Pd/Al2O3 catalysts. J. Mol. Catal. A: Chem. 2011, 335, 71–81. [Google Scholar] [CrossRef]
- Fu, X.; Ren, X.; Shen, J.; Jiang, Y.; Wang, Y.; Orooji, Y.; Xu, W.; Liang, J. Synergistic catalytic hydrogenation of furfural to 1,2-pentanediol and 1,5-pentanediol with LDO derived from CuMgAl hydrotalcite. Mol. Catal. 2021, 499, 111298. [Google Scholar] [CrossRef]
- Gavilà, L.; Lähde, A.; Jokiniemi, J.; Constanti, M.; Medina, F.; Del Río, E.; Tichit, D.; Álvarez, M.G. Insights on the one-pot formation of 1,5-pentanediol from furfural with Co-Al spinel-based nanoparticles as an alternative to noble metal catalysts. ChemCatChem 2019, 11, 4944–4953. [Google Scholar] [CrossRef]
- Bertolini, G.R.; Jiménez-Gómez, C.P.; Cecilia, J.A.; Maireles-Torres, P. Gas-phase hydrogenation of furfural to furfuryl alcohol over Cu-ZnO-Al2O3 catalysts prepared from layered double hydroxides. Catalysts 2020, 10, 486. [Google Scholar] [CrossRef]
- Herbois, R.; Noël, S.; Léger, B.; Bai, L.; Roucoux, A.; Monflier, E.; Ponchel, A. Cyclodextrins as growth controlling agents for enhancing the catalytic activity of PVP-stabilized Ru(0) nanoparticles. Chem. Commun. 2012, 48, 3451–3453. [Google Scholar] [CrossRef]
- Wang, Y.; Zhou, M.; Wang, T.; Xiao, G. Conversion of furfural to cyclopentanol on Cu/Zn/Al catalysts derived from hydrotalcite-like materials. Catal. Lett. 2015, 145, 1557–1565. [Google Scholar] [CrossRef]
- Zhou, M.; Zeng, Z.; Zhu, H.; Xiao, G.; Xiao, R. Aqueous-phase catalytic hydrogenation of furfural to cyclopentanol over Cu-Mg-Al hydrotalcites derived catalysts: Model reaction for upgrading bio-oil. J. Energy Chem. 2014, 23, 91–96. [Google Scholar] [CrossRef]
- Guo, J.; Xu, G.; Han, A.; Zhang, Y.; Fu, Y.; Guo, Q. Selective conversion of furfural to cyclopentanone with CuZnAl catalysts. ACS Sustain. Chem. Eng. 2014, 2, 2259–2266. [Google Scholar] [CrossRef]
- Zhu, H.; Zhou, M.; Zeng, Z.; Xiao, G.; Xiao, R. Selective hydrogenation of furfural to cyclopentanone over Cu-Ni-Al hydrotalcite-based catalysts. Korean J. Chem. Eng. 2014, 31, 593–597. [Google Scholar] [CrossRef]
- Yao, S.; Wang, X.; Jiang, Y.; Wu, F.; Chen, X.; Mu, X. One-step conversion of biomass-derived 5-hydroxymethylfurfural to 1,2,6-hexanetriol over Ni−Co−Al mixed oxide catalysts under mild conditions. ACS Sustain. Chem. Eng. 2014, 2, 173–180. [Google Scholar] [CrossRef]
- Kong, X.; Zheng, R.; Zhu, Y.; Ding, G.; Zhu, Y.; Lia, Y.-W. Rational design of Ni-based catalysts derived from hydrotalcite for selective hydrogenation of 5-hydroxymethylfurfural. Green Chem. 2015, 17, 2504–2514. [Google Scholar] [CrossRef]
- Thommes, M.; Kaneko, K.; Neimark, A.V.; Olivier, J.P.; Rodriguez-Reinoso, F.; Rouquerol, J.; Sing, K.S.W. Physisorption of gases, with special reference to the evaluation of surface area and pore size distribution (IUPAC Technical Report). Pure Appl. Chem. 2015, 87, 1051–1069. [Google Scholar] [CrossRef] [Green Version]
- Bardestani, R.; Patience, G.S.; Kaliaguine, S. Experimental methods in chemical engineering: Specific surface area and pore size distribution measurements—BET, BJH, and DFT. Can. J. Chem. Eng. 2019, 97, 2781–2791. [Google Scholar] [CrossRef]
- Yi, Y.; Liu, H.; Chu, B.; Qin, Z.; Donga, L.; He, H.; Tang, C.; Fan, M.; Bin, L. Catalytic removal NO by CO over LaNi0.5M0.5O3 (M=Co, Mn, Cu) perovskite oxide catalysts: Tune surface chemical composition to improve N2 selectivity. Chem. Eng. J. 2019, 369, 511–521. [Google Scholar] [CrossRef]
- McIntyre, N.S.; Cook, M.G. X-ray photoelectron studies on some oxides and hydroxides of cobalt, nickel, and copper. Anal. Chem. 1975, 47, 2208–2213. [Google Scholar] [CrossRef]
- Moulder, J.F.; Stickle, W.F.; Sobol, P.E.; Bomben, K.D. Handbook of X-ray Photoelectron Spectroscopy: A Reference Book of Standard Spectra for Identification and Interpretation of XPS Data; Physical Electronics Division, Perkin-Elmer Corporation: Eden Prairie, MN, USA, 1992; ISBN 096481241X. [Google Scholar]
- Zhidkov, I.S.; Belik, A.A.; Kukharenko, A.I.; Cholakh, S.O.; Taran, L.S.; Fujimori, A.; Streltsov, S.V.; Kurmaev, E.Z. Cu-Site Disorder in CuAl2O4 as studied by XPS spectroscopy. JETP Lett. 2021, 114, 556–560. [Google Scholar] [CrossRef]
- Monaco, L.; Sodhi, R.N.S.; Palumbo, G.; Erb, U. XPS study on the passivity of coarse-grained polycrystalline and electrodeposited nanocrystalline nickel-iron (NiFe) alloys. Corros. Sci. 2020, 176, 108902. [Google Scholar] [CrossRef]
- Li, D.; Wang, L.; Koike, M.; Nakagawa, Y.; Tomishige, K. Steam reforming of tar from pyrolysis of biomass over Ni/Mg/Al catalysts prepared from hydrotalcite-like precursors. Appl. Catal. B Environ. 2011, 102, 528–538. [Google Scholar] [CrossRef]
- Yu, X.; Zhang, F.; Chu, W. Effect of a second metal (Co, Cu, Mn or Zr) on nickel catalysts derived from hydrotalcites for the carbon dioxide reforming of methane. RSC Adv. 2016, 6, 70537. [Google Scholar] [CrossRef]
- Gao, P.; Li, F.; Zhan, H.; Zhao, N.; Xiao, F.; Wei, W.; Zhong, L.; Wang, H.; Sun, Y. Influence of Zr on the performance of Cu/Zn/Al/Zr catalysts via hydrotalcite-like precursors for CO2 hydrogenation to methanol. J. Catal. 2013, 298, 51–60. [Google Scholar] [CrossRef]
- Liu, C.; Guo, X.; Guo, Q.; Mao, D.; Yu, J.; Lu, G. Methanol synthesis from CO2 hydrogenation over copper catalysts supported on MgO-modified TiO2. J. Mol. Catal. A Chem. 2016, 425, 86–93. [Google Scholar] [CrossRef]
- Abelló, S.; Verboekend, D.; Bridier, B.; Pérez-Ramírez, J. Activated takovite catalysts for partial hydrogenation of ethyne, propyne, and propadiene. J. Catal. 2008, 259, 85–95. [Google Scholar] [CrossRef]
- Puxley, D.C.; Kitchener, I.J.; Komodromos, D.; Parkyns, N.D. The effect of preparation method upon the structures, stability and metal/support interactions in nickel/alumina catalysts. In Studies in Surface Science and Catalysis; Poncelet, G., Grange, P., Jacobs, P.A., Eds.; Elsevier: Amsterdam, The Netherlands, 1983; Volume 16, pp. 237–271. [Google Scholar] [CrossRef]
- Clause, O.; Coelho, M.G.; Gazzano, M.; Matteuzzi, D.; Trifirò, F.; Vaccari, A. Synthesis and thermal reactivity of nickel-containing anionic clays. Appl. Clay Sci. 1993, 8, 169–186. [Google Scholar] [CrossRef]
- Abelló, S.; Berrueco, C.; Gispert-Guirado, F.; Montané, D. Synthetic natural gas by direct CO2 hydrogenation on activated takovites: Effect of Ni/Al molar ratio. Catal. Sci. Technol. 2016, 6, 2305–2317. [Google Scholar] [CrossRef]
- Wang, Y.; Cui, Q.; Guan, Y.; Wu, P. Facile synthesis of furfuryl ethyl ether in high yield via the reductive etherification of furfural in ethanol over Pd/C under mild conditions. Green Chem. 2018, 20, 2110–2117. [Google Scholar] [CrossRef]
- Selishcheva, S.A.; Smirnov, A.A.; Fedorov, A.V.; Bulavchenko, O.A.; Saraev, A.A.; Lebedev, M.Y.; Yakovlev, V.A. Highly active CuFeAl-containing catalysts for selective hydrogenation of furfural to furfuryl alcohol. Catalysts 2019, 9, 816. [Google Scholar] [CrossRef] [Green Version]
- He, J.; Nielsen, M.R.; Hansen, T.W.; Yang, S.; Riisager, A. Hierarchically constructed NiO with improved performance for catalytic transfer hydrogenation of biomass-derived aldehydes. Catal. Sci. Technol. 2019, 9, 1289–1300. [Google Scholar] [CrossRef] [Green Version]
- Ramos, R.; Peixoto, A.F.; Arias-Serrano, B.I.; Soares, O.S.G.; Pereira, M.F.; Kubička, D.; Freire, C. Catalytic transfer hydrogenation of furfural over Co3O4-Al2O3 hydrotalcite-derived catalyst. ChemCatChem 2020, 12, 1467–1475. [Google Scholar] [CrossRef]
- Jorge, E.Y.; Lima, T.D.M.; Lima, C.G.; Marchini, L.; Castelblanco, W.N.; Rivera, D.G.; Urquieta-Gonzalez, E.A.; Varma, R.S.; Paixão, M.W. Metal-exchanged magnetic β-zeolites: Valorization of lignocellulosic biomass-derived compounds to platform chemicals. Green Chem. 2017, 19, 3856–3868. [Google Scholar] [CrossRef]
- d′Angelo, J.V.H.; Francesconi, A.Z. Gas-liquid solubility of hydrogen in n-alcohols (1 ≤ n ≤ 4) at pressures from 3.6 MPa to 10 MPa and temperatures from 298.15 K to 525.15 K. J. Chem. Eng. Data 2001, 46, 671–674. [Google Scholar] [CrossRef]
- Abelló, S.; Bolshak, E.; Montané, D. Ni-Fe catalysts derived from hydrotalcite-like precursors for hydrogen production by ethanol steam reforming. Appl. Catal. A Gen. 2013, 450, 261–274. [Google Scholar] [CrossRef]
- Jorgensen, A.D.; Picel, K.C.; Stamoudis, V.C. Prediction of gas chromatography flame ionization detector response factors from molecular structures. Anal. Chem. 1990, 62, 683–689. [Google Scholar] [CrossRef]
- De Saint Laumer, J.-Y.; Leocata, S.; Tissot, E.; Baroux, L.; Kampf, D.M.; Merle, P.; Boschung, A.; Seyfried, M.; Chaintreau, A. Prediction of response factors for gas chromatography with flame ionization detection: Algorithm improvement, extension to silylated compounds, and application to the quantification of metabolites. J. Sep. Sci. 2015, 38, 3209–3217. [Google Scholar] [CrossRef]
Figure 1.
N2 physisorption isotherms of LDH precursors calcined at 673 K for 4 h. Black line is the adsorption branch and the red line is the desorption branch of the isotherm.
Figure 1.
N2 physisorption isotherms of LDH precursors calcined at 673 K for 4 h. Black line is the adsorption branch and the red line is the desorption branch of the isotherm.

Figure 2.
Pore volume (left) and surface (right) distributions of LDHs calcined at 673 K for 4 h, determined with the DFT model.
Figure 2.
Pore volume (left) and surface (right) distributions of LDHs calcined at 673 K for 4 h, determined with the DFT model.

Figure 3.
XPS spectra of Ni 2p, Cu 2p and O 1s of LDH precursors calcined at 673 K for 4 h. Black lines correspond to the measured spectra and the red lines are the fit.
Figure 3.
XPS spectra of Ni 2p, Cu 2p and O 1s of LDH precursors calcined at 673 K for 4 h. Black lines correspond to the measured spectra and the red lines are the fit.

Figure 4.
XRD patterns: (a) LDH precursors calcined at 673 K for 4 h; (b) reduced catalysts.

Figure 5.
H2-TPR of LDH precursors calcined at 673 K for 4 h.

Figure 6.
Furfural conversion and product selectivity of the three catalysts in an atmospheric PBR and an SSR at 5.0 MPa H2. All experiments were performed at 463 K.
Figure 6.
Furfural conversion and product selectivity of the three catalysts in an atmospheric PBR and an SSR at 5.0 MPa H2. All experiments were performed at 463 K.

Scheme 1.
Reaction pathways involved in the hydrogenolysis of furfural on NiCuAl catalysts (both HO-R1 and HO-R2 may be either ethanol or FA).
Scheme 1.
Reaction pathways involved in the hydrogenolysis of furfural on NiCuAl catalysts (both HO-R1 and HO-R2 may be either ethanol or FA).


Table 1.
Composition and textural properties of the calcined catalyst precursors.
| Calcined Material | BET Surface Area (m2 g−1) | Pore Volume (mL g−1) | Average Pore Diameter (nm) |
|---|---|---|---|
| Ni1.5Cu0.5Al1 | 201 | 0.53 | 7.0 |
| Ni1Cu1Al1 | 162 | 0.52 | 7.3 |
| Ni0.5Cu1.5Al1 | 127 | 0.48 | 7.4 |
Table 2.
Metal atomic ratios in materials calcined at 673 K for 4 h, measured by FAA, FESEM-EDX and XPS.
Table 2.
Metal atomic ratios in materials calcined at 673 K for 4 h, measured by FAA, FESEM-EDX and XPS.
| FAA | FESEM-EDX | XPS | ||||
|---|---|---|---|---|---|---|
| Calcined Material | Ni/Al (mol/mol) | Cu/Al (mol/mol) | Ni/Al (mol/mol) | Cu/Al (mol/mol) | Ni/Al (mol/mol) | Cu/Al (mol/mol) |
| Ni1.5Cu0.5Al1 | 1.43 | 0.53 | 1.86 | 0.64 | 1.60 | 0.66 |
| Ni1Cu1Al1 | 0.98 | 1.04 | 0.90 | 0.91 | 1.19 | 1.27 |
| Ni0.5Cu1.5Al1 | 0.49 | 1.47 | 0.47 | 1.48 | 0.67 | 1.57 |
Table 3.
XPS analysis of LDHs calcined at 673 K for 4 h: binding energies of the metal oxides.
| Binding Energy (eV) | ||||||||
|---|---|---|---|---|---|---|---|---|
| Calcined Material | Ni 2p (NiO) | Ni 2p SU1 (NiO) | Ni 2p SU2 (NiO) | Cu 2p (Cu2O) | Cu 2p (CuO) | Cu 2p SU1 (CuO) | Cu 2p SU2 (CuO) | Al 2p (Al2O3) |
| Ni1.5Cu0.5Al1 | 856.0; 854.4 | 861.1 | 865.8 | 932.9 | 934.6 | 940.8 | 943.4 | 73.4 |
| Ni1Cu1Al1 | 856.3; 854.6 | 861.1 | 865.8 | 932.7 | 934.4 | 940.7 | 943.3 | 73.4 |
| Ni0.5Cu1.5Al1 | 856.6; 854.9 | 861.3 | 866.0 | 933.1 | 934.6 | 940.8 | 943.3 | 73.7 |
Table 4.
Specific hydrogen consumptions during TPR of calcined LDH samples.
| Peak 1 | Peak 2 | Total | |||
|---|---|---|---|---|---|
| Calcined Material | T (K) | H2 (mL g−1 STP) | T (K) | H2 (mL g−1 STP) | H2 (mL g−1 STP) |
| Ni1.5Cu0.5Al1 | 474 | 37 | 738 | 85 | 121 |
| Ni1Cu1Al1 | 484 | 84 | 714 | 70 | 155 |
| Ni0.5Cu1.5Al1 | 525 | 113 | 757 | 19 | 132 |
Publisher’s Note: MDPI stays neutral with regard to jurisdictional claims in published maps and institutional affiliations. |
© 2022 by the authors. Licensee MDPI, Basel, Switzerland. This article is an open access article distributed under the terms and conditions of the Creative Commons Attribution (CC BY) license (https://creativecommons.org/licenses/by/4.0/).
Share and Cite
MDPI and ACS Style
Aldureid, A.; Medina, F.; Patience, G.S.; Montané, D. Ni-Cu/Al2O3 from Layered Double Hydroxides Hydrogenates Furfural to Alcohols. Catalysts 2022, 12, 390. https://0-doi-org.brum.beds.ac.uk/10.3390/catal12040390
AMA Style
Aldureid A, Medina F, Patience GS, Montané D. Ni-Cu/Al2O3 from Layered Double Hydroxides Hydrogenates Furfural to Alcohols. Catalysts. 2022; 12(4):390. https://0-doi-org.brum.beds.ac.uk/10.3390/catal12040390
Chicago/Turabian StyleAldureid, Abdulaziz, Francisco Medina, Gregory S. Patience, and Daniel Montané. 2022. "Ni-Cu/Al2O3 from Layered Double Hydroxides Hydrogenates Furfural to Alcohols" Catalysts 12, no. 4: 390. https://0-doi-org.brum.beds.ac.uk/10.3390/catal12040390
Note that from the first issue of 2016, this journal uses article numbers instead of page numbers. See further details here.